
COVID-19 Identification from Low-Quality Computed Tomography Using a Modified Enhanced Super-Resolution Generative Adversarial Network Plus and Siamese Capsule Network

 ,
,  ,
,  , , , and
Abstract
:1. Introduction
2. Materials and Methods
2.1. Problem Statement
2.2. Datasets
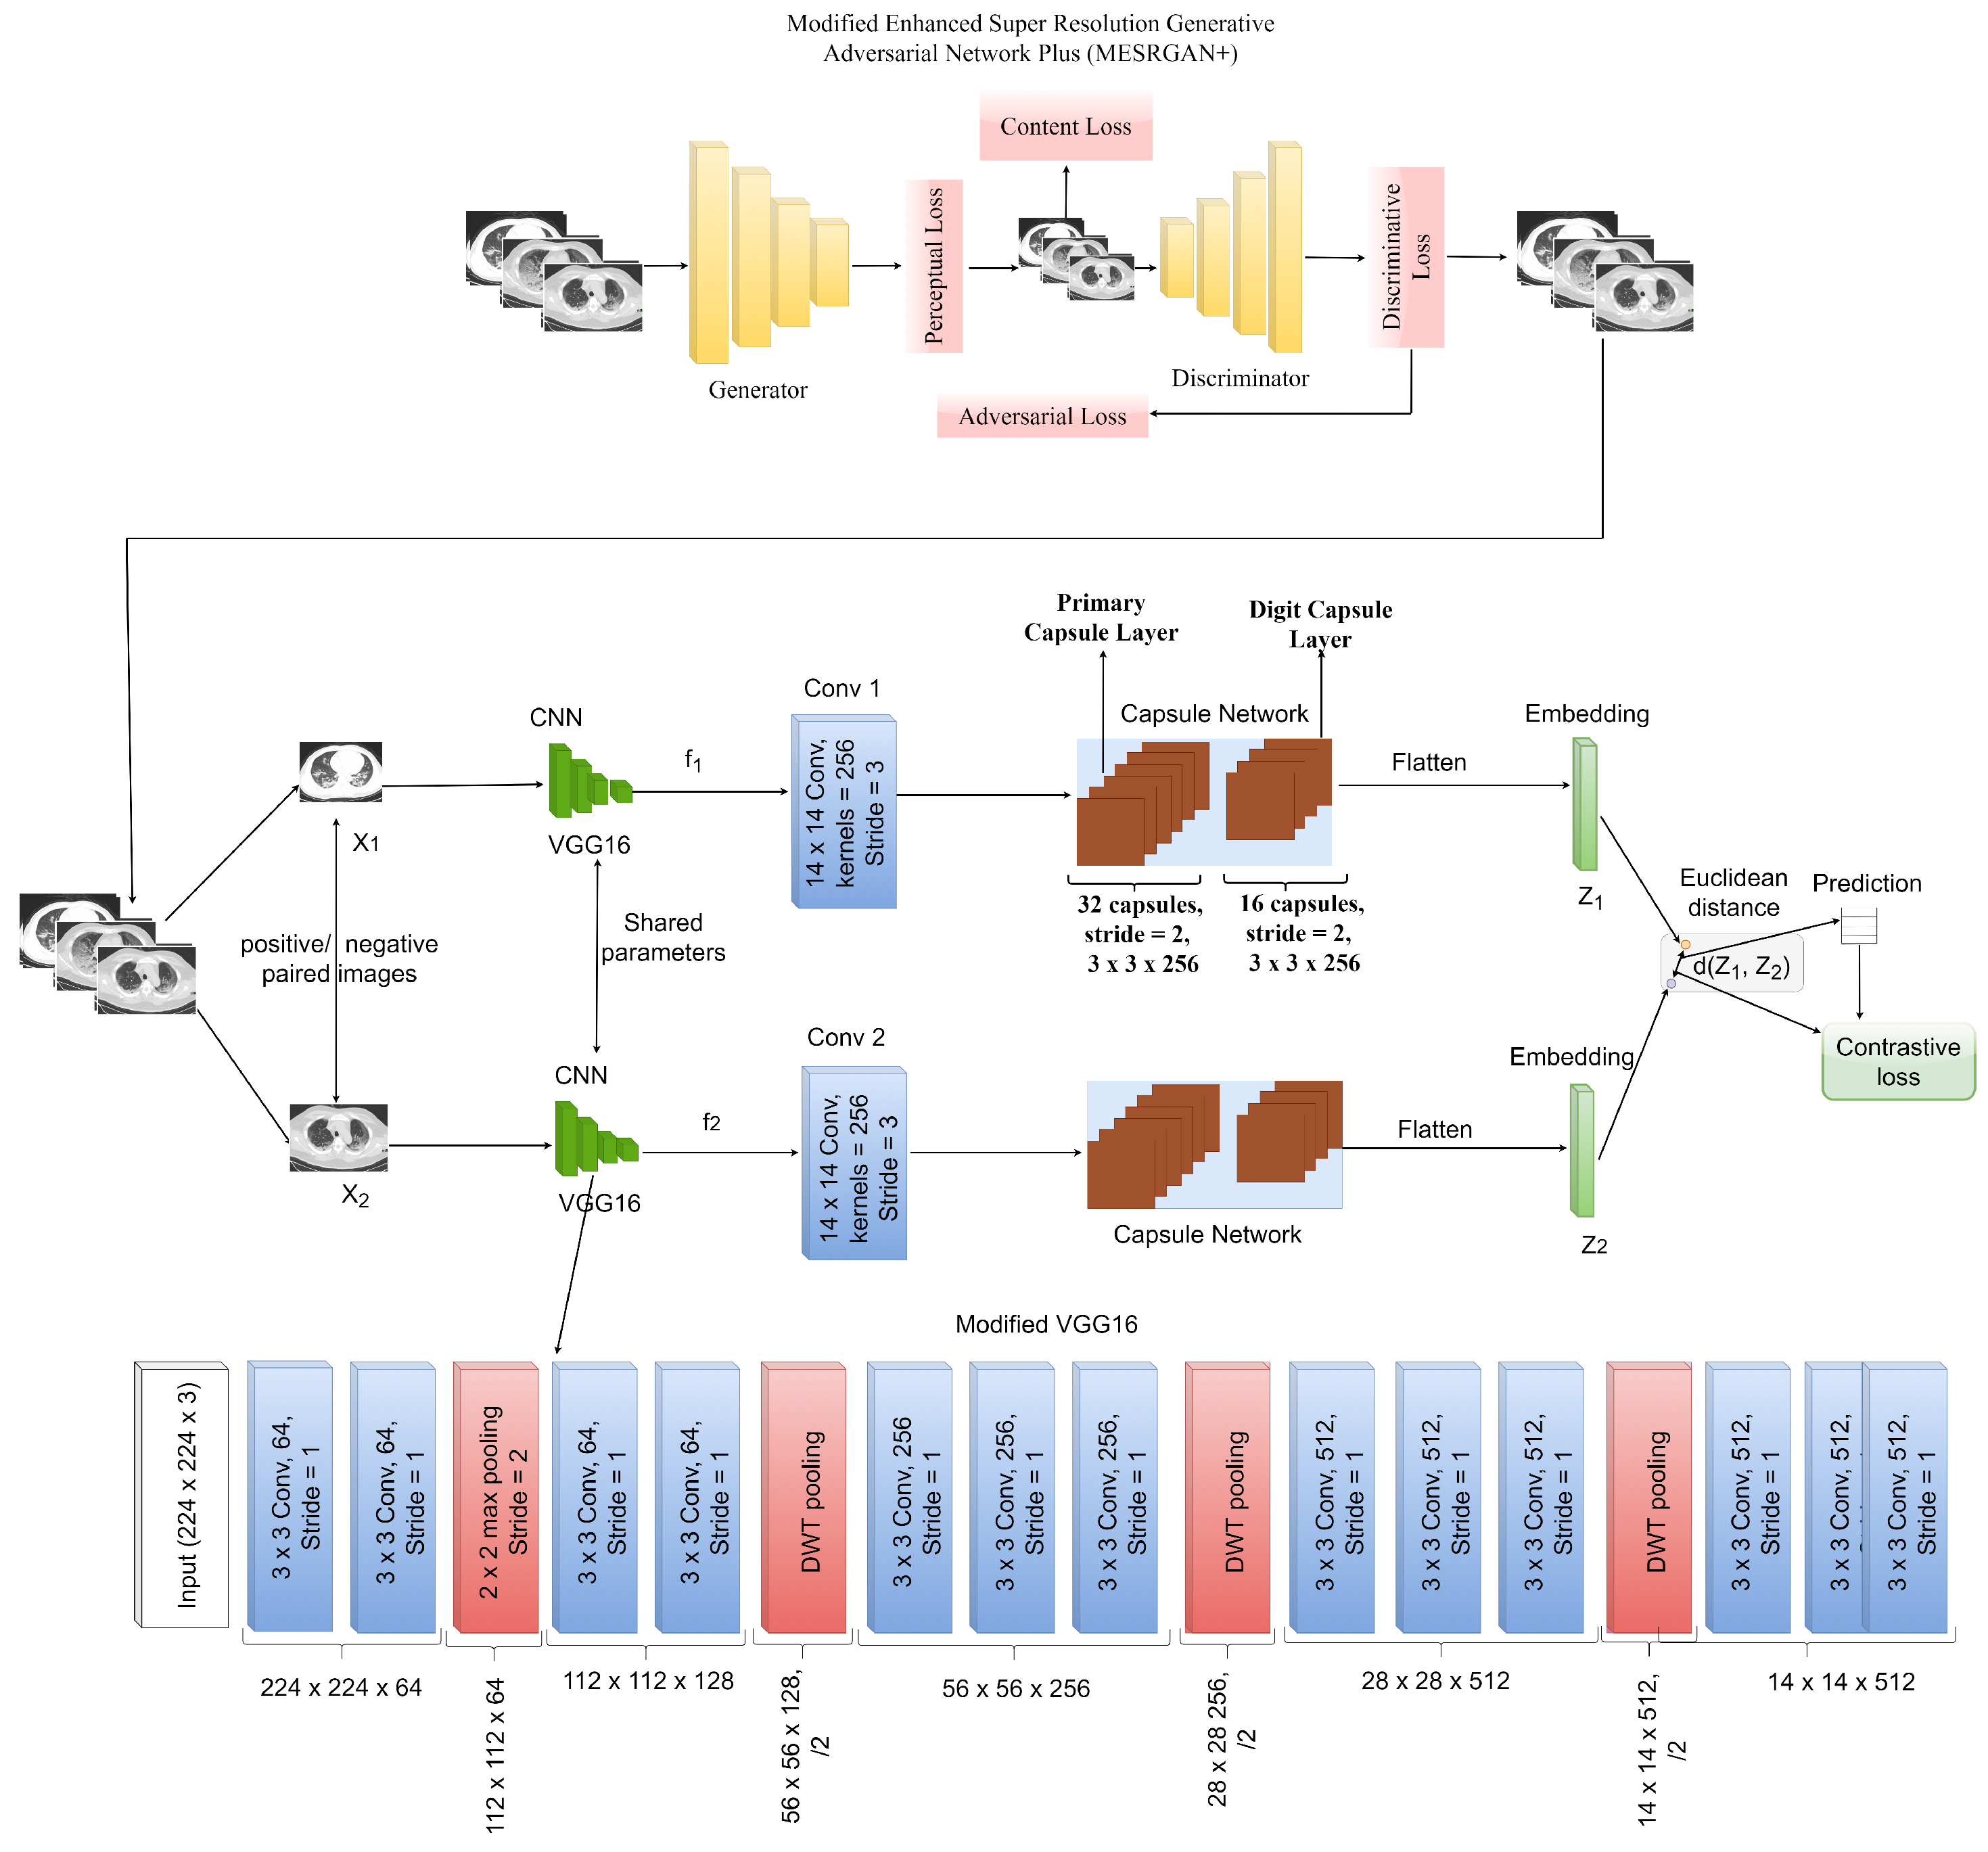
2.3. The Proposed Framework: Modified Enhanced Super-Resolution Generative Adversarial Network with a Siamese Capsule Network
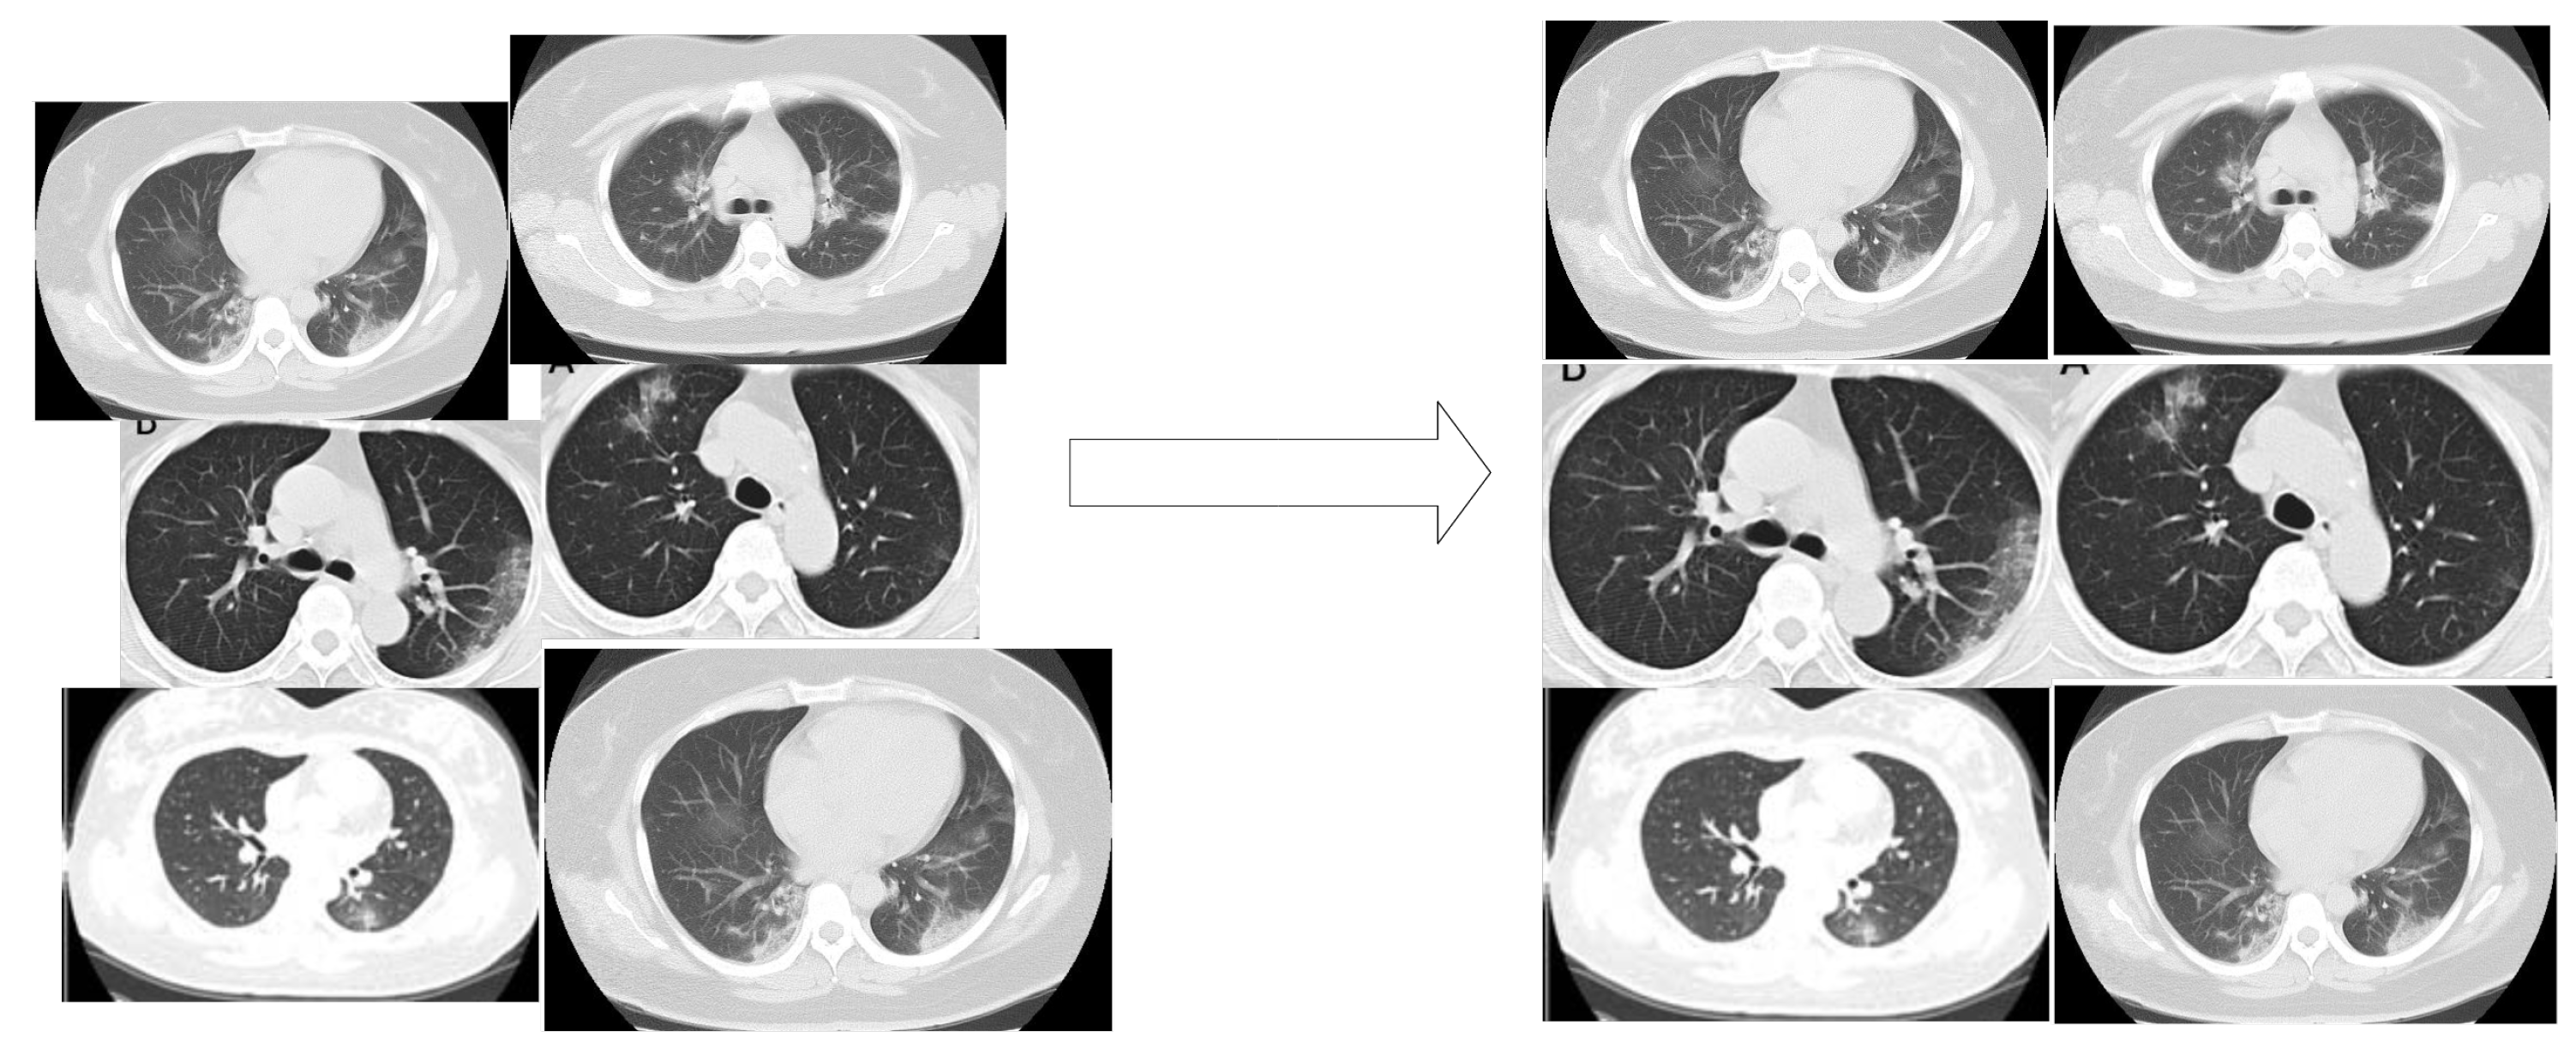
2.3.1. Image Scale-Based Adaptive Module
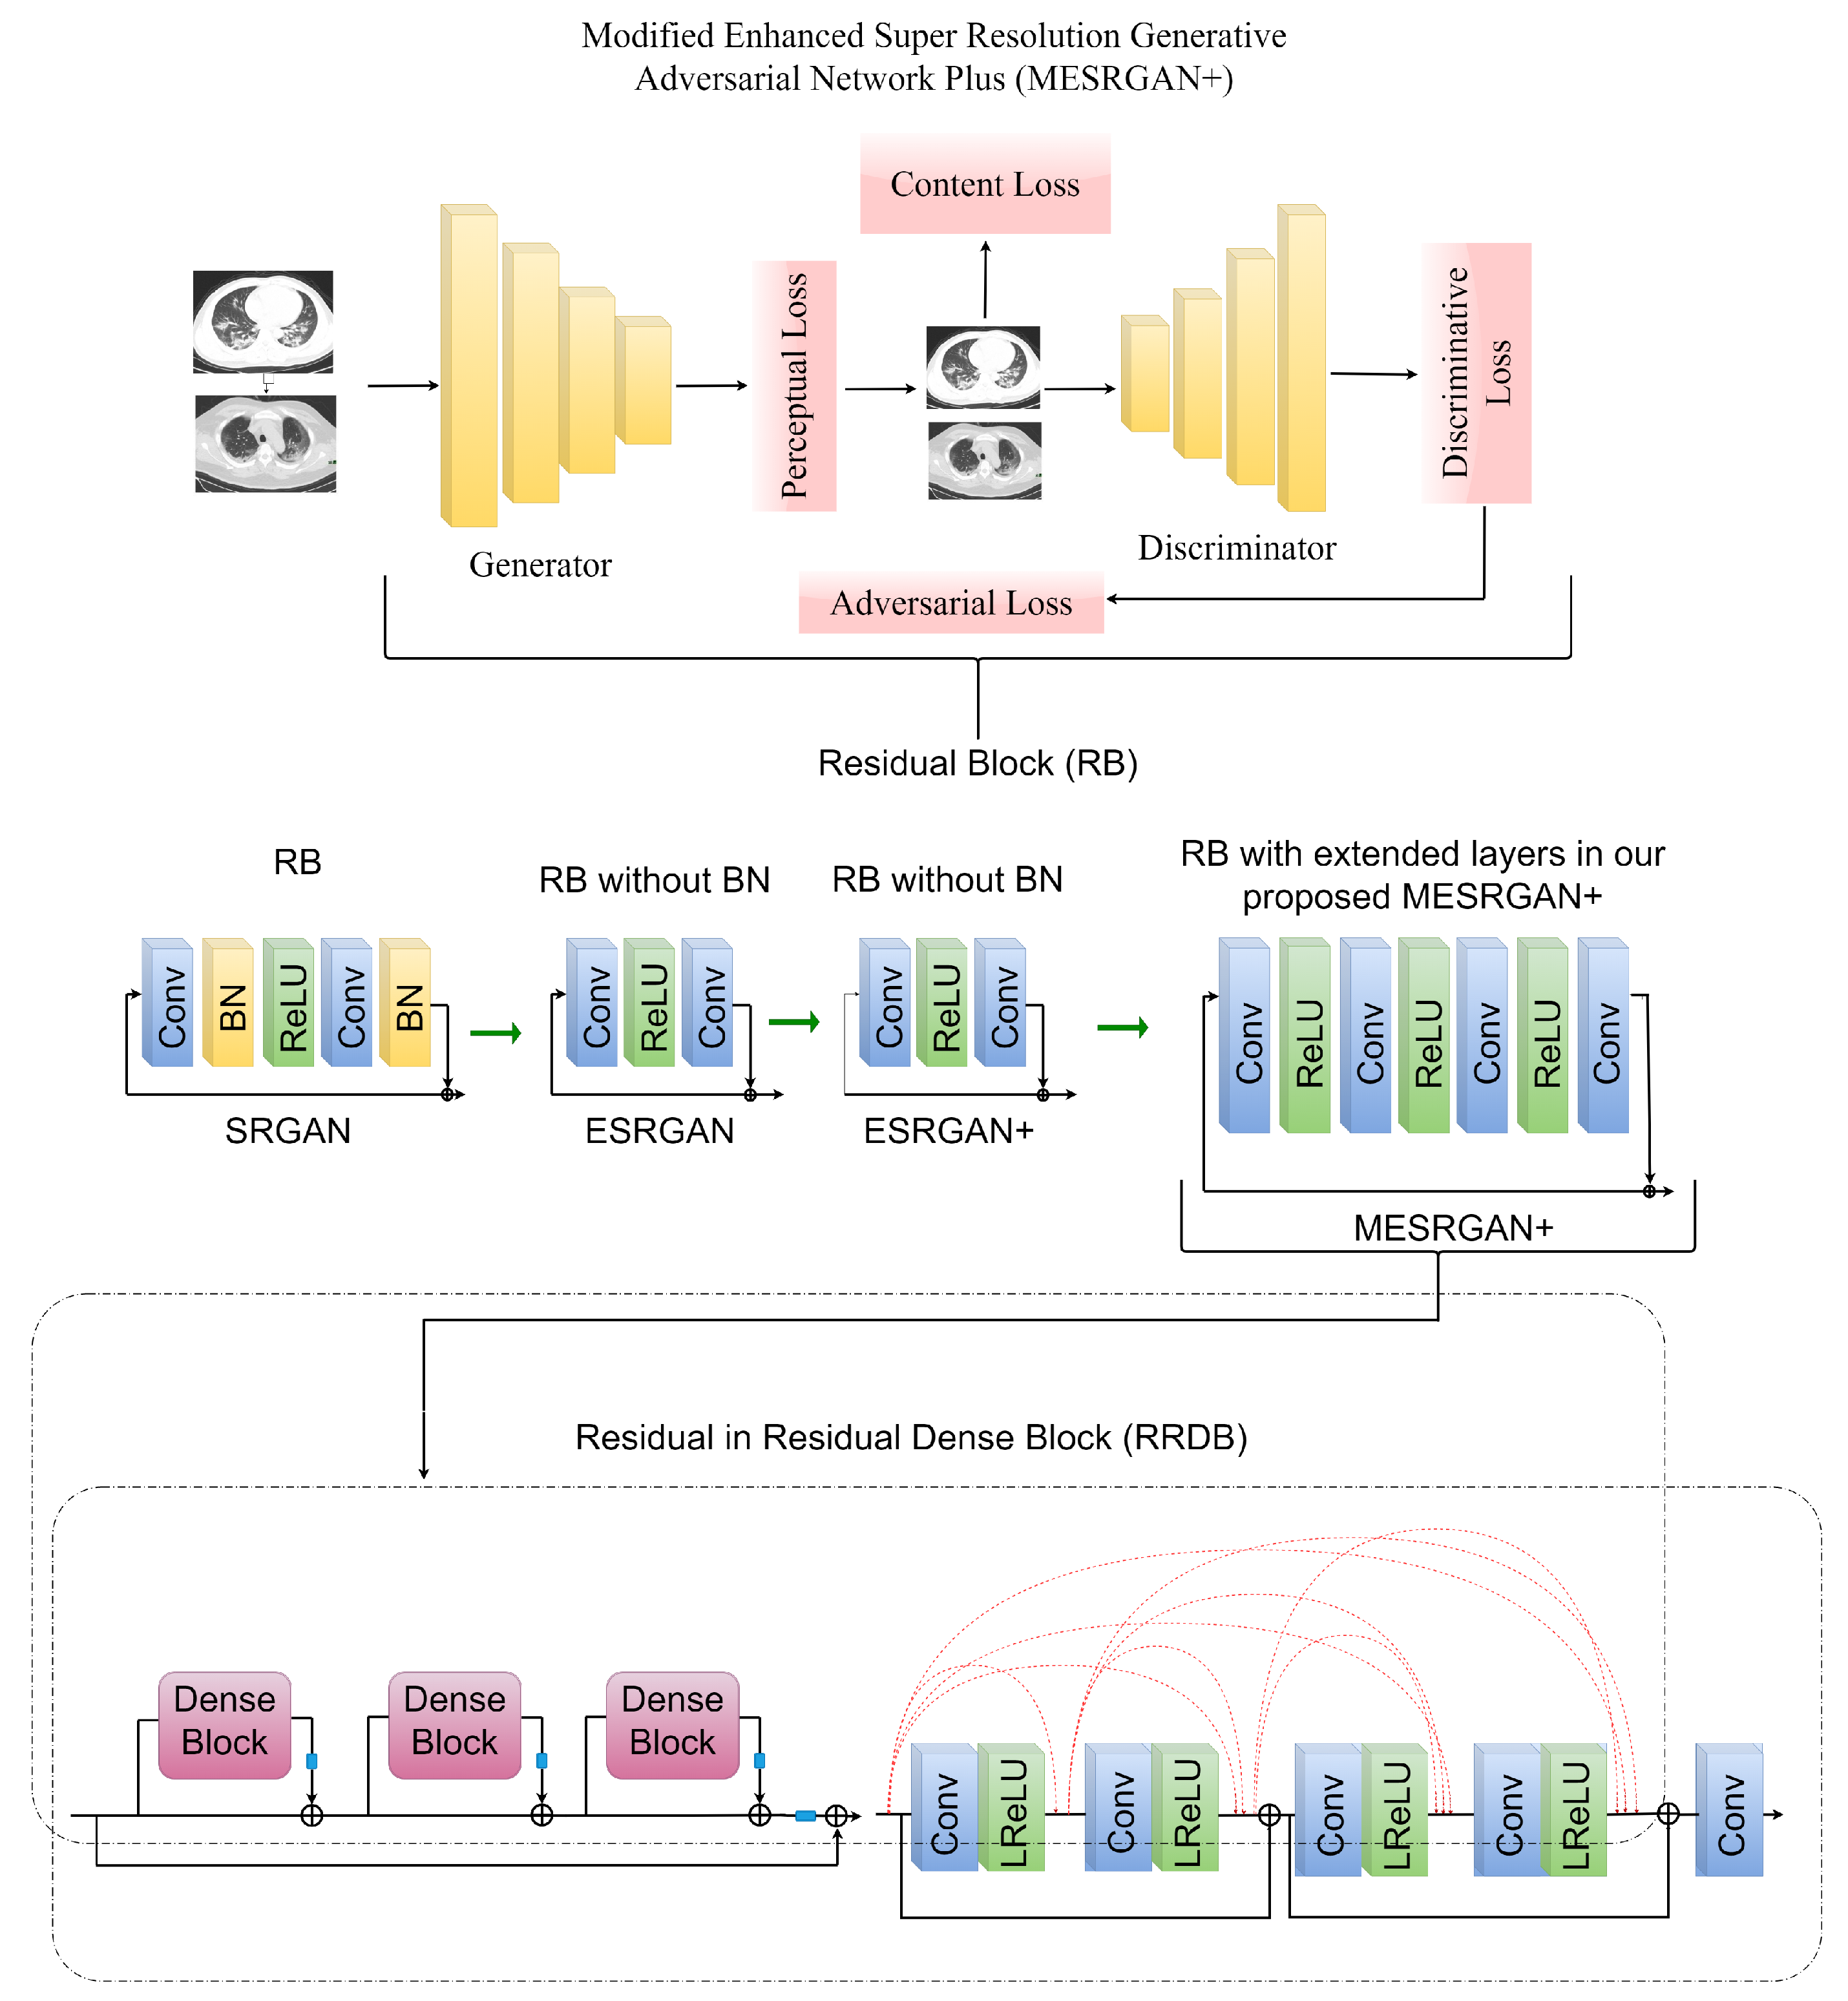
2.3.2. Modified Enhanced Super Resolution GAN Plus (MESRGAN+)
Transition of Super Resolution by GAN
MESRGAN+ Architecture
Perceptual Loss
Content Loss
Relativistic Loss
2.4. Siamese Capsule Network for COVID-19 Identification
3. The Proposed MESRGAN+ Siamese Capsule Network
4. Results
4.1. Experimental Setup
4.2. Evaluation
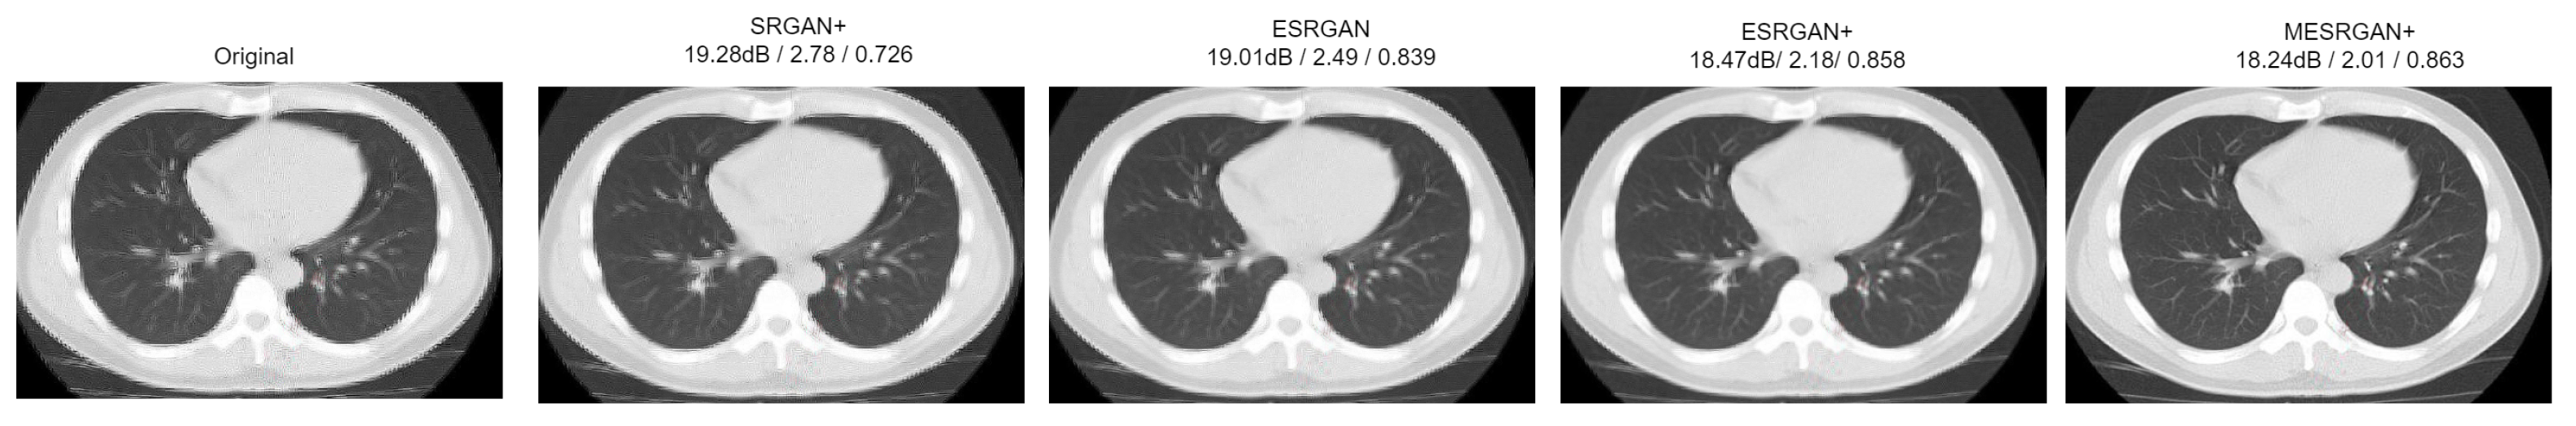
4.3. Super-Resolution Evaluation
4.4. COVID-19 Identification Evaluation
4.4.1. Ablation Study
4.4.2. Results of the Proposed Model
4.4.3. Compare Procedures
5. Discussion
6. Conclusions
Author Contributions
Funding
Institutional Review Board Statement
Informed Consent Statement
Data Availability Statement
Conflicts of Interest
References
- WHO Coronavirus (COVID-19) Dashboard|WHO Coronavirus (COVID-19) Dashboard With Vaccination Data. Available online: https://covid19.who.int/ (accessed on 3 January 2022).
- COVID-19 Map—Johns Hopkins Coronavirus Resource Center. Available online: https://coronavirus.jhu.edu/map.html (accessed on 3 January 2022).
- Xie, X.; Zhong, Z.; Zhao, W.; Zheng, C.; Wang, F.; Liu, J. Chest CT for typical coronavirus disease 2019 (COVID-19) pneumonia: Relationship to negative RT-PCR testing. Radiology 2020, 296, E41–E45. [Google Scholar] [CrossRef] [PubMed] [Green Version]
- Monday, H.N.; Li, J.P.; Nneji, G.U.; Oluwasanmi, A.; Mgbejime, G.T.; Ejiyi, C.J.; Chikwendu, I.A.; James, E.C. Improved convolutional neural multi-resolution wavelet network for COVID-19 pneumonia classification. In Proceedings of the 2021 the 4th International Conference on Pattern Recognition and Artificial Intelligence (PRAI 2021), Yibin, China, 20–22 August 2021; pp. 267–273. [Google Scholar]
- Nneji, G.U.; Cai, J.; Jianhua, D.; Monday, H.N.; Chikwendu, I.A.; Oluwasanmi, A.; James, E.C.; Mgbejime, G.T. Enhancing low quality in radiograph datasets using wavelet transform convolutional neural network and generative adversarial network for COVID-19 identification. In Proceedings of the 2021 the 4th International Conference on Pattern Recognition and Artificial Intelligence (PRAI 2021), Yibin, China, 20–22 August 2021; pp. 146–151. [Google Scholar]
- Wang, S.; Sun, J.; Mehmood, I.; Pan, C.; Chen, Y.; Zhang, Y.-D. Cerebral micro-bleeding identification based on a nine-layerconvolutional neural network with stochastic pooling. Concurr. Comput. Pract. Exp. 2020, 32, e5130. [Google Scholar] [CrossRef]
- Monday, H.N.; Li, J.P.; Nneji, G.U.; James, E.C.; Chikwendu, I.A.; Ejiyi, C.J.; Oluwasanmi, A.; Mgbejime, G.T. The capability of multi resolution analysis: A case study of COVID-19 diagnosis. In Proceedings of the 2021 the 4th International Conference on Pattern Recognition and Artificial Intelligence (PRAI 2021), Yibin, China, 20–22 August 2021; pp. 236–242. [Google Scholar]
- Wang, S.; Tang, C.; Sun, J.; Zhang, Y. Cerebral micro-bleeding detection based on densely connected neural network. Front. Neurosci. 2019, 13, 422. [Google Scholar] [CrossRef] [PubMed] [Green Version]
- Zhang, J.; Xie, Y.; Pang, G.; Liao, Z.; Verjans, J.; Li, W.; Sun, Z.; He, J.; Li, Y.; Shen, C.; et al. Viral Pneumonia Screening on Chest X-rays Using Confidence-Aware Anomaly Detection. IEEE Trans. Med. Imaging 2020, 40, 879–890. [Google Scholar] [CrossRef]
- Hemdan, E.E.-D.; Shouman, M.A.; Karar, M.E. Covidx-net: A framework of deep learning classifiers to diagnose COVID-19 in X-ray images. arXiv 2020, arXiv:2003.11055. [Google Scholar]
- Chowdhury, M.E.H.; Rahman, T.; Khandakar, A.; Mazhar, R.; Kadir, M.A.; Mahbub, Z.B.; Islam, K.R.; Khan, M.S.; Iqbal, A.; Al-Emadi, N.; et al. Can AI help in screening viral and COVID-19 pneumonia? IEEE Access 2020, 8, 132665–132676. [Google Scholar] [CrossRef]
- Wang, L.; Lin, Z.Q.; Wong, A. Covid-net: A tailored deep convolutional neural network design for detection of COVID-19 cases from chest X-ray images. Sci. Rep. 2020, 10, 19549. [Google Scholar] [CrossRef]
- RSNA Pneumonia Detection Challenge|Kaggle. Available online: https://www.kaggle.com/c/rsna-pneumonia-detection-challenge (accessed on 29 April 2021).
- Polsinelli, M.; Cinque, L.; Placidi, G. A light cnn for detecting COVID-19 from ct scans of the chest. Pattern Recognit. Lett. 2020, 140, 95–100. [Google Scholar] [CrossRef]
- Singh, D.; Kumar, V.; Vaishali, K.; Kaur, M. Classification of COVID-19 patients from chest CT images using multi-objective differential evolution—Based convolutional neural networks. Eur. J. Clin. Microbiol. Infect. Dis. 2020, 39, 1379–1389. [Google Scholar] [CrossRef]
- Ouyang, X.; Huo, J.; Xia, L.; Shan, F.; Liu, J.; Mo, Z.; Yan, F.; Ding, Z.; Yang, Q.; Song, B.; et al. Dual-sampling attention network for diagnosis of COVID-19 from community acquired pneumonia. IEEE Trans. Med. Imaging 2020, 39, 2595–2605. [Google Scholar] [CrossRef]
- Maghdid, H.S.; Asaad, A.T.; Ghafoor, K.Z.; Sadiq, A.S.; Mirjalili, S.; Khan, M.K. Diagnosing COVID-19 pneumonia from X-ray and CT images using deep learning and transfer learning algorithms. Multimodal Image Exploit. Learn. 2021, 11734, 117340E. [Google Scholar]
- Zheng, C.; Deng, X.; Fu, Q.; Zhou, Q.; Feng, J.; Ma, H.; Liu, W.; Wang, X. Deep learning-based detection for COVID-19 from chest CT using weak label. medRxiv 2020. [Google Scholar] [CrossRef] [Green Version]
- Gozes, O.; Frid-Adar, M.; Greenspan, H.; Browning, P.D.; Zhang, H.; Ji, W.; Bernheim, A.; Siegel, E. Rapid ai development cycle for the coronavirus (COVID-19) pandemic: Initial results for automated detection & patient monitoring using deep learning ct image analysis. arXiv 2020, arXiv:2003.05037. [Google Scholar]
- Li, L.; Qin, L.; Xu, Z.; Yin, Y.; Wang, X.; Kong, B.; Bai, J.; Lu, Y.; Fang, Z.; Song, Q.; et al. Using artificial intelligence to detect COVID-19 and community-acquired pneumonia based on pulmonary CT: Evaluation of the diagnostic accuracy. Radiology 2020, 296, E65–E71. [Google Scholar] [CrossRef] [PubMed]
- Nneji, G.U.; Cai, J.; Deng, J.; Monday, H.N.; James, E.C.; Ukwuoma, C.C. Multi-Channel Based Image Processing Scheme for Pneumonia Identification. Diagnostics 2022, 12, 325. [Google Scholar] [CrossRef]
- Barstugan, M.; Ozkaya, U.; Ozturk, S. Coronavirus (COVID-19) classification using ct images by machine learning methods. arXiv 2020, arXiv:2003.09424. [Google Scholar]
- Shi, F.; Xia, L.; Shan, F.; Song, B.; Wu, D.; Wei, Y.; Yuan, H.; Jiang, H.; He, Y.; Gao, Y.; et al. Large-scale screening to distinguish between COVID-19 and community-acquired pneumonia using infection size-aware classification. Phys. Med. Biol. 2021, 66, 65031. [Google Scholar] [CrossRef]
- Jin, S.; Wang, B.; Xu, H.; Luo, C.; Wei, L.; Zhao, W.; Hou, X.; Ma, W.; Xu, Z.; Zheng, Z.; et al. AI-assisted CT imaging analysis for COVID-19 screening: Building and deploying a medical AI system in four weeks. Appl. Soft Comput. 2021, 98, 106897. [Google Scholar]
- Jin, C.; Chen, W.; Cao, Y.; Xu, Z.; Tan, Z.; Zhang, X.; Deng, L.; Zheng, C.; Zhou, J.; Shi, H.; et al. Development and evaluation of an artificial intelligence system for COVID-19 diagnosis. Nat. Commun. 2020, 11, 1–14. [Google Scholar] [CrossRef]
- Song, Y.; Zheng, S.; Li, L.; Zhang, X.; Zhang, X.; Huang, Z.; Chen, J.; Wang, R.; Zhao, H.; Chong, Y.; et al. Deep learning enables accurate diagnosis of novel coronavirus (COVID-19) with CT images. IEEE/ACM Trans. Comput. Biol. Bioinform. 2021, 18, 2775–2780. [Google Scholar] [CrossRef]
- Tang, Z.; Zhao, W.; Xie, X.; Zhong, Z.; Shi, F.; Liu, J.; Shen, D. Severity assessment of coronavirus disease 2019 (COVID-19) using quantitative features from chest CT images. arXiv 2020, arXiv:2003.11988. [Google Scholar]
- Xu, X.; Jiang, X.; Ma, C.; Du, P.; Li, X.; Lv, S.; Yu, L.; Ni, Q.; Chen, Y.; Su, J.; et al. A deep learning system to screen novel coronavirus disease 2019 pneumonia. Engineering 2020, 6, 1122–1129. [Google Scholar] [CrossRef] [PubMed]
- Wang, S.; Kang, B.; Ma, J.; Zeng, X.; Xiao, M.; Guo, J.; Cai, M.; Yang, J.; Li, Y.; Meng, X.; et al. A deep learning algorithm using CT images to screen for Corona Virus Disease (COVID-19). Eur. Radiol. 2021, 31, 6096–6104. [Google Scholar] [CrossRef] [PubMed]
- Singh, D.; Kumar, V.; Kaur, M. Densely connected convolutional networks-based COVID-19 screening model. Appl. Intell. 2021, 51, 3044–3051. [Google Scholar] [CrossRef] [PubMed]
- Scarpiniti, M.; Ahrabi, S.S.; Baccarelli, E.; Piazzo, L.; Momenzadeh, A. A novel unsupervised approach based on the hidden features of Deep Denoising Autoencoders for COVID-19 disease detection. Expert Syst. Appl. 2021, 192, 116366. [Google Scholar] [CrossRef] [PubMed]
- Khan, M.A.; Alhaisoni, M.; Tariq, U.; Hussain, N.; Majid, A.; Damaševičius, R.; Maskeliūnas, R. COVID-19 case recognition from chest CT images by deep learning, entropy-controlled firefly optimization, and parallel feature fusion. Sensors 2021, 21, 7286. [Google Scholar] [CrossRef]
- Rehman, N.U.; Zia, M.S.; Meraj, T.; Rauf, H.T.; Damaševičius, R.; El-Sherbeeny, A.M.; El-Meligy, M.A. A self-activated cnn approach for multi-class chest-related COVID-19 detection. Appl. Sci. 2021, 11, 9023. [Google Scholar] [CrossRef]
- You, C.; Li, G.; Zhang, Y.; Zhang, X.; Shan, H.; Ju, S.; Zhao, Z.; Zhang, Z.; Cong, W.; Vannier, M.W.; et al. CT super-resolution GAN constrained by the identical, residual, and cycle learning ensemble (GAN-CIRCLE). IEEE Trans. Med. Imaging 2019, 39, 188–203. [Google Scholar] [CrossRef] [Green Version]
- Waheed, A.; Goyal, M.; Gupta, D.; Khanna, A.; Al-Turjman, F.; Pinheiro, P.R. Covidgan: Data augmentation using auxiliary classifier gan for improved COVID-19 detection. IEEE Access 2020, 8, 91916–91923. [Google Scholar] [CrossRef]
- Aljondi, R.; Alghamdi, S. Diagnostic value of imaging modalities for COVID-19: Scoping review. J. Med. Internet Res. 2020, 22, e19673. [Google Scholar] [CrossRef]
- Shan, F.; Gao, Y.; Wang, J.; Shi, W.; Shi, N.; Han, M.; Xue, Z.; Shen, D.; Shi, Y. Lung infection quantification of COVID-19 in CT images with deep learning. arXiv 2020, arXiv:2003.04655. [Google Scholar]
- Kotz, S.; Nadarajah, S. Extreme Value Distributions: Theory and Applications; World Scientific: Singapore, 2000. [Google Scholar]
- Yang, X.; He, X.; Zhao, J.; Zhang, Y.; Zhang, S.; Xie, P. COVID-CT-Dataset: A CT scan dataset about COVID-19. arXiv 2020, arXiv:2003.13865v3. [Google Scholar]
- Ledig, C.; Theis, L.; Huszár, F.; Caballero, J.; Cunningham, A.; Acosta, A.; Aitken, A.; Tejani, A.; Totz, J.; Wang, Z.; et al. Photo-realistic single image super-resolution using a generative adversarial network. In Proceedings of the IEEE Conference Computer Vision and Pattern Recognition 2017, Honolulu, HI, USA, 21–26 July 2017; pp. 4681–4690. [Google Scholar]
- Wang, X.; Yu, K.; Wu, S.; Gu, J.; Liu, Y.; Dong, C.; Qiao, Y.; Change Loy, C. Esrgan: Enhanced super-resolution generative adversarial networks. In Proceedings of the IEEE Conference Computer Vision and Pattern Recognition 2018, Salt Lake City, UT, USA, 18–22 June 2018. [Google Scholar]
- Rakotonirina, N.C.; Rasoanaivo, A. ESRGAN+: Further improving enhanced super-resolution generative adversarial network. In Proceedings of the ICASSP 2020—2020 IEEE International Conference Coustics, Speech and Signal Processing, Barcelona, Spain, 4–8 May 2020; pp. 3637–3641. [Google Scholar]
- Johnson, J.; Alahi, A.; Fei-Fei, L. Perceptual losses for real-time style transfer and super-resolution. In Proceedings of the European Conference on Computer Vision, Amsterdam, The Netherlands, 8–16 October 2016; pp. 694–711. [Google Scholar]
- Sabour, S.; Frosst, N.; Hinton, G.E. Dynamic routing between capsules. arXiv 2017, arXiv:1710.09829. [Google Scholar]
- Hinton, G.E.; Sabour, S.; Frosst, N. Matrix capsules with EM routing. In Proceedings of the International Conference on Learning Representations, Vancouver, BC, Canada, 30 April–3 May 2018. [Google Scholar]
- Paoletti, M.E.; Haut, J.M.; Fernandez-Beltran, R.; Plaza, J.; Plaza, A.; Li, J.; Pla, F. Capsule networks for hyperspectral image classification. IEEE Trans. Geosci. Remote Sens. 2018, 57, 2145–2160. [Google Scholar] [CrossRef]


| Parameter | SRGAN | ESRGAN | ESRGAN+ | MESRGAN+ |
|---|---|---|---|---|
| Residual block of the generator | Conv(3, 64, 1) Batch norm ReLU Conv(3, 64, 1) Batch norm | Conv(3, 64, 1) ReLU Conv(3, 64, 1) | Conv(3, 64, 1) ReLU Conv(3, 64, 1) | Conv(3, 64, 1) ReLU Conv(1, 64, 1) ReLU Conv(3, 64, 1) ReLU Conv(3, 64, 1) |
| Input size | LR | LR | LR | LR |
| PSNR | 19.28 dB | 19.01 dB | 18.47 dB | 18.24 dB |
| Perceptual Index | 2.78 | 2.49 | 2.18 | 2.01 |
| SSIM | 0.726 | 0.839 | 0.858 | 0.863 |
| Model | With DWT-Pooling | With Max-Pooling | Difference |
|---|---|---|---|
| ACC (%) | ACC (%) | ACC (%) | |
| Capsule Network | 93.92 | 91.64 | 2.28 |
| Siamese Capsule Network | 97.10 | 94.89 | 2.21 |
| Model | With Regularizer | W/o Regularizer | Difference |
|---|---|---|---|
| ACC (%) | ACC (%) | ACC (%) | |
| Capsule Network (Max-pooling) | 92.79 | 91.64 | 1.15 |
| Capsule Network (DWT-pooling) | 94.66 | 93.92 | 0.74 |
| Siamese Capsule Network (Max-pooling) | 96.03 | 94.89 | 1.14 |
| Siamese Capsule Network (DWT-pooling) | 97.92 | 97.10 | 0.82 |
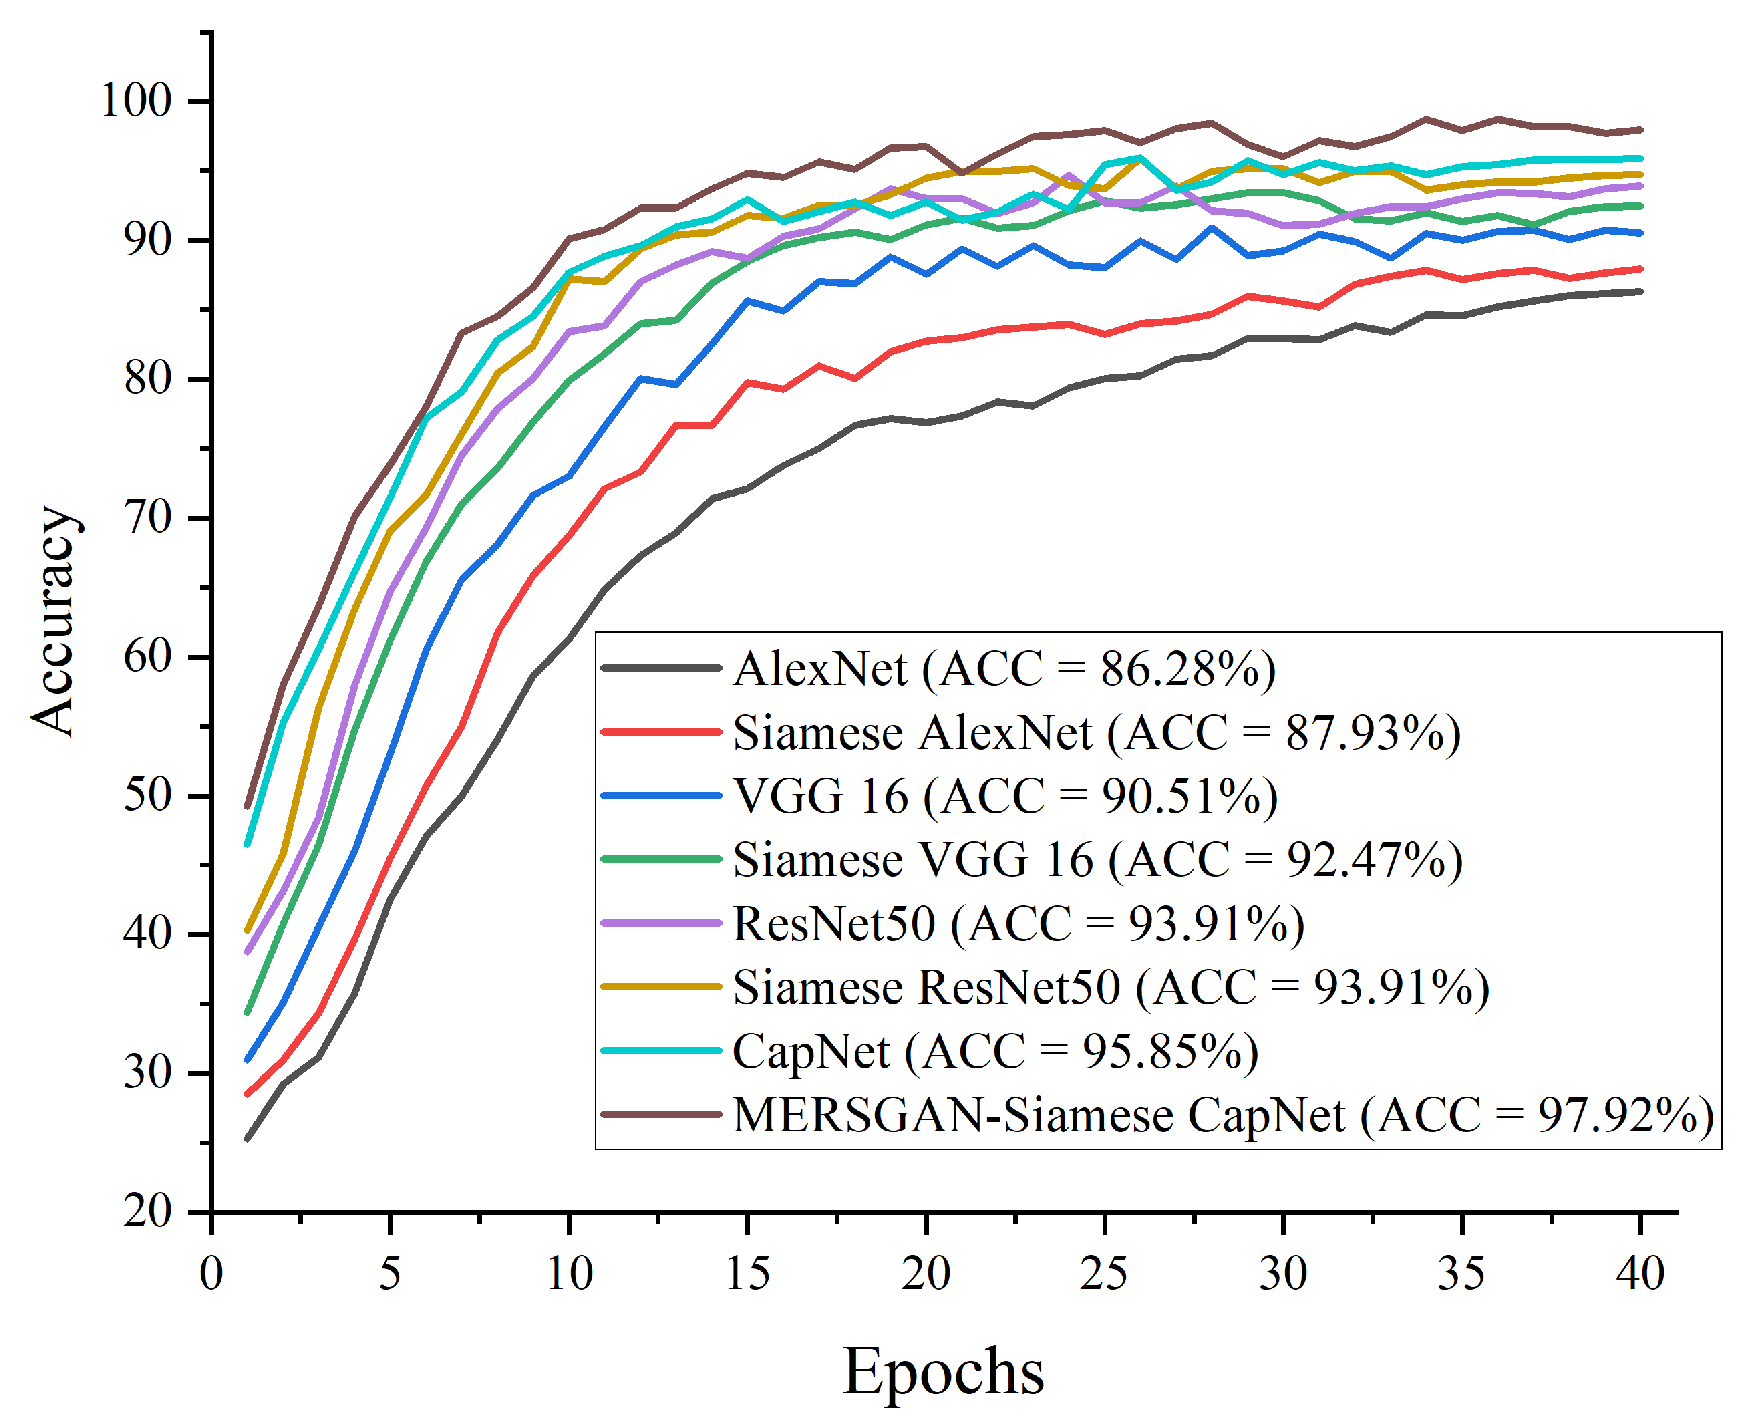
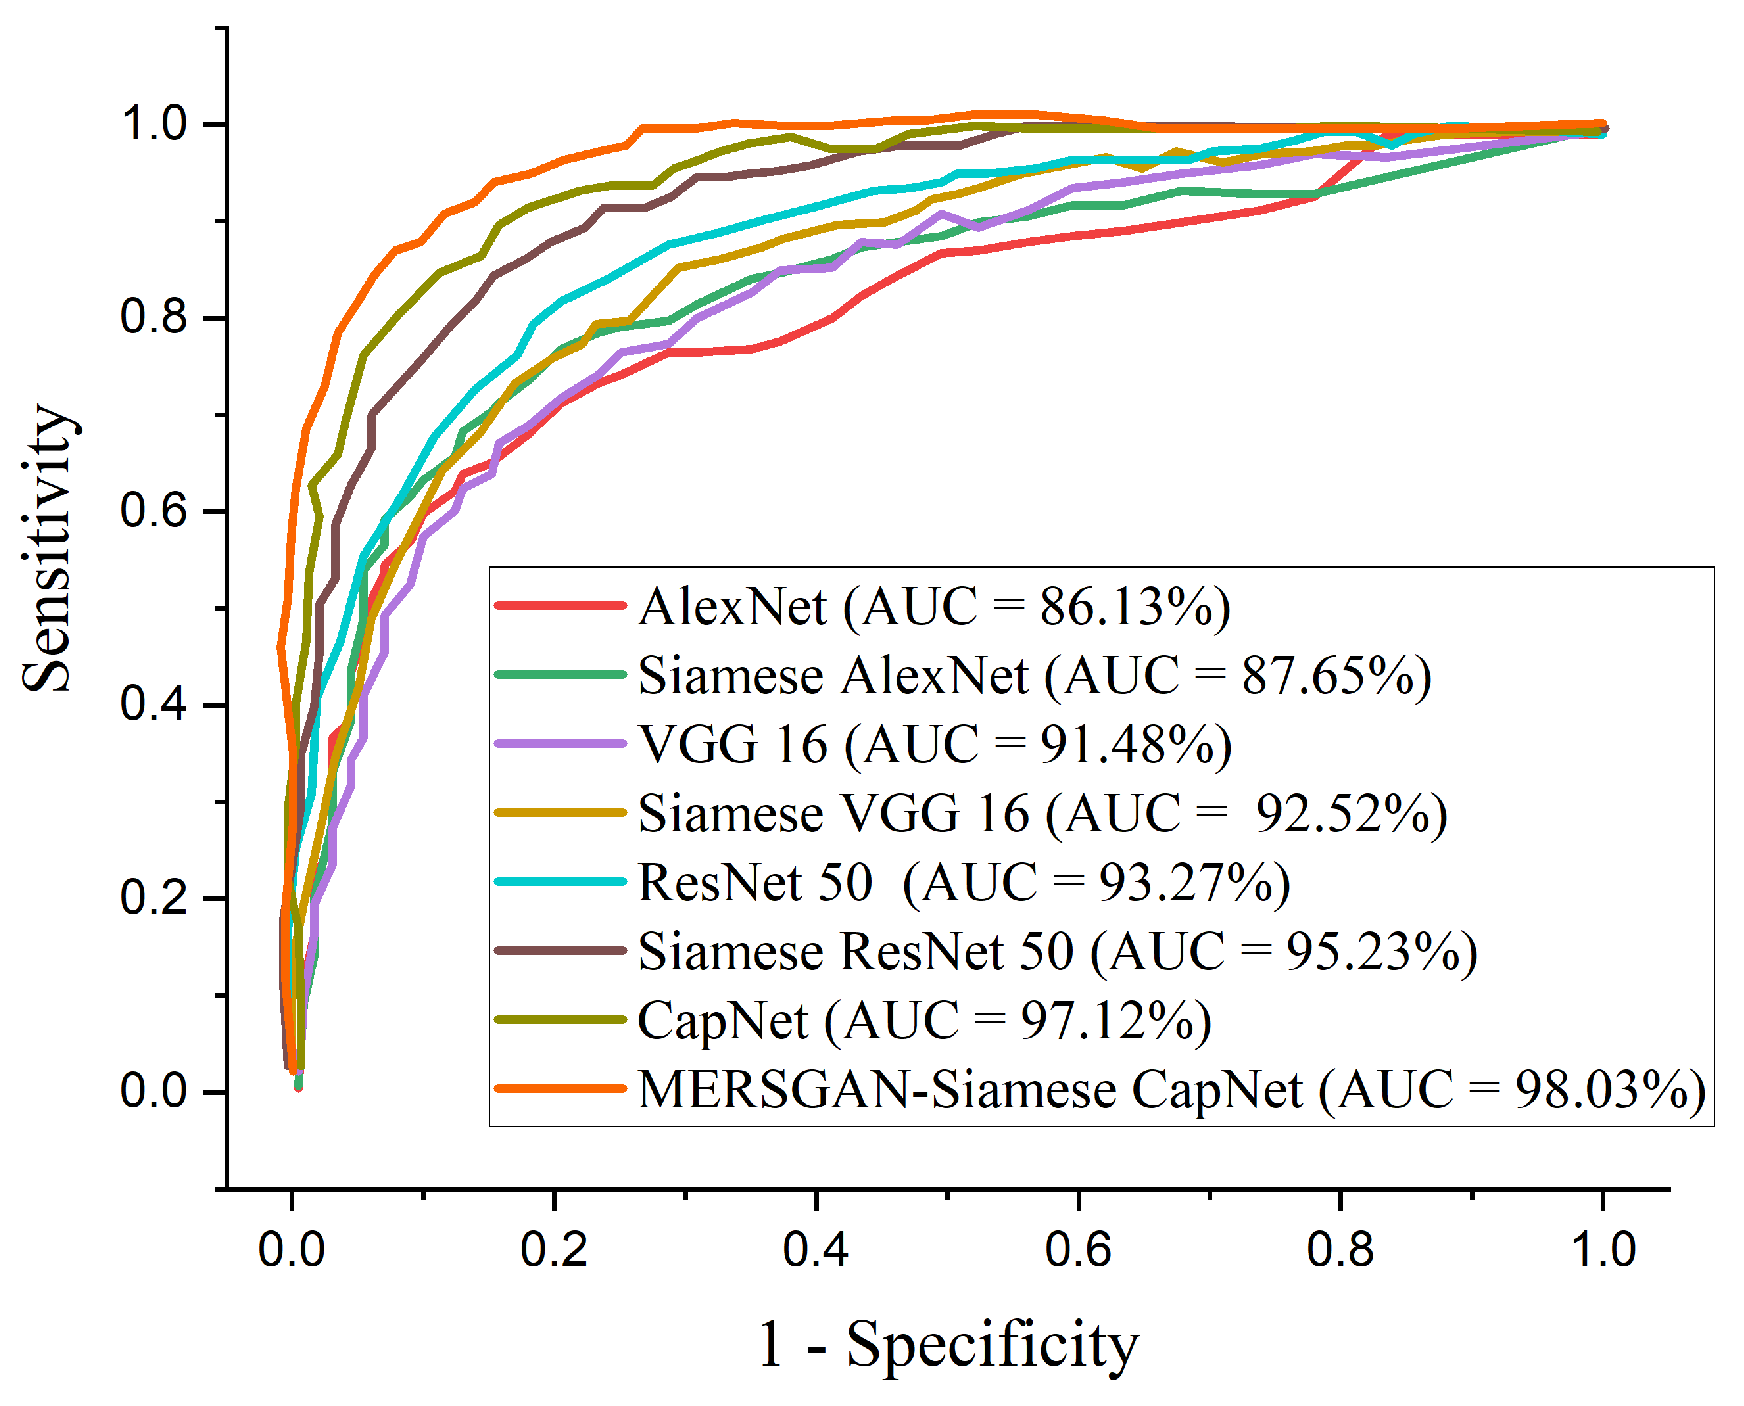
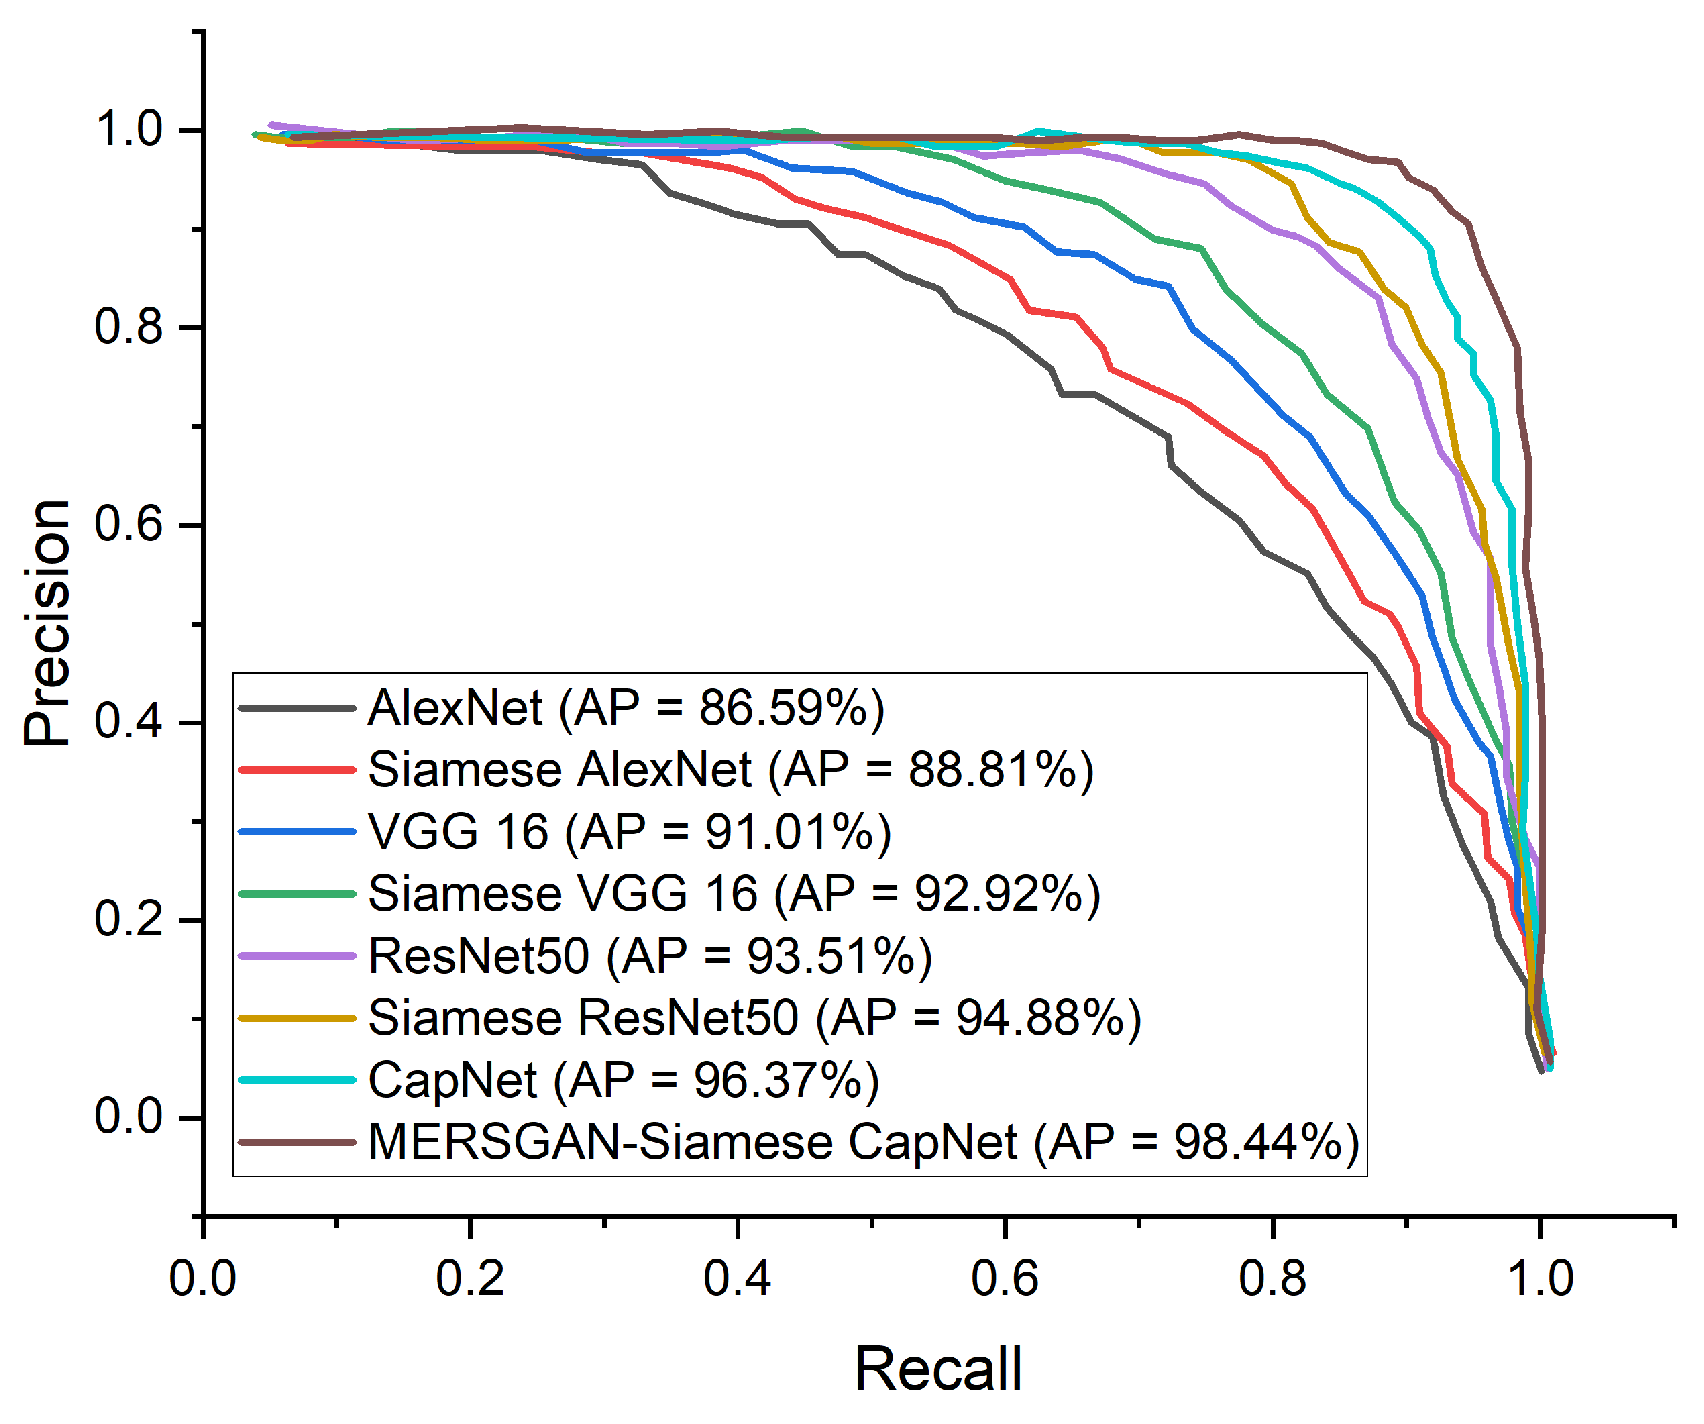
| Model | ACC (%) | SEN (%) | SPE (%) | AUC (%) | PREC (%) | F1-Score (%) |
|---|---|---|---|---|---|---|
| AlexNet | 86.28 | 86.64 | 85.81 | 86.13 | 86.59 | 86.62 |
| Siamese AlexNet | 87.93 | 88.77 | 87.01 | 87.65 | 88.81 | 88.99 |
| VGG 16 | 90.51 | 91.70 | 89.23 | 91.48 | 91.01 | 91.36 |
| Siamese VGG 16 | 92.47 | 92.89 | 93.13 | 92.52 | 92.92 | 92.86 |
| ResNet50 | 93.91 | 93.64 | 91.77 | 93.27 | 93.51 | 93.48 |
| Siamese ResNet50 | 94.72 | 94.37 | 95.58 | 95.23 | 94.88 | 94.62 |
| Capsule Network | 95.85 | 96.41 | 95.94 | 97.12 | 96.37 | 96.49 |
| MERSGAN-Siamese CapNet | 97.92 | 98.85 | 97.21 | 98.03 | 98.44 | 97.52 |
| Model | ACC (%) | SEN (%) | SPE (%) |
|---|---|---|---|
| Song et al. [26] | 86.0 | 96.0 | 77.0 |
| Tang et al. [27] | 87.5 | 93.3 | 74.5 |
| Wang et al. [12] | 93.3 | 91.4 | 90.5 |
| Zheng et al. [18] | 90.1 | 90.7 | 91.1 |
| Shi et al. [23] | 89.4 | 90.7 | 87.2 |
| Jin et al. [24] | 95.2 | 97.4 | 92.2 |
| Xu et al. [28] | 86.7 | 87.9 | 90.7 |
| MERSGAN-Siamese CapNet | 97.92 | 98.85 | 97.21 |
| Model | ACC (%) | SEN (%) | SPE (%) |
|---|---|---|---|
| Zheng et al. [18] | 92.77 | 91.83 | 92.05 |
| Shi et al. [23] | 90.31 | 90.94 | 89.62 |
| Jin et al. [24] | 96.86 | 97.09 | 90.17 |
| Xu et al. [28] | 87.88 | 89.25 | 91.42 |
| MERSGAN-Siamese CapNet | 97.92 | 98.85 | 97.21 |
Publisher’s Note: MDPI stays neutral with regard to jurisdictional claims in published maps and institutional affiliations. |
© 2022 by the authors. Licensee MDPI, Basel, Switzerland. This article is an open access article distributed under the terms and conditions of the Creative Commons Attribution (CC BY) license (https://creativecommons.org/licenses/by/4.0/).
Share and Cite
Nneji, G.U.; Deng, J.; Monday, H.N.; Hossin, M.A.; Obiora, S.; Nahar, S.; Cai, J. COVID-19 Identification from Low-Quality Computed Tomography Using a Modified Enhanced Super-Resolution Generative Adversarial Network Plus and Siamese Capsule Network. Healthcare 2022, 10, 403. https://doi.org/10.3390/healthcare10020403
Nneji GU, Deng J, Monday HN, Hossin MA, Obiora S, Nahar S, Cai J. COVID-19 Identification from Low-Quality Computed Tomography Using a Modified Enhanced Super-Resolution Generative Adversarial Network Plus and Siamese Capsule Network. Healthcare. 2022; 10(2):403. https://doi.org/10.3390/healthcare10020403
Chicago/Turabian StyleNneji, Grace Ugochi, Jianhua Deng, Happy Nkanta Monday, Md Altab Hossin, Sandra Obiora, Saifun Nahar, and Jingye Cai. 2022. "COVID-19 Identification from Low-Quality Computed Tomography Using a Modified Enhanced Super-Resolution Generative Adversarial Network Plus and Siamese Capsule Network" Healthcare 10, no. 2: 403. https://doi.org/10.3390/healthcare10020403