
Gender Gap in Self-Rated Health: A Cohort Perspective in Eastern European Countries

 , , and
Abstract
:1. Introduction
2. Materials and Methods
3. Results
3.1. Descriptive Results
3.2. Empirical Strategy
4. Discussion
5. Conclusions
Author Contributions
Funding
Institutional Review Board Statement
Informed Consent Statement
Data Availability Statement
Conflicts of Interest
References
- Girón, P. Los Determinantes de la Salud Percibida en España; Universidad Complutense de Madrid: Madrid, Spain, 2010. [Google Scholar]
- Idler, E.L.; Benyamini, Y. Self-rated health and mortality: A review of twenty-seven community studies. J. Health Soc. Behav. 1997, 38, 21–37. [Google Scholar] [CrossRef] [PubMed] [Green Version]
- Souto, S. Percepción de la Salud, Determinantes Sociales en la Atención Primaria. Ph.D. Thesis, Universidad de A Coruña, Coruña, Spain, 2012. [Google Scholar]
- Zúñiga, M.A.; Fos, J.G.T.; Carrillo, P.J.; Gandek, B.; Medina, M.M.R. Evaluación del estado de salud con la encuesta SF-36: Resultados preliminares en México. Salud. Publica. Mex. 1999, 41, 110–118. [Google Scholar] [CrossRef] [PubMed] [Green Version]
- De Salvo, K.; Fan, V.S.; McDonell, M.B.; Fihn, S.D. Predicting mortality and healthcare utilization with a single question. Health Serv. Res. 2005, 40, 1234–1246. [Google Scholar] [CrossRef] [PubMed] [Green Version]
- Devaux, M. Income-related inequalities and inequities in health care services utilisation in 18 selected Organisation for Economic Cooperation and Development countries. Eur. J. Health Econ. 2015, 16, 21–33. [Google Scholar] [CrossRef]
- Zimmer, Z.; Natividad, J.; Lin, H.S.; Chayovan, N.A. cross-national examination of the determinants of self-assessed health. J. Health Soc. Behav. 2000, 41, 465–481. [Google Scholar] [CrossRef]
- Gil-Lacruz, M. Psicología Social Aplicada al Bienestar; Prensas Universitarias: Zaragoza, Spain, 2007. [Google Scholar]
- Crossley, T.; Kennedy, S. The reliability of self-assessed health status. J. Health Econ. 2002, 21, 643–658. [Google Scholar] [CrossRef]
- Schnittker, J. Education and the Changing Shape of the Income Gradient in Health. J. Health Soc. Behav. 2004, 45, 286–305. [Google Scholar] [CrossRef]
- Wang, J.; Smith, W.; Cumming, R.; Mitchell, P. Variables Determining Perceived Global Health Ranks: Findings from a Population_based Study. Ann. Acad. Med. 2006, 35, 190–197. [Google Scholar]
- Gil-Lacruz, M.; Gil-Lacruz, A.I. Calidad de vida relacionada con la salud, ¿cómo influye el nivel educativo? Salut, Educació i Cultura. In Proceedings of the International Congress, Health, Education and Quality of Live, Seville, Spain, 14–16 November 2016. [Google Scholar]
- World Health Organization. Commission (WHO) on Social Determinants of Health. Closing the Gap in a Generation: Health Equity through Action on the Social Determinants of Health; Final Report; WHO: Geneva, Switzerland, 2008. [Google Scholar]
- Ekersley, R. Beyond inequality: Acknowledging the complexity of social determinants of health. Soc. Sci. Med. 2015, 147, 121–125. [Google Scholar] [CrossRef]
- Assari, S.; Preiser, B.; Kelly, M. Education and Income Predict Future Emotional Well-Being of Whites but not Blacks: A Ten-Year Cohort. Brain Sci. 2018, 8, 122. [Google Scholar] [CrossRef] [Green Version]
- Sen, A. Health: Perception versus observation. BMJ 2002, 324, 860–861. [Google Scholar] [CrossRef] [PubMed]
- Adams, S.A.; Matthews, C.E.; Ebbeling, C.B.; Moore, C.G.; Cunningham, J.E.; Fulton, J.; Hebert, J.R. The effect of social desirability and social approval on self-reports of physical activity. Am. J. Epidemiol. 2005, 161, 389–398. [Google Scholar] [CrossRef] [PubMed]
- Zgorski, K.; Evans, M.D.R.; Kelley, J.; Piotrowska, K. Does national income inequality affect individuals quality of life in Europe? Inequality, Happiness, Finances and Health. Soc. Indic. Res. 2014, 117, 1089–1110. [Google Scholar] [CrossRef]
- Biggs, B.; King, L.; Basu, S.; Suckler, D. Is wealthier always healthier? The impact of national income level, inequality and poverty on public health in Latin America. Soc. Sci. Med. 2010, 71, 266–273. [Google Scholar] [CrossRef]
- Huijts, T.; Monden, C.W.S.; Kraaykamp, G. Education, education hierogamy, and self-assessed health in Europe: A multilevel study of spousal effects in 29 countries. Eur. Sociol. Rev. 2010, 26, 261–276. [Google Scholar] [CrossRef]
- Deaton, A. Health, inequality, and economic development. J. Econ. Lit. 2003, 41, 113–158. [Google Scholar] [CrossRef]
- Dollar, D.; Kray, A. Growth is a good for the poor. Econ. J. 2002, 7, 195–225. [Google Scholar]
- Wilkinson, R.C.; Pickett, K.E. Income inequality and population health: A review and explanation of evidence. Soc. Sci. Med. 2006, 62, 1768–1784. [Google Scholar] [CrossRef]
- Hu, Y.; Van Lenthe, F.J.; Mackebach, J.P. Income inequality, life expectancy and cause-specific mortality in European countries, 1987–2008: A fixed effects study. Eur. J. Epidemiol. 2015, 30, 615–625. [Google Scholar] [CrossRef] [Green Version]
- Schwartzmann, L. Calidad de vida relacionada con la salud, aspectos conceptuales. Cienc. Enferm. 2003, 9, 9–21. [Google Scholar] [CrossRef] [Green Version]
- Tuesca-Molina, R.; Centeno, R.H.; Ossa, S.M.; García, D.N.; Lobo, L.J. Calidad de vida relacionada con la salud y determinantes sociodemográficos en adolescentes de Barranquilla (Colombia). Salud Uninorte. 2008, 24, 53–63. [Google Scholar]
- Dahlin, J.; Haärkönen, J. Cross-national differences in the gender gap in subjective health in Europe: Dose country level gender equality matter? Soc. Sci. Med. 2013, 98, 24–28. [Google Scholar] [CrossRef] [PubMed]
- Kühn, M.; Dudel, C.; Vogt, T.; Oksuzyan, A. Trends in gender differences in health at working ages among West and East Germans. SSM—Popul. Health 2019, 7, 100326. [Google Scholar] [CrossRef] [PubMed]
- Denton, M.; Prus, S.; Walters, V. Gender differences in health: A Canadian study of the psychosocial, structural and behavioural determinants of health. Soc. Sci. Med. 2004, 58, 2585–2600. [Google Scholar] [CrossRef] [Green Version]
- Hill, T.D.; Needham, B.L. Gender-specific trends in educational attainment and self-rated health, 1972–2002. Am. J. Public Health 2006, 96, 1288–1292. [Google Scholar] [CrossRef]
- Aguilar-Palacio, I.; Carrera-Lasfuentes, P.; Sánchez-Recio, R.; Alonso, J.P.; Rabanaque, M.J. Recession, employment and self-rated health: A study on the gender gap. Public Health 2018, 154, 44–50. [Google Scholar] [CrossRef]
- Delaruelle, K.; Buffe, V.; Bracke, P. The reversal of the gender gap in education: What does it mean for gender differences in the relationship between education and health. Eur. Sociol. Rev. 2018, 34, 629–644. [Google Scholar] [CrossRef]
- Sperlich, S.; Tetzlaff, J.; Geyer, S. Trends in good self-rated health in Germany between 1995 and 2014: Do age and gender matter? Int. J. Public Health 2019, 64, 921. [Google Scholar] [CrossRef]
- Debiasi, E. Age-Period-Cohort Analysis: A Summary of Analytical Approaches and Results; Centre for Economic Demography and Department of Economic History, Lund University: Lund, Sweden, 2018. [Google Scholar]
- Etherington, N. Re-evaluating gender differences in self-rated health: The importance of cohort. J. Women Aging 2017, 29, 150–162. [Google Scholar] [CrossRef]
- Calling, S. Longitudinal trends in good self-rated health: Effects of age and birth cohort in a 25-year follow-up study in Sweden. Int. J. Public Health 2015, 60, 363–373. [Google Scholar]
- Sacker, A.; Worts, D.; McDonough, P. Social influences on trajectories of self-rated health: Evidence from Britain, Germany, Denmark and the USA. J. Epidemiol. Community Health 2011, 65, 130–136. [Google Scholar] [CrossRef] [PubMed]
- Zack, M.M.; Moriarty, D.G.; Stroup, D.F.; Ford, E.S.; Mokdad, A.H. Worsening trends in adult health-related quality of life and self-rated health United States, 1993–2001. Public Health Rep. 2004, 119, 493–505. [Google Scholar] [CrossRef] [PubMed] [Green Version]
- Delaruelle, K.; Buffe, V.; Bracke, P. Educational expansion and the education gradient in health: A hierarchical age-period cohort analysis. Soc. Sci. Med. 2015, 145, 79–88. [Google Scholar] [CrossRef] [Green Version]
- Badley, E.M.; Canizares, M.; Perruccio, A.V.; Hogg-Johnson, S.; Gignac, M.A. Benefits Gained, Benefits Lost: Comparing Baby Boomers to Other Generations in a Longitudinal Cohort Study of Self-Rated Health. Milbank Q. 2015, 93, 40–72. [Google Scholar] [CrossRef] [PubMed] [Green Version]
- Jylhä, M.; Guralnik, J.M.; Ferruci, L.; Jokela, J.; Heikkinen, E. Is self-rated health comparable across cultures and genders? J. Gerontol. Ser. B Psychol. Sci. Soc. Sci. 1998, 53, 144–152. [Google Scholar] [CrossRef] [PubMed] [Green Version]
- Gorman, B.K.; Read, J.N.G. Gender disparities in adult health: An examination of three measures of morbidity. J. Health Soc. Behav. 2006, 47, 95–110. [Google Scholar] [CrossRef]
- Jezerska, Z. Gender awareness and the national machineries in the countries of Central and Eastern Europe. In M Shirin Mainstreaming Gender, Democratizing the State; Institutional Mechanisms for the Advancement of Women, Manchester University Press: Manchester, UK, 2018. [Google Scholar]
- Marmot, M.; Allen, J.; Bell, R.; Bloomer, E.; Goldblatt, P. WHO European review of social determinants of health and the health divide. Lancet 2012, 380, 1011–1029. [Google Scholar] [CrossRef]
- EUROSTAT. Questionaire of the European Health Interview Survey. 2016. Available online: http://ec.europa.eu/eurostat/web/microdata/european-health-interview-survey (accessed on 18 January 2022).
- Lancaster, L.C.; Stillman, D. When Generations Collide: How to Solve the Generational Puzzle at Work; Management Forum Series; Harper Business: Barcelona, Spain, 2004. [Google Scholar]
- Pinilla, J.; González, B.; Barber, P.; Santana, Y. Smoking in young adolescents: An approach with multilevel discrete choice models. J. Epidemiol. Community Health 2002, 56, 227–232. [Google Scholar] [CrossRef] [Green Version]
- European Commision. Health Inequalities in the EU. Final Report of the Consortium. Consortium Leader: Sir Michael Marmot; European Commision Directorate General for Health and Consumers: Geneva, Switzerland, 2013. [Google Scholar]
- Oppenheimer, L. The Surprise Origin of Women’s Mental Load. Available online: https://www.brighthorizons.com/employer-resources/mental-load-starts-at-the-office (accessed on 30 January 2022).
- Gerstel, N. The Third Shift: Gender and Care Work Outside Home. Qual. Soc. 2020, 23, 4. [Google Scholar]
- Santhost, L.; Keetnan, B.P.; Jain, S. The “Third Shift”: A Path Forward to Recognizing and Funding Gender Equity Efforts. J. Womens Health 2020, 29, 1359–1360. [Google Scholar] [CrossRef]
- Eikemo, T.A.; Bambra, C.; Judge, K.; Ringdal, K. Welfare state regimes and differences in self-perceived health in Europe: A multilevel analysis. Soc. Sci. Med. 2008, 66, 2281–2295. [Google Scholar] [CrossRef] [PubMed] [Green Version]
- Deacon, B.; Deacon, B. Eastern European welfare states: The impact of the politics of globalization. J. Eur. Soc. Policy 2000, 10, 146–161. [Google Scholar] [CrossRef]
- Guarnizo-Herreño, C.; Watt, R.G.; Stafford, M.; Sheiham, A.; Tsakos, G. Do welfare regimes matter for oral health? A multilevel analysis of European countries. Health Place 2017, 46, 65–72. [Google Scholar] [CrossRef] [PubMed]
- Obrizan, M. Quantifying the gap in self-rated health for transition countries over 1989–2014. Comp. Econ. Stud. 2018, 60, 388–409. [Google Scholar] [CrossRef]
- Gómez-Costilla, P.; García-Prieto, C.; Somarriba-Arechavala, N. Aging and Gender Health Gap: A Multilevel Analysis for 17 European Countries. Soc. Indic. Res. 2021, 4, 1–19. [Google Scholar] [CrossRef]
- Costanza, R.; Kubiszewski, I.; Giovannini, E.; Lovins, H.; McGlade, J.; Pickett, K.E.; Ragnarsdóttir, K.V.; Roberts, D.; De Vogli, R.; Wilkinson, R. Time to leave GDP behind. Nature 2014, 505, 283–285. [Google Scholar] [CrossRef] [PubMed] [Green Version]
- Subramanian, S.V.; Huijts, T.; Avendano, M. Self-reported health assessments in the 2002 World Health Survey: How do they correlate with education? Bull. World Health Organ. 2010, 88, 131–138. [Google Scholar] [CrossRef]
- Tom, S.; Clark, A.; Linzer, A. Should I Use Fixed or Random Effects? Political Sci. Res. Methods 2015, 3, 399–400. [Google Scholar]
- Snijders, T.A.B. Power and Sample Size in Multilevel Linear Models. In Encyclopedia of Statistics in Behavioral Science; Everitt, B.S., Howell, D.C., Eds.; Wiley: Chicester, UK, 2005; Volume 3, pp. 1570–1573. [Google Scholar]


| Variable | Sample by Generation Cohort and Gender | |||||||
|---|---|---|---|---|---|---|---|---|
| Silent Generation (1921–1946) | Baby Boom (1945–1964) | X Generation (1965–1980) | Y Generation (1981–1990) | |||||
| Men | Women | Men | Women | Men | Women | Men | Women | |
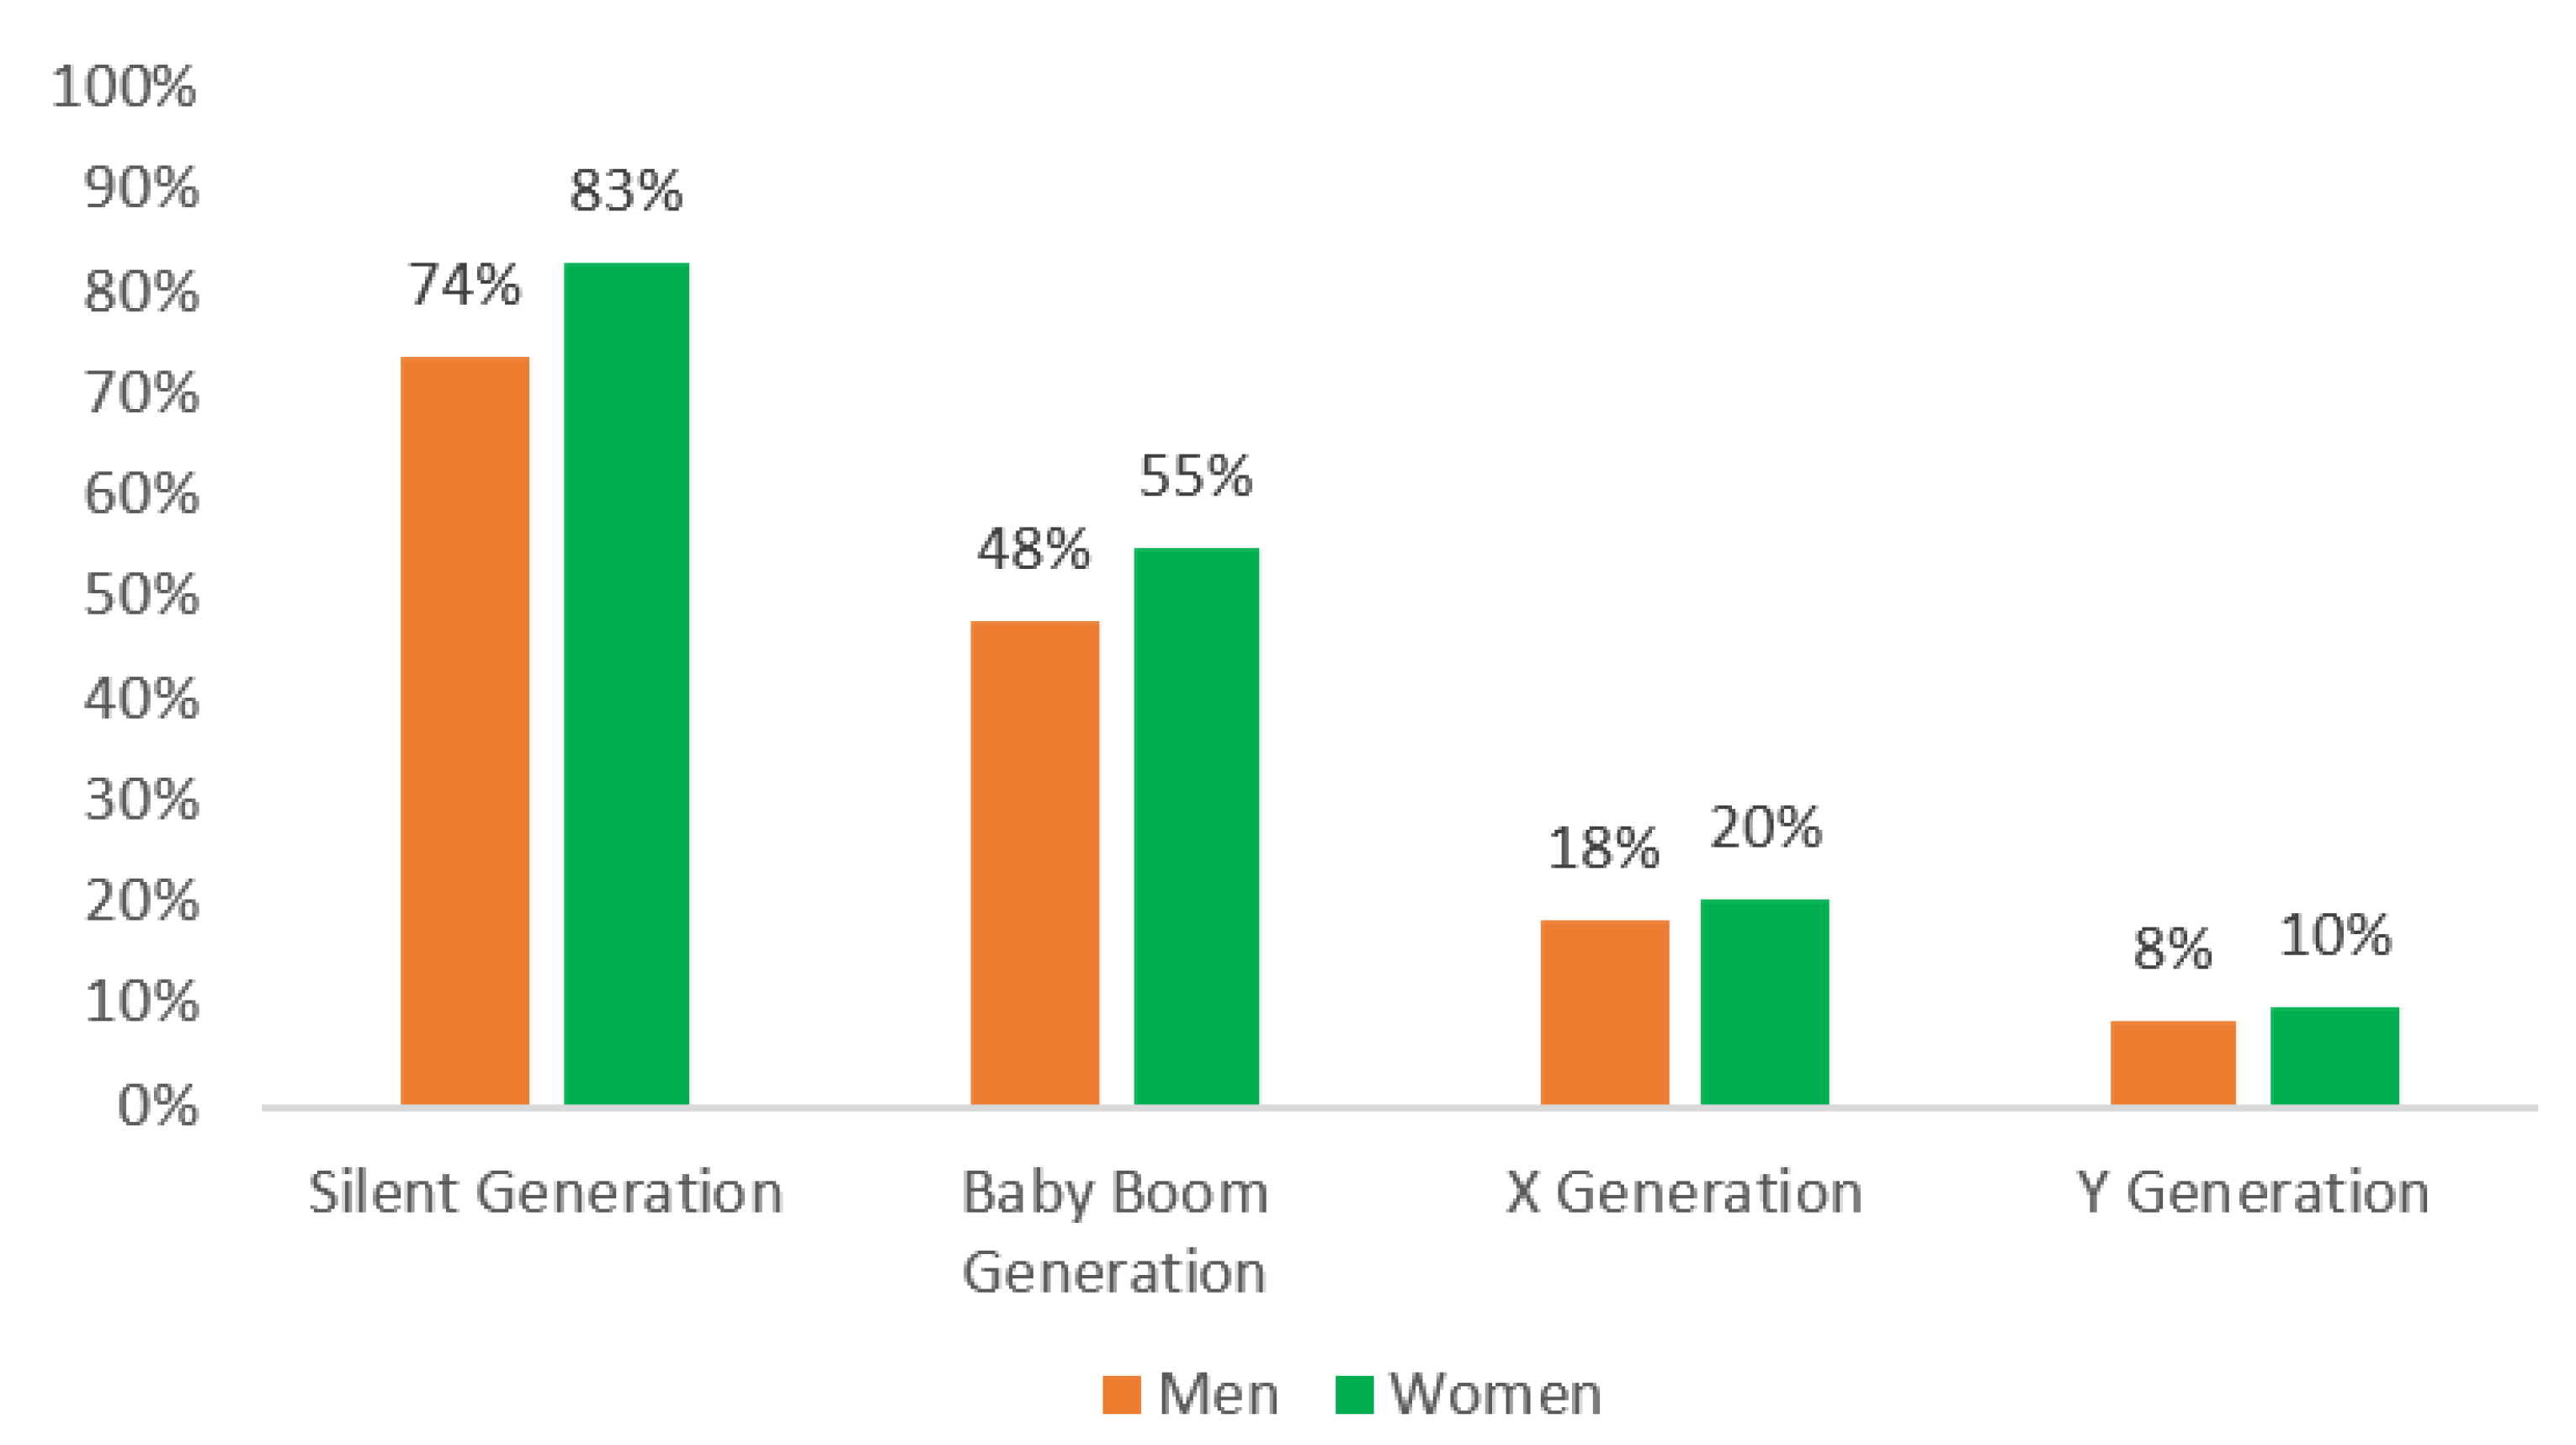
| Low self-rated health | 74% | 83% | 48% | 55% | 18% | 20% | 8% | 10% |
| Age (mean) | 73.1 | 74.0 | 54.2 | 54.5 | 36.9 | 36.8 | 21.8 | 21.8 |
| Married | 74% | 36% | 80% | 70% | 70% | 74% | 13% | 23% |
| Single | 3% | 3% | 9% | 5% | 25% | 15% | 86% | 75% |
| Widow | 20% | 57% | 3% | 15% | 1% | 2% | 0% | 0% |
| Divorced/separated | 4% | 4% | 8% | 10% | 5% | 9% | 0% | 1% |
| Low Education | 30% | 45% | 10% | 13% | 6% | 5% | 8% | 8% |
| Intermediate | 59% | 49% | 78% | 73% | 78% | 71% | 81% | 76% |
| High Education | 11% | 7% | 12% | 14% | 17% | 24% | 11% | 17% |
| Employed | 4% | 3% | 63% | 46% | 89% | 76% | 46% | 36% |
| Unemployed | 0% | 0% | 7% | 5% | 7% | 8% | 9% | 8% |
| Student | 0% | 0% | 0% | 0% | 0% | 0% | 43% | 46% |
| Pensioner | 95% | 92% | 29% | 39% | 3% | 2% | 1% | 1% |
| Homemaker | 0% | 3% | 0% | 8% | 0% | 13% | 0% | 8% |
| Other | 0% | 2% | 1% | 2% | 0% | 1% | 1% | 1% |
| Daily smoker | 14% | 4% | 36% | 19% | 37% | 20% | 24% | 13% |
| Overweight | 60% | 57% | 64% | 57% | 55% | 33% | 26% | 12% |
| Sedentarism | 35% | 40% | 20% | 26% | 13% | 20% | 18% | 28% |
| Country | Survey Year | Gini 1 | Gini 2 | GDP 3 | GDP 2 |
|---|---|---|---|---|---|
| Bulgaria | 2008 | 30.35 | 2 | 4.9 | 1 |
| Czech Republic | 2008 | 25.15 | 1 | 14.1 | 3 |
| Hungary | 2009 | 25.95 | 2 | 9.3 | 2 |
| Latvia | 2008 | 37.7 | 3 | 11.2 | 2 |
| Poland | 2009 | 30.9 | 3 | 8.2 | 1 |
| Romania | 2008 | 34.9 | 3 | 6.9 | 1 |
| Slovenia | 2007 | 23.43 | 1 | 11.8 | 3 |
| Slovakia | 2009 | 25.45 | 1 | 17.4 | 3 |
| Silent Generation | Baby Boomers | X Generation | Y Generation | |||||
|---|---|---|---|---|---|---|---|---|
| Men | Women | Men | Women | Men | Women | Men | Women | |
| Fixed Effects | ||||||||
| Age | 0.555 *** | 0.581 *** | 0.615 *** | 0.368 *** | −0.418 ** | 0.320 ** | −0.141 | 0.219 |
| Age2 | −0.003 *** | −0.004 *** | −0.005 *** | −0.003 *** | 0.007 *** | −0.003 | 0.004 | −0.004 |
| Married a | -- | -- | -- | -- | -- | -- | -- | -- |
| Single | −0.257 | 0.015 | 0.151 ** | −0.059 | −0.032 | 0.027 | 0.068 | 0.196 |
| Widow | −0.058 | 0.105 * | −0.079 | 0.076 | 0.850 ** | 0.362 ** | 1.552 ** | −0.071 |
| Divorced/separated | −0.052 | −0.144 | 0.063 | −0.016 | 0.037 | 0.160 * | −0.585 | 0.980 |
| Low Education | 0.934 *** | 1.026 *** | 1.095 *** | 1.266 *** | 0.772 *** | 0.964 *** | 0.712 *** | 0.752 |
| Intermediate | 0.547 *** | 0.741 *** | 0.711 *** | 0.722 *** | 0.544 *** | 0.498 *** | 0.366 ** | 0.302 |
| High Education a | -- | -- | -- | -- | -- | -- | -- | -- |
| Employed a | -- | -- | -- | -- | -- | -- | -- | -- |
| Unemployed | 0.992 | 1.112 | 0.563 *** | 0.547 *** | 0.675 *** | 0.561 *** | 0.249 * | 0.173 |
| Student | 0.471 | 2.419 ** | 0.695 | 0.289 | −0.782 | 0.159 | −0.349 ** | −0.061 |
| Pensioner | 0.886 *** | 0.803 *** | 1.473 *** | 1.145 *** | 3.754 *** | 3.008 *** | 4.239 *** | 3.965 |
| Homemaker | 0.954 | 0.610 *** | 0.759 * | 0.337 *** | 0.949 ** | 0.181 ** | 0.610 | 0.072 |
| Other | 0.302 | 0.277 | 1.166 *** | 0.836 *** | 1.613 *** | 0.151 | 0.877 ** | −0.245 |
| Daily smoker | −0.172 ** | −0.034 | −0.032 | 0.011 | 0.109 * | 0.313 *** | 0.190 * | 0.500 |
| Overweight | −0.068 | 0.278 *** | −0.042 | 0.260 *** | 0.026 | 0.359 *** | 0.043 | 0.216 |
| Sedentarism | 0.644 *** | 0.398 *** | 0.377 *** | 0.137 *** | 0.344 *** | 0.063 | 0.639 *** | 0.111 |
| Intercept | −22.772 *** | −23.498 *** | −18.393 *** | −11.473 *** | 4.038 | −9.741 *** | −1.883 | −5.574 |
| Random Effects | ||||||||
| σ | 0.570 | 0.443 | 0.486 | 0.554 | 0.570 | 0.494 | 0.606 | 0.419 |
| Prob > chibar2 | 0.00 | 0.00 | 0.00 | 0.00 | 0.00 | 0.00 | 0.00 | 0.00 |
| Silent Generation | Baby Boomers | X Generation | Y Generation | |||||||||
|---|---|---|---|---|---|---|---|---|---|---|---|---|
| Gini T1 | Gini T2 | Gini T3 | Gini T1 | Gini T2 | Gini T3 | Gini T1 | Gini T2 | Gini T3 | Gini T1 | Gini T2 | Gini T3 | |
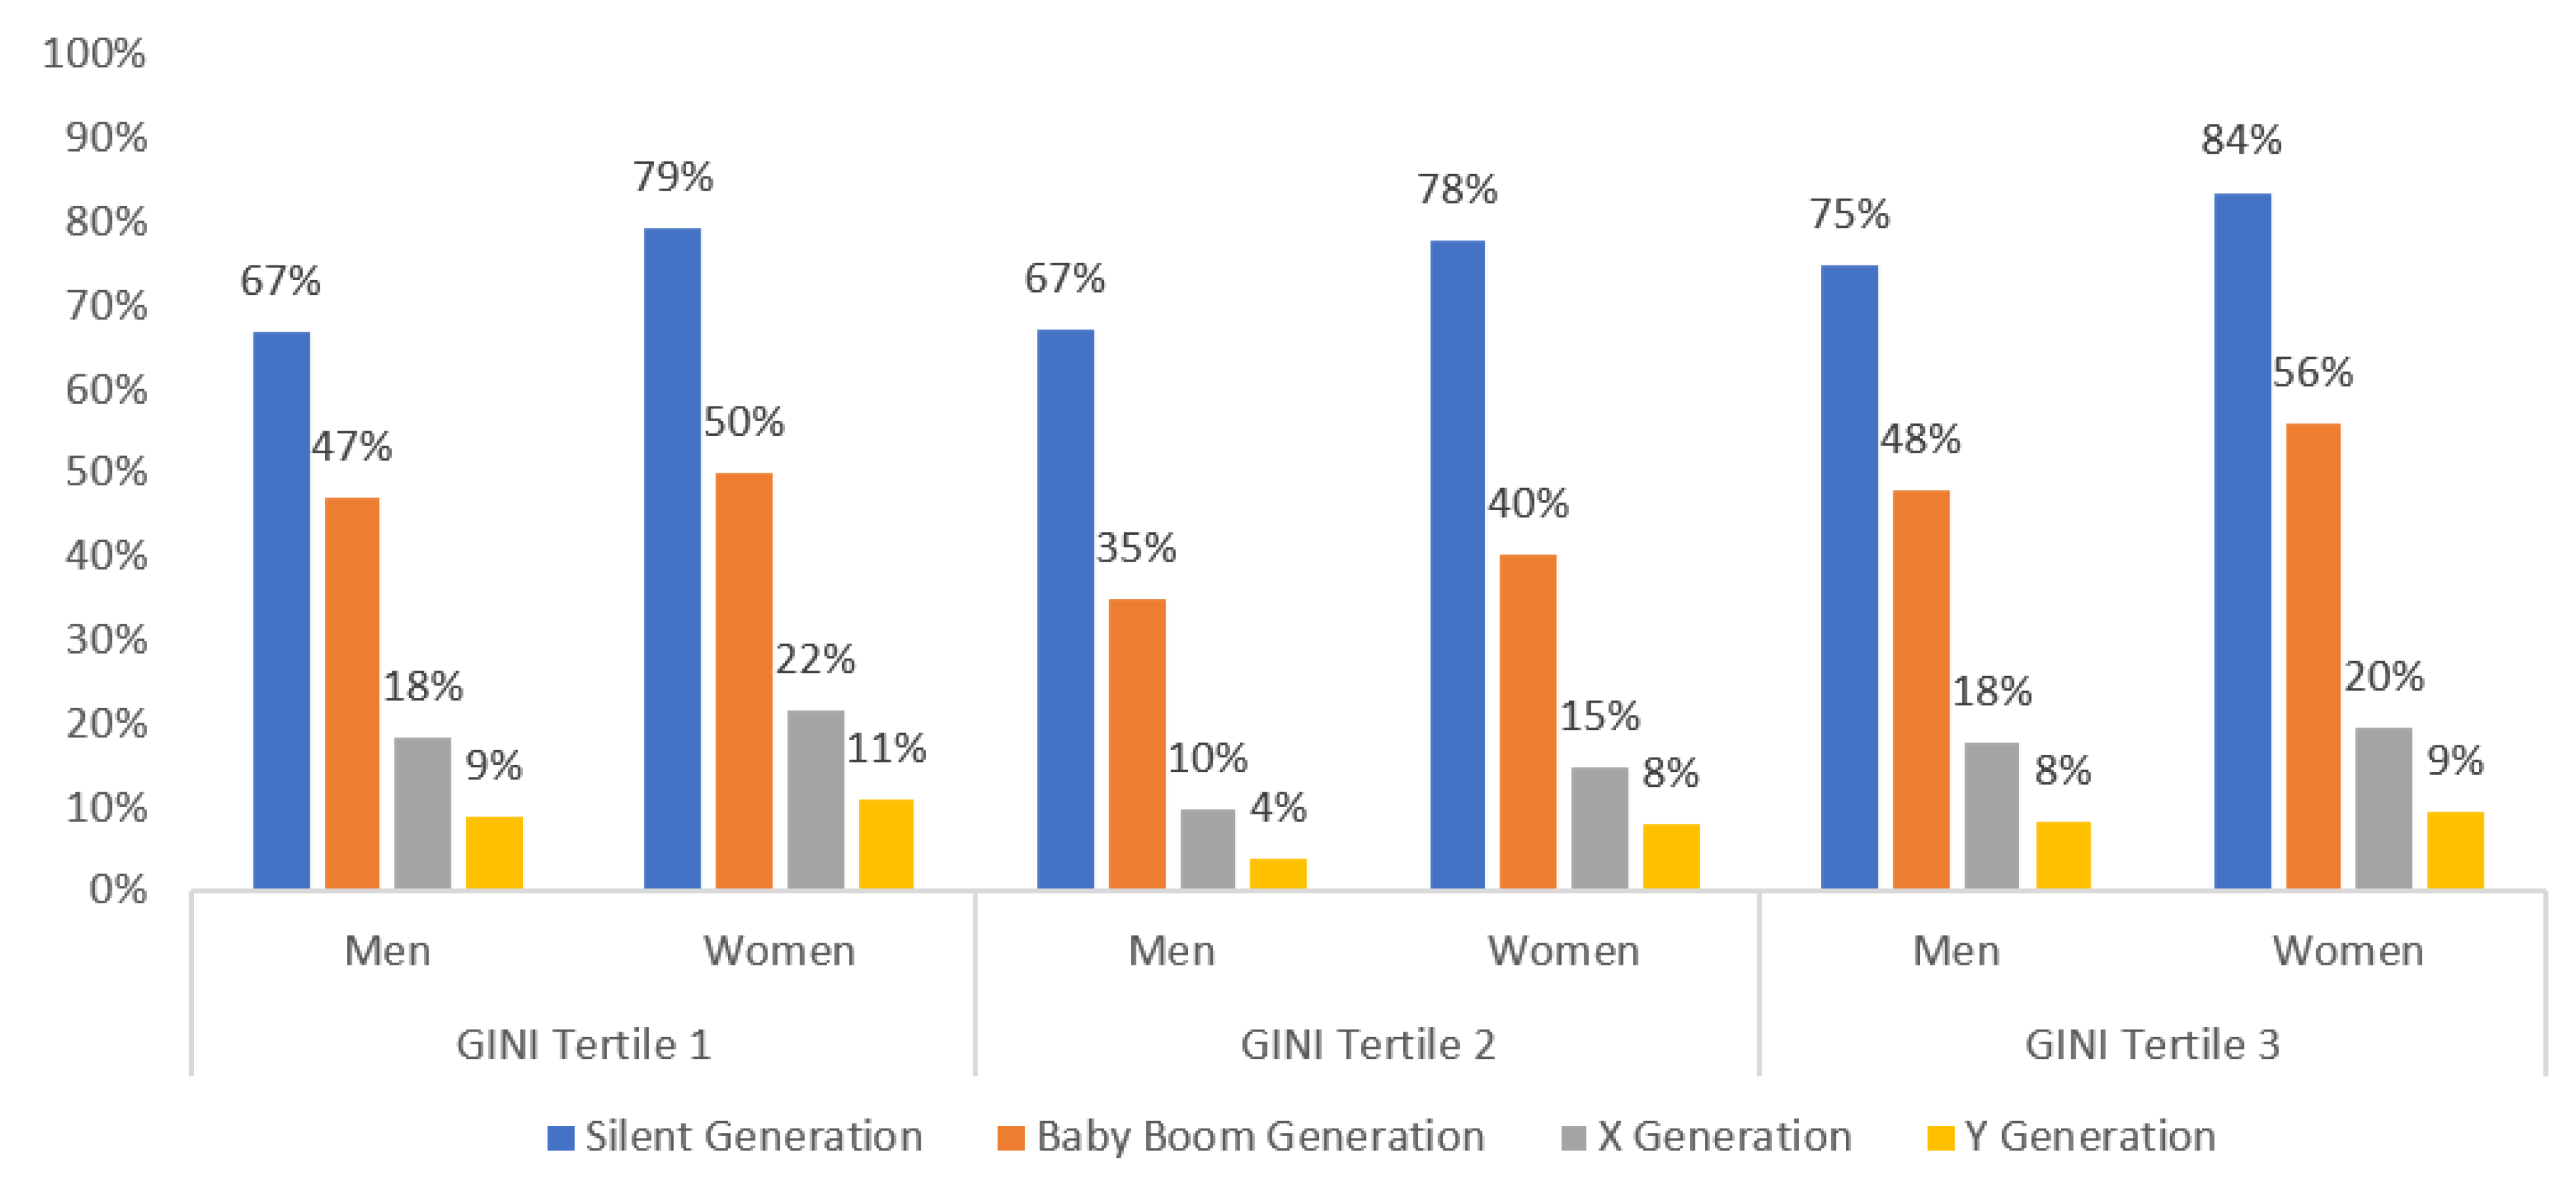
| Men | 0.669 *** | 0.671 *** | 0.750 *** | 0.472 *** | 0.350 *** | 0.480 *** | 0.184 *** | 0.085 *** | 0.179 *** | 0.091 *** | 0.026 *** | 0.084 *** |
| Women | 0.792 *** | 0.780 *** | 0.836 *** | 0.500 *** | 0.403 *** | 0.559 *** | 0.217 *** | 0.149 *** | 0.196 *** | 0.104 *** | 0.080 *** | 0.094 *** |
| Difference | −0.122 *** | −0.109 *** | −0.087 *** | −0.028 | −0.054 *** | −0.080 *** | −0.034 ** | −0.065 *** | −0.017 *** | −0.014 | −0.054 *** | −0.010 ** |
| Endowment | −0.057 *** | −0.053 *** | −0.018 *** | −0.042 *** | −0.015 | −0.020 *** | 0.034 *** | −0.041 *** | 0.033 *** | 0.012 | −0.008 | 0.013 *** |
| Coefficients | −0.066 *** | −0.069 *** | −0.068 *** | 0.009 | 0.020 | −0.027 ** | −0.009 | −0.044 * | −0.002 | −0.017 | −0.057 *** | −0.004 |
| Interaction | 0.000 | 0.014 | −0.001 | 0.006 | −0.059 *** | −0.034 *** | −0.059 *** | 0.020 | −0.047 *** | −0.009 | 0.012 | −0.019 * |
Publisher’s Note: MDPI stays neutral with regard to jurisdictional claims in published maps and institutional affiliations. |
© 2022 by the authors. Licensee MDPI, Basel, Switzerland. This article is an open access article distributed under the terms and conditions of the Creative Commons Attribution (CC BY) license (https://creativecommons.org/licenses/by/4.0/).
Share and Cite
Gil-Lacruz, M.; Gil-Lacruz, A.I.; Navarro-López, J.; Aguilar-Palacio, I. Gender Gap in Self-Rated Health: A Cohort Perspective in Eastern European Countries. Healthcare 2022, 10, 365. https://doi.org/10.3390/healthcare10020365
Gil-Lacruz M, Gil-Lacruz AI, Navarro-López J, Aguilar-Palacio I. Gender Gap in Self-Rated Health: A Cohort Perspective in Eastern European Countries. Healthcare. 2022; 10(2):365. https://doi.org/10.3390/healthcare10020365
Chicago/Turabian StyleGil-Lacruz, Marta, Ana Isabel Gil-Lacruz, Jorge Navarro-López, and Isabel Aguilar-Palacio. 2022. "Gender Gap in Self-Rated Health: A Cohort Perspective in Eastern European Countries" Healthcare 10, no. 2: 365. https://doi.org/10.3390/healthcare10020365