
InterCriteria Analysis: Application for ECG Data Analysis


Abstract
:1. Introduction
2. Materials and Methods
2.1. ECG Criteria
- -
- Group 1: 19 criteria based on heartbeat and rhythm evaluation in the time domain, including:
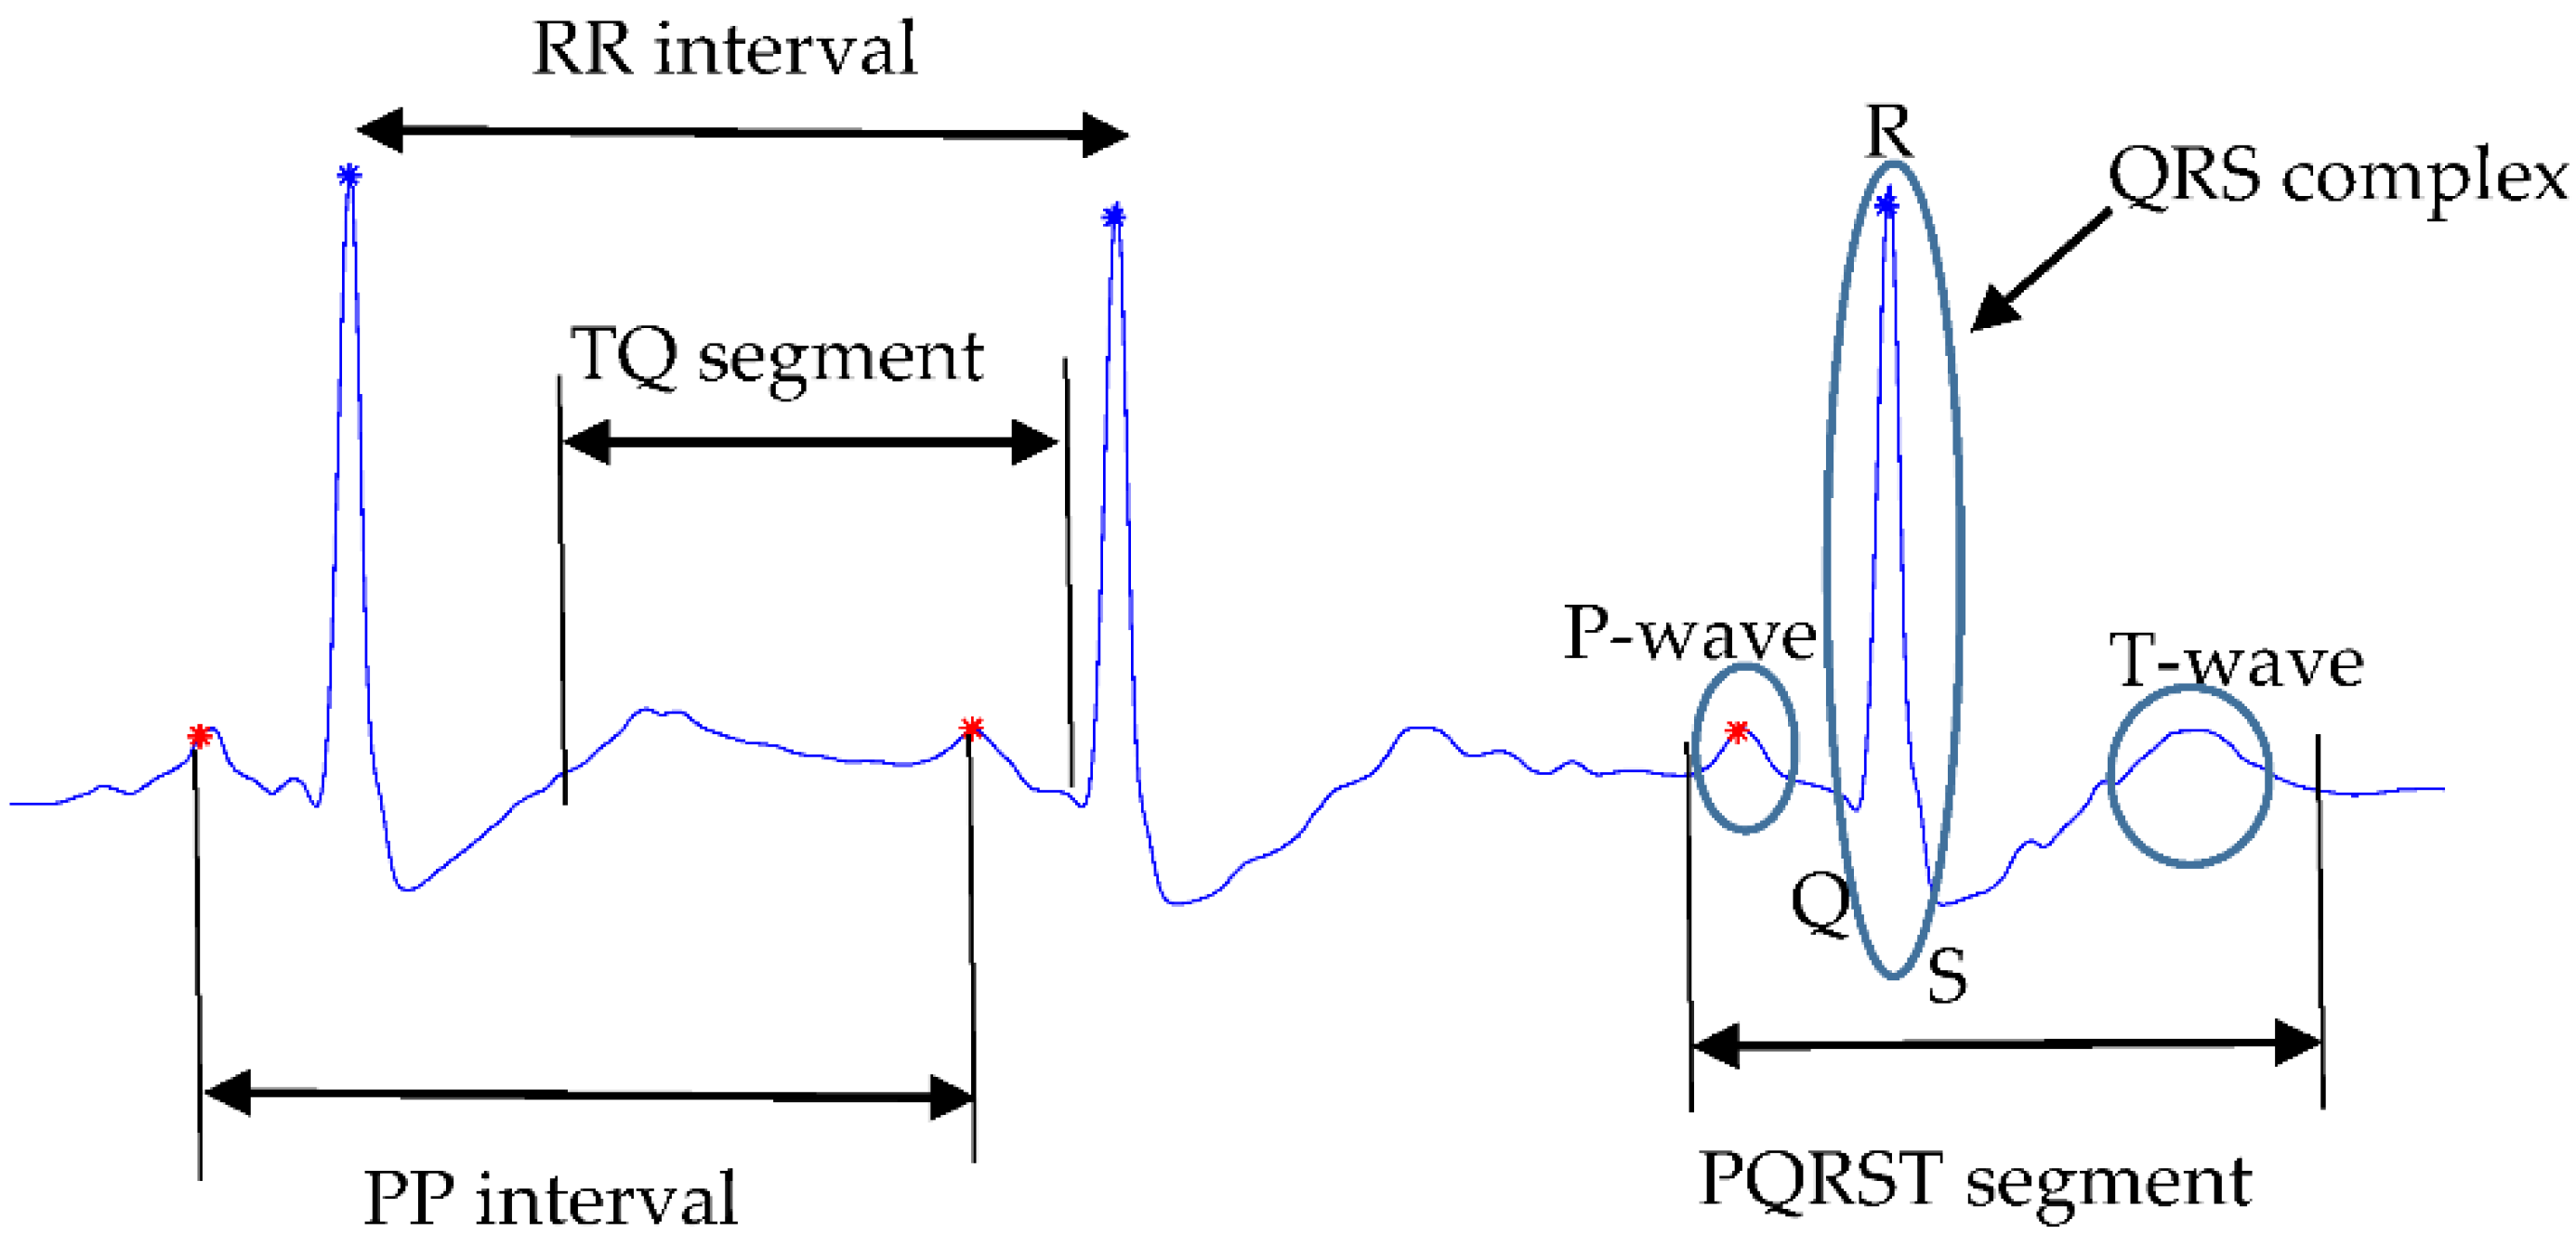
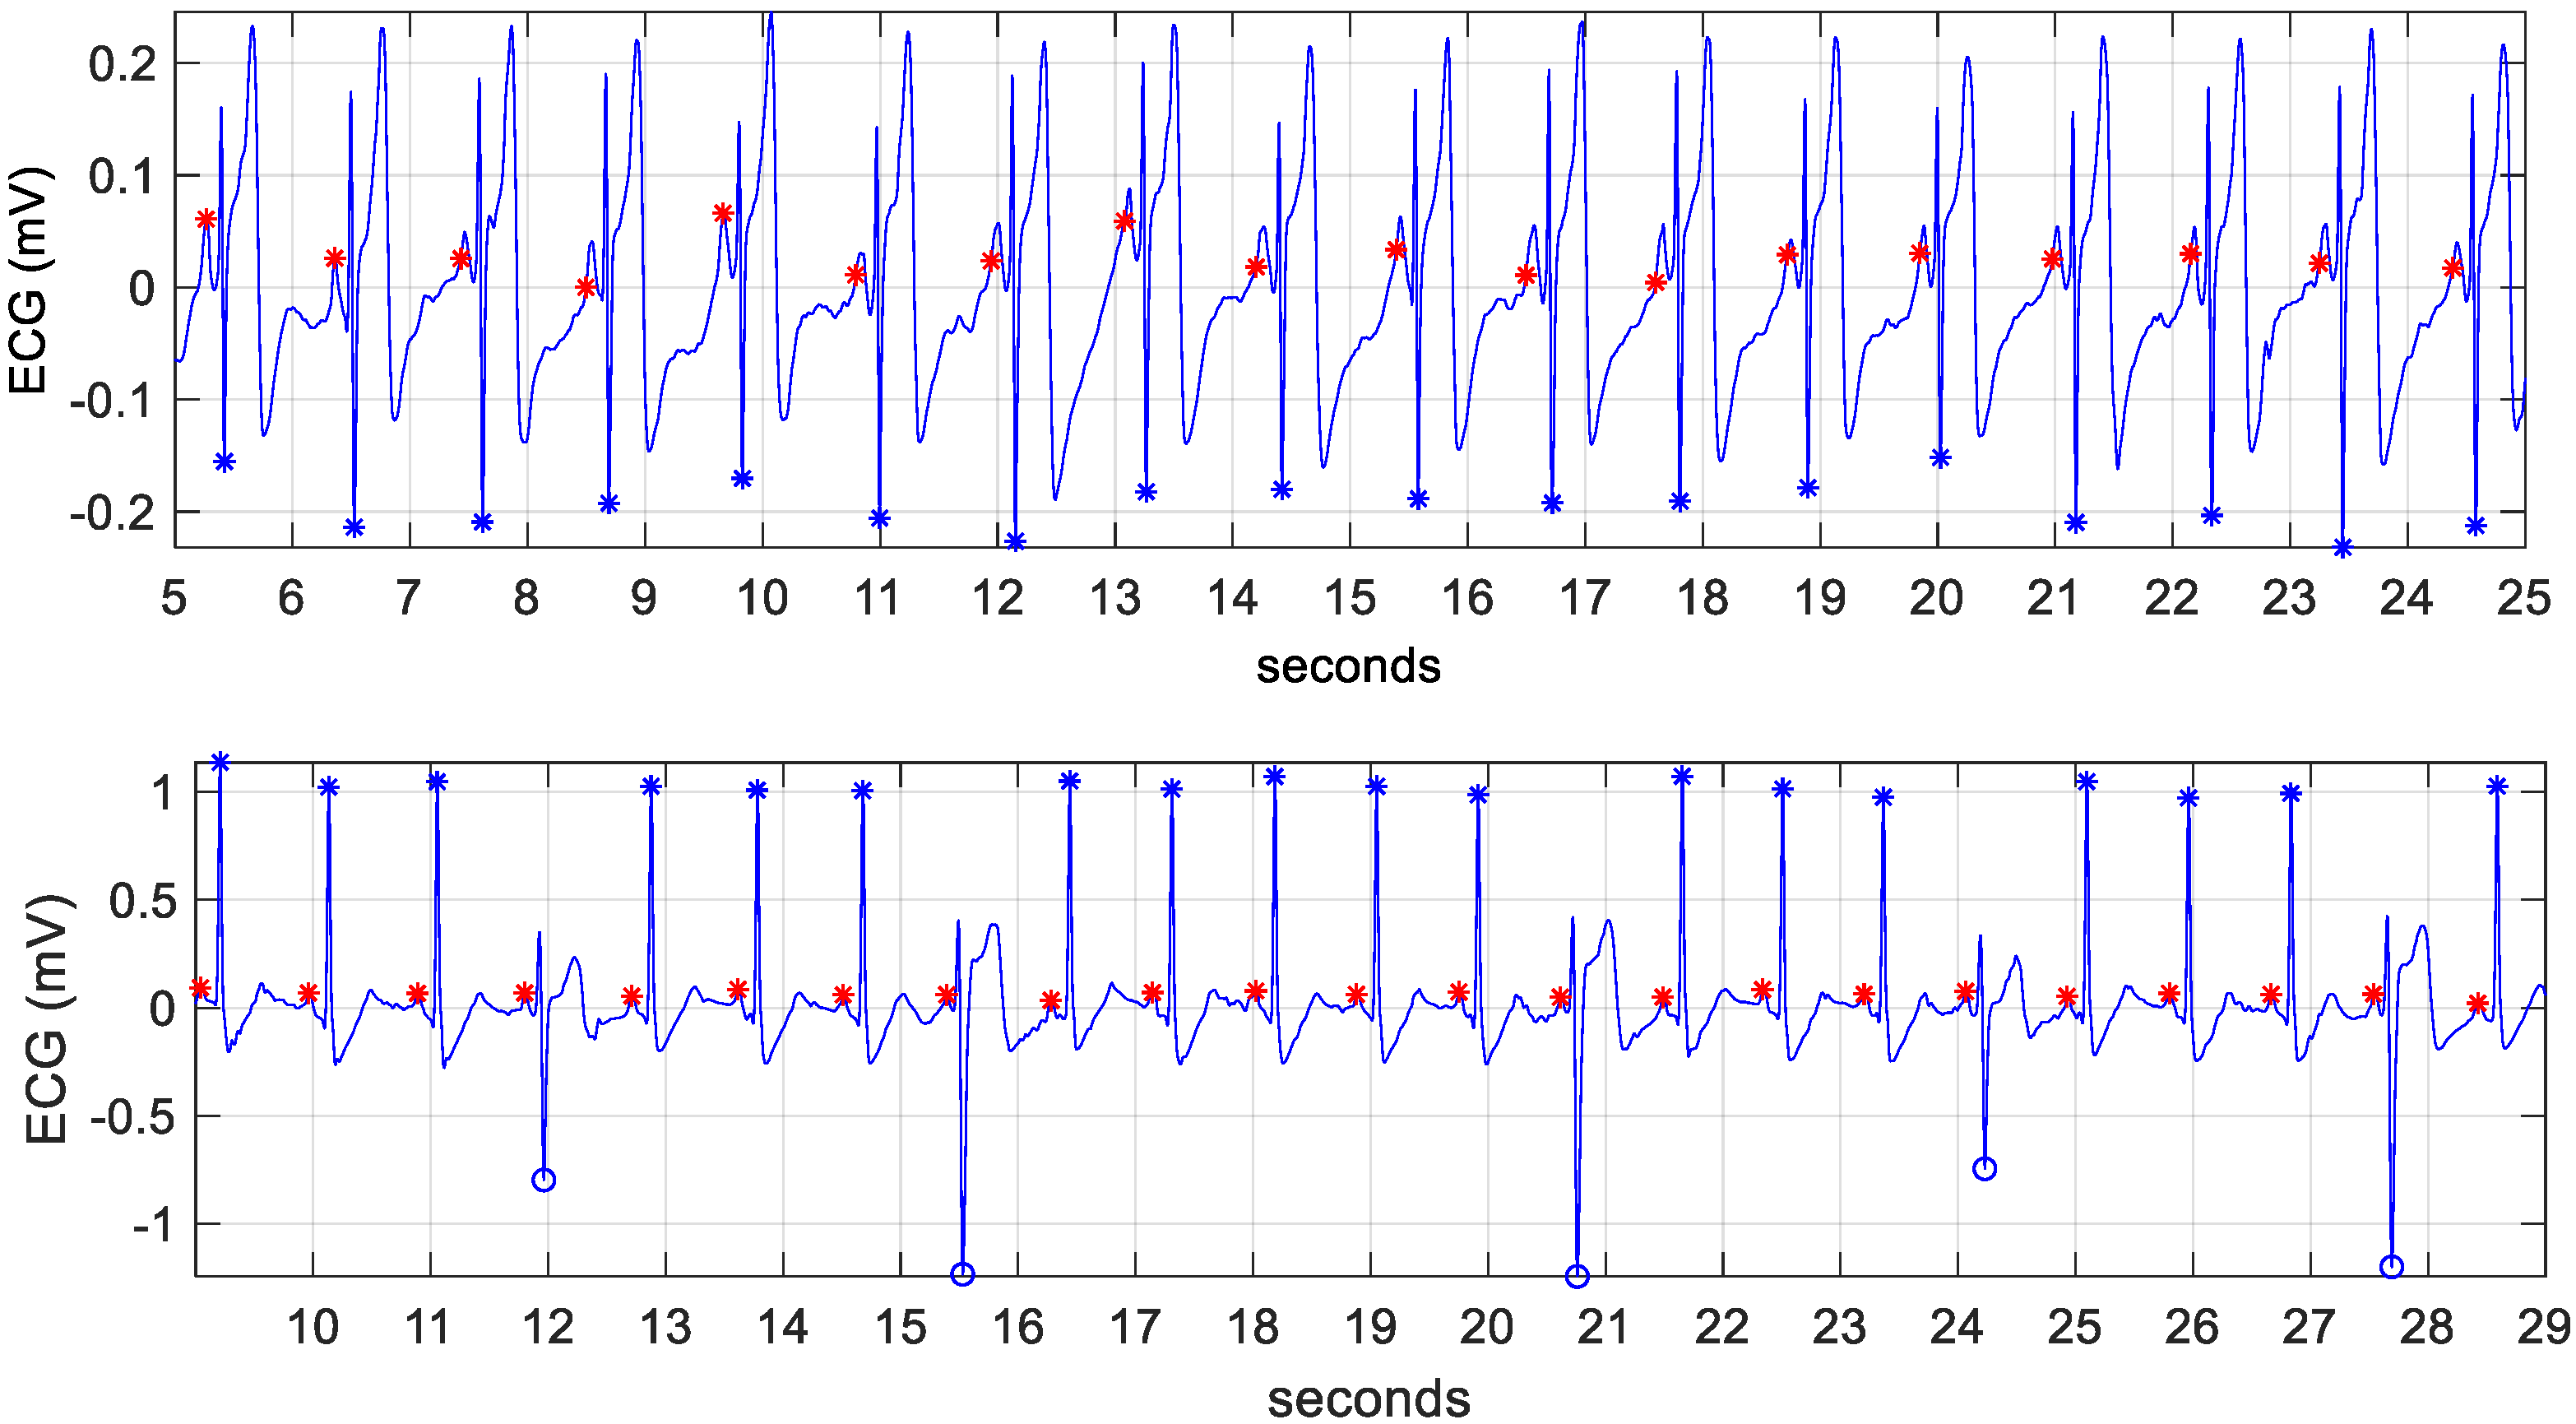
- Mean, minimal, maximal values and standard deviation of the QRS amplitudes in the analyzed ECG segment. These criteria are calculated once for all beats (MeanAmpVB, MinAmpVB, MaxAmpVB, StdAmpVB—Figure 2, blue asterisks and circles) and a second time only for the normal ventricular beats (MeanAmpN, MinAmpN, MaxAmpN, StdAmpN—Figure 2, only the blue asterisks);
- Mean, minimal, maximal values and standard deviation of the RR intervals in the analyzed ECG segment. They are also calculated once for all beats (MeanRRVB, MinRRVB, MaxRRVB, StdRRVB) and a second time only for the normal ventricular beats (MeanRRN, MinRRN, MaxRRN, StdRRN);
- N beats proportion, which is calculated as the ratio between the number of normal heartbeats and the total number of beats detected in the analyzed ECG segment (NBeats(%));
- Probability the rhythm to be atrial fibrillation/flutter based on assessment of the RR irregularity (AF(%));
- ECG segments complexity (C_ECG).
- -
- Group 2: 11 criteria based on evaluation of the P-waves (marked with red asterisks in Figure 2) in the time domain that provide information about the stability of the detected atrial contractions, including:
- Mean, minimal, maximal values and standard deviation of the P-waves amplitudes and the intervals between consecutive P-waves within the analyzed ECG segment (MeanAmpP, MinAmpP, MaxAmpP, StdAmpP, MeanPPint, MinPPint, MaxPPint, StdPPint);
- Mean value and standard deviation of the P-waves number in each RR interval (MeanPcountRRint, StdPcountRRint);
- Percentage of RR intervals with two or more detected P-waves (DoubleP(%)).
- -
- Group 3: 6 Principal Component Analysis (PCA)-based criteria used for assessment of the ECG beat-to-beat irregularity in one ECG signal, including:
- Mean, minimal, maximal values and range of the standard deviation between the samples of all PQRST segments in one ECG recording and the corresponding samples of the PQRST first PCA vector (MeanStdPQRST, MinStdPQRST, MaxStdPQRST, RangeStdPQRST);
- Mean deviation between the samples of all TQ segments in one ECG recording and the corresponding samples of the TQ first PCA vector (MeanStdTQ);
- QRS width measured from the first PCI vector of the PQRST segment (WidthQRS).
- -
- Group 4: 9 criteria describing the TQ segment in the time domain:
- TQ segments complexity (C);
- Mean, minimal, maximal values and standard deviation of the leakage, calculated for individual TQ segments (MeanLeak_TQ, MinLeak_TQ, MaxLeak_TQ, StdLeak_TQ);
- Mean, minimal, maximal values and standard deviation of the period (T), measured for individual TQ segments (MeanT_TQ, MinT_TQ, MaxT_TQ, StdT_TQ).
- -
- Group 5: 44 criteria describing the TQ segment in the frequency domain, including:
- Mean, minimal, maximal values and standard deviation of the dominant frequency in 4s non-overlapping intervals (MeanDF, MinDF, MaxDF, StdDF);
- Mean, minimal, maximal values and standard deviation of the regularity index, which quantifies the sharpness of the dominant peak in the spectra (MeanRI, MinRI, MaxRI, StdRI);
- Mean, minimal, maximal values and standard deviation of the first spectral normalized moment (MeanFSNM, MinFSNM, MaxFSNM, StdFSNM);
- Mean, minimal, maximal values and standard deviation of the spectral width at 4 different levels (0.2, 0.4, 0.6, 0.8) of the maximum power in the range 3 ÷ 15 Hz (MeanSpecWidth_level, MinSpecWidth_level, MaxSpecWidth_level, StdSpecWidth_level);
- Mean, minimal, maximal values and standard deviation of the spectral area between the first and the last cross of 4 different levels (0.2, 0.4, 0.6, 0.8) of the maximum power in the range 3 ÷ 15 Hz (MeanSpecArea_level, MinSpecArea_level, MaxSpecArea_level, StdSpecArea_level);
2.2. InterCriteria Analysis
| C1 | … | Ck | … | Cn | |
| O1 | … | … | |||
| … | … | … | … | … | … |
| Oi | … | … | |||
| … | … | … | … | … | … |
| Om | … | … |
- -
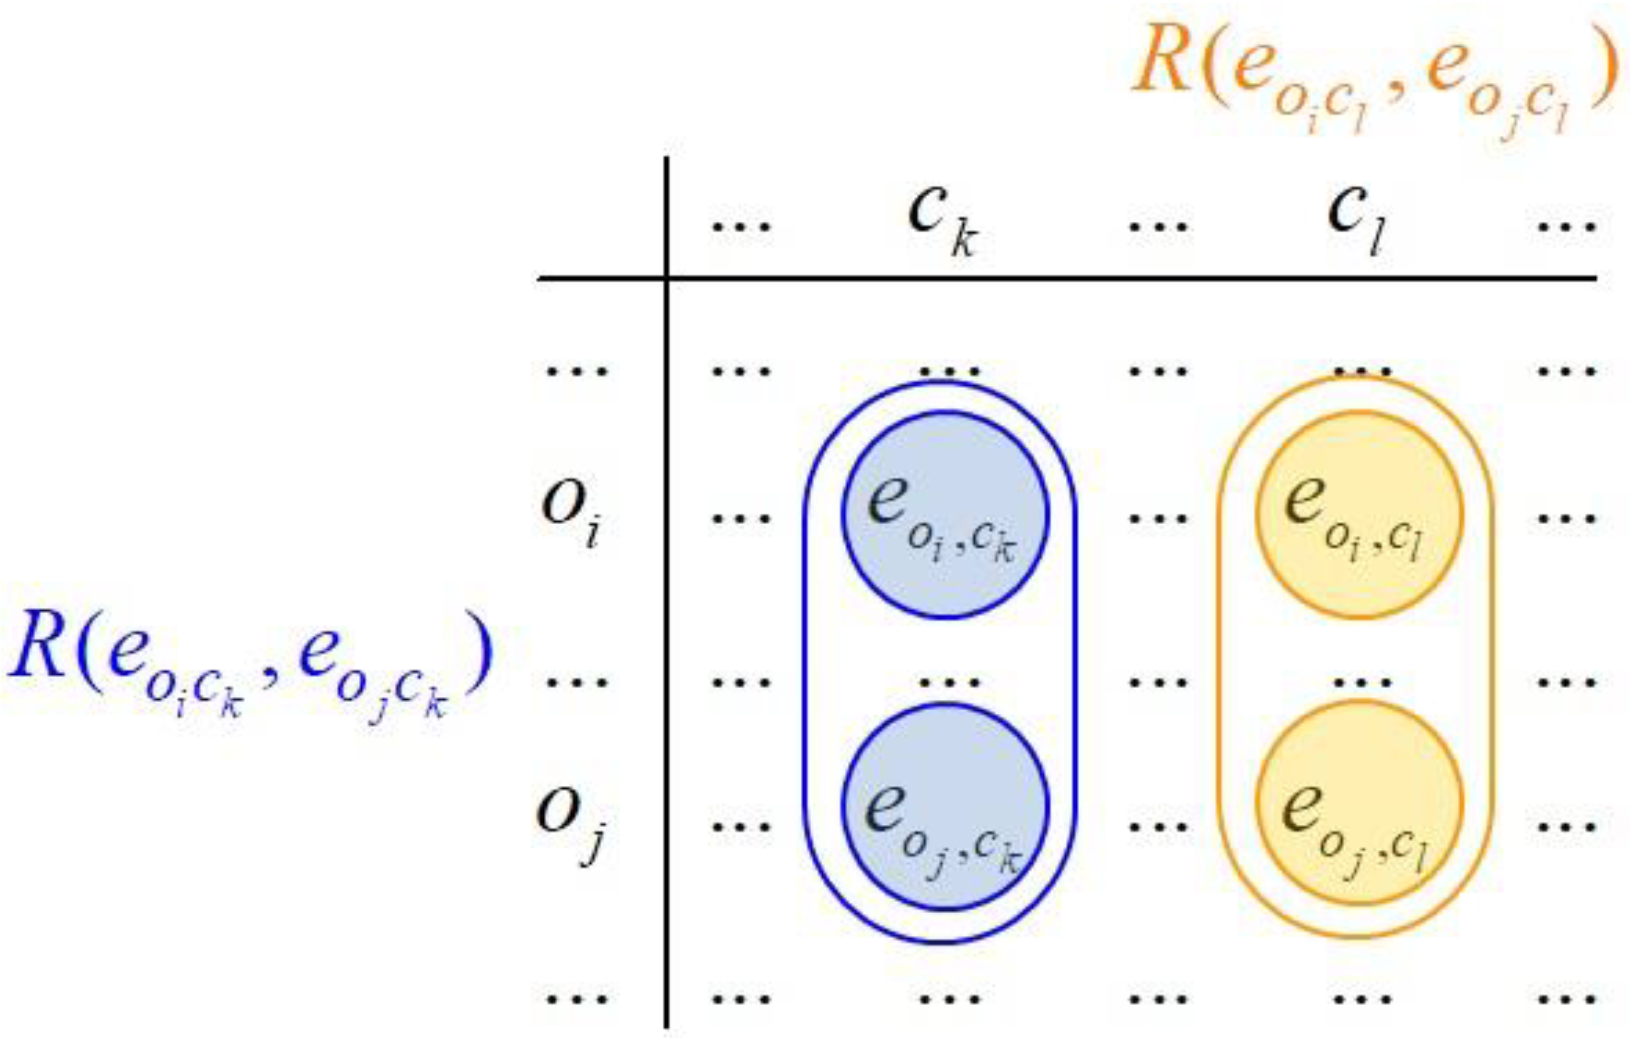
- is the number of cases, in which the relations and (or the relations and ) are simultaneously satisfied.
- -
- is the number of cases, in which the relation and (or the relations and ) are simultaneously satisfied.
- which, in terms of ICrA, is known as degree of agreement, and
- , known as degree of disagreement.
| C1 | … | Ck | … | Cn | |
| C1 | … | … | |||
| … | … | … | … | … | … |
| Ck | … | … | |||
| … | … | … | … | … | … |
| Cn | … | … |
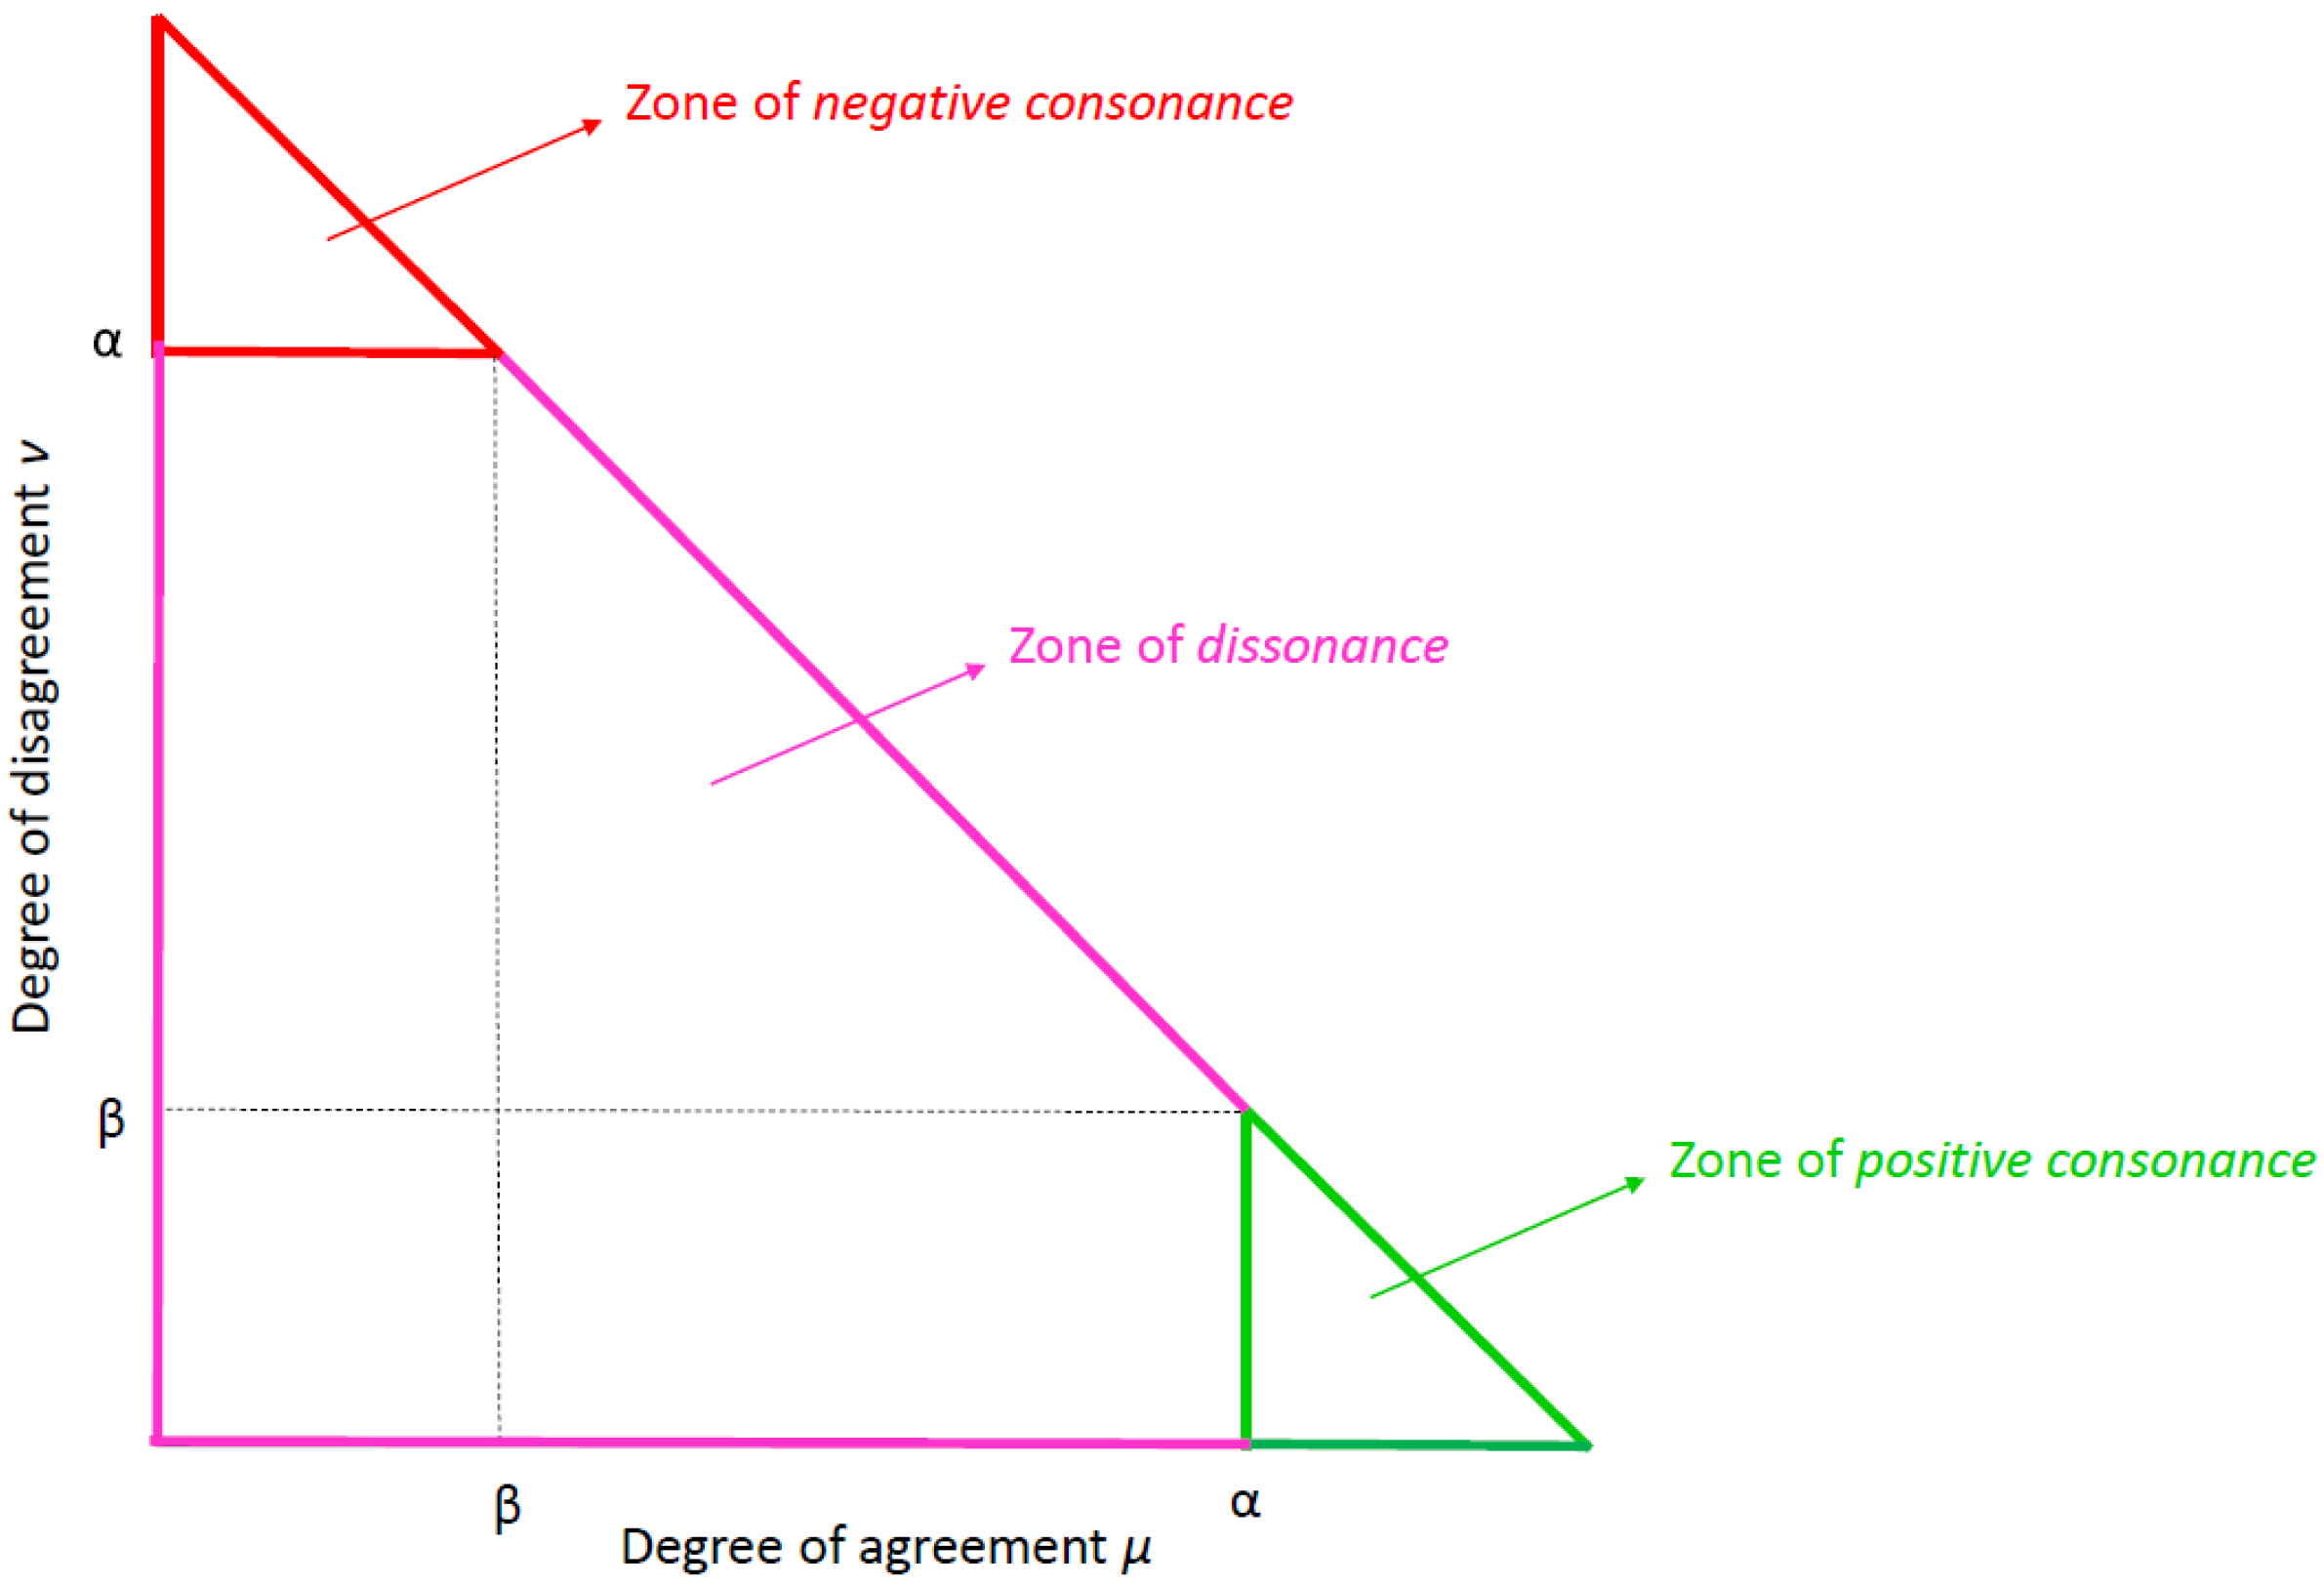
- positive consonance, if > α and < β;
- negative consonance, if < β and > α;
- dissonance, otherwise.
3. Results
- µ ≥ 0.95—showing an extremely high degree of agreement between two criteria, presenting them as criteria of strong positive consonance [2];
- µ ≥ 0.85—showing a high degree of agreement between two criteria, presenting them as criteria of positive consonance [2];
- ν ≥ 0.70—showing a high degree of disagreement between two criteria, presenting them as criteria of weak dissonance to negative consonance [2];
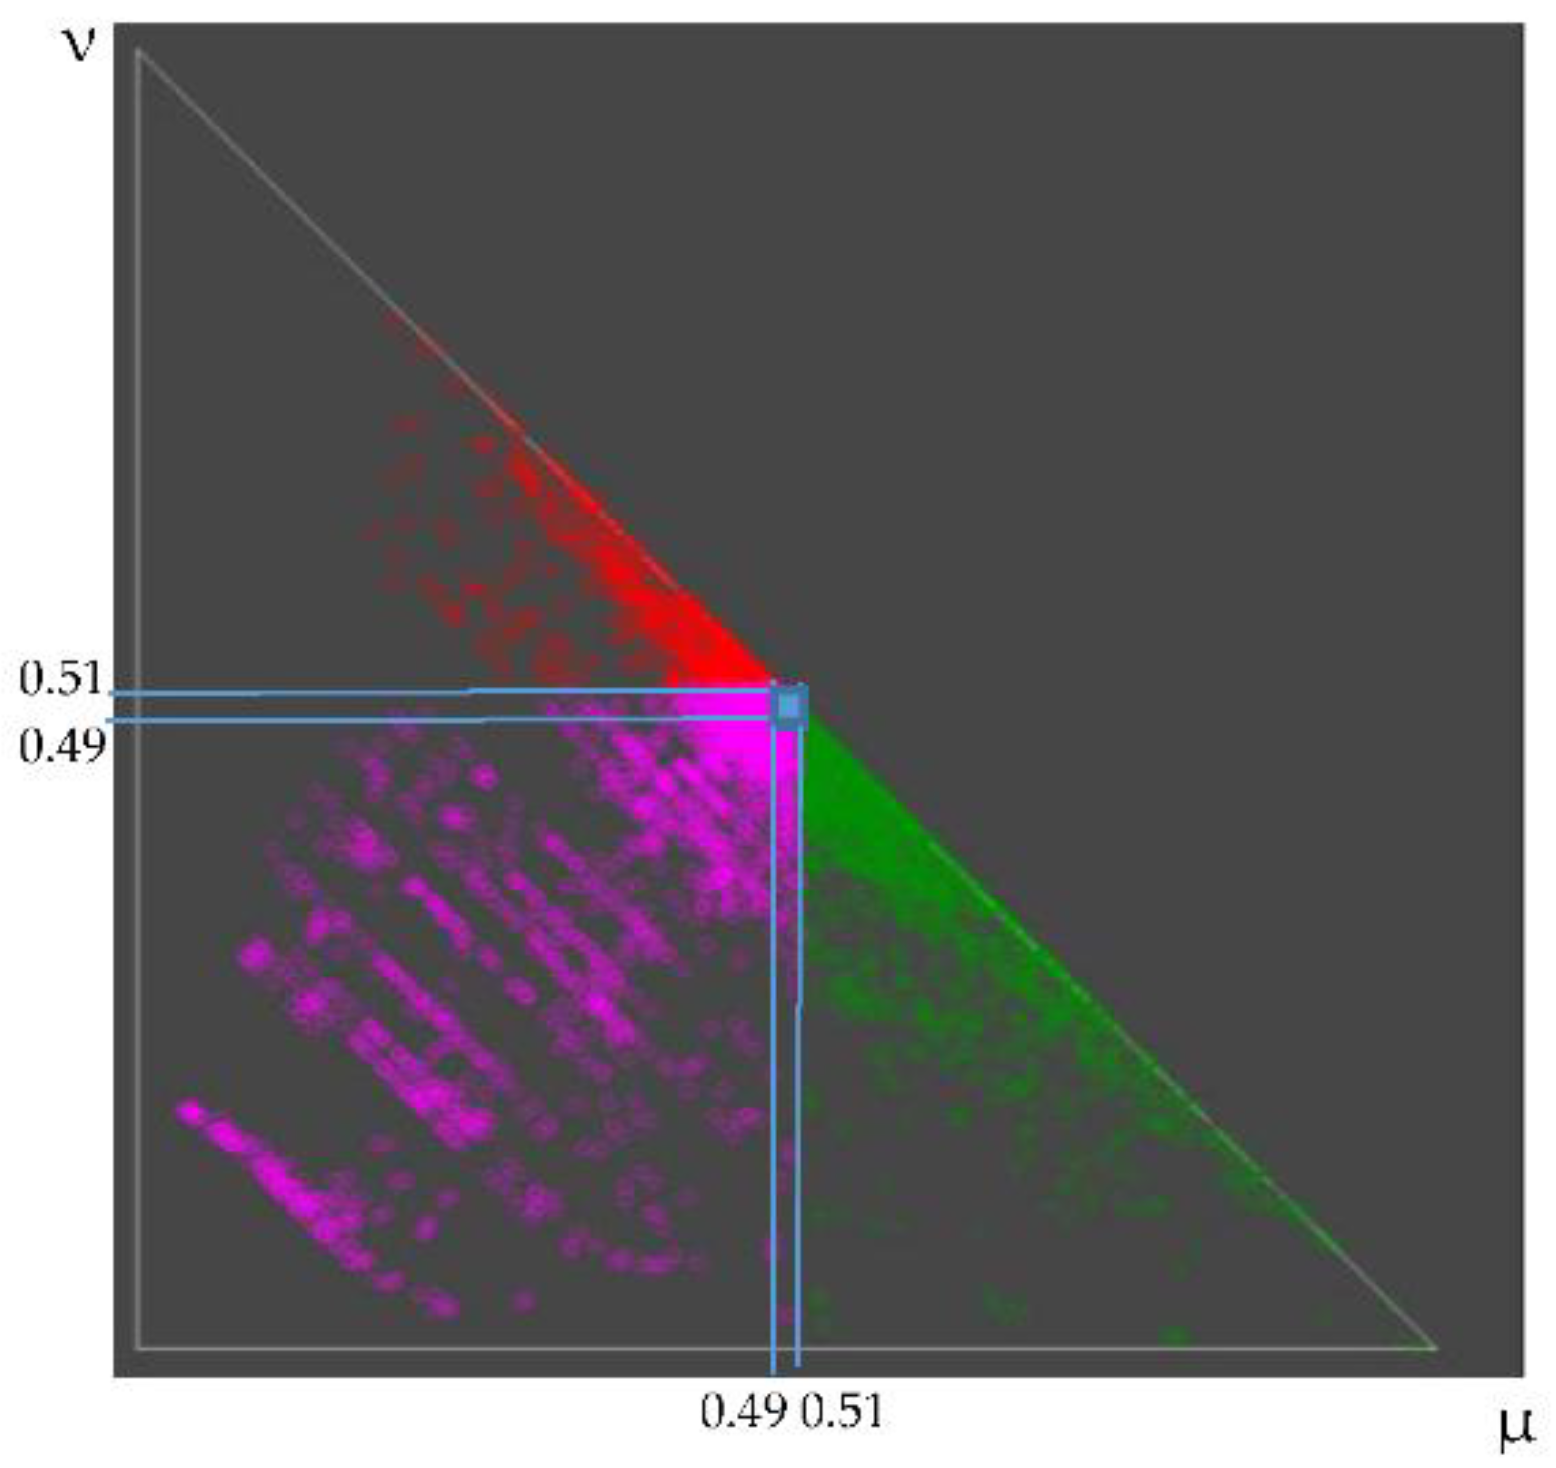
- 0.49 ≤ µ ≤ 0.51; 0.49 ≤ ν ≤ 0.51; µ + ν ≥ 0.98—showing almost equal values of degrees of agreement and disagreement, presenting such pairs as criteria of dissonance.
3.1. ECG Criteria Showing Extremely High Degree of Agreement
- <MinSpecWidth_08, MinSpecArea_08>, µ = 0.987
- <MinSpecWidth_06, MinSpecArea_06>, µ = 0.972
- <MeanAmpVB, MeanAmpN>, µ = 0.968
3.2. ECG Criteria Showing High Degree of Agreement
- Dependencies between criteria that describe the TQ segment in the frequency domain, i.e., <MinSpecWidth_04, MinSpecArea_04>, <StdSpecArea_02, StdSpecArea_04>, <MaxSpecArea_02, MaxSpecArea_04>, <MeanSpecArea_02, MeanSpecArea_04>, <StdSpecArea_04, StdSpecArea_06>, <StdSpecWidth_08, StdSpecArea_08>, <StdSpecWidth_06, StdSpecArea_06>, <MeanSpecWidth_08, MeanSpecArea_08>, <StdSpecWidth_04, StdSpecArea_04>, <StdSpecArea_02, StdSpecArea_06>, <MaxSpecArea_04, MaxSpecArea_06>, <MeanSpecWidth_06, MeanSpecArea_06>, <MeanSpecArea_04, MeanSpecArea_06>, <MaxSpecArea_08 StdSpecArea_08>, with degree of agreement µ in the range from 0.920 to 0.851. All these dependencies are expected and are suggested by the way of calculation of the paired criteria. The observed relations suggest that part of the spectral features, preferably the ones related to calculation of area and standard deviations, could be excluded from the ECG criteria set.
- Dependencies between criteria that describe the TQ segment in the time domain, i.e., <MeanT_TQ, MaxT_TQ>, <MeanT_TQ, MinT_TQ>, <MeanLeak_TQ, MinLeak_TQ>, with degree of agreement µ in the range from 0.878 to 0.854. Again the high degree of agreement is predisposed by the principles followed in the process computation process (i.e., the mean value of the period T measured in the TQ intervals is in coincidence with the minimal and maximal values of the period T, as well as the change in the mean leakage normally follows the change in the minimal leakage). The presence of MeanT_TQ in two criteria couples implies for possible decrease of the feature set by exclusion of MaxT_TQ and MinT_TQ.
- Dependencies between criteria that describe the amplitudes of the ventricular beats within the analyzed ECG segment, i.e., <MaxAmpVB, MaxAmpN>, <StdAmpVB, StdAmpN>, <MinAmpVB, MinAmpN>, with degree of agreement µ in the range from 0.925 to 0.900. In particular, the observed high degree of agreement corresponds to the fact that these criteria represent the minimal, maximal value and standard deviation of the amplitudes of all ventricular beats and the respective amplitude criteria calculated only for the normal beats, which are predominant in considerable part of the analyzed ECGs. The strong consonance within these criteria pairs suggests once again that the features that describe the normal beats could be replaced by the corresponding features calculated for all heartbeats. Thus, the supplementary analysis for initial heartbeat classification could be avoided.
- Dependencies between criteria that describe the RR intervals between the ventricular beats within the analyzed ECG segment such as <MeanRRVB, MeanRRN> and <StdRRN, MaxRRN>, with degree of agreement µ in the range from 0.893 to 0.864. Expectedly, the mean RR interval between the ventricular beats is greatly influenced by the RR intervals between the normal beats and respectively by MeanRRN. On the other hand, increase/decrease of MaxRRN normally leads to increase/decrease of RR intervals range and consecutively to increase/decrease of StdRRN. If analyzed independently, these two pairs of criteria suggest possible exclusion of MeanRRN and StdRRN from the ECG criteria set. It is a subject of deeper investigation if MaxRRN could be substituted with another feature that does not require heartbeat classification.
- Dependence between two criteria that are related to the statistical distribution of the P-wave amplitudes, i.e., <StdAmpP, MaxAmpP> with degree of agreement µ = 0.866. Here again the increase/decrease of MaxAmpP normally leads to increase/decrease of P-wave amplitude range and consecutively to increase/decrease of StdAmpP. Based on these observations, the calculation of StdAmpP, which is obtained by more complicated processing procedures compared to MaxAmpP, could be avoided.
- Dependence between the statistical criteria describing the deviation between the samples of all PQRST segments in one ECG recording and the corresponding samples of the PQRST first PCA vector, i.e., <MeanStdPQRST, MinStdPQRST>, <MeanStdPQRST, MaxStdPQRST>, <MaxStdPQRST, RangeStdPQRST>, with degree of agreement µ in the range from 0.920 to 0.866. Expectedly, the changes in the minimal, maximal values of the assessed standard deviation, which define also its range, are in agreement with the change of the mean value of this standard deviation. It is a user’s choice to exclude MinStdPQRST and MaxStdPQRST or MinStdPQRST and RangeStdPQRST from the ECG criteria set, taking into consideration all other observed relations.
3.3. ECG Criteria Showing a High Degree of Disagreement
- Inverse relation between the regularity index, which quantifies the sharpness of the dominant peak in the spectra of the TQ segment on one hand, and the spectral width or area at certain levels, on the other, which lead to a high degree of disagreement ν in the range from 0.790 to 0.702, and degree of agreement µ respectively between 0.197 and 0.292 for the pairs: <MeanSpecWidth_02, MeanRI>, <MeanSpecArea_02, MeanRI>, <MeanSpecWidth_04, MeanRI>, <MaxSpecArea_02, MinRI>, <MaxSpecArea_04, MinRI>, <MaxSpecWidth_02, MinRI>, <MaxSpecWidth_04, MinRI>, <MeanSpecArea_04, MeanRI>, <MaxSpecArea_06, MinRI>. This observation is logical considering that the sharper the dominant peak is, the narrower is the spectrum and the lower is its area. On the other hand, the above listed dependencies provide evidence for possible reduction of the feature space by keeping only MinRI and MeanRI that appear in all criteria pairs.
- Inverse relation between the minimal amplitude of the ventricular beats and in particular the normal beats, and the standard deviation of these amplitudes, i.e., <StdAmpVB, MinAmpVB>, <StdAmpVB, MinAmpN>, <StdAmpN, MinAmpVB>, <StdAmpN, MinAmpN>, with degree of disagreement ν in the range from 0.777 to 0.716 and degree of agreement µ between 0.222 and 0.284. This is again a logical relation considering that in case of constant maximal amplitude the decrease of the minimal amplitude increases the standard deviation of the observed amplitudes. It is an object of deeper analysis whether to keep the criteria related to the amplitudes of the normal beats at the cost of preliminary heartbeat classification, or to relay on criteria based on the computation of standard deviation.
- Inverse relation between the minimal amplitude of the P-waves and the standard deviation of these amplitudes, i.e., <StdAmpP, MinAmpP>, with degree of disagreement ν = 0.767 and degree of agreement µ = 0.232. The explanation is the same as the one provided above concerning the amplitudes of the ventricular beats. The observed strong negative consonance within this criteria pair suggests the exclusion of StdAmpP from the ECG criteria set.
- Inverse relation between the minimal amplitude of the ventricular beats and the range of the deviation between the samples of all PQRST segments in one ECG recording and the corresponding samples of the PQRST first PCA vector, i.e., <MinAmpVB, RangeStdPQRST>, with degree of disagreement ν = 0.711 and degree of agreement µ = 0.289. Although logical, the inverse relation between these two criteria is not obvious at first glance. Revealing such not evident relations could be extremely useful, since it could give a hint for the reduction of criteria related to the application of complex signal processing procedures, which is the case of RangeStdPQRST.
3.4. ECG Criteria Showing Almost Equal Values of Degrees of Agreement and Disagreement
- Forty-six pairs which include criteria related to the QRS and P-waves amplitudes vs. criteria describing the TQ segment in the frequency domain. The dissonance of these criteria is expected, considering that they represent amplitude and spectral ECG characteristics.
- Eight pairs which include criteria reflecting the RR and PP intervals vs. criteria describing the TQ segment in the frequency domain. Neither agreement nor disagreement is expected between these criteria.
- Nine pairs which include amplitudes vs. intervals within the analyzed ECG. No dependencies between these criteria are expected.
- Twelve pairs which include time domain TQ parameters vs. predominantly QRS amplitudes and intervals (11 pairs) and P-wave amplitudes (1 pair). The QRS complex is out of the TQ interval, therefore, the lack of relation between the features that describe them is normal. Considering the fact that the P-waves appear within the TQ interval, the dissonance of these criteria is not so obvious.
- Thirteen pairs which include criteria describing the TQ segment in the time and frequency domains vs. criteria for assessment of PQRST beat-to-beat irregularity. Considering the negligible overlap between the TQ and the PQRST segments, no dependencies between the criteria measured for each of them are expected.
- Three pairs, which include statistical measures over the RR interval vs. criteria describing the PQRST beat-to-beat irregularity. Neither agreement nor disagreement within these pairs is expected.
- Three pairs, which include frequency vs. time domain descriptors of the TQ segment. The lack of agreement between these criteria is expected.
- A pair <MeanAmpN, MaxAmpP>, which shows no dependence between the mean amplitude of the normal QRS complexes within the analyzed ECG interval and the maximal amplitude of the P-waves. A relation between these two criteria is not expected.
- A pair <MaxSpecArea_06, MaxRI>, which shows no dependence between the maximal spectral area on 0.6 level and the maximal regularity index that quantifies the sharpness of the dominant peak. Considering that these are statistical values that normally are not calculated for one and the same TQ segment (for more details see the explanations related to the features calculations in [27]) the observation of such lack of dependence is normal.
- Two pairs <MinAmpVB, MaxAmpVB> and <MeanAmpP, MinAmpP> that show lack of dependence between minimal and maximal amplitudes of the ventricular beats, as well as mean and minimal P-wave amplitude. The observations within these two criteria pairs are not so obvious.
4. Discussion
5. Conclusions
Author Contributions
Funding
Institutional Review Board Statement
Informed Consent Statement
Data Availability Statement
Acknowledgments
Conflicts of Interest
References
- Atanassov, K.; Mavrov, D.; Atanassova, V. Intercriteria Decision making: A new approach for multicriteria decision making, based on index matrices and intuitionistic fuzzy sets. Issues IFSs GNs 2014, 11, 1–8. [Google Scholar]
- Atanassov, K.; Atanassova, V.; Gluhchev, G. Intercriteria analysis: Ideas and problems. Notes Intuit. Fuzzy Sets 2015, 21, 81–88. [Google Scholar]
- Atanassov, K. Generalized index matrices. Compt. Rend. Acad. Bulg. Sci. 1987, 40, 15–18. [Google Scholar]
- Atanassov, K. Index Matrices: Towards an Augmented Matrix Calculus; Springer: Cham, Switzerland, 2014. [Google Scholar]
- Atanassov, K. Intuitionistic fuzzy sets. Int. J. Bioautom. 2016, 20, S1–S6. [Google Scholar]
- Atanassov, K. On Intuitionistic Fuzzy Sets Theory; Springer: Cham, Switzerland, 2012. [Google Scholar]
- Atanassov, K. Intuitionistic Fuzzy Logics; Springer: Cham, Switzerland, 2017. [Google Scholar]
- Atanassova, V. Interpretation in the intuitionistic fuzzy triangle of the results, obtained by the intercriteria analysis. In Proceedings of the 2015 Conference of the International Fuzzy Systems Association and the European Society for Fuzzy Logic and Technology (IFSA-EUSFLAT-15), Gijón, Spain, 30 June 2015; Atlantis Press: Paris, France, 2015; pp. 1369–1374. [Google Scholar]
- Doukovska, L.; Atanassova, V.; Sotirova, E.; Vardeva, I.; Radeva, I. Defining consonance thresholds in intercriteria analysis: An overview. Stud. Comput. Intell. 2019, 757, 161–179. [Google Scholar]
- Pencheva, T.; Roeva, O.; Angelova, M. Investigation of genetic algorithm performance based on different algorithms for intercriteria relations calculation. Lect. Notes Comput. Sci. 2018, 10665, 390–398. [Google Scholar]
- Vassilev, P.; Ribagin, S.; Todorova, L. On an aggregation of expert value assignments using index matrices. Notes Intuit. Fuzzy Sets 2017, 23, 75–78. [Google Scholar]
- Roeva, O.; Pencheva, T.; Angelova, M.; Vassilev, P. Intercriteria analysis by pairs and triples of genetic algorithms application for models identification. Stud. Comput. Intell. 2016, 655, 193–218. [Google Scholar]
- Stratiev, D.; Sotirov, S.; Shishkova, I.; Nedelchev, A.; Sharafutdinov, I.; Vely, A.; Mitkova, M.; Yordanov, D.; Sotirova, E.; Atanassova, V.; et al. Investigation of relationships between bulk properties and fraction properties of crude oils by application of the intercriteria analysis. Pet. Sci. Technol. 2016, 34, 1113–1120. [Google Scholar] [CrossRef]
- Sotirov, S.; Atanassova, V.; Sotirova, E.; Doukovska, L.; Bureva, V.; Mavrov, D.; Tomov, J. Application of the intuitionistic fuzzy intercriteria analysis method with triples to a neural network preprocessing procedure. Comput. Intell. Neurosci. 2017, 2017, 2157852. [Google Scholar] [CrossRef] [Green Version]
- Roeva, O.; Fidanova, S. Comparison of different metaheuristic algorithms based on intercriteria analysis. J. Comput. Appl. Math. 2018, 340, 615–628. [Google Scholar] [CrossRef]
- Krawczak, M.; Bureva, V.; Sotirova, E.; Szmidt, E. Application of the intercriteria decision making method to universities ranking. Adv. Intell. Syst. Comput. 2016, 401, 365–372. [Google Scholar]
- Bureva, V.; Michalíková, A.; Sotirova, E.; Popov, S.; Riečan, B.; Roeva, O. Application of the intercriteria analysis to the universities rankings system in the Slovak Republic. Notes Intuit. Fuzzy Sets 2017, 23, 128–140. [Google Scholar]
- Parvathi, R.; Atanassova, V.; Doukovska, L.; Yuvapriya, C.; Indhurekha, K. Inter-criteria analysis of rankings of Indian universities. Notes Intuit. Fuzzy Sets 2018, 24, 99–109. [Google Scholar] [CrossRef] [Green Version]
- Ilkova, T.; Petrov, M. Application of intercriteria analysis to the Mesta river pollution modelling. Notes Intuit. Fuzzy Sets 2015, 21, 118–125. [Google Scholar]
- Georgieva, V.; Angelova, N.; Roeva, O.; Pencheva, T. Intercriteria analysis of wastewater treatment quality. J. Int. Sci. Publ. Ecol. Saf. 2016, 10, 365–376. [Google Scholar]
- Tsakovska, I.; Alov, P.; Ikonomov, N.; Atanassova, V.; Vassilev, P.; Roeva, O.; Jereva, D.; Atanassov, K.; Pajeva, I.; Pencheva, T. Intercriteria analysis implementation for exploration of the performance of various docking scoring functions. Stud. Comput. Intell. 2021, 902, 88–98. [Google Scholar]
- Vankova, D.; Sotirova, E.; Bureva, V. An application of the intercriteria analysis approach to health-related quality of life. Notes Intuit. Fuzzy Sets 2015, 21, 40–48. [Google Scholar]
- Todinova, S.; Mavrov, D.; Krumova, S.; Marinov, P.; Atanassova, V.; Atanassov, K.; Taneva, S.G. Blood plasma thermograms dataset analysis by means of intercriteria and correlation analyses for the case of colorectal cancer. Int. J. Bioautom. 2016, 20, 115–124. [Google Scholar]
- Krumova, S.; Todinova, S.; Mavrov, D.; Marinov, P.; Atanassova, V.; Atanassov, K.; Taneva, S. Intercriteria analysis of calorimetric data of blood serum proteome. Biochim. Et Biophys. Acta Gen. Subj. 2017, 1861, 409–417. [Google Scholar] [CrossRef]
- Zaharieva, B.; Doukovska, L.; Ribagin, S.; Radeva, I. Intercriteria analysis of data obtained from patients with Behterev’s disease. Int. J. Bioautom. 2020, 24, 5–14. [Google Scholar] [CrossRef]
- Clifford, G.; Liu, C.; Moody, B.; Lehman, L.W.; Silva, I.; Li, Q.; Johnson, A.E.; Mark, R.G. AF Classification from a short single lead ECG recording: The Physionet Computing in Cardiology Challenge 2017. Comput. Cardiol. 2017, 44. [Google Scholar] [CrossRef]
- Jekova, I.; Bortolan, G.; Stoyanov, T.; Dotsinsky, I. Multi-type arrhythmia classification: Assessment of the potential of time and frequency domain features and different classifiers. Int. J. Bioautom. 2020, 24, 153–172. [Google Scholar] [CrossRef]
- Zadeh, L.A. Fuzzy sets. Inf. Control. 1965, 8, 338–353. [Google Scholar] [CrossRef] [Green Version]
- Hošková-Mayerová, S.; Maturo, A. Decision-making process using hyperstructures and fuzzy structures in social sciences. Stud. Fuzziness Soft Comput. 2018, 357, 103–111. [Google Scholar] [CrossRef]
- Szmidt, E.; Kacprzyk, J. An application of intuitionistic fuzzy set similarity measures to a multi-criteria decision making problem. Lect. Notes Comput. Sci. 2006, 4029, 314–323. [Google Scholar] [CrossRef]
- Michalíková, A.; Riečan, B. On invariant measures on intuitionistic fuzzy sets. Adv. Fuzzy Log. Technol. 2017, 529–534. [Google Scholar] [CrossRef]
- Michalíková, A. The differential calculus on IF sets. In Proceedings of the 2009 IEEE International Conference on Fuzzy Systems, Jeju Island, Korea, 20–24 August 2009; pp. 1393–1395. [Google Scholar]
- Atanassov, K.; Szmidt, E.; Kacprzyk, J. On intuitionistic fuzzy pairs. Notes Intuit. Fuzzy Sets 2013, 19, 1–13. [Google Scholar]
- Angelova, N.; Atanassov, K.; Riečan, B. Intercriteria analysis of the intuitionistic fuzzy implication properties. Notes Intuit. Fuzzy Sets 2015, 21, 20–23. [Google Scholar]
- Ikonomov, N.; Vassilev, P.; Roeva, O. ICrAData—software for intercriteria analysis. Int. J. Bioautom. 2018, 22, 1–10. [Google Scholar] [CrossRef]


Publisher’s Note: MDPI stays neutral with regard to jurisdictional claims in published maps and institutional affiliations. |
© 2021 by the authors. Licensee MDPI, Basel, Switzerland. This article is an open access article distributed under the terms and conditions of the Creative Commons Attribution (CC BY) license (https://creativecommons.org/licenses/by/4.0/).
Share and Cite
Jekova, I.; Vassilev, P.; Stoyanov, T.; Pencheva, T. InterCriteria Analysis: Application for ECG Data Analysis. Mathematics 2021, 9, 854. https://doi.org/10.3390/math9080854
Jekova I, Vassilev P, Stoyanov T, Pencheva T. InterCriteria Analysis: Application for ECG Data Analysis. Mathematics. 2021; 9(8):854. https://doi.org/10.3390/math9080854
Chicago/Turabian StyleJekova, Irena, Peter Vassilev, Todor Stoyanov, and Tania Pencheva. 2021. "InterCriteria Analysis: Application for ECG Data Analysis" Mathematics 9, no. 8: 854. https://doi.org/10.3390/math9080854