Article

Application of Mathematical Methods to the Study of Special-Needs Education in Spanish Journals

by
José Luis Gallego Ortega
*,
Antonio Rodríguez Fuentes
and
Antonio García Guzmán
Faculty of Education Sciences, The University of Granada, 18071 Granada, Spain
*
Author to whom correspondence should be addressed.
Mathematics 2021, 9(6), 684; https://doi.org/10.3390/math9060684
Submission received: 7 February 2021 / Revised: 17 March 2021 / Accepted: 18 March 2021 / Published: 22 March 2021

Abstract

:
This research analyzes the written production on special-needs education in Spanish high-impact journals indexed in the Journal Citation Reports (Web of Science). Its objective is to show the status of this issue in the past 20 years based on updated and relevant information that contributes to the development of the discipline itself and to improving special-needs education. A total of 1201 special-needs education documents published in 15 high-impact journals were analyzed. The results evince the development of this discipline and the principal subjects of study and other relevant aspects associated with this field of knowledge. This research allows for reinforcing the body of knowledge in this field of study, which would be far-reaching for researchers and education administrators alike.

1. Introduction

Integrating pupils with disabilities and developmental disorders into ordinary schools has increased interest among professionals and researchers in the field of special-needs education (SNE). Teaching quality is central to any effort to improve the education of students with disabilities. The unceasing quest for answers to attend to the educational needs of these pupils, together with the exploration of new emerging research lines, has led to SNE becoming a preferential area of study. In this respect, although the field of special education has made considerable strides, however, academic leaders often lack the integrated knowledge of pedagogy, students, content, and curriculum appropriate for improving teacher education and to help special and general education teachers acquire the knowledge and skills needed to engage in different instructional frameworks [1]. Therefore, the purpose of this study is to provide accurate information about the advances in this field of study in order to facilitate academic leaders to make the best decision that contributes to improving the educational response provided to these students, in addition to the areas and contexts in which it is necessary to keep moving forward and researching.
Using bibliometrics can provide important information from which decision makers can structure processes, thus organizing outputs/ outcomes from inception and with a special application on education science studies [2,3]. Bibliometrics is a set of mathematical and statistical methods used to analyze and measure the quantity and quality of books, articles, and other forms of publications [4]. Statistical analysis tools have been applied to research for decades [5]. However, statistical analysis tools have evolved from common techniques until most recent methods such as structural equation modeling, enabling the application of both analytical and path approaches [6].
A “strength of bibliometric analysis is the ability to identify key scholars and documents within a field of research” [7] (p. 346). Moreover, bibliometric measurements can be used to assess the output of the research and for identify active or future emerging research areas [8], identify different general and specific themes, and determine their thematic evolution [9]. In effect, bibliometric studies are showing themselves to be especially useful in reviewing the literature on a specific topic and in discerning trends in research topics on an established field [10,11,12]. Even though it was at the dawn of this century when the most often-recurring topics and the emerging lines of SNE research became known in Spain [13,14], in general, bibliometric studies, which are so frequent in other areas of knowledge, are a token occurrence in the field of SNE [15,16,17,18,19].
Bibliometric analysis has a critical role in strategic science planning, policy, and research performance evaluation [20]. Bibliometrics assumes that scientific production rests on the recognition of prestigious databases based on the number of publications included by the corresponding scientific journals, a significant source for researchers to divulge their findings [21]. To understand the development of research in a specific area of knowledge, it is indispensable to assess the quality of scientific journals [18,22] whose articles, furthermore, constitute the principal element in appraising researchers [19,23] and are essential sources for the dissemination of knowledge in the field of Social Sciences [22,24]. Interestingly, in Spain, despite the numerous groups of existing special-needs education journals, none of them is indexed in the Journal Citation Reports (JCR); however, in the past decade, the number of educational journals not specializing in SNE has increased in the JCR databases in all theme categories [21,23], with their analysis constituting a precise ingredient in the bibliometric appraisal of research activity [24,25].
In Spain, the principal indicator used in analyzing the quality of the publications is the impact factor of the JCR for indexed journals in the Core Collection of the Clarivate Analytics Web of Science (WoS). When analyzing research productivity, it is essential to study the journals in which papers are published [20]. The Thomson Reuters Institute of Scientific Information (ISI) Web of Science (WoS) database (now known as Clarivate Analytics) is a leading high-quality database for generating research assessment measures [26]. While the WoS includes the principal scientific publications in any area of knowledge that are essential for supporting research [21,27], the JCR index guarantees the necessary visibility, dissemination, prestige, and international impact [25,28]. At this time, publications in scientific journals accredit the quality of published papers [29], while bibliometric indicators are recognized by the international scientific community as ideal appraisal instruments [27,30]. In summary, bibliometric studies allow us to understand knowledge landscapes and predict emerging trends in a scientific field [31].

Statement of the Problem

According to Rowley and Sbaffi [32], scholarly communication is essential to the development, dissemination, and impact of research outcomes in all disciplines and countries. Most scientific discoveries and research results are published in scientific journals [4].
The purpose of this study was to describe the current status of research efforts related to special-needs education based on an analysis of the journal literature indexed in the Journal Citation Reports (WoS) for the period of 2000 to 2019. It was assumed that an analysis of articles from the 2000–2019 time period is representative of the most prolific research activities of the field. The study was limited to the journal literature because the professional journal is usually considered the most up-to-date, important, and widely distributed forum for the transmission and evaluation of information in a specific field. These academic journals act as a platform for the presentation of new insights, analysis, and discussion [8]. As pointed out by Nederhof, Luwel, and Moed [33], the output can also be assessed by counting the number of articles in important journals, such as those covered by the Arts and Humanities Citation Index (A&HCI) and the Social Sciences Citation Index (SSCI).
This is why the objectives of this study were a) to provide updated and relevant information on SNE in Spanish education and related journals that are or have been indexed in the JCR (SSCI) and b) to analyze the number of manuscripts on SNE published in the past 20 years (2000–2019) in the WoS core collection.

2. Materials and Methods

Bibliometric analyses of literature provide methods by which the characteristics of a body of literature can be evaluated. In this research, the bibliometric analysis was used as a methodological resource to analyze the Spanish scientific production in the field of special-needs education (SNE) in the JCR (WoS) database. Given the time dimension of the research, a bibliometric descriptive–retrospective study on SNE was conducted to provide pertinent information on its written production [34]. It cannot be ignored that “communication in science is realized through publications. Thus, scientific explanations, and in general scientific knowledge, are contained in written documents constituting scientific literature” [35] (p. 1446). However, the study combines bibliometric and qualitative assessments.

2.1. Indicators

A total of 1201 originals were analyzed, published in 15 education and related journals that are, or have been, indexed in the JCR in the past 20 years (2000–2019). To be analyzed, studies needed to meet the following inclusion criteria: (a) published in Spanish or English; (b) peer-reviewed article or dissertation; (c) linked to a school, institutional, or university environment; and (d) the document’s theme according to its special connection with the field of special-needs education (SNE). The analysis of the research data and the reflection on the theoretical constructs have allowed us to identify relevant information on this field of study.
The number of documents in each one of the journals is included in Figure A1.
However, the growth of scientific research in recent times has needed the development and application of various indicators to help measure the importance of research for the scientific community. Evaluation of quality and quantity of publications can be carried out using a set of statistical and mathematical indices called bibliometric indicators [36]. Bibliometric indicators are a necessary tool for the evaluation of the scientific activity. Bibliometrics, which is expressed through various indicators and as a measurement of the quality of scientific publications, has become very important for researchers. As pointed out by Durieux and Gevenois [4], bibliometric indicators are important for researchers because they allow objective measurements of the diffusion and the impact of the articles published by a particular journal among the scientific community. A single indicator does not guarantee accurate results [8].
The indicators (units of analysis) utilized in this study were as follows:
(a)
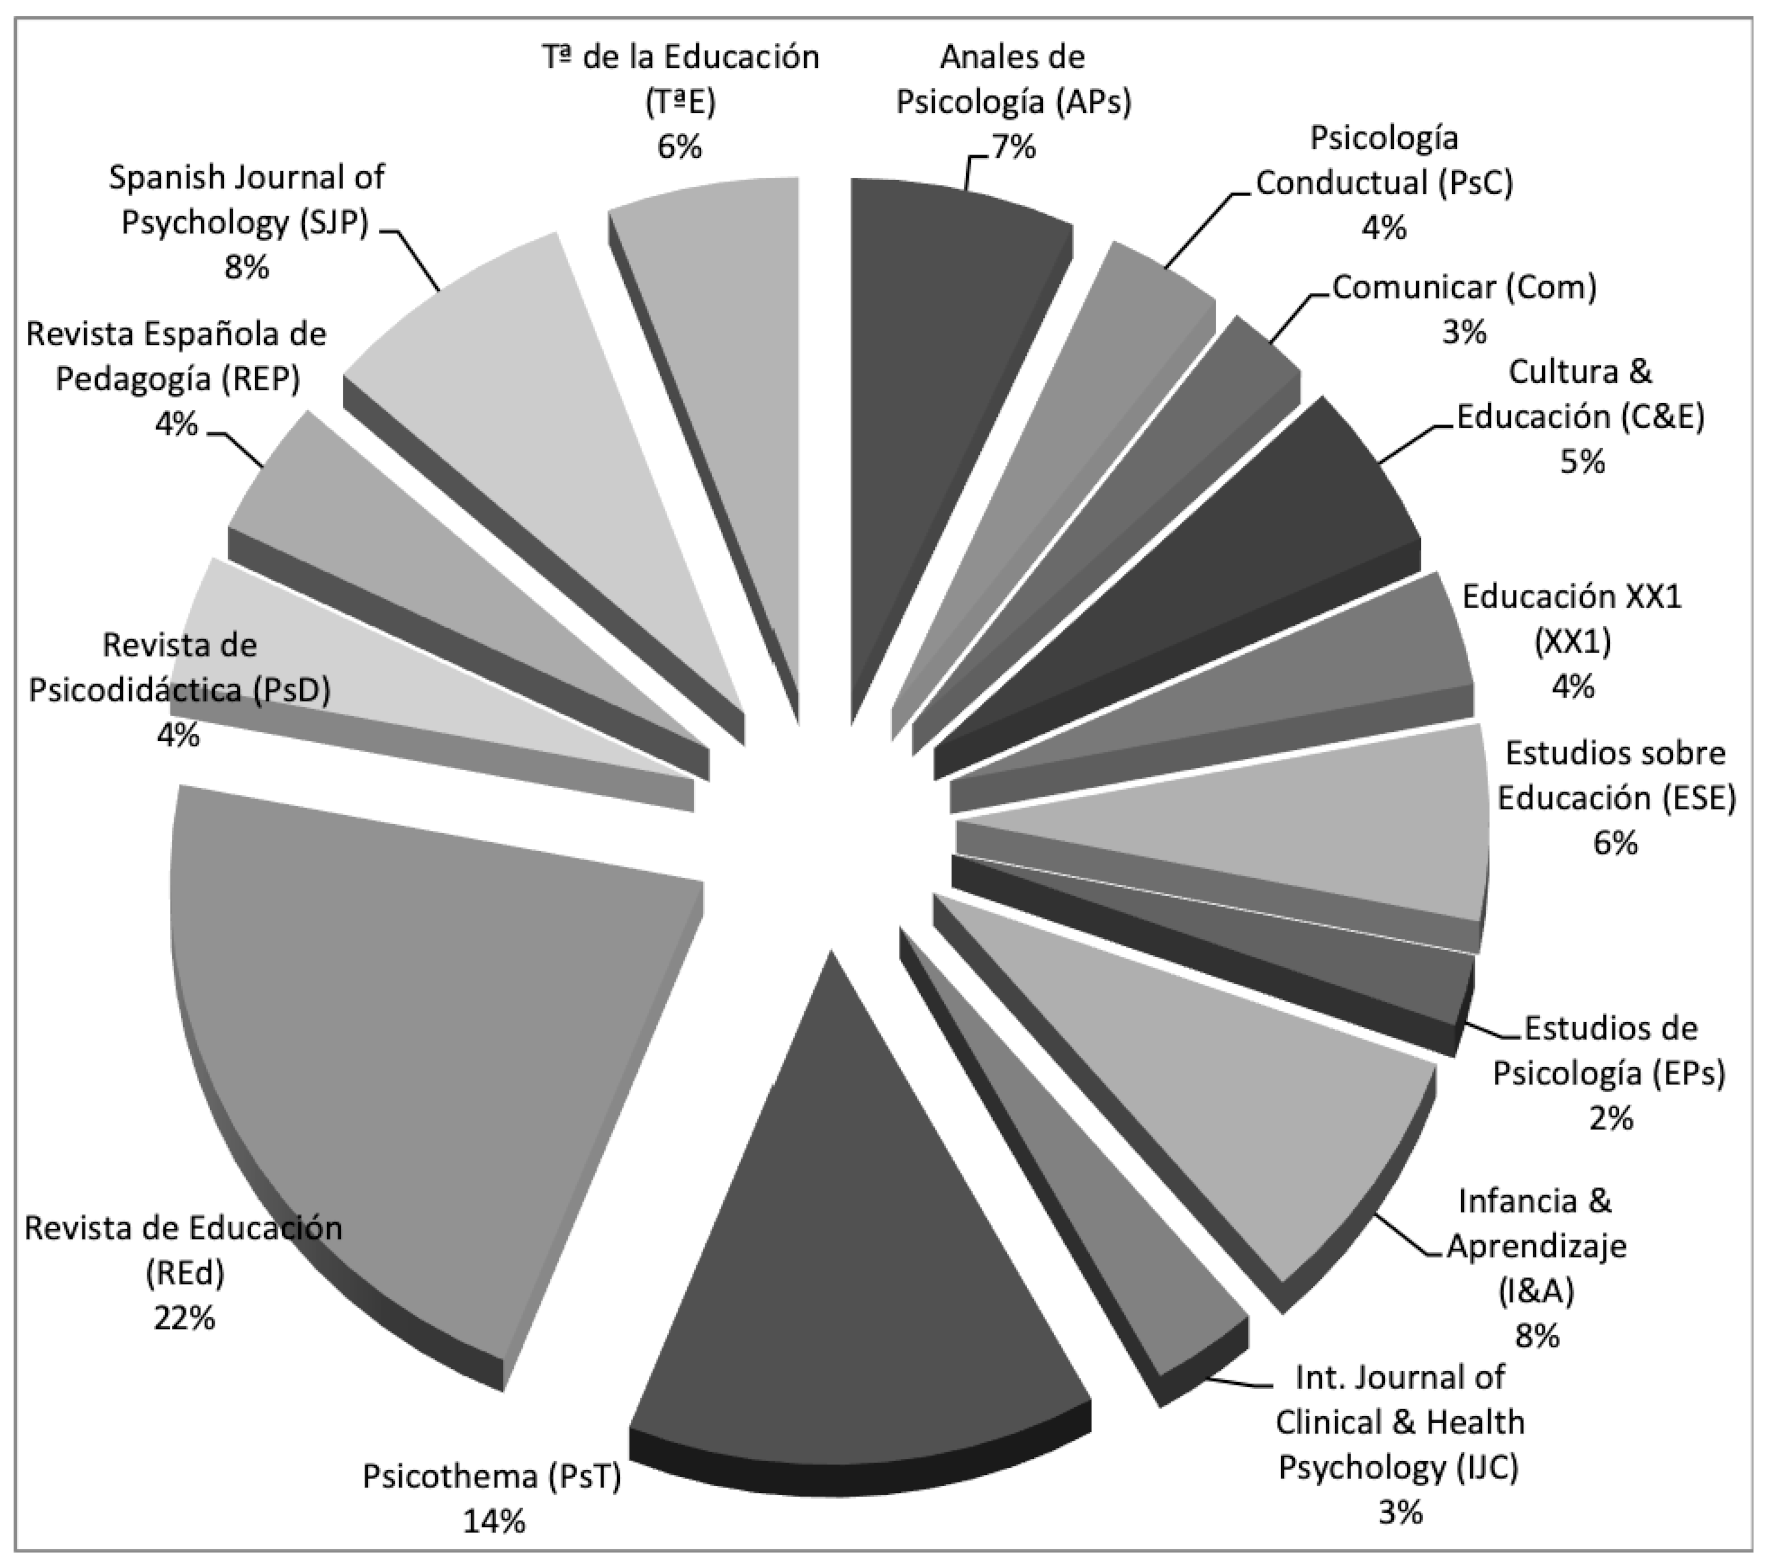
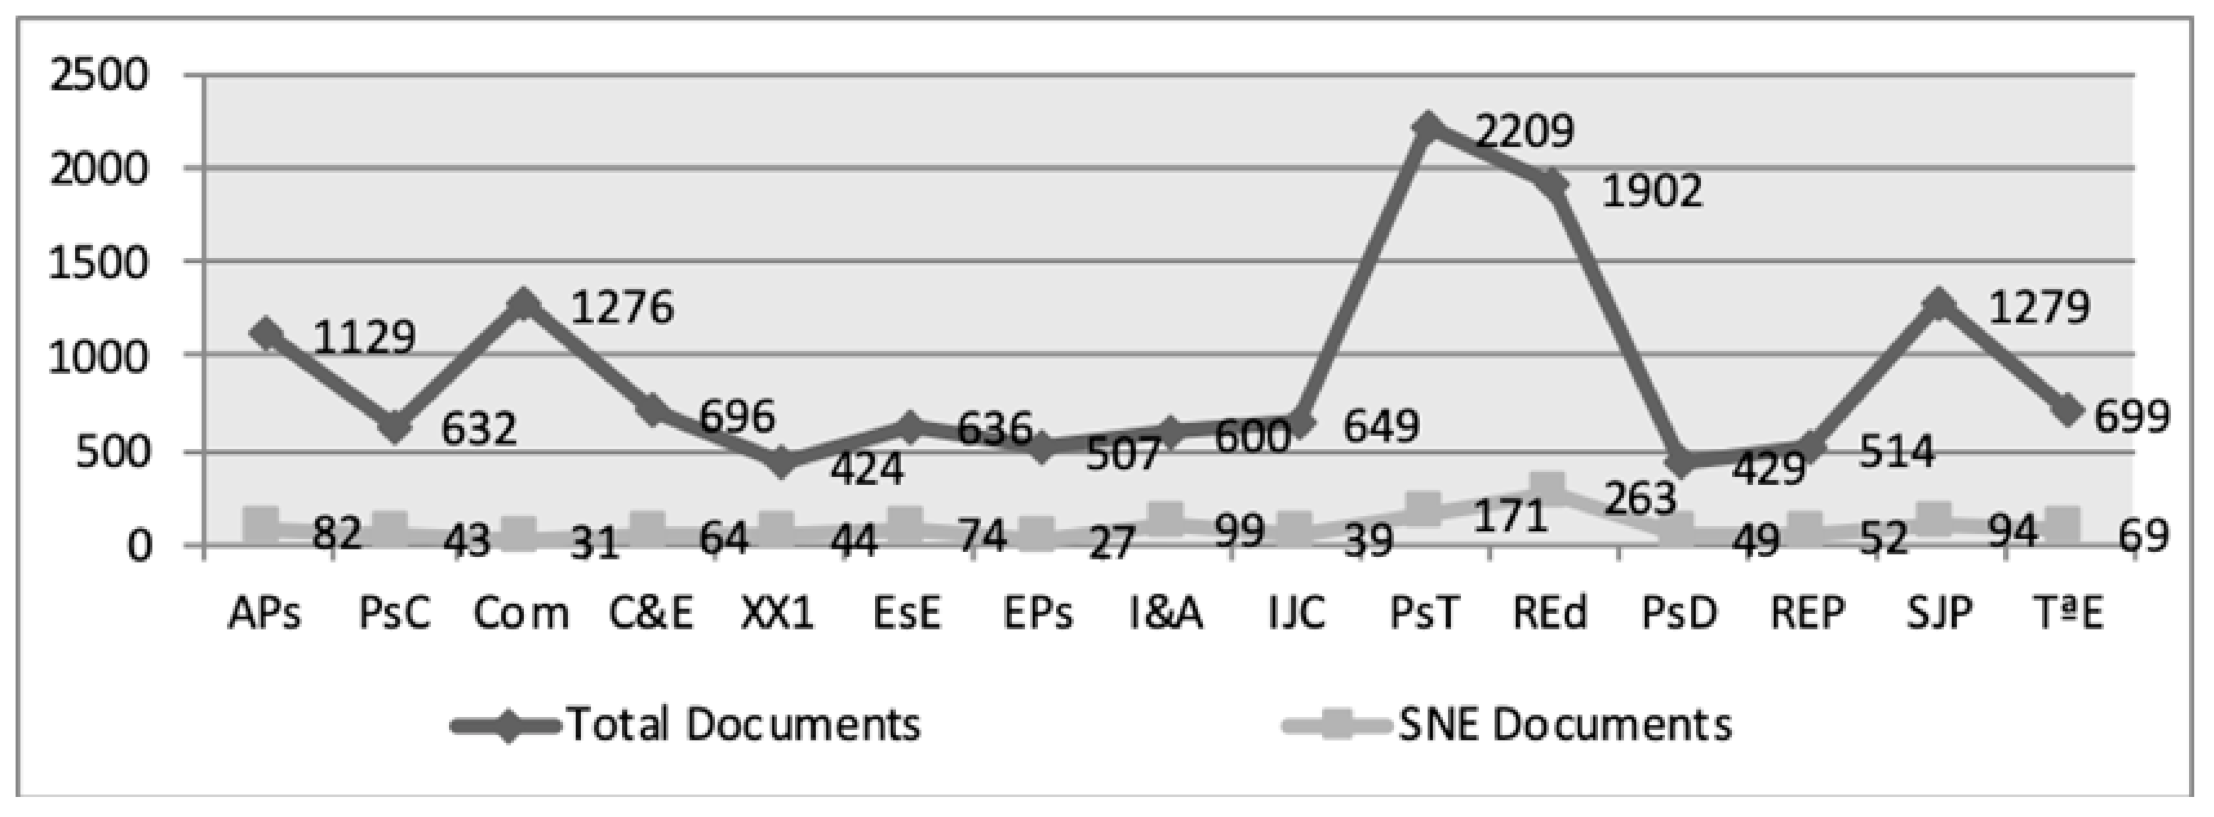
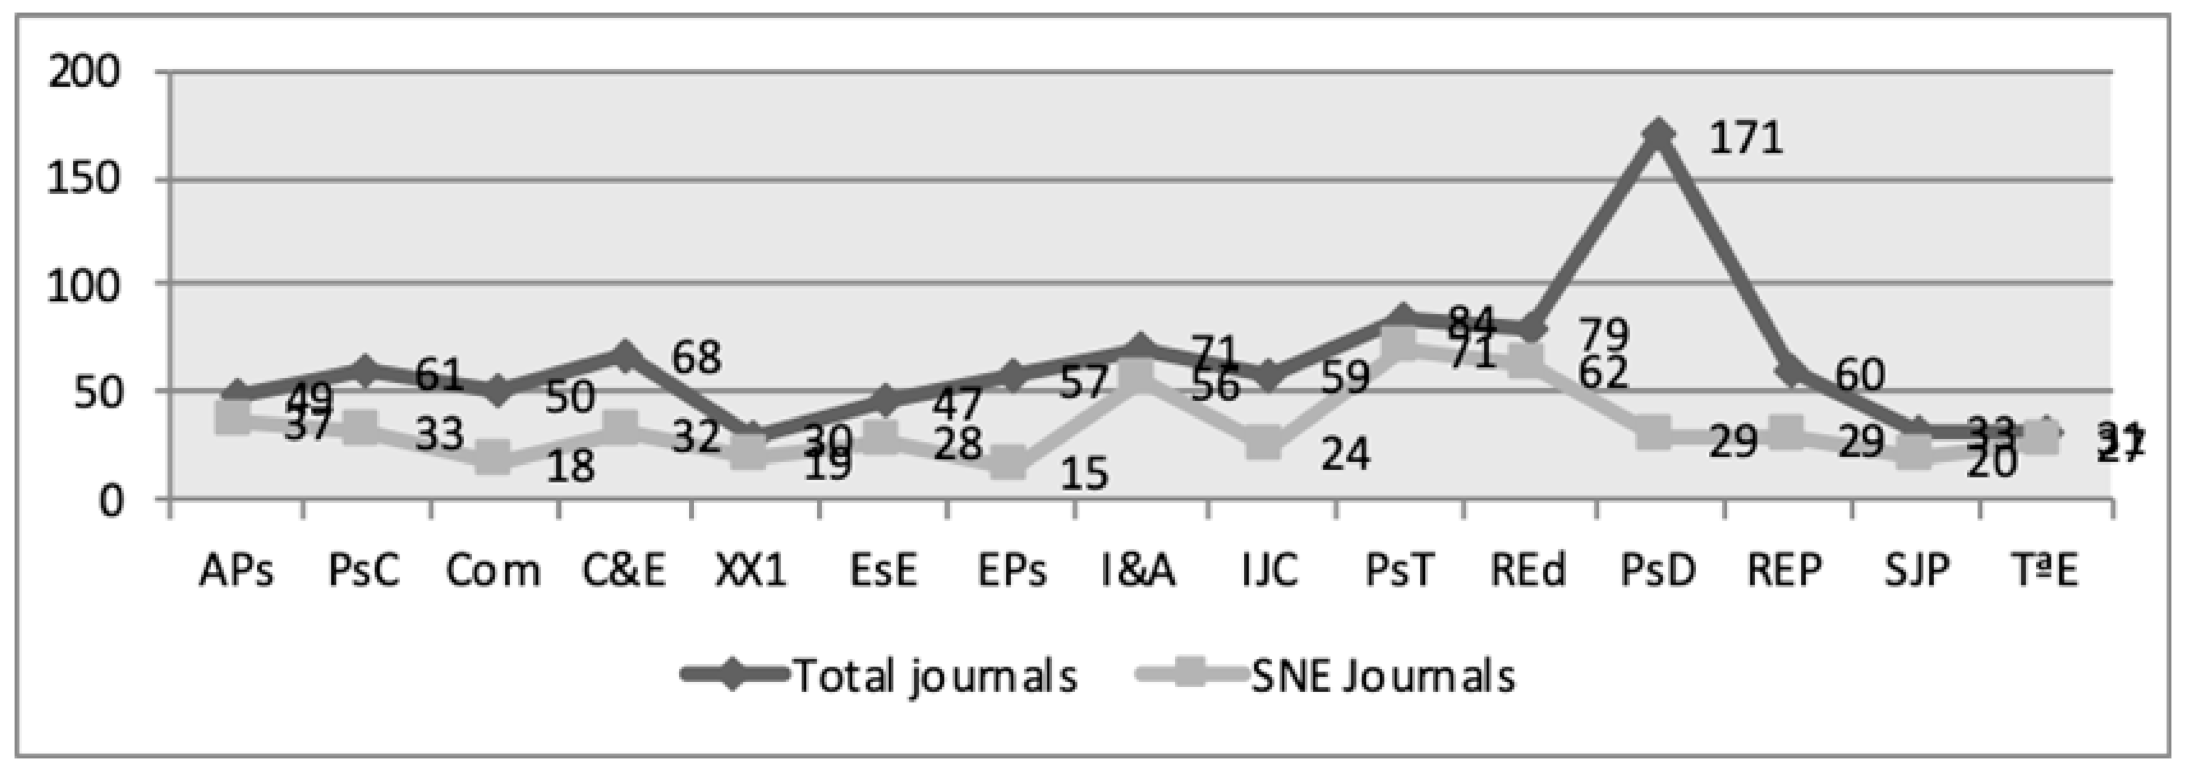
Presence of SNE in journals. Shows the number of SNE entries or documents in each journal. We initially distinguished between SNE manuscripts and other documents. The term “other” means non-special-needs education topics. We differentiated between the following:
  • Total frequencies (N) in the fields of psychology and pedagogy, which are targeted by the selected journals containing manuscripts on SNE (n), in addition to the total (T No.) and partial numbers on SNE (SNE No.) of the journals in which they feature;
  • Frequency percentage of SNE entries in relation to the total number of entries published (documents) in the selected journals (% n-N).
(b)
Variation Rates (VR). This reflects the increase in publications and variation rates (total variation rate [TVR] and interannual variation rate [IVR], both of general production [IVR–Gen., TVR–Gen.] and specific SNE production [IVR–SNE, TVR–SNE]):
  • Interannual for the purpose of quantifying fluctuation between correlative years:
    I V R yr = Publications   of   the   year Publications   of   the   previous   year Publications   of   the   previous   year
  • Total for the entire period, to quantify the period’s total fluctuation:
    T V R 2000 2019 = Publications   of   the   year   2019 Publications   of   the   year   2000 1 × 100
The positive/negative IVRs were obtained by dividing the total percentage of positive/negative IVRs by the total 19-year period;
(c)
Subject of study. Discovers the document’s theme according to its special connection with any of the following topics: student body, teaching staff, contexts, and curriculum, which respond to a deductive categorization consistent with a theoretical model of a holistic kind [16,17,37,38]. The publication data were manually coded with regard to the content of the publications. In accordance with the holistic or integral model, each element of the teaching process was analyzed in its two dimensions—as an obstacle to the teaching process and as an object of intervention and improvement, hence the consideration of the four topics mentioned above, i.e., student body (ontological approach), teaching staff (methodical approach), contexts (ecological approach), and curriculum (epistemic approach). Independent coding was conducted by four researchers with expertise in SNE. To classify the articles, the abstracts, keywords, and methodology were examined when there were reasonable doubts as to its position. Initially, the keywords enable us to summarize, qualify, and explain the entire scientific document within the boundaries of a particular research domain [20]. The degree of agreement between researchers was 98%. Discrepancies on a few categories were resolved through discussion;
(d)
Typology. Shows the type of published document (research articles, reviews or theory essays, recensions of books, and outlines of doctoral theses);
(e)
Language. Reveals the language (or languages) used by the authors in writing the manuscript. Documents written in English and Spanish were included;
(f)
Provenance and institutional affiliation. Reflects the authors’ nationality (country and city) and the home university (Spanish/foreign) or institution to which the signatory author(s) pertain(s);
(g)
Co(authorship). Reveals the degree of collaboration between authors. The collaboration index (CI) was obtained through the following formula:
C I = Number   of   authors   signing Number   of   totals   documents

2.2. Procedure

It is essential to study the journals in which papers are published. SNE is a specific research field that has no specialized journal in the Journal Citation Reports (WoS). The main body of knowledge on SNE is ingrained in journal papers, books, and doctoral theses.
For this reason, initially, we identified Spanish education and related journals in the SSCI databases accessible from the WoS. We also consulted the websites of the journals and extracted synopses of all their publications, which were initially classified into two groups (SNE and others) while awaiting a more thorough analysis. The publication data were manually coded with regard to the content of the publications. Titles and abstracts of all identified articles were evaluated against the inclusion criteria. If a decision could not be made on the title/abstract alone, the article was retained for full-text screening. Next, full-text screening against the inclusion/exclusion criteria was conducted. In other words, the assignment of type of research was based on the article abstract, followed by an analysis of the article if the abstract was insufficient for such an assignment. In the pupil category, documents focusing on pupils (students with individual learning needs, any person who is taught, or anyone who receives instruction with learning disorders (problems) were included. The teacher category included documents focusing on teaching professionals (special and general education teachers). The context category included documents focusing on the educational environment. Educational research is influenced by the context within which it is practiced. In the curriculum category, documents focusing on academic curricula and teaching programs were included. This content analysis refers to a systematic analysis of texts with the aim of discovering themes among the data set in order to arrive at valid and reliable inferences. Thus, if bibliometric analysis ensures quantitative evidence, which is important for establishing objectivity, a qualitative assessment that is based solely on researchers’ judgments emphasizes an exploratory approach [39].
The obtained information was compiled into (duly validated) record sheets and stored in a database generated on Excel, which kept a record of all data. These, once organized, facilitated the different analyses. The computerized record was duly validated by expert judgment. The measure of agreement between researchers was calculated by using Cohen’s Kappa value (k = 0.98) [40].

2.3. Statistical Analysis

IBM SPSS v.22 software was used for conducting the corresponding statistical analyses. Descriptive statistics, means, and standard deviations were conducted. After the descriptive analyses and calculation of specific formulas (collaboration index and variation rate), inferential (ANOVA and Tukey’s post hoc) and relational (Pearson’s Rho) analyses were conducted. Indeed, a between-group analysis of variance (ANOVA) with post hoc test was carried out to compare the mean scores. Pearson’s correlation assessed the relationship between variables. The effect size [41] was also calculated. A p < 0.05 value was set for all analyses.

3. Results

This section of the article presents the results of the study. The presentation of the results is organized around the bibliometric indicators.

3.1. Publications by Journal

The following graphics, respectively, show the overall figure for total (13681) and partial SNE documents (1201) published in the journals (Figure A2), together with the total number of journals and SNE documents each one contained (Figure A3). A greater SNE weight was observed in education journals than in psychology and related journals, with the percentage average of SNE documents being 8.78%, with an average number of entries in journals of 61.35%. There are significant differences in terms of documents on SNE being featured (F = 15.44, p = 0.001) and total documents by journals featured (F = 12.29, p = 0.007), more frequent in journals related to pedagogy (education) than to Psychology, and within the latter more in educational psychology journals, as expected.

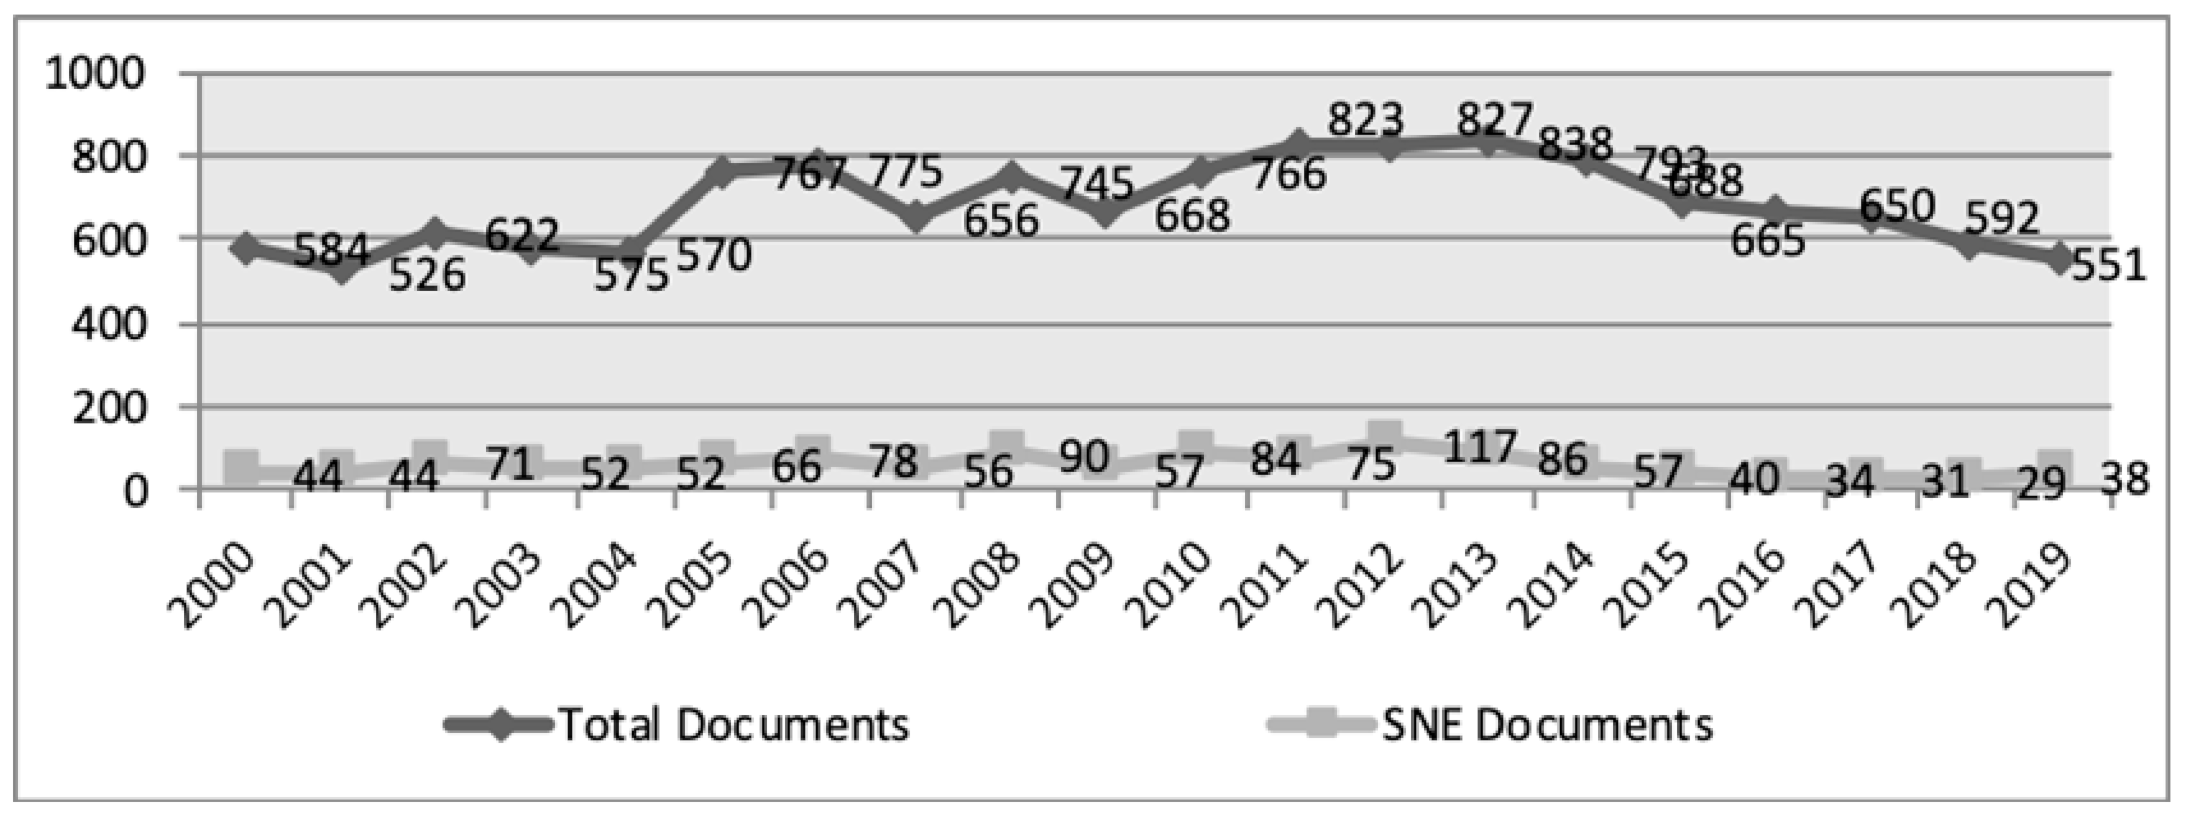
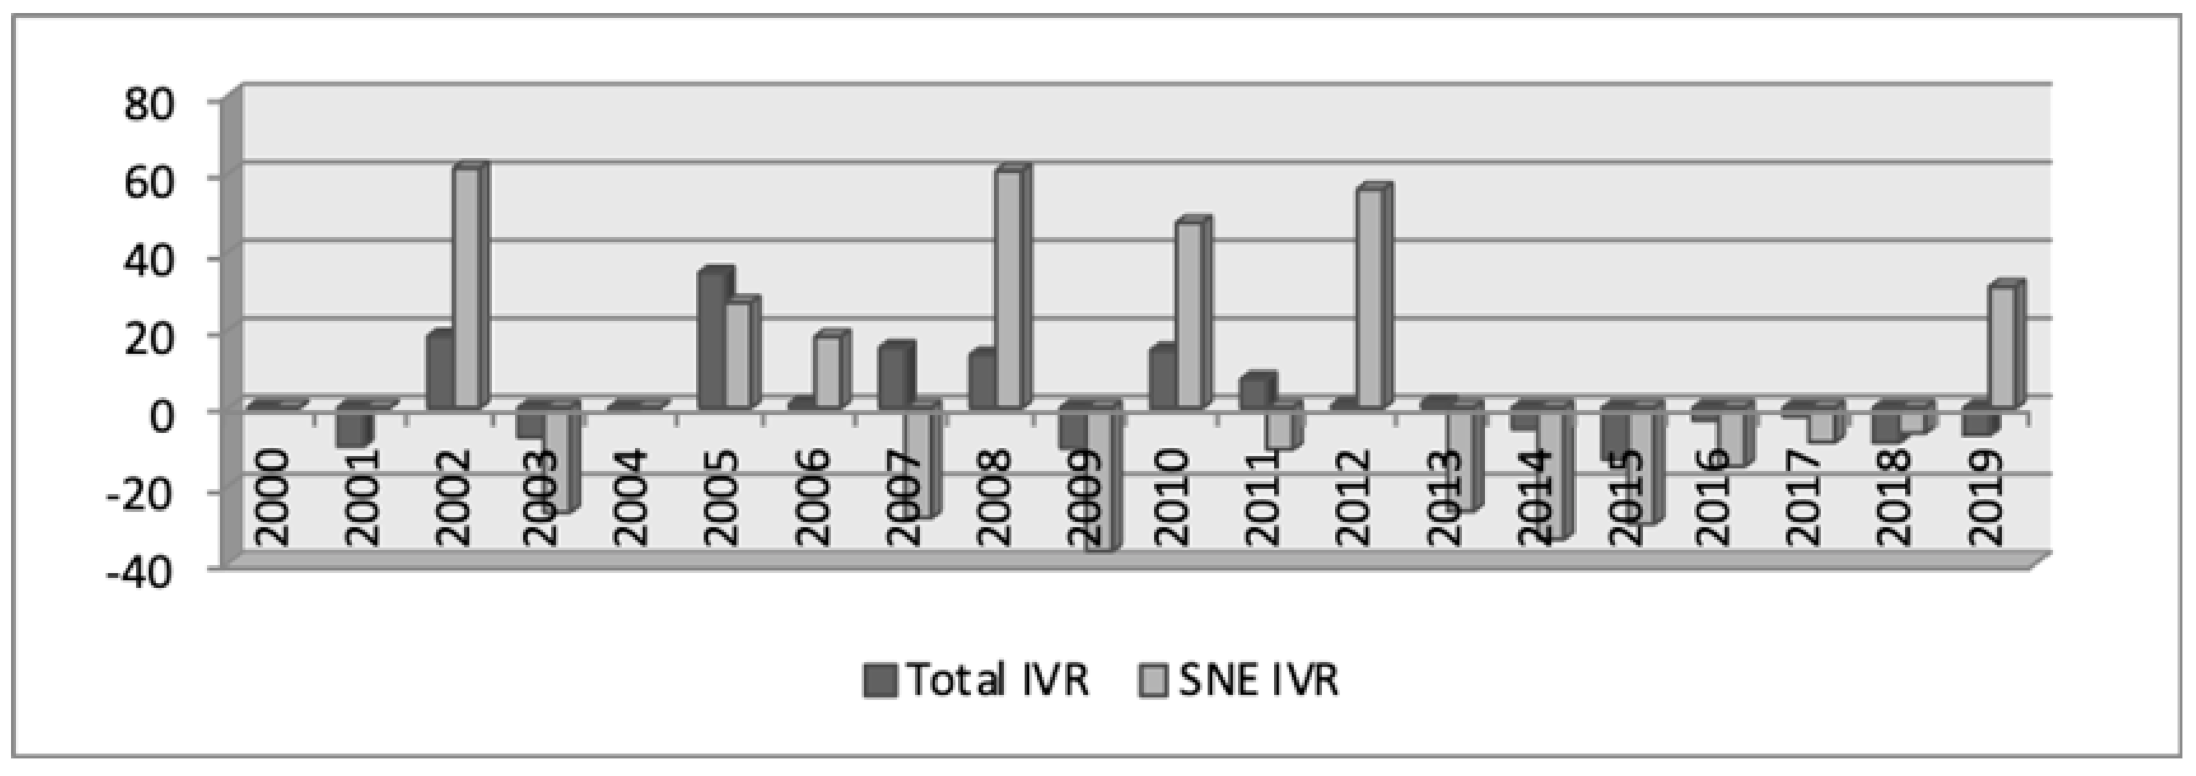
3.2. Publications by Year

As shown in Figure A4 (containing total and SNE frequencies) and Figure A5 (includes interannual variation rates), the presence of interannual documents of a general nature is irregular (M = 684.05, SD = 100.89), and even more so those on SNE (M = 60.05, SD = 23.11). Nevertheless, while interannual differences with regard to total production did not attain statistical significance (F = 1.02, p = 0.090), papers on SNE did (F = 5.24, p = 0.025). This was confirmed by the values of total variation rates: TVR2000–2019Gen. = −5.65 and TVR2000–2019SNE = −13.64.

3.3. Contribution Topics

The “student body” topic is the one that drew the most attention of researchers (32.47%), as shown in Table A1. These studies mainly analyze instruments for appraising developmental disorders and the description of their characteristics, with emphasis on comorbidity and therapeutic treatment. Preoccupation with the “curriculum” constitutes another preferential topic (28.17%), together with interest in “contexts” (27.06%). Prominent in the curriculum area is the researchers’ inclination to appraise intervention programs and the handling of didactic, mainly technological resources. As for contexts, the interest in which has grown over time, particularly in education journals, studies on inclusiveness contexts stand out, and even more so family and peer contexts, headed by school bullying and violence. Lastly, although with a slight upturn in recent times, is the “teaching staff” topic (11.16%).
If we analyze the topics as a whole, without their connection with journals, we observe significant differences between them (F = 8.34, p = 0.001). According to Tukey’s (HSD) test, these differences occur between the “student body” topic and the rest, namely, “contexts” (p = 0.032), “curriculum” (p = 0.042) and “teaching staff” (p = 0.001), and between “teaching staff” and “contexts” (p = 0.004) and “curriculum” (p = 0.007). These differences are considerable, according to Cohen’s d, between “teaching staff” and “contexts” (d = 0.8), “teaching staff” and “curriculum” (d = 0.9) and “teaching staff” and “student body” (d = 1.1). The effect size, however, is low between the rest of the topics. Even between the “contexts” and “curriculum” topics, there are no significant differences (p = 0.397).
When the topics are arranged by journals, we observe significant differences (F = 2.22, p = 0.045) since some of them devote more space to certain themes than to others. The focus of psychology journals is on educational agents (student body and teaching staff). Education journals, however, feature the above topics and the topics of curricular dimensions (programs and resources) and contextual dimensions (especially family and interculturality).
When analyzing the topics by years (Table A2), we observed significant differences (F = 15.38, p = 0.000). Tukey’s HSD test revealed differences between the “student body” and “teaching staff” topics (p = 0.000), with a high effect size (d = 2.2). Contributions on “contexts” also differ significantly from those to do with “teaching staff” (p = 0.035), with a high effect size (d = 0.8). We observed a similar statistical behavior among publications on “curriculum” and “teaching body” (p = 0.029, d = 0.9). However, between these topics, the differences were not significant; moreover, there is actually a connection (rhostudent body-contexts = 0.76; rhostudent body-curriculum = 0.95; rhocontexts-curriculum = 0.84, p = 0.000). Nonetheless, the connection obtained with the “teaching staff” topic is scant (rho = 0.4, p = 0.02). Over time, the publications on “contexts” and “curriculum” have equalized between each other and with regard to “student body”.
As observed in Table A2, the calculation of the IVR in the “student body” topic throws up a slight upward curve, with maximum values of 82.53% and 75% in 2010 and 2012, respectively, and minimum values of −43.33%, 40%, and 35.48 in 2009, 2013, and 2011. In total, there are eight years on the rise that amount to an average interannual rise of 15.45% for the 19 years as a whole and another eight downward years, quantified as an average interannual decline of 11.49%. Added to these are two years without interannual variation. In brief, we calculate a total positive average percentage, a mild rise per year of 4.46%, with a broad spread (SD = 40.76).
As for “contexts”, we observed around double the rise percentage than for annual declines (20.93 % versus 10.48 %). In effect, the IVR percentage has risen for 11 non-consecutive years, headed by the year 2002 (133.33%), followed by the years 2008 (56.25%) and 2012 (47.62%), compared to the seven years of decline, mainly in the years 2009 (48%) and 2015 (45%). Overall, a rising average of 10.45% was obtained (SD = 34.52).
The IVR of the “curriculum” topic increased over nine non-consecutive years, with an interannual average of 16.86%, whereas it experienced a decline of 13.23% over eight years. This represented a positive total rise of 17.65% (SD = 7.81). The years 2008 (66.67%) and 2002 (64.29) were the most prolific ones, while the least productive ones were 2014, 2009, and 2003, with average decline rates of 41.67%, 40%, and 39.13%, respectively.
The “teaching staff” topic, finally, also experiences an increase in regard to its interannual variation (30.96%), far above the previous ones and also with a far higher spread (SD = 124.40). The highest rises in IVR were observed in the years 2003 (350%), 2006 (225%), 2008 (150%), and 2019 (100%), respectively, in addition to other steep rises over five more years, offset by seven negative IVR years, some of them also superb, such as those for the years 2007 (84.62%), 2015 (75%) and 2004 (55.56%).

3.4. Contribution Typology

Research articles (RA) prevail and, to a lesser extent, opinion or review (R) articles. Recensions of books (B) and thesis outlines (T) appear less frequently, as can be observed in the frequencies and central trend measures shown in Table A3. In fact, most journals only feature articles, preferably research articles. Additionally, this trend was consolidated over time given that, except for some monographic issues with a specific subject matter presenting review articles, empirical studies proliferate, which are mainly of a quantitative kind.

3.5. Language of the Contributions

In writing the documents (Table A4), the Spanish language predominates and is followed by English, which has been gaining ground over time. Exponential growth in the number of articles in English was observed. Furthermore, in recent years, some journals are published in a bilingual format (APs, Com, I&A, REd, REP), and others have started to accept articles in English and Spanish (PsC, C&E, ESE, EPs, PsD, TªE). There is even one journal that has been publishing entirely in English since it was founded (SJP).

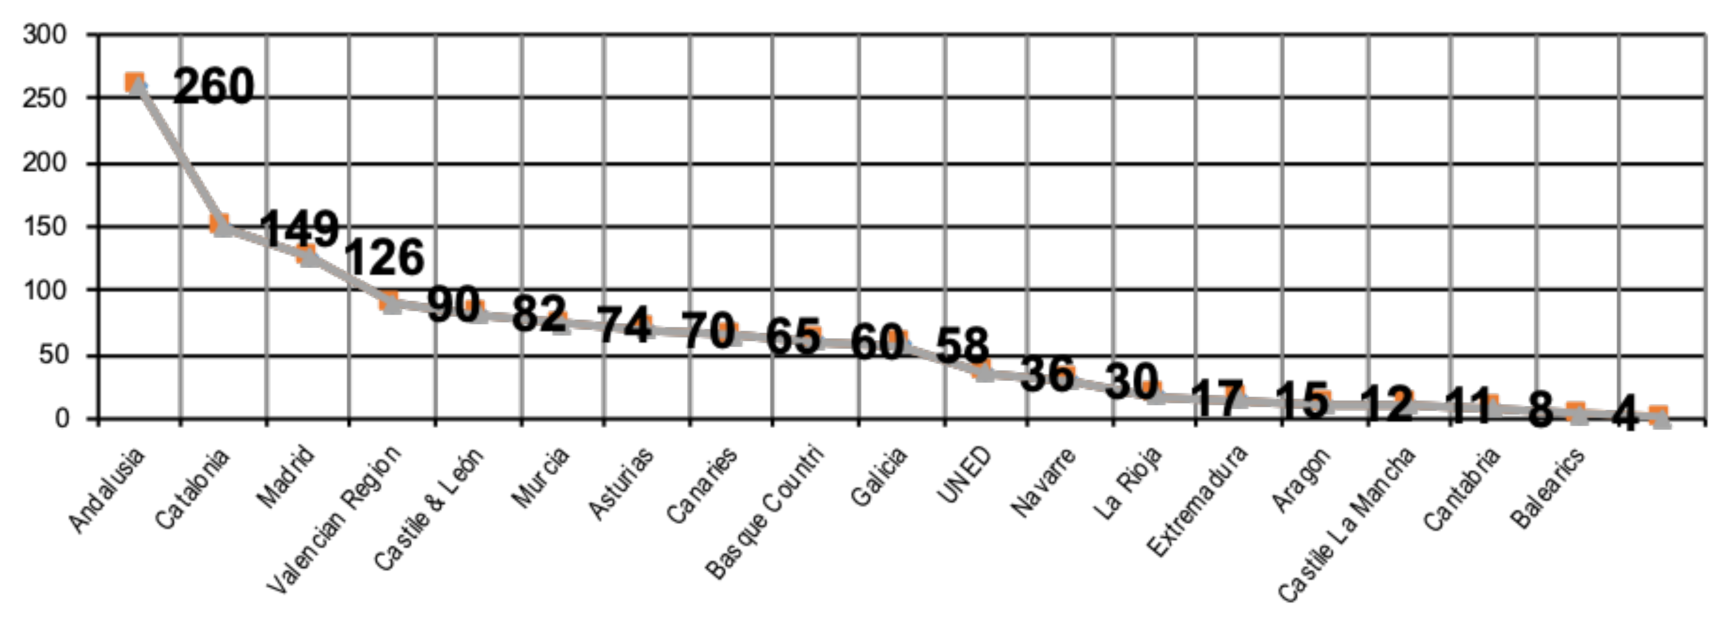
3.6. Provenance of National Contributions and Institutional Affiliation

The presentation of papers in journals lacks consistency. In some cases, only the university is indicated, whereas in others the university, the faculty, and even the department. This prevents making an illustrative classification by departments or faculties, but not by the universities or affiliation institutions of the authors. In brief, a total of 102 universities has been recorded, which account for more than 95% of publications, in addition to other non-university institutions, mainly Spanish ones.
The papers are often signed by authors from different institutions. It happens, for example, that both foreign universities and non-university institutions sign their papers in collaboration with indigenous university institutions, although the total number of university institutions is significant. The increase in collaboration between authors in research publications is aligned with the increase in collaboration between authors from different universities and contexts, although intra-institutional collaborations are more frequent than inter-institutional ones, with a certain degree of equalization being observed in the past decade.
Among the publications from Spanish universities (Figure A6), most of them are authors from the autonomous region of Andalusia (prominent among them the universities of Granada, Córdoba, Sevilla, Málaga, and Almería), followed by Catalonia (represented by the Autonomous University of Barcelona and the University of Lérida) and Madrid (Complutense and Autonomous Universities). Situated in another intermediate segment are the Valencian Region (universities of Valencia and Alicante), Asturias Region (University of Oviedo), Castile and León (universities of Salamanca and León) and Canaries (University of La Laguna). They are followed by the Regions of Galicia (University of Santiago de Compostela), Basque Country, Murcia, Navarre, and the National Distance Education University (UNED), which is accounted for separately given that its members are spread out throughout the country. Lastly, the least productive autonomous regions in the field of SNE are La Rioja, Extremadura, Aragon, Castile–La Mancha, Cantabria, and Balearics.
It should be underlined that some of the most productive universities also publish some of the analyzed journals, which leads us to observe, for example, that there is a high endogamous rate in their papers in the journals “ESE” of the University of Navarre (75%), “Psicothema” of the University of Oviedo (70%), and “Psicodidáctica” of the University of the Basque Country (35%).
Nevertheless, statistical analyses revealed that the significant differences are more evident by journals than by years. The differences by journals attained statistical significance in all cases (F = 17.4, p < 0.05) and also in their post hoc tests. However, by years no levels of significance were attained (p > 0.05). Even the relationship established, according to calculated correlation coefficients, between the number of publications issuing from certain universities and the journal in which they appear is significant and high (rho > 0.7, p < 0.05), although not for all journals and universities.

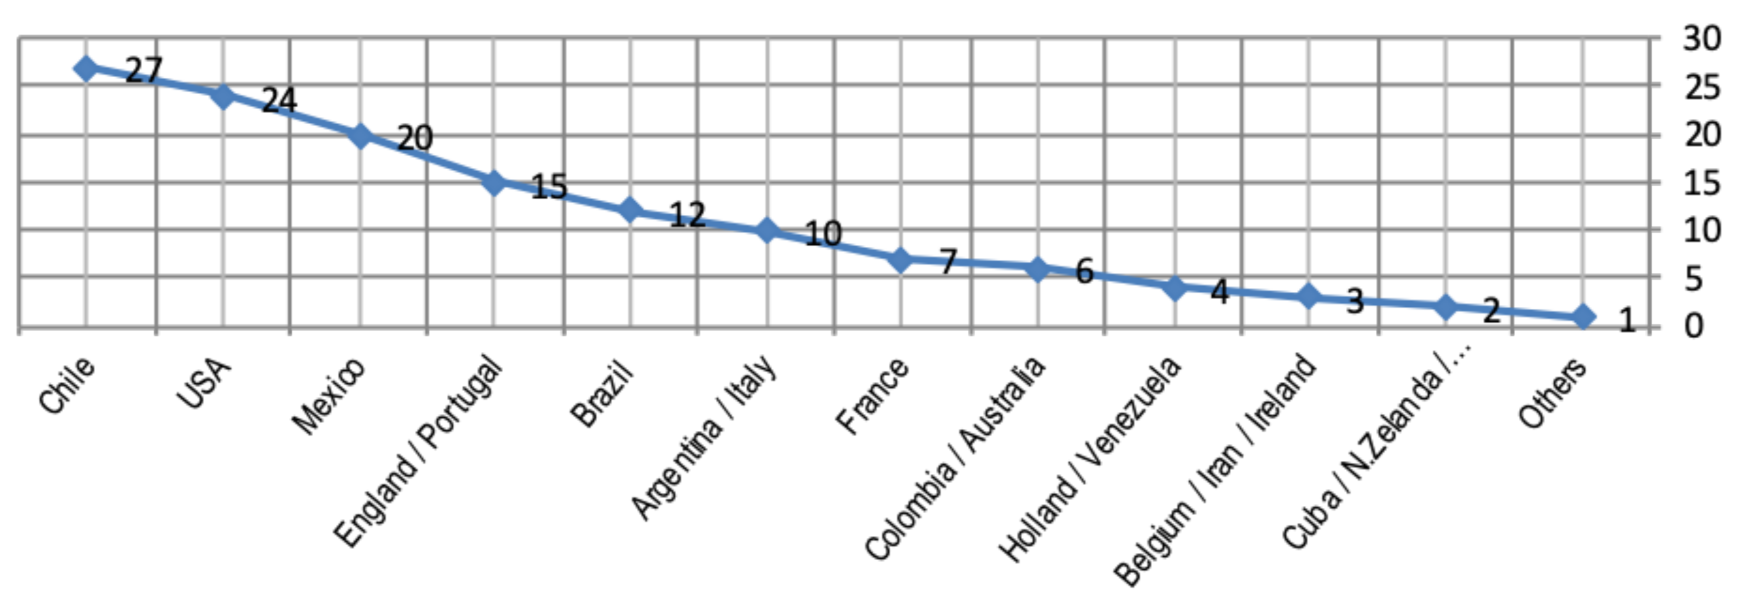
3.7. Provenance of International Contributions and Institutional Affiliation

The analyses revealed the presence of around a hundred different nationalities and more than a hundred different foreign universities, although their frequency of appearance barely attains 10% of publications given that it is more common for their papers to be written in collaboration with Spanish institutions. This percentage decreases to its lowest point (0.1%) for exclusively foreign publications. In any event, the participation of foreign authors is very scant, barely 15%. That said, in recent years we have observed an upward trend in participation, perhaps due to the greater international visibility of the journals since they started accepting papers in English. However, for now, we cannot recognize the international nature of the journals on the basis of contributions by foreign authors. There are nevertheless differences between journals in terms of foreign contributions, which were significant according to the ANOVA calculation and Tukey’s HSD test (p < 0.05).
By countries, the prominent ones, with more than 20 papers, are Chile, the USA, and Mexico. These are followed, with more than 10 articles, by England, Portugal, Brazil, Argentina, and Italy. With less prominence, contributing less than 10 manuscripts, are the universities of France, Colombia, Australia, Holland, and Venezuela. Additionally, there is a token presence of authors from countries such as Belgium, Ireland, Iran, followed by Cuba, New Zealand, Romania, and Russia. Ranked last, with just one contribution, are Austria, Bangladesh, Bolivia, Canada, Czech Republic, Dominican Republic, Egypt, Finland, Germany, Greece, Hawaii, Israel, Kazakhstan, the Netherlands, Norway, Peru, Puerto Rico, Scotland, Singapore, Switzerland, and Turkey. Note this gradation in Figure A7.

3.8. Authorship of Contributions

As for authorship (Table A5), the most prominent ones are papers signed by a single author (28.6%), although some journals show a prevalence of articles written by a pair (24.4%) and even by three authors (22.6%). Moreover, if we remove thesis outlines and books, which tend to be signed by a single author, the above frequencies move significantly closer. The total of these (co)authorships exceeds 75%. As pointed out by Lee y Bozeman [42], the authors are the driving force in scientific research, and scientific productivity is strongly correlated with international collaboration among researchers, countries, and institutions.
Another noteworthy aspect concerns publications signed by four authors (11.9%). Thereafter, the percentages decline steeply to below 10%. This being the case, the spread of this variable, measured by standard deviation, is high in the journals and contributions as a whole except in the case of outlines and recensions.
The collaboration index (CI) calculated for this study threw up a value of 2.9. In the different journals, this index ranges from 1.9 to 3.6, with an SD of 0.6. However, overall, international co-authorship in the social sciences has increased [43].
In statistical terms, we observed significant differences (F = 8.1, p = 0.000) of a moderate nature (eta2 = 0.3). Analyzing the regrouped data per year revealed an interesting trend. While in the first five-year period (2000–04) the CI barely managed 2.3 authors per entry, with a similar spread (SD = 1), in the last five-year period (2015–19), co-authorship increased, with a CI of 3.6 authors (SD = 0.9). The ANOVA calculation for the CI per year and Tukey’s HSD tests confirmed the presence of significant differences (p < 0.05) between the initial and intermediate years, with a large effect size (d = 0.9), and even more in the final ones (p < 0.01), with a high effect size (d = 1.22). The subsets test suggested three groups, i.e., 2000–2014, 2005–2014 (except for 2012), and 2015–2019 and 2012.
The increase in cooperative research entails the interdisciplinary growth of teams, with greater interannual collaboration between professionals from different departments and faculties, amounting to 4.5% for the first five-year period compared to 33.3% for the last, of which almost a third consists of a collaboration of more than two specialties. Part of this consists of inter-university collaboration, with 25% of the total in the last period and a token percentage in the first one (barely 2.5%). We have even detected an increase in the international nature of the entries—of the 28.7% calculated for the final period of the analysis, more than 20% is co-authored with Spanish researchers. As pointed out by Lee and Bozeman [42], many studies have confirmed a strong relationship between collaboration and scientific productivity. Research in many fields is complex and requires more specialized knowledge more than any single individual can expect to have. In addition, papers with international co-authorship have an even higher impact [44].

4. Discussion

The overall objective of this research was to provide a general overview of SNE in Spain in the past 20 years, based on documents published in education and related journals from the core collection of the WoS (JCR). Although we did find a certain frequency of SNE manuscripts in the high-impact journals we analyzed, we did not observe a uniform trend pattern by years or by journals, nor the presence of Spanish SNE journals in JCR. This causes uncertainty among interested readers and researchers, who see how the possibility of increasing their personal and social recognition is diminished, and their ability to make the quality of their research known is limited [21]. This circumstance differs from other countries, above all the English-speaking ones, where the presence of SNE journals of renown is no mere anecdote.
As for the subject matter, it is worth noting the attention elicited by the topic of “student body” with disabilities and disorders, with the latter more represented in psychology-related journals. This fact is consistent with prior bibliometric research undertaken in the Spanish context [16,17,18], in which concern for the “student body” with sensory and intellectual disability, and their learning difficulties, was a recurring issue. This finding was also observed in foreign-related studies [44]. Based on these results, it is of special relevance to carry out bibliometric studies that allow knowing, with greater accuracy, the type of studies designed and objectives that were intended to be achieved when the focus of study has been on students with sensory or intellectual disabilities or learning difficulties.
This is followed with great similarity by the topics of “contexts” and “curriculum,” which are present in most journals, although the former is more prevalent in psychology journals and the latter in education journals. Last is the “teaching staff” topic, with a greater presence in education journals. Chronologically, the above proportions are maintained, although the documents referring to “teaching staff” occupy a preferential place, followed by those of “contexts”.
With regard to the type of publication, empirical-type studies prevail. This trend is increased over time, as highlighted by other research studies [2,15,18]. These studies, whose international emergence is growing, are circumscribed to the Spanish sphere, and are conducted by native researchers in their majority, as pointed out by Fuentes, Luque, and Lopez [45], although international participation is gradually increasing due to the boost in collaboration networks within the scientific community [2,19,46].
Manuscripts are frequently signed by several researchers, in keeping with antecedent discoveries [19,47,48]. This finding temporarily differs from what has been observed by researchers from our context [2,18,46,49] and by foreigners [15]. In effect, our study detected a CI of 2.9, identical to that obtained by Maz et al. [48], and higher than that found by other researchers [16,17,46], which is due to multidisciplinary collaboration, both national and international, and to an increase in research teams in recent years, as demonstrated in this study and other previous ones [2,19,47,50], hence the annual increase in texts in English and even bilingual ones, perhaps because English is generally the preferred language of communication in the world of science [51]. Nevertheless, individualized contributions have so far been identified in entries of review articles and, to a lesser extent, some book recensions and thesis outlines.

5. Conclusions

Bibliometrics is a statistical method used to organize thematic information, evaluate scientific development, compare research performance, and identify emerging research fronts [52]. Research has shown that scientific output in terms of original articles and books has been increasing at an accelerated rate [53]. Understanding the past and current body of publications in a field of study is a condition for increasing research in the future [20]. The findings of this study offer insights into the current state of special-needs education in Spain and provide future research directions.
This paper has established that the publication of SNE documents during the 2000–2019 period in Spanish high-impact journals is considerable. However, the presence of SNE, both in journals and by years, is uneven. The most widely analyzed topic was “student body” with disabilities and disorders. This was followed by “contexts” and “curriculum” and, to a lesser extent, by “teaching staff.” In general, the attention merited by these topics shows an upward trend. Furthermore, empirical papers predominate, mostly addressed through a collaborative approach and increasingly with a growing presence of international researchers. Texts in Spanish predominate, even though manuscripts in English are increasingly common.

Limitations and Implications for Research and Practice

Although bibliometric studies provide relevant data on research practices and their underlying policies, perhaps this study’s principal limitation is the risk posed by analyzing the results of the science only according to quantitative parameters –without in-depth qualitative interpretation of the content—that prevent us from delving deeper into the quality of the research processes. Moreover, this study is based on articles indexed on WoS only and may differ from those gathered from other databases. Due to this limitation, many research outputs on special-needs education are bound to be missed [6]. However, these deficiencies should not discourage researchers on a quest for research networks and rigorous information based on new meta-analyses and different indicators that allow for reinforcing the body of knowledge on this field of study, which would be far-reaching for researchers and education administrators alike.

Author Contributions

Conceptualization, J.L.G.O. and A.R.F.; methodology, J.L.G.O., A.R.F. and A.G.G.; software, A.G.G.; validation, J.L.G.O., A.R.F. and A.G.G.; formal analysis, A.G.G.; investigation, J.L.G.O., A.R.F. and A.G.G.; resources, A.R.F.; data curation, A.R.F.; writing—original draft preparation, A.R.F. and A.G.G.; writing—review and editing, J.L.G.O.; visualization, A.G.G.; supervision, J.L.G.O. and A.R.F.; project administration, A.R.F.; funding acquisition, J.L.G.O. All authors have read and agreed to the published version of the manuscript.

Funding

This research received no external funding.

Institutional Review Board Statement

Not applicable.

Informed Consent Statement

Not applicable.

Data Availability Statement

Not applicable.

Conflicts of Interest

The authors declare no conflict of interest.

Appendix A

Table A1. Subject matter of documents selected by journals.
Journals (J)Student BodyContextsCurriculumTeaching Staff Total
J1. Anales de Psicología402512582
J2. Psicología conductual25171043
J3. Comunicar799631
J4. Cultura & Educación1220221164
J5. Educación XX19920644
J6. Estudios sobre Educación1614341074
J7. Estudios de Psicología1681227
J8. Infancia & Aprendizaje352830699
J9. Int. J. of C. H. Psychology17119239
J10. Psicothema7357338171
J11. Revista de Educación607511117263
J12. Rev. de Psicodidáctica201213449
J13. Rev. Esp. de Pedagogía22618652
J14. Spanish J. of Psychology2413104794
J15. Teoría de la Educación142130469
Total3903253531341201
M2621.6723.538.9380.07
SD18.8419.3921.0311.3262.13
Note. J = Journal, M = Mean, SD = Standard Deviation. Source: own compilation.
Table A2. Chronological subject matter of the documents and interannual variation rate (IVR).
Student BodyContextsCurriculumTeaching StaffTotal
fIVRfIVRfIVRfIVRfIVR
200017-9-12-6-44-
2001185.88901416.673−50440
20022538.8921133.332364.292−33.337161.36
200318−2811−47.6214−39.13935052−26.76
20041801427.271614.294−55.56520
20052116.671721.432450406626.92
2006210185.88268.33132257818.18
200720−4.7616−11.1118−23.082−84.6256−28.21
200830502556.253066.6751509060.71
200917−43.3313−4818−4098057−36.67
20103182.351838.462433.331122.228447.37
201120−35.482116.6722−8.33129.0975−10.71
201235753147.623350185011756
201321−4028−9.6824−27.2713−27.7886−26.50
201415−28.5720−28.5714−41.678−38.4657−33.72
20151713.3311−4510−28.572−7540−29.82
201612−29.4110−9.099−1035034−15
201710−16.67910903031−8.82
201811101011.116−33.332−33.3329−6.45
20191318.181430716.6741003831.03
Total39084.78325198.6235368.87134588,23120178.81
M19.504.4616.2510.4517.653.626.6530.9660.14.15
SD6.5840.766.5334.527.8139.374.71124.4023.1127.36
Note. f = frequency, IVR = Interannual Variation Rate, M = Mean, SD = Standard Deviation. Source: own compilation.
Table A3. Document typology.
Journals (Identified by Their Number)Total/%M (SD)
123456789101112131415
A7130164931182185311491232633941078752.5
65.5%(42.1)
R1113151513296148108610190725617.1
21.3%(20.2)
B000002700095450030125 8.3
10.4%(16.7)
T000000000308002233 2.2
2.7%(5.9)
Total824331644474279939171263495294691201
Note. A = Article, R = Review, B = Book, T = Thesis, % = Percentage, M = Mean, SD = Standard Deviation. Source: own compilation.
Table A4. Language of the documents.
LanguageJournals (Identified by Their Number)Total/%M (SD)
123456789101112131415
Spanish4441146228702387231242353042069892/74.3%59.5 (57.9)
English1620204121647183940196/16.3%13.1 (25.5)
Both 230170280410002711700127/10.6%8.5 (10.5)
Total824331644474279939171263495294691201
Note. % = Percentage, M = Mean, SD = Standard Deviation. Source: own compilation.
Table A5. Authorship of documents.
AuthorsPartial Documents (Per Journal)Total (%)M (SD)
123456789101112131415
14011146373102101171617542294 (24.5)19.6 (29.5)
210861412141030644658122010269 (22.4)17.9 (16.5)
329134151110725944421315264267 (22.2)17.8 (12.7)
42012918119417113929752511227 (18.9)15.1 (9.7)
5108134211041810328286 (7.2)5.7 (4.8)
642000214494116038 (3.2)2.5 (2.6)
740000000225001014 (1.2)0.9 (1.6)
80000001211100107 (0.6)0.5 (0.6)
91000000102010207 (0.6)0.5 (0.7)
100000000001000001 (0.1)0.1 (0.4)
110000000001000001 (0.1)0.1 (0.4)
Total Doc.824331644474279939171263495294691201
Total Authors30215572174127149793121515916061291223121283437
IC3.73.62.32.72.9 2.12.93.23.9 3.52.32.62.43.31.9 2.9
Note. % = Percentage, M = Mean, SD = Standard Deviation, Doc. = Documents, IC = Co-authorship index. Source: own compilation.

Appendix B

Figure A1. Journals in Journal Citation Report (JCR) and documents (“ESE” and “TªE” are not currently in the JCR). Source: own compilation.
Mathematics 09 00684 g0a1
Figure A2. Total documents/special‐needs education documents by journals.
Mathematics 09 00684 g0a2
Figure A3. Number of total journals with a special-needs education document. Source: own compilation.
Mathematics 09 00684 g0a3
Figure A4. Total documents/special‐needs education documents by years.
Mathematics 09 00684 g0a4
Figure A5. Interannual variation rate for total documents/special-needs education documents. Source: own compilation.
Mathematics 09 00684 g0a5
Figure A6. Demarcation of the publications. Source: own compilation.
Mathematics 09 00684 g0a6
Figure A7. Nationality of publications. Source: own compilation.
Mathematics 09 00684 g0a7

References

  1. Brownell, M.T.; Griffin, C.; Leko, M.M.; Stephens, J. Improving Collaborative Teacher Education Research. Teach. Educ. Spéc. Educ. J. Teach. Educ. Div. Counc. Except. Child. 2011, 34, 235–249. [Google Scholar] [CrossRef]
  2. García, J.M.; Inglés, C.J.; Gonzálvez, C.; Vicent, M.; Gómez, I. Familia y discapacidad, un estudio bibliométrico de 2000–2011 a través de Social Science Citation Index. Siglo Cero 2013, 44, 67–82. [Google Scholar]
  3. King, C.M. Research productivityint the education of hearing impaired individuals. J. Spec. Educ. 1989, 23, 279–293. [Google Scholar] [CrossRef]
  4. Durieux, V.; Gevenois, P.A. Bibliometric Indicators: Quality Measurements of Scientific Publication. Radiology 2010, 255, 342–351. [Google Scholar] [CrossRef] [PubMed]
  5. Blanco-Encomienda, F.J.; Rosillo-Díaz, E. Quantitative evaluation of the production and trends in research applying the structural equation modelling method. Scientometrics 2021, 126, 1599–1617. [Google Scholar] [CrossRef]
  6. Morrison, T.G.; Morrison, M.A.; McCutcheon, J.M. Best Practice Recommendations for Using Structural Equation Modelling in Psychological Research. Psychology 2017, 8, 1326–1341. [Google Scholar] [CrossRef] [Green Version]
  7. Hallinger, P.; Kovačević, J. A Bibliometric Review of Research on Educational Administration: Science Mapping the Literature, 1960 to 2018. Rev. Educ. Res. 2019, 89, 335–369. [Google Scholar] [CrossRef]
  8. Halim, Z.; Khan, S. A data science-based framework to categorize academic journals. Science 2019, 119, 393–423. [Google Scholar] [CrossRef]
  9. López-Robles, J.; Otegi-Olaso, J.; Gómez, I.P.; Cobo, M. 30 years of intelligence models in management and business: A bibliometric review. Int. J. Inf. Manag. 2019, 48, 22–38. [Google Scholar] [CrossRef]
  10. Aria, M.; Cuccurullo, C. Bibliomaetrix: An R-tool for comprehensive science mapping analysis. J. Inf. 2017, 11, 959–975. [Google Scholar] [CrossRef]
  11. Perianes-Rodriguez, A.; Waltman, L.; van Eck, N.J. Constructing bibliometric networks: A comparison between full and fractional counting. J. Inf. 2016, 10, 1178–1195. [Google Scholar] [CrossRef] [Green Version]
  12. Shonhe, L. Continuous Professional Development (CPD) of librarians: A bibliometric analysis of research productivity viewed through WoS. J. Acad. Libr. 2020, 46, 102106. [Google Scholar] [CrossRef]
  13. Fernández, J.M. La investigación en Educación Especial. Líneas y perspectivas de futuro. Perf. Educ. 2008, 30, 7–32. [Google Scholar]
  14. Sánchez, A.; Carrión, J.J. Una aproximación a la investigación en Educación Especial. Rev. Educ. 2002, 327, 225–247. [Google Scholar]
  15. Da Silva, R.C.; Hayashi, M.C. Revista Educação Especial: Um estudo bibliométrico da produção científica no campo da Educação Especial. Rev. Educ. Esp. 2008, 21, 117–136. [Google Scholar]
  16. Gallego, J.L.; Rodríguez, A. Líneas de investigación sobre educación especial en España: Un estudio bibliométrico (2006–2010). Rev. Cienc. Soc. 2015, 21, 219–233. [Google Scholar]
  17. Rodríguez, A.; Gallego, J.L. Análisis bibliométrico sobre educación especial. Profesorado 2019, 23, 307–327. [Google Scholar] [CrossRef]
  18. Romera, M.J. Potencialidad de la bibliometría para el estudio de la ciencia: Aplicación a la educación especial. Rev. Educ. 1992, 297, 459–478. [Google Scholar]
  19. Esteve, M.I.V.; Suelves, D.M.; Chacón, J.P.; Baldoví, M.I.P. Technologies for Attention to Diversity: A Bibliometric Study. In Proceedings of the 5th International Conference on Higher Education Advances (HEAd’19), Valencia, Spain, 26–28 June 2019; Available online: http://dx.doi.org/10.4995/HEAd19.2019.9126 (accessed on 15 February 2010).
  20. Kastrin, A.; Hristovski, D. Scientometric analysis and knowledge mapping of literature-based discovery (1986–2020). Scientometrics 2021, 126, 1415–1451. [Google Scholar] [CrossRef]
  21. Haba, J.; González, F.; Osca, J. Las revistas de educación a nivel mundial: Un análisis de las publicaciones incluidas en el Journal Citation Reports (JCR) del 2016. Rev. Educ. 2019, 383, 113–131. [Google Scholar] [CrossRef]
  22. Quevedo, R.; Guillén, A.; Buela, G. Análisis bibliométrico de las revistas de Psicología afines al ámbito Jurídico-Forense atendiendo a la WoS y el JCR (2018). Rev. Invest. Educ. 2019, 17, 165–178. [Google Scholar]
  23. Alfaro, E.; González, F.; Tortosa, M.; Osca, J. Análisis bibliométrico de The European Journal of Psychology Applied to Legal Context entre 2009–2018. Rev. Invest. Educ. 2019, 17, 179–195. [Google Scholar] [CrossRef]
  24. Valle, S. Retos de las Ciencias Sociales en la producción científica. In Cienciometría y Bibliometría. El Estudio de la Producción Científica; Ávila, J.H., Ed.; Corporación Universitaria Reformada: Barranquilla, Colombia, 2018; pp. 49–76. [Google Scholar]
  25. Borrego, A.; Urbano, C. La evaluación de revistas científicas en ciencias sociales y humanidades. Inf. Cult. Soc. 2006, 14, 11–27. [Google Scholar]
  26. Chang, C.L.; McAleer, M.; Oxley, L. Journal Impact Factor, Eigenfactor. Journal Influence and Article Influence (Nº 13-002/III). Tinbergen Institute Discussion Paper. 2013. Available online: https://ideas.repec.org/p/tin/wpaper/20130002.html (accessed on 15 January 2021).
  27. Delgado, A.; Vázquez-Cano, E.; Belando, M.R. Análisis bibliométrico del impacto de la investigación educativa en diver-sidad funcional y competencia digital: Web of Science y Scopus. Aula Abierta 2019, 48, 147–156. [Google Scholar] [CrossRef]
  28. Delgado-López-Cózar, E.; Repiso-Caballero, R. The impact of scientific journals of communication: Comparing Google Scholar Metrics, Web of Science and Scopus. Comunicar 2013, 21, 45–52. [Google Scholar] [CrossRef] [Green Version]
  29. Lucio-Arias, D. Internacionalización de la investigación en las instituciones de educación superior en Colombia: Una mirada desde la producción científica, 2008–2013. In Reflexiones Para la Política de Internacionalización de la Educación Superior en Colombia; Nupia, C.M., Ed.; Observatorio Colombiano de Ciencia Tecnología e Innovación (OCYT): Bogotá, Colombia, 2014; pp. 221–245. [Google Scholar]
  30. Waltman, L.; van Eck, N.J.; van Leeuwen, T.N.; Visser, M.S.; van Raan, A.F.J. On the correlation between bibliometric indicators and peer review: Reply to Opthof and Leydesdorff. Science 2011, 88, 1017–1022. [Google Scholar] [CrossRef] [Green Version]
  31. Chen, C.; Song, M. Representing Scientific Knowledge; Springer: London, UK, 2017. [Google Scholar]
  32. Rowley, J.; Sbaffi, L. Academics’ attitudes towards peer review in scholarly journals and the effect of role and discipline. J. Inf. Sci. 2018, 44, 644–657. [Google Scholar] [CrossRef]
  33. Nederhof, A.J.; Luwel, M.; Moed, H.F. Assessing the quality of scholarly journals in Linguistics: An alternative to citation-based journal impact factors. Science 2001, 51, 241–265. [Google Scholar] [CrossRef]
  34. Hayashi, C.R.M. Apontamentos sobre a coleta de dados em estudos bibliométricos e cientométricos. Filos. Educ. 2013, 5, 89–102. [Google Scholar] [CrossRef] [Green Version]
  35. Riviera, E. Scientific communities as autopoietic systems: The reproductive function of citations. J. Am. Soc. Inf. Sci. Technol. 2013, 64, 1442–1453. [Google Scholar] [CrossRef]
  36. Joshi, M.A. Bibliometric Indicators for Evaluating the Quality of Scientific Publications. J. Contemp. Dent. Pr. 2014, 15, 258–262. [Google Scholar] [CrossRef] [PubMed]
  37. Rodríguez, A. Research on special education needs: What and how to investigate in special education. Electron. J. Res. Educ. Psychol. 2005, 3, 97–112. [Google Scholar]
  38. Salvador, F. Didáctica de la Educación Especial; Aljibe: Málaga, Spain, 1999. [Google Scholar]
  39. Aliyev, F.; Urkmez, T.; Wagner, R. A comprehensive look at luxury brand marketing research from 2000 to 2016: A bibliometric study and content analysis. Manag. Rev. Q. 2018, 69, 233–264. [Google Scholar] [CrossRef]
  40. Wright, R.W.; Brand, R.A.; Dunn, W.; Spindler, K.P. How to Write a Systematic Review. Clin. Orthop. Relat. Res. 2007, 455, 23–29. [Google Scholar] [CrossRef] [Green Version]
  41. Cohen, J. Statistical Power Analysis for the Behavioral Sciences, 2nd ed.; Routledge: New York, NY, USA, 1988. [Google Scholar]
  42. Lee, S.; Bozeman, B. The Impact of Research Collaboration on Scientific Productivity. Soc. Stud. Sci. 2005, 35, 673–702. [Google Scholar] [CrossRef]
  43. Thonon, F.; Boulkedid, R.; Delory, T.; Rousseau, S.; Saghatchian, M.; Van Harten, W.; O’Neill, C.; Alberti, C. Measuring the Outcome of Biomedical Research: A Systematic Literature Review. PLoS ONE 2015, 10, e0122239. [Google Scholar] [CrossRef] [PubMed]
  44. Henriksen, D. The rise in co-authorship in the social sciences (1980–2013). Science 2016, 107, 455–476. [Google Scholar] [CrossRef]
  45. Fuentes, J.L.; Luque, D.; López, E. Análisis bibliométrico de las revistas españolas de educación incluidas en el JCR: Pro-ducción científica y elementos controvertidos. Teoría Educ. 2012, 24, 183–217. [Google Scholar]
  46. Figueiredo, M.D.O.; Mazer, S.M.; Emmel, M.L.G.; Alba, E.F. Análisis de la producción científica en Brasil sobre dificultades de aprendizaje: Una revisión bibliométrica. Aula Abiert 2014, 42, 31–38. [Google Scholar] [CrossRef] [Green Version]
  47. Inglés, C.J.; Rico-Moreno, J.; Vicent, M.; Gonzálvez, C.; Díaz-Herrero, Á.; García-Fernández, J.M. Revisión bibliométrica en Síndrome de Asperger: Impacto en el ámbito de la psicología y educación. Eur. J. Child Dev. Educ. Psychopathol. 2015, 3, 5–18. [Google Scholar] [CrossRef]
  48. Maz-Machado, A.; Torralbo-Rodríguez, M.; Vallejo-Ruiz, M.; Bracho-López, R. Análisis bibliométrico de la producción científica de la Universidad de Málaga en el Social Sciences Citation Index (1998–2007). Rev. Esp. Doc. Cient. 2010, 33, 582–599. [Google Scholar] [CrossRef] [Green Version]
  49. Gutiérrez, P.; Maz, R.; Hidalgo, M.D. Análisis de la coau¬toría en la revista Bordón (1984–2008). In VII Foro sobre Evaluación de la Calidad de la Investigación y de la Educación Superior; Castro, A., Guillén, A., Eds.; Asociación Española de Psicología Conductual: Granada, Spain, 2010; pp. 749–753. [Google Scholar]
  50. Robinson-Garcia, N.; Amat, C.B. Tiene sentido limitar la coautoría científica? No existe inflación de autores en Ciencias Sociales y Educación en España. Rev. Esp. Doc. Cient. 2018, 41, 201. [Google Scholar] [CrossRef] [Green Version]
  51. Koch, T.; Vanderstraeten, R. Internationalizing a national scientific community? Changes in publication and citation practices in Chile, 1976–2015. Curr. Sociol. 2018, 67, 723–741. [Google Scholar] [CrossRef]
  52. Chen, X.; Ding, R.; Xu, K.; Wang, S.; Hao, T.; Zhou, Y. A Bibliometric Review of Natural Language Processing Empowered Mobile Computing. Wirel. Commun. Mob. Comput. 2018, 2018, 1–21. [Google Scholar] [CrossRef]
  53. Bornmann, L.; Mutz, R. Growth rates of modern science: A bibliometric analysis based on the number of publications and cited references. J. Assoc. Inf. Sci. Technol. 2015, 66, 2215–2222. [Google Scholar] [CrossRef] [Green Version]
Publisher’s Note: MDPI stays neutral with regard to jurisdictional claims in published maps and institutional affiliations.

