Article

Evaluating Pallet Investment Strategy Using Fuzzy Analytic Network Process: A Case in Chinese Chain Supermarkets

1
School of Economics and Management, Sanming University, No. 25, Ching-Tung Rd., Sanming 365004, China
2
School of Education Science, Minnan Normal University, No. 36, Shì Qian Zhi St., Zhangzhou 363000, China
3
Department of Business Administration, Ming Chuan University, 250 Zhong Shan North Rd., Section 5, Shilin District, Taipei 111, Taiwan
*
Author to whom correspondence should be addressed.
Mathematics 2021, 9(24), 3210; https://doi.org/10.3390/math9243210
Submission received: 31 October 2021 / Revised: 2 December 2021 / Accepted: 3 December 2021 / Published: 12 December 2021
(This article belongs to the Special Issue Fuzzy Group Decision Making)

Abstract

:
Presently in Chinese chain supermarkets, many enterprises have built automatic equipment and information facilities in the logistics center of their supply chain systems. Modern logistics technology and equipment largely depend on the resource integration of each role in the chain (such as suppliers, manufacturers, wholesalers, and retailers), especially logistics facilities and equipment resources, to realize the circulation of products. The pallet, which is an indispensable basic tool for a supply chain system in the process of product circulation, is most often used in the handling, stacking, storage, and transportation of products. The process of building automation and informationization in the supply chain system of Chinese supermarket chains requires the solving of the problems of cost and sharing pallets in logistics operations. Large-scale enterprises often spend millions of dollars on investment, the failure of which can cause significant harm to the enterprise. Therefore, the authors of this paper adopted the fuzzy analytic network process (FANP), combining fuzzy and ANP models to evaluate our studied case. We utilized an actual case as the research object to resolve the important decisions regarding pallet resource sharing investment in the supply chain system. Importantly, it is expected that the proposed method can provide an important reference standard or a new idea for decision makers in the chain supermarket industry or related industries.

1. Introduction

The term “chain supermarket” refers to the unified purchase, distribution, and management methods across multiple supermarkets. Strong competition can be formed by combining the advantages of the supermarket with organically operated chains, so this is the form commonly adopted by supermarkets. With the rapid development of the economy, shopping demand is increasing and the operation mode of supermarkets in China have gradually developed into the operation mode of large-chain supermarkets, integrating business and storage. According to the statistical report of the China Industrial Research Institute (CIRI), the number of chain supermarket stores in China has been declining year by year from 33,301 in 2015 to 27,054 in 2019, with a decrease rate of 18.76% [1]. In addition, the sales amount of the top 100 Chinese chain supermarkets in 2019 was about 968 billion YUAN (RMB), accounting for 5.5% of the total social zero sales of the year. Moreover, the number of stores was about 26,207, accounting for about 96% of the total number of chain supermarkets [1]. From the above-mentioned data, it can be observed that China’s large supermarket chain system is of great importance to people’s livelihood and economic consumption, as well as that the operation modes of supermarket chains are trending towards market centralization (store integration) on a larger scale.
The number of large supermarket chain stores has increased with the development of the market. Expansions in scale, in addition to the construction of logistics centers and the use of these logistics centers to centralize distribution, reduce logistics costs and ensure logistics efficiency. To achieve economic benefits, this strategy has become the only choice for these enterprises [2]. In a logistics supply chain system, the logistics center is the connecting node between the upstream and downstream suppliers, wholesalers, retailers, and customers. Its main function is to use circulation facilities and an information system for collecting, storing, sorting, picking, distributing, loading, unloading, and handling products, as well as to provide distribution services for customers. Every link in the logistics operation system faces the problems of technical guarantee and management optimization. It can be said that the logistics status of these products determines the profit of supermarket operation or the possible profit of each intermediate link [3,4]. The chain supermarket system in China mostly performs commodity distribution in the mode of self-built logistics centers; therefore, if the distribution mode cannot save costs for the enterprises, it will consume many human, material, and financial resources [5].
Presently in Chinese chain supermarkets, many enterprises have built automatic equipment and information facilities in the logistics center of their supply chain systems. Modern logistics technology and equipment largely depend on the resource integration of each role in the chain (such as suppliers, manufacturers, wholesalers, and retailers), especially the logistics facilities and equipment resources needed to realize the transportation, storage, and information platforms of products. It is worth mentioning that the pallet, as the most indispensable tool in the process of product circulation in the supply chain system, is most often used in the handling, stacking, storage, and transportation of products. The main task in the process of realizing the automation and informationization of chain supermarket supply-chain systems in China is solving the problems faced by pallets in the process of logistics operation. These problems comprise two aspects. First is the problem of cost. In supermarket logistics centers, most pallets used for the circulation of goods have ended their service lives with the transfer of the ownership of goods. That is, they are mostly single-use products and therefore not cost-effective for the enterprise or the manufacturer and result in the purchase of pallets every year. This cost is added to the value of goods in circulation, which greatly increases the cost of such goods. Second is the problem of sharing. Pallets are mainly used in logistics centers and stores within the same group systems. If an upstream supplier and logistics center use different pallet specifications, enterprise resources may be wasted and the cost of logistics may increase due to the need to reassemble units in the process of product transfer. In summary, the main task of the standardization of supermarket logistics centers in the construction of packing units is achieving the recycling and resource sharing of pallets in the supply chain system, which must be done in order to improve the operation efficiency of logistics and reduce logistics costs via the use of minimum costs and maximum resource utilization. The problems of pallets cost and sharing often represent major investments. Large-scale enterprises often spend millions of dollars on investment, and investment failure can cause significant harm to the enterprise.
Previous researchers have proposed that if the theory or method of logistics warehouse management, distribution, and transportation can be applied to the supply chain system to improve the operation efficiency of logistics centers or commodity circulation, logistics operation costs could be effectively reduced. For example, (1) focusing on the storage management node, Lin and Ma [5] used the logistics center of a supermarket chain in China as a case study and conducted multicriteria decision-making (MCDM) to develop a new standard for ABC classification and improve the storage operation efficiency of the logistics center. Lin et al. [2] optimized the warehouse-bursting problem of the green plant industry based on MCDM and proposed the concept of a cloud warehouse to improve the logistics operation efficiency of the industry. Tan et al. [6] proposed a mixed-integer linear programming model to optimize the sorting operation of e-commerce warehousing, and they used package, picking stations, automatic sorting machines, AGV, and other related parameters for planning. Finally, the concept of automatic sorting was proposed to improve the operation efficiency of logistics. (2) Regarding the aspects of distribution and transportation management, Tarapata et al. [7] proposed the use of a data-driven machine learning system supported by the information provided by the Polish National Research and Development Center. They suggested a new method to improve the efficiency of logistics distribution and transportation for Polish transport and logistics service markets. Sherif et al. [8] proposed a mixed-integer non-linear programming model to optimize the waste recycling of the supply chain system of the battery manufacturing industry. In their study, the inventory holding, transportation, and carbon emission costs of a logistics center were considered. Finally, they proposed an effective method to improve the operation efficiency of logistics and reduce the cost of service flow for vehicle transportation routes and the inventory of the logistics center. Mandal et al. [9] proposed the use of a dynamic programming model to optimize vehicle speed in the transportation process under the condition of uncertain demand to reduce the logistics and transportation costs of the supply chain system; the research results proved the effectiveness of the proposed method. Al Theeb et al. [10] proposed a new comprehensive mixed integer optimization model to optimize the inventory management and vehicle routing optimization of a cold chain logistics supply system. The results showed that the suggested method has practical value and could reduce the total distribution cost by 9.25%.
The aforementioned research demonstrates that these methods have proven useful for the operational efficiency and cost of supply chain systems and logistics centers. Each of these studies adopted different methods for planning and solving particular problems. Objective and subjective judgements were divided according to the criteria of decision making. (1) An integer linear or non-linear programming model is commonly used for objective data judgment, which is intended to help enterprises allocate their limited resources, e.g., via resource allocation, transportation allocation, and the optimal coordination of demand, and production and inventory levels. The advantage of this method is that the data of the analysis variable are presented in the form of objective data. While this method can makes significant contributions to resource allocation, it is set up in an relatively closed environment. In a changing and open environment, it is relatively difficult to resolve problems. Managers need to analyze many variables before establishing reasonable equations, which is time-consuming and laborious. (2) Subjective data judgment is commonly used in group decision making, such as MCDM, which usually solves problems such as investment planning, strategic objectives, and resource allocation utilization; they are also used by enterprises, with expert groups and multiple people participating in decision-making analysis. The advantage of this method is that when a decision maker does not fully understand the problem, feasible scheme, and evaluation criteria (variables), experts in different fields can be gathered to solve the problem, which saves time and effort in comparison to the analysis of objective data. However, the variable values obtained during the modeling process are quantitative values based on subjective judgment. (3) During the combination of objective and subjective data, objective and subjective judgment methods must be integrated to solve enterprise problems according to the acquisition of variables in addition to the two aforementioned points. The simulation method can consider random conditions in any environment. If the variables and data are obtained under the conditions of time and cost, random probability can be converted through the determined key variables and the simulation model can be combined with optimization to achieve an optimal solution.
Since its inception, MCDM has been used by multiple decision makers and researchers to solve complex problems. MCDM is used not only in investment project selection but also in other fields [11]. In short, MCDM has been successfully applied to a wide range of problems. Analytic hierarchy process (AHP) is a popular MCDM method. Its advantages, such as the combination of qualitative and quantitative methods, make AHP suitable for long-term prediction, and it can be used in special situations where quantitative data cannot be completely obtained and research time and cost can be saved. Additionally, a number of studies have demonstrated its usefulness [11]. The analytic network process (ANP) can overcome the difficulties of the AHP, which must assume independent conditions for its criteria, because the ANP not only considers the complex interrelationships between different levels but also rationalizes decision making through the feedback mechanism between elements. In the multi-criteria environment, the value of the ANP has been highlighted by many studies as the best reference for group decision making. For example, Lin and Ma [5] proposed a new decision scheme using the ANP as the classification storage method for a supermarket system; Mubarik et al. [12] proposed the use of the ANP to develop strategic standards for green-strategic sourcing in the automotive industry. Wan et al. [13] proposed the establishment of sustainable development plans and strategies for marine ranching’s supply chain system based on the ANP. In addition, the future market will be full of complex and unpredictable uncertainties and risks that will eventually lead to the failure or distortion of the investment decision results of enterprises, and fuzzy theory is the best method for approaching these decisions [14]. Furthermore, the fuzzy analytic network process (FANP) has been validated by many studies. For example, Eskandari et al. [15] proposed that the FANP should be used to formulate development plans and standards for the management of organizational security and to measure the criteria and priority order of importance affecting organizational security. Mistarihi et al. [16] proposed the integration of the QFD model and the FANP as the foundation of an important guiding standard for the designing engineering characteristics of wheelchairs. Nilashi et al. [17] proposed the formulation of a set of objective reference standards and guidelines for the information system of medical institutions based on the FANP, ranked the importance of these standards, and finally put forward corresponding countermeasures according to their importance.
Therefore, the authors of this paper adopted the FANP to evaluate the case and used an actual case as the research object to solve important decisions regarding pallet resource sharing investment in the supply chain system. Importantly, it is expected that the proposed method can provide an important reference standard or a new idea for decision makers in the chain supermarket industry or related industries.
The introduction to this article provides a brief overview of the research context, issues, objective, and related research. The main structure and main sections of the research are described in the following four sections. The third section illustrates is the state and problems of the case. Then, the fourth section presents a case analysis using the methodology proposed in the second section and discusses the results. The fifth section provides conclusions and suggestions for recommended strategies.

2. Research Methods

A focus group and the FANP were used to assess the significance of the pallet investment strategy in the supermarket supply chain system of this research. The research process can be divided into two parts. The first stage was “The Construction of Evaluation Model Based on Focus Group Interview”. First of all, the evaluation criteria of logistics facilities, equipment, and resources—such as operational efficiency, cost and economic value, use, and durability—were searched for I the relevant literature to serve as the basis for the discussion of the focus group. Then, according to the classification criteria of the preliminary decision, an expert group was formed to determine the hierarchical relationship and interdependence of each criterion and then determine the evaluation model of the integration strategy. The second stage was “The Construction of Decision Model Based on FANP”. The evaluation model based on the decision of the first stage was based on the FANP decision model used to evaluate the criteria and alternatives. Finally, based on the analysis results, specific suggestions and countermeasures were formulated. The research framework is shown in Figure 1.

2.1. The Construction of Evaluation Model Based on Focus Group Interview

Focus group interviews mainly collect group members’ thoughts, opinions, perceptions, attitudes, and beliefs on specific topics through group interaction. This interview method is widely used in qualitative research to collect data. Focus group interviews are often used in the early stages of research because they help to explore relevant data on topics of interest to researchers. They can also be used to assist in the development of concepts, tools, and plans for preliminary studies, based on which larger quantitative studies can be carried out [18,19].
Stewart and Shamdasani [19] proposed the steps of the focus group interview method, as described below. (1) Research question formation: researchers must first understand the question to be studied and simultaneously discuss the collected information and research object in detail. (2) Research object confirmation: researchers must select representative samples. (3) Intermediaries identification: researchers must choose a suitable intermediary with practical work experience, special personality traits, and appropriate educational background as the suitable candidate for the intermediary. (4) Sample selection: researchers must first set up the event, followed by special facilities or equipment when needed. When contacting the samples, the meeting time, place, and the topic must be stated in advance to arouse participants’ interest and increase the attendance rate. (5) Group interview conduction: the arbiter must aide the discourse of the group members, as stated in the meeting framework, and because acquainted with known members. The entire discourse can be recorded (e.g., videotaped) for further dissection. (6) Data analysis and report writing: researchers must extract the content of important discussions and present it in the form of keywords or the marking of key points. Then, they must analyze and interpret the data before finally writing the report according to the analysis results.

2.2. The Construction of Decision Model Based on FANP

2.2.1. MCDM with ANP

Various decision-making activities in real life comprise nothing more than selection, evaluation, and review. MCDM aims to help decision makers effectively evaluate and determine the advantages and priority of each alternative scheme from numerous evaluation attributes [20]. Thus, its theoretical methods have been successfully widely applied to solve various problems in management decision making [21,22]. Among MCDM methods, the AHP is one of the commonly used methods [11]. The AHP was proposed by Saaty in 1971 when he was engaged in the research of contingency planning for the US Department of Defense, and this theory was compiled into a special book published in 1980 [23]. The AHP has been used in policy planning, prediction, judgment, resource allocation, investment portfolio, and other aspects to provide a clear hierarchical system with systematic structure and to assign weight to each element in the hierarchy in order to provide decision makers with a basis for selection and judgment in order make better decisions [11]. The basic assumption of the AHP is that each evaluation attribute, criterion, or program is independent [24]. However, reality has shown that many decision-making problems cannot be hierarchically expressed. In fact, there is a complex correlation among attributes, criteria, and schemes—as well as mutual influence among them—that is not a linear relationship from top to bottom; rather, the relationship is similar to a network [25,26]. Hence, the ANP can fill this gap, making a more complete model and accurate results in decision making [27].

2.2.2. Fuzzy MCDM with FANP

Although widely used, MCDM cannot fully solve the problems of experts or decision makers in the decision-making processes of thinking, expressing, and judging because it is imprecise and inaccurate. In MCDM, human judgment is assumed to comprise an exact number [28,29]. Therefore, fuzzy MCDM is a theory developed to solve the inaccuracy caused by experts (humans) in evaluating the relative importance of attributes and alternative schemes. Imprecision may be caused by various factors, such as unquantifiable information, incomplete information, unavailable information, and partial information that is unknown [30,31].
As mentioned in Section 2.2.1., these changes not only retain the advantages of the method but are also intended to shape the environment generated by the decision-making method to a state closer to real-world decision making. Using the ANP to make up for AHP without considering the relationship gap between elements leads to the clarification of the hierarchical relationship through a feedback mechanism. The FANP is produced by combining the concept of fuzzy logic with the ANP to solve the ambiguity and fuzziness caused by evaluation criteria. However, experts with diverse backgrounds may hold different opinions, and the FANP can make up for this deficiency and increase the accuracy of the decision results without being influenced by subjective opinions. The FANP has been used by many researchers to more accurately solve complex decision problems, such as economic, investment, and site selection. The FANP was adopted by Ngan et al. [32] to quantify the priority weights of sustainability indicators to provide guidelines for industry stakeholders at different stages of the industry cycle to transition toward the circular economy. Li et al. [33] suggested a novel method combining SWOT and the FANP to form new strategies for the future development prospects of Chinese methanol vehicles; moreover, six policy implications for further unknown vehicles were proposed. Similarly, Aghasafari et al. [34] adopted a mixture of SWOT and the FANP to determine the best strategy for the development of organic agriculture. Ahmadi et al. [35] evaluated the problems of a wind-powered storage power plant by combining Geographic Information Systems (GIS) and the FANP in order to improve the efficiency of integrated renewable energy. They also pointed out that the FANP can solve any MCDM problem to provide a theoretical reference. Wu et al. [36] constructed a decision-making framework for the selection of offshore wind power station sites in China. The six criteria of wind resource, construction, economy, environment, society, and risk (as well as related sub-criteria) were comprehensively considered, and the FANP was used to prioritize the schemes and provide a theoretical reference for China’s coastal management and the development of offshore wind power. Feyzi et al. [37] proposed a decision-making framework for waste incineration power generation plant and site selection in northern cities of Iran, which included three main criteria: environment, economy, and culture. Furthermore, a practical case was combined with the FANP and GIS to verify the effectiveness of the proposed method.
For the effectiveness of the FANP, the authors of this paper applied the concepts of Chang et al. [31] to analyze data and reach a consensus among experts. The FANP process consists of the following four steps.
  • Step 1: Construct the problem and the model.
The authors of this paper constructed a decision model based on the FANP following the results of a focus group interview. First of all, according to the preliminary criteria decided in the first stage and the specific steps of focus group proposed by Stewart and Shamdasani [18], the authors of this paper formed an expert group to discuss and determine the relationship between the upper and lower strata of the criteria of the evaluation model and the interrelation between the criteria. Finally, the decision evaluation model of the FANP was determined according to the result of the discussion.
  • Step 2: Construct the triangular fuzzy numbers.
Zadeh [38] proposed a fuzzy set theory to deal with uncertainties caused by inaccuracy and fuzziness. The main contribution of fuzzy set theory is that it can represent ambiguous data. A fuzzy set that assigns each object a grade of membership ranging between 0 and 1 can be considered useful for its membership function because it comprises a class of objects with a continuum of membership grades.
For the extraction of fuzzy numbers, Buckley [39] extracted four numbers from the collected data for calculation. These four numbers can form a trapezoid, so they are called flat or trapezoidal fuzzy numbers. It is difficult to calculate flat or trapezoidal fuzzy numbers. To simplify the process, a trapezoidal fuzzy number can be simplified into triangular fuzzy numbers (TFNs), and the fuzziness of the judge is presented by three fuzzy numbers. A TFN is a special trapezoidal fuzzy number case, but it is helpful for our calculation [40].
Saaty [23] believed that the geometric mean was more effective for expressing expert consensus, and the geometric mean has been commonly adopted in practical applications. Thus, the geometric mean (representing the consensus of most experts) was taken as the mode of triangular fuzzy number in this study, i.e., the degree of membership was set to be equal to the mean of one. In Figure 2, Uij is the upper limit (maximum) of expert consensus, Mij is the geometric mean representing the majority of expert consensus, and Lij is the lower limit (minimum) of expert consensus. That is, the value between Lij and Uij represents the possible consensus views. The geometric mean was used in this paper for the model of triangular fuzzy numbers. The TFN equation is shown in Equations (1)–(4). TFN u ˜ i j can be determined as follows [31]:
u ˜ i j = ( L i j , M i j , U i j )
L i j M i j U i j   and   L i j , M i j , U i j [ 1 / 9 ,   9 ]
L i j = min ( B i j k )
M i j = k = 1 n B i j k n
and
U i j = max ( B i j k )
If the concept of the AHP is used to explain the results of a questionnaire consultation, the subject k can view Bijk regarding the relative importance of the i and j factors (criteria) in level L − 1 under the evaluation item n of level L to construct a paired comparison matrix of Bijk (L − 1) = ( B i j k ) . When the pair comparison matrix of each subject is established, the triangular fuzzy number can be extracted. The pair-wise comparison matrix of the ANP is the same.
  • Step 3: Construct a fuzzy pair-wise comparison matrix and defuzzification.
a ˜ 12 is determined with the TFN and represents the relative importance of the two criteria C1 and C2. Meanwhile, [ a ˜ i j ] indicates that the TFN can be determined by using Equations (1)–(4). As shown in Equations (5) and (6), this method can clearly express fuzzy perception [31].
g α , β ( a ˜ i j ) = [ β f α ( L i j k ) + ( 1 β ) f α ( U i j k ) ] ,   0 β 1 ,   0 α 1
where f α ( L i j k ) = ( M i j L i j k ) α + L i j k represents the left-end value of α-cut for a ˜ i j and f α ( U i j k ) = U i j k ( U i j k M i j ) α represents the right-end value of α-cut for a ˜ i j .
g α , β ( a ˜ j i ) = 1 / g α , β ( a ˜ i j ) ,   0 β 1 ,   0 α 1 ,   i > j
where α represents the decision makers’ preference and β represents decision makers’ risk tolerance, metrics that can be used to comprehensively evaluated the risks in different situations.
It should be noted that α can be regarded as a stable and fluctuating state in the real environment. When α = 0, the original state is covered without any restriction and the uncertainty of the environment widely varies. When the value of α gradually increases, the decision-making environment becomes relatively certain and the decision variation made by the decision maker is smaller [31]. In addition, α can be any number between 0 and 1, but it is usually set as 0.1, 0.2, …, 1 for analysis purposes to simulate an uncertain situation. α = 0 represents the upper bound Uij and lower bound Lij of triangular fuzzy numbers, and α = 1 represents the geometric mean value of triangular fuzzy numbers. β can be regarded as the degree of the pessimism of decision makers, which can be used as a weight to integrate expert opinions [31]. When β = 0, decision makers have an optimistic view of this criterion. In consequence, the consensus of experts is the upper bound Uij in a TFN. The value of β can also be any number between 0 and 1, but 0.1, 0.3, 0.5, 0.7, and 0.9 are commonly used to simulate the mental state of a decision maker. A single pair-wise comparison matrix is listed as Equation (7).
g α , β ( A ˜ ) = g α , β ( [ a ˜ i j ] ) =   C 1   C 2   C n [ 1 g α , β ( a ˜ 12 ) g α , β ( a ˜ 1 n ) 1 / g α , β ( a ˜ 12 ) 1 g α , β ( a ˜ 2 n ) 1 / g α , β ( a ˜ 1 n ) 1 / g α , β ( a ˜ 2 n ) 1 ]
  • Step 4: Determine eigenvectors and supermatrix formation.
In g α , β ( A ˜ ) (represented by a ˜ i j ) W1, W2, …, Wn represent n elements C1, C2, …, Cn and the quantitative weight of Cn can reflect the recorded judgment value. The relation between its weight Wi and judgment of a ˜ i j can be simply expressed as W i / W j = a ˜ i j   ( i ,   j = 1 ,   2 ,   ,   n ) . g α , β ( A ˜ ) times the weight vector x is equal to nx, which is [ ( g α , β ( A ˜ ) n x   ] = 0   . x is called the eigenvector and is used to eigenvalue n. Since a ˜ i j is the decision maker’s pair-wise comparison, the value given by subjective judgment is different from the real value of W i / W j to some extent, so [ ( g α , β ( A ˜ ) x   ] = n x   cannot be established.
Saaty [22] suggested that n be replaced by the maximum eigenvalue λ m a x of the matrix.
λ m a x = j = 1 n a ˜ i j W j W i
If g α , β ( A ˜ ) is the consistency matrix, the eigenvector x can be calculated by the following equation:
[ ( g α , β ( A ˜ ) λ m a x I   ] x = 0  
where x denotes the eigenvector of g α , β ( A ˜ ) , 0 β 1 ,   0 α 1 .
Saaty [26] stated that the use of a consistency index (CI) and a consistency ratio (CR) to measure the consistency of a paired judgment matrix can correct unreasonable evaluation values. If CR ≤ 0.1, the estimated value is acceptable; otherwise, the matrix must be rebuilt for judgment until CR ≤ 0.1.
A supermatrix is composed of several sub-matrices, which are formed by the feature vectors after comparisons between criteria. In Equation (9), W1, W2, …, Wnn represent the eigenvectors calculated by a pair-wise comparison matrix. The groups or elements are independent and there is no dependence between them if there is a blank or 0 in the supermatrix. The advantage of this method is that it can be used to evaluate the outer and inner dependence of a criterion. External dependence refers to the relationship between groups, while internal dependence refers to the relationship between factors in the same group. In accordance with the flow of influence from a component to another component or from a component to itself as in the loop, the obtained local priority vectors (in Equations (7) and (9) for each pair-wise matrix) are classified in proper positions in a supermatrix [23]. The form of the supermatrix used in this article is as follows:
W h = [ I 0 0 0 W 21 W 22 0 0 0 W 32 W 33 0 0 0 W 43 I ]
where W21 represents the weight of the influence of the target on the criterion, W32 represents the weight of criterion to sub-criterion, and W43 represents the weight of the sub-criteria to each alternative. If there is an interactional relationship between the criteria or in the criterion, W22 is the vector-matrix of the inter-dependent relationship between the criteria and W33 is the vector-matrix of the inter-dependent relationship between the criteria. I represents the identity-matrix, and 0 indicates that there is no influence between the corresponding criteria, sub-criteria, and schemes.
The calculation process of a supermatrix consists of three matrices, namely an unweighted supermatrix, a weighted supermatrix, and a limited supermatrix. The unweighted supermatrix is the weight obtained after the original comparison. The weighted supermatrix is the weight of the same criterion multiplied by the related community weight in the unweighted supermatrix. If the linear columns of the unweighted supermatrix are added to a weighted supermatrix, it becomes unweighted. The limited supermatrix is the weighted supermatrix multiplied by square multiple times until each column is equal. According to the calculation method proposed by Saaty, convergence can be achieved if supermatrix W is irreducible and all columns of the matrix have the same vector [24]. In this study, the hypermatrix was constructed according to the vector matrices (W21, W22, W32, W33, and W43) corresponding to Equation (10), and then the weighted hypermatrix was transformed into a weighted hypermatrix. Finally, the weighted hypermatrix is formed by limiting the operation of the weighted hypermatrix. The limiting hypermatrix is the analytical result of the FANP.
  • Step 5: Determine the result of the decision.
Through the above-mentioned steps, the priority weight value between the evaluation criteria and alternative schemes can be obtained, and the scheme with the highest weight value is the best alternative scheme.

3. Status and Problems of the Case

Enterprise A is the largest supermarket chain enterprise in Jiangsu province and one of the top four fast-moving consumer goods retail enterprises in China. With rapid logistics, it provides a wide variety of commodities, such as food, vegetables, beverages, household goods, hardware, and appliances for supermarkets in many regions. As a regional storage center, the logistics center is mainly responsible for the supply and distribution of stores in the region. The distribution model adopts the mode of three deliveries a day, and the goods needed for stores are appropriately replenished. As long as the amount of goods in the logistics center is lower than that of the safety stock, the information can be instantly shared with the supplier through the system and the purchasing department can place an order. This can enable the proper replenishment of stock to provide enough goods for stores. In this model, each batch of ordered goods in the logistics transfer process of the supply chain is classified and moved from the supplier to the logistics center, and then the logistics center distributes the goods from the existing inventory to the stores in batches. To ensure the smooth transfer of goods, the logistics center needs to manually assemble tooling pallets many times during the process of the input and output of the goods (Figure 3) for the non-standard logistic and transportation equipment of suppliers, logistics centers, and stores. For example, pallets must be replaced in centralized operation due to the different specifications of the shelves of warehouses and vehicles. This often results in the following inconveniences.
(1)
Too many workers are needed in the unloading area
The supply of goods cannot be transported by pallet for non-standard specifications in the daily distribution process. When vehicles arrive at an unloading area, operators are required to handle the goods from the truck to the pallet. Therefore, the unloading area takes up a large number of staff, resulting in huge labor costs. Repeated processes such as manual selection, loading and unloading, handling, and inspection are too tedious. Damage often occurs due to the collision and falling of goods in the process.
(2)
Low efficiency in the unloading area
Compared to the highly informationized and highly mechanized operation of other parts of distribution, the manual operation adopted in the unloading area is inefficient, which is in sharp contrast to the high efficiency of the subsequent warehousing operation and automatic picking operation system. A situation like waiting for manual unloading in follow-up distribution operation may give rise to the waste of manpower and material resources.
(3)
Reduced vehicle turnover rate
When a fully loaded truck arrives at an unloading dock, the operation time required for manual unloading is about two hours. Compared to the loading and unloading times of the pallet, the circulation and utilization rates of the vehicle are greatly reduced. Meanwhile, a shortage of unloading parking spaces leads to the prolonged occupation of the unloading dock. During the peak distribution season of enterprise A, such as the Mid-Autumn and Spring Festivals, logistics vehicles often wait in long lines for unloading, which leads to further increase in freight costs.
(4)
Goods are easily accumulated
Unreasonable shelving after unloading and cargo inspection may occupy the cargo circulation area in the peak season of distribution, leading to tension in a temporary storage area. It is easy to cause a large number of goods to accumulate in the temporary storage area and seriously affect subsequent unloading operations.
(5)
Low degree of mechanization
Due to inconsistent pallet specifications, the whole supply chain process cannot fully realize mechanization operation. Manual operation significantly affects the further upgrade of the distribution process and greatly restricts the rapid development of the whole supply chain.
Based on the above-mentioned problems, the case study enterprise needs to rethink their supply chain system resources from supplier to logistics center to store. They must re-check the specifications and standards of transport vehicles, pallet, and warehouse storage facilities, as well as equipment involved in the transfer of goods. The case study enterprise considers the logistics center the main component because the logistics center is the central node of its supply chain system. Under the consideration of enterprise cost, resource adjustment is carried out with the least resource adjustment of the logistics center. After taking inventory of resources, enterprise A decided to standardize pallet specifications; the process of adjustment is explained as follows. First, in terms of the logistics center, it was decided to adjust the pallet specification to 1200 × 1000. Considering the current containerized unit vehicles and storage equipment in logistics centers, adopting this specification was the best choice for less resource variation and less economical cost. Moreover, most of the suppliers’ specifications for transport vehicles and centralized units conform to this specification. Second, it was decided that suppliers who did not use this specification would sign a contract with the supplier and the logistics center would provide pallet resource sharing to facilitate their resource reconditioning and replacement. For suppliers who adopt this specification, there is no change required. Third, in the temporary warehouses of stores, it was decided to re-plan the layout of the original warehouse to meet the need to store goods without replacing pallets.
In accordance with the above description, enterprise A was found to have three options for pallet size replacement: self-purchase, lease, and exchange systems; each of the options have advantages and disadvantages for future operation. Therefore, the authors of this paper used the constructed evaluation model to help enterprise A evaluate its investment plan to provide a reference for the decision maker.

4. Case Analysis

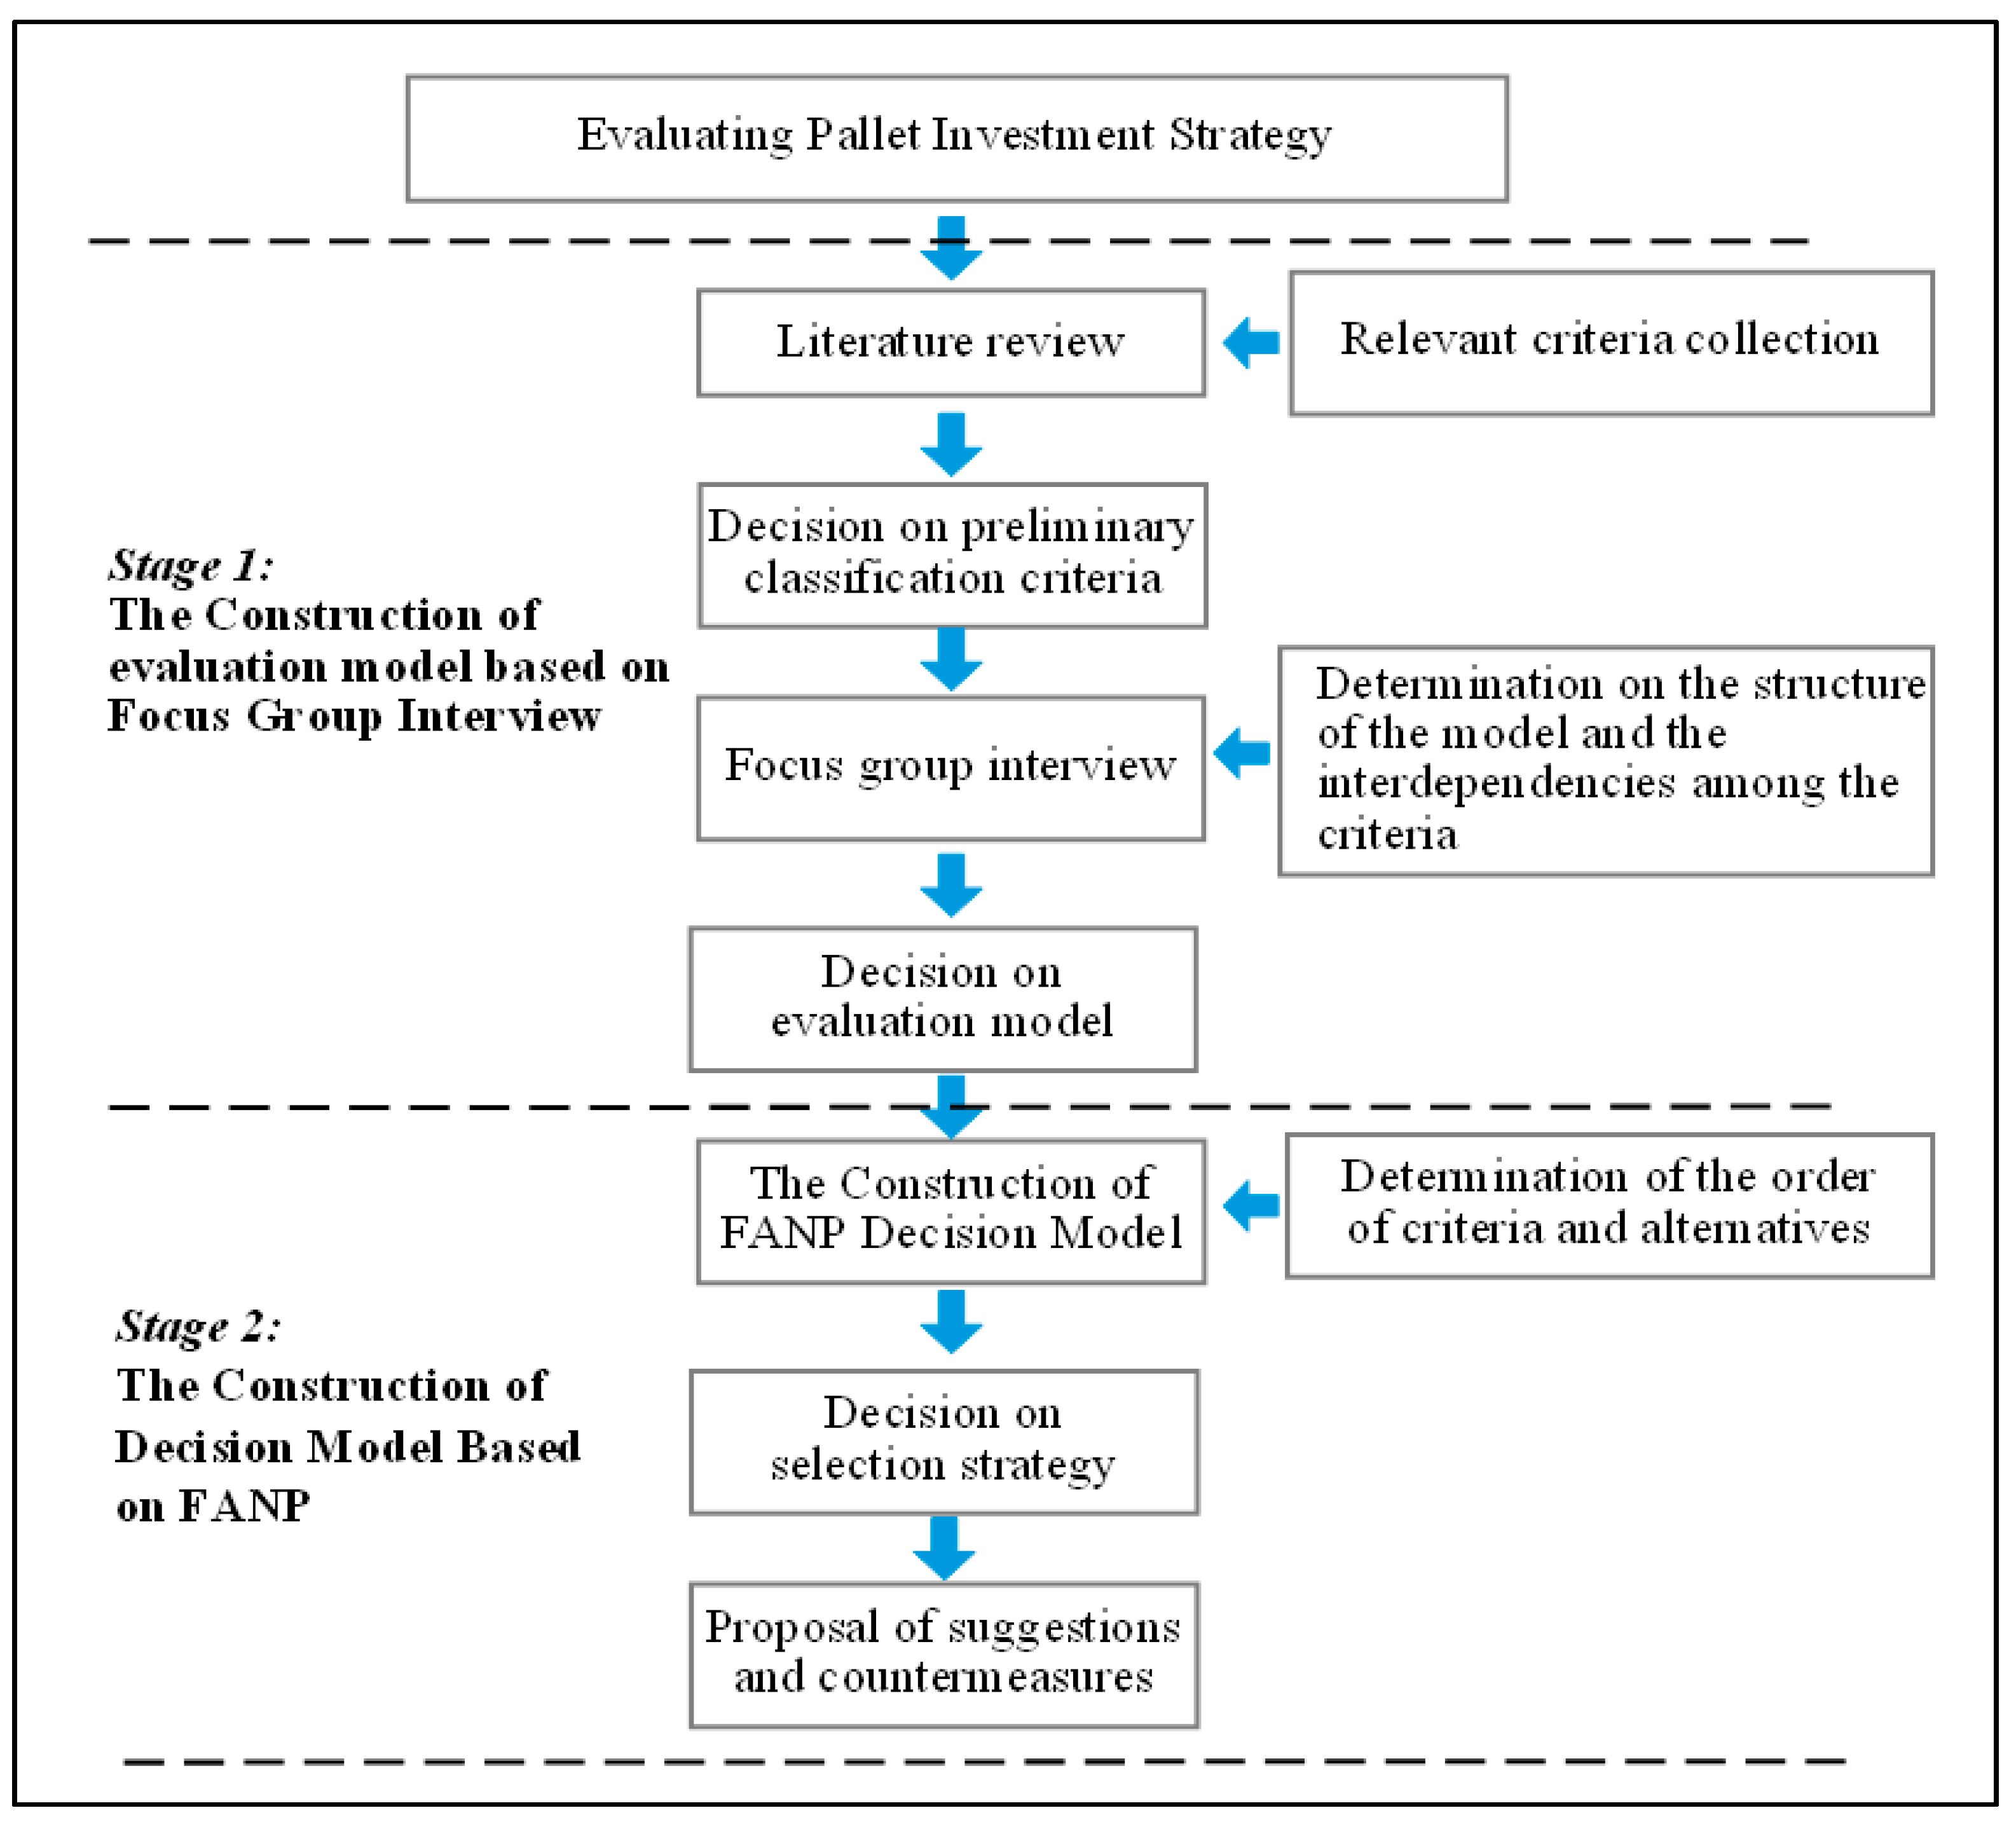
The authors of this study proposed the use of a focus group and the FANP to evaluate the importance of the pallet investment strategy in chain supermarket supply systems. The research process can be divided into two parts, as described below.
The first stage was the “Construction of Evaluation Model Based on Focus Group Interview”. First of all, the evaluation criteria of logistics facilities, equipment, and resources—such as operation efficiency, cost and economic value, use, and durability—are searched for in the relevant literature to serve as the basis for the focus group discussion. Then, according to the classification criteria of the preliminary decision, an expert group was formed for discussion to determine the hierarchical relationship and inter-dependence of each criterion, as well as determine the evaluation model.
The second stage was “The Construction of Decision Model Based on FANP”. Firstly, according to the evaluation model decided in the first stage, the FANP decision model was used as the theoretical basis to evaluate the criteria and alternatives. Finally, specific suggestions and countermeasures were proposed based on the analysis results. During data collection, experts and research team members were invited to answer the questionnaire online in a one-to-one manner.

4.1. Data Collection

The expert group invited in this study was set as two different parts. In the first stage, 15 experts were invited, and their background is as follows. Three professional managers from the case company were responsible for product sales, warehousing and logistics, and quality management. Seven logistics centers managers from the case company’s four logistics centers in the north and south of Jiangsu province were mainly responsible for the storage, sorting, transportation, and distribution of goods in and out of the warehouse. During data collection, experts were invited to hold online meetings and discussions twice; each meeting lasted 3 to 4 h, and the questions designed in this study were discussed to build the evaluation model. The analysis process of focus group interviews is explained in detail in Section 4.2.
Twenty experts were invited for the second stage. In addition to the experts of the first stage, five other academic experts teaching business management, financial management, and e-commerce were invited. All of the experts had been in their posts for more than 3 years and had been engaged in related business for 5 years. During data collection, each expert was consulted by questionnaire according to the set schedule, and the measurement period lasted for one month. To ensure that the decision matrix was consistent with the verification results, software was used to measure each questionnaire immediately after it was completed. If the result did not meet the standard, the expert was politely asked to re-answer the questionnaire again until it reached the standard. In addition, to ensure that the collected data ensured the accuracy of the model due to the time change relationship, the authors of this study used the characteristics of a fuzzy decision model to simulate and compare the uncertainties and risks in the future investment environment, as well as the preferences of decision makers. The analysis process of the FANP decision model is described in detail in Section 4.3. The simulation results are explained in Section 4.4.

4.2. Stage 1: The Construction of Evaluation Model Based on Focus Group Interview

Based on the steps proposed by Stewart and Shamdasani [19], the authors of this paper conducted two meetings to summarize the consensus of expert opinions before finally constructing an evaluation model. The implementation steps are described below.
  • Step 1: Formation of research questions.
On the ground of relevant literature search, the authors of this paper initially designated the criteria to include the operation efficiency of logistics facilities and equipment resources, investment cost and economic value, and the use and durability of facilities and equipment. A total of 58 criteria or indicators were accordingly collected to serve as the basis for preliminary discussion and design of the problem.
  • Step 2: Identification of research objects and intermediaries
The authors of this paper invited a total of 15 experts from the case company, including 10 professional warehouse managers, 4 teachers with logistics majors from universities, and the author as the intermediary, to form an expert group to discuss the problem.
  • Step 3: Selection of samples for group discussion.
After the expert group was selected, discussions were held in two online meetings on 27 October 2019 and 5 November 2019.
  • Step 4: Data analysis, interpretation, and report writing.
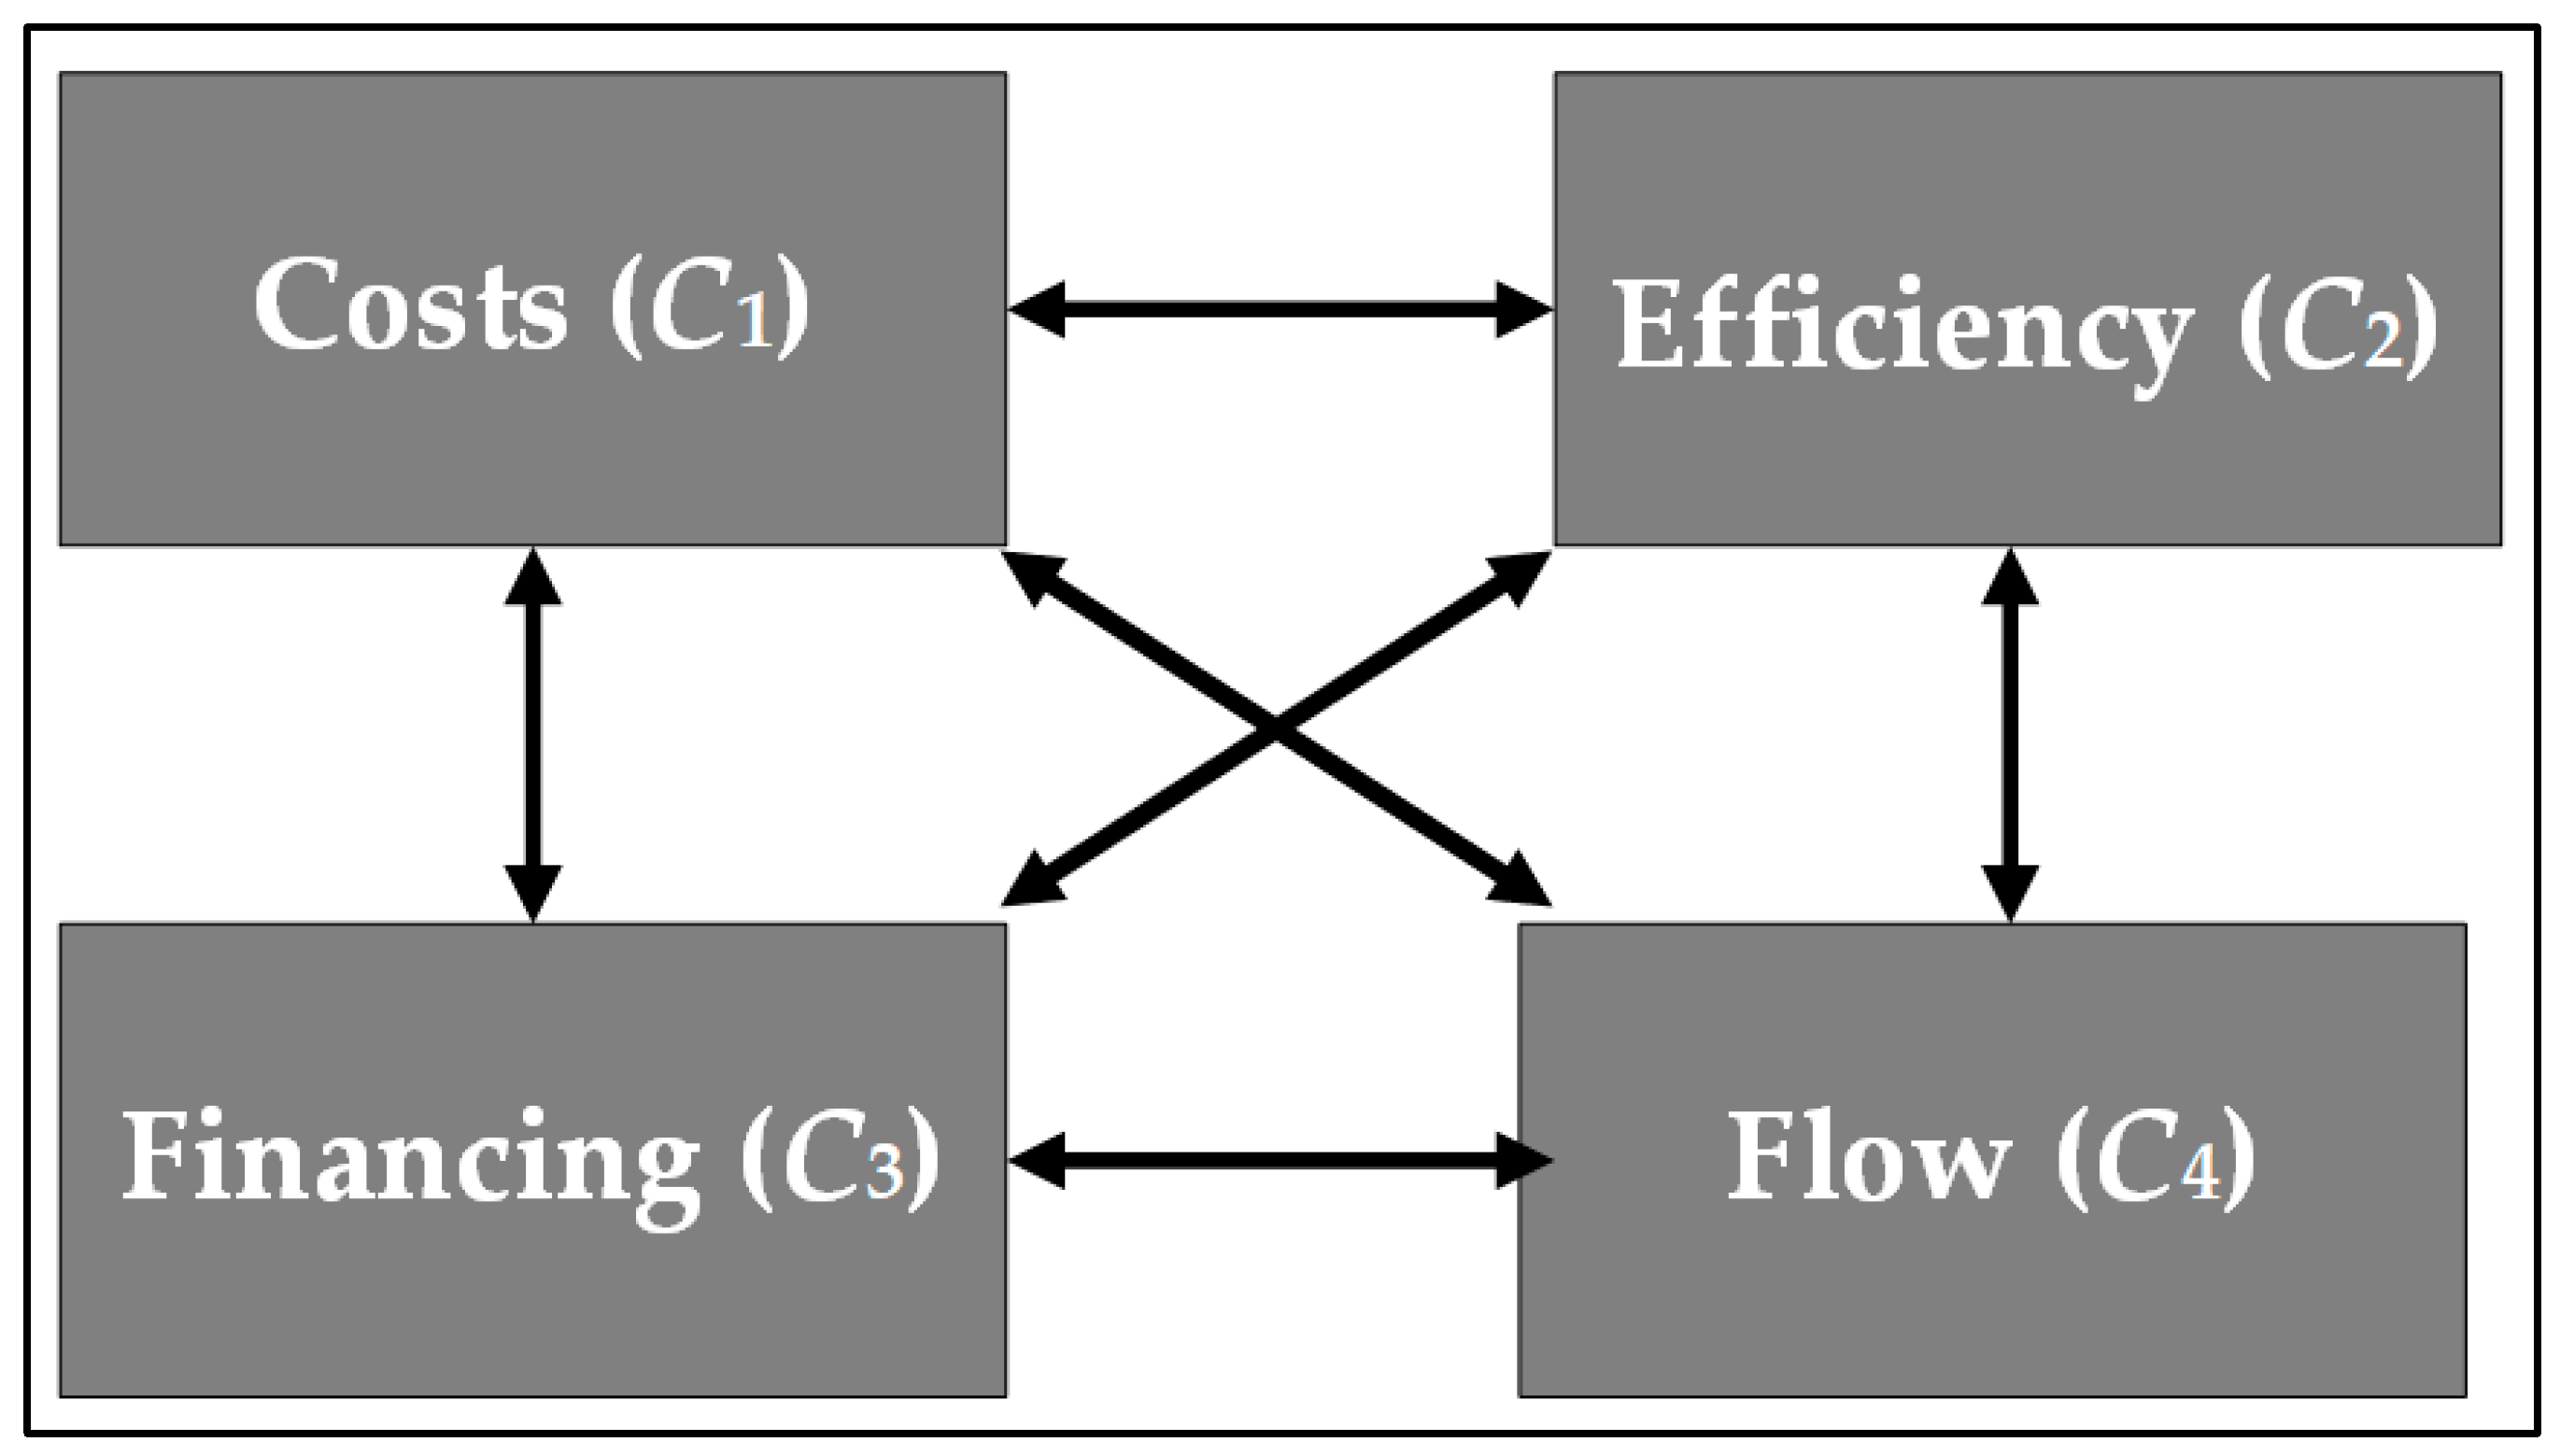
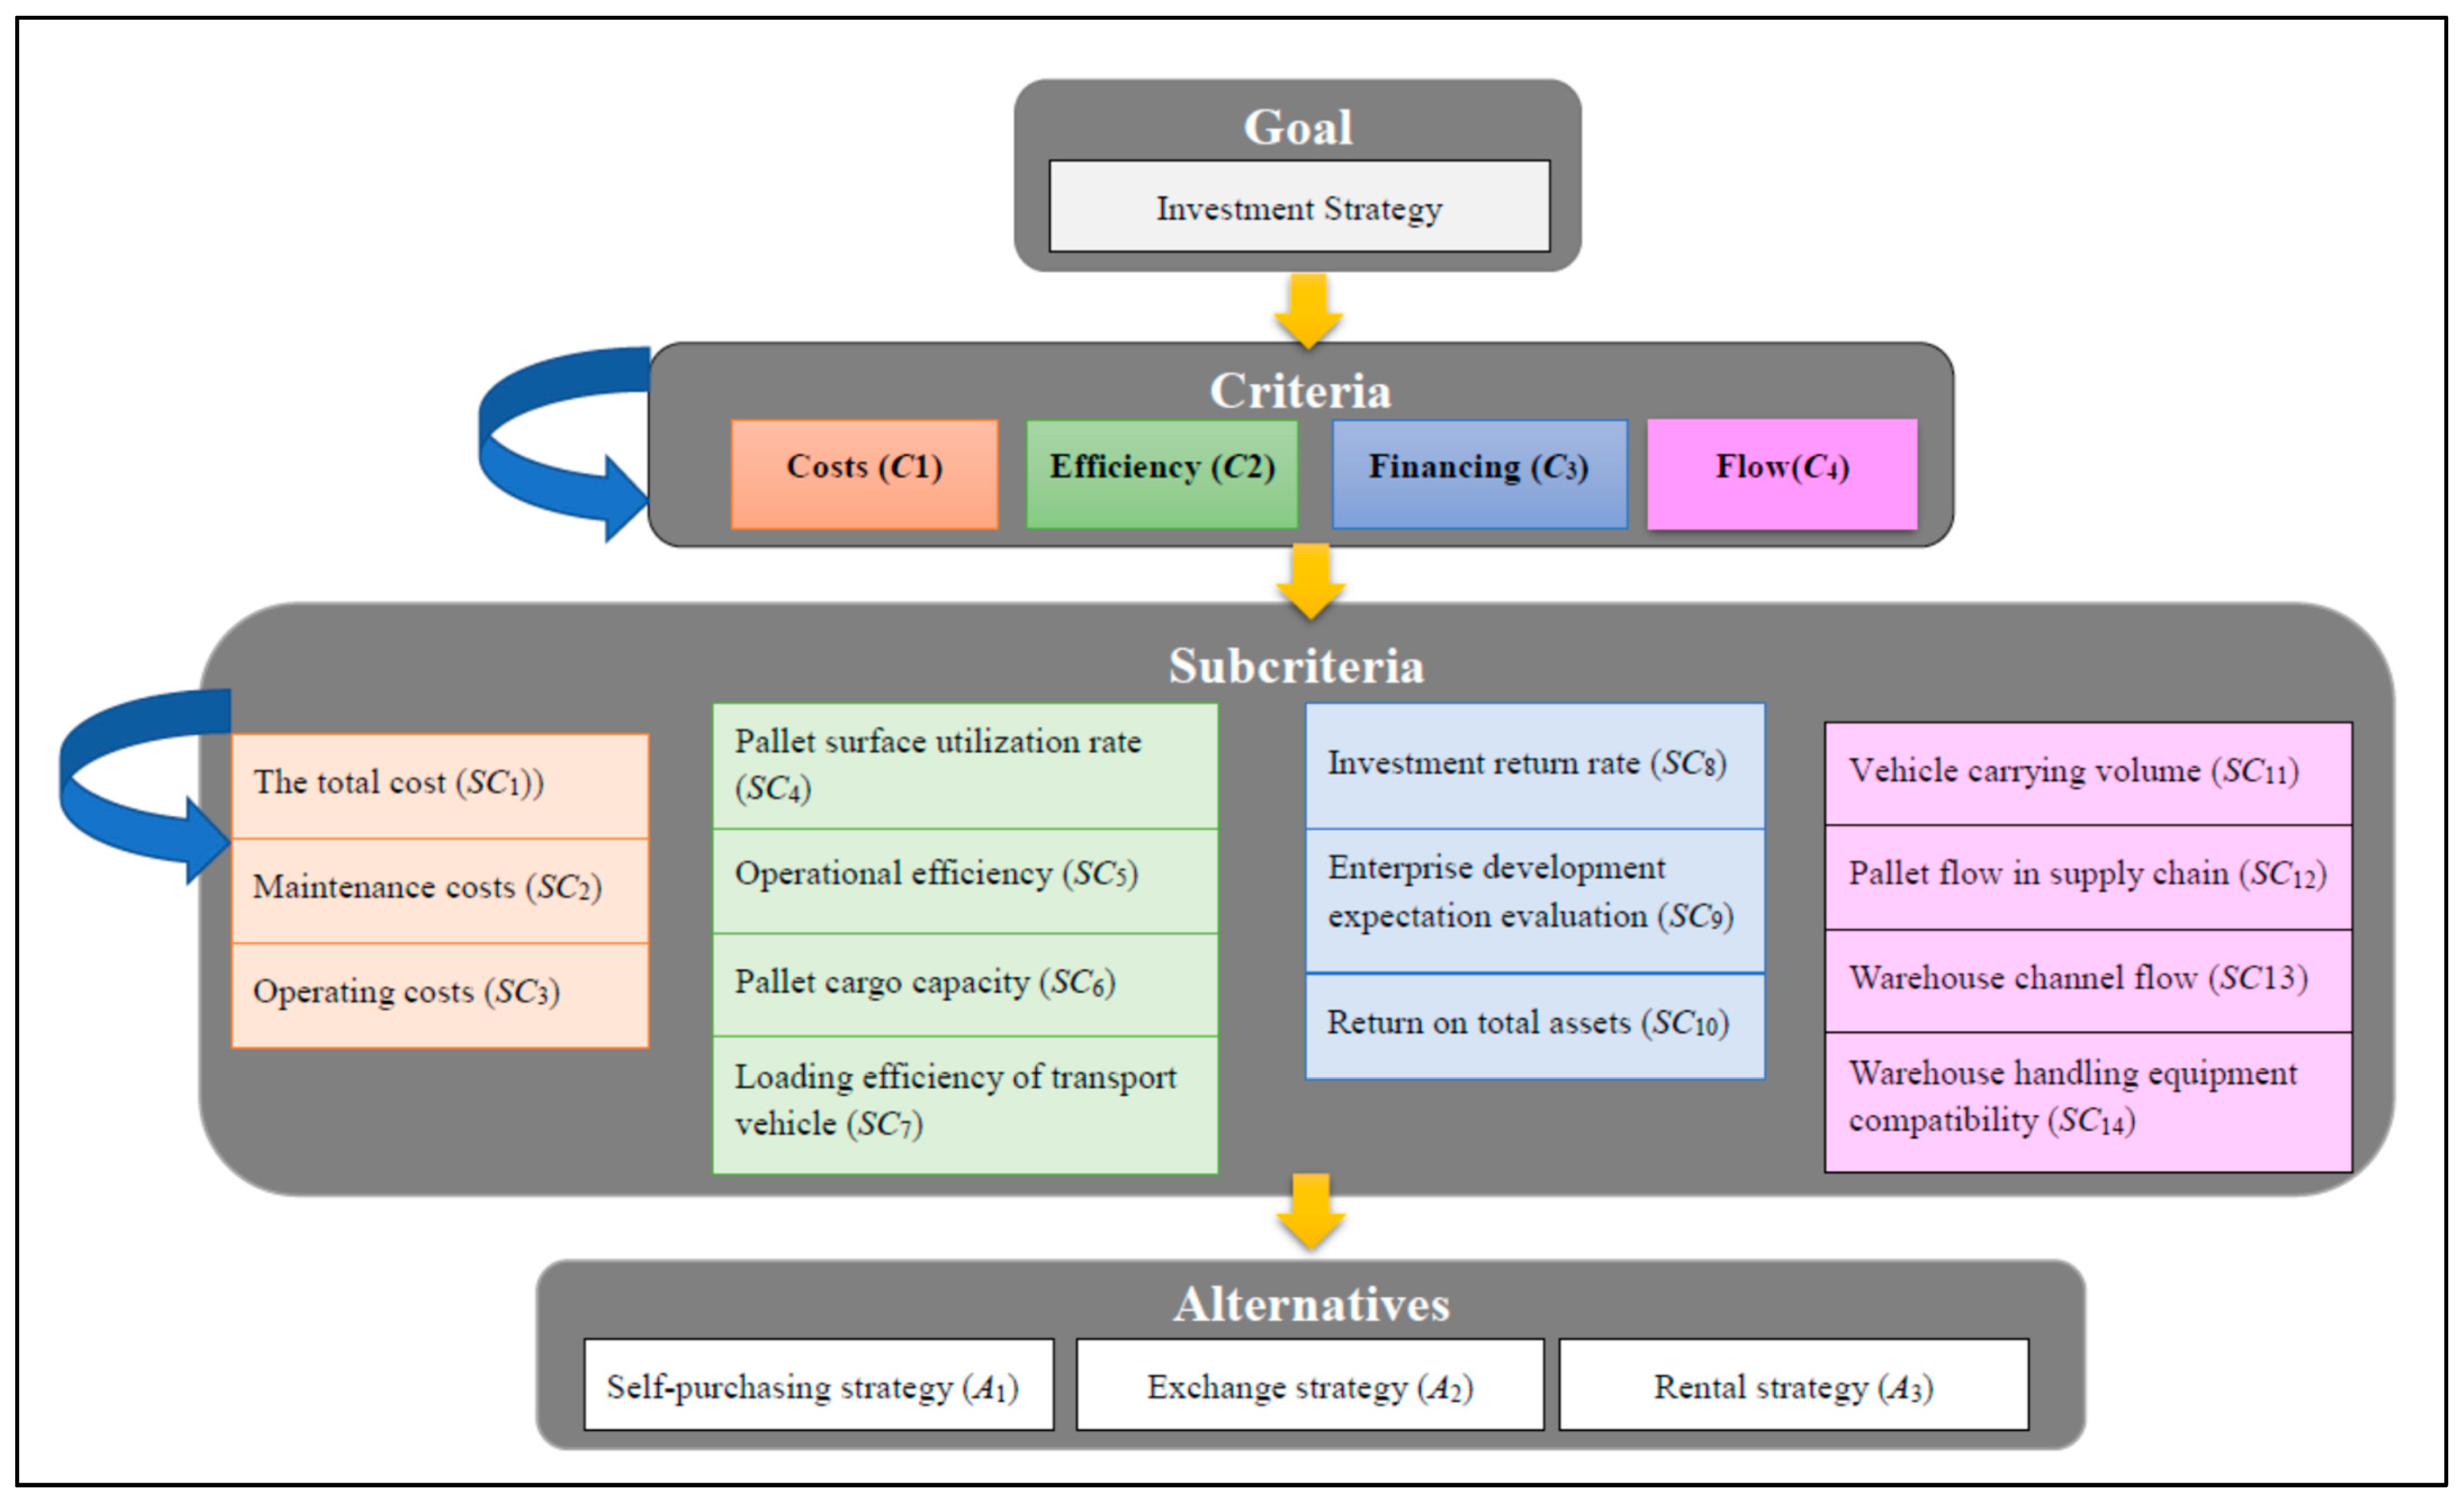
In this study, the consistency of expert opinions was summarized twice after two meetings. The first meeting mainly discussed the 58 initially collected criteria, and then the experts expressed their opinions on the importance of each criterion and finally constructed the hierarchical structure of this paper. The main questions discussed included whether maintenance costs are important to resource (pallet) sharing and the future development prospects of the supply chain system. According to such questions, a preliminary vote was taken first, questions with more than half of the voting results were reserved, and then the second round of voting and discussion was carried out. Each expert was able to fully express their opinions, and, finally the expert opinions were collected and analyzed by the intermediary after the meeting to facilitate the development of the second meeting. In the second meeting, the intermediaries provided the final confirmation to the experts based on the analysis results of the previous meeting and finalize the hierarchy of the evaluation model. The hierarchy of the evaluation model was mainly divided into 4 criteria at the first level, 14 sub-criteria at the second level, and 3 alternative schemes at the third level, as defined in Table 1. Subsequently, the interaction between criteria and sub-criteria of these two levels was discussed. The main issues that were discussed included whether the first evaluation criterion C1 of the first level would be affected by the other three evaluation criteria. The consensus of expert opinions was summarized after the meeting. In the end, the network structure of this study was constructed. 
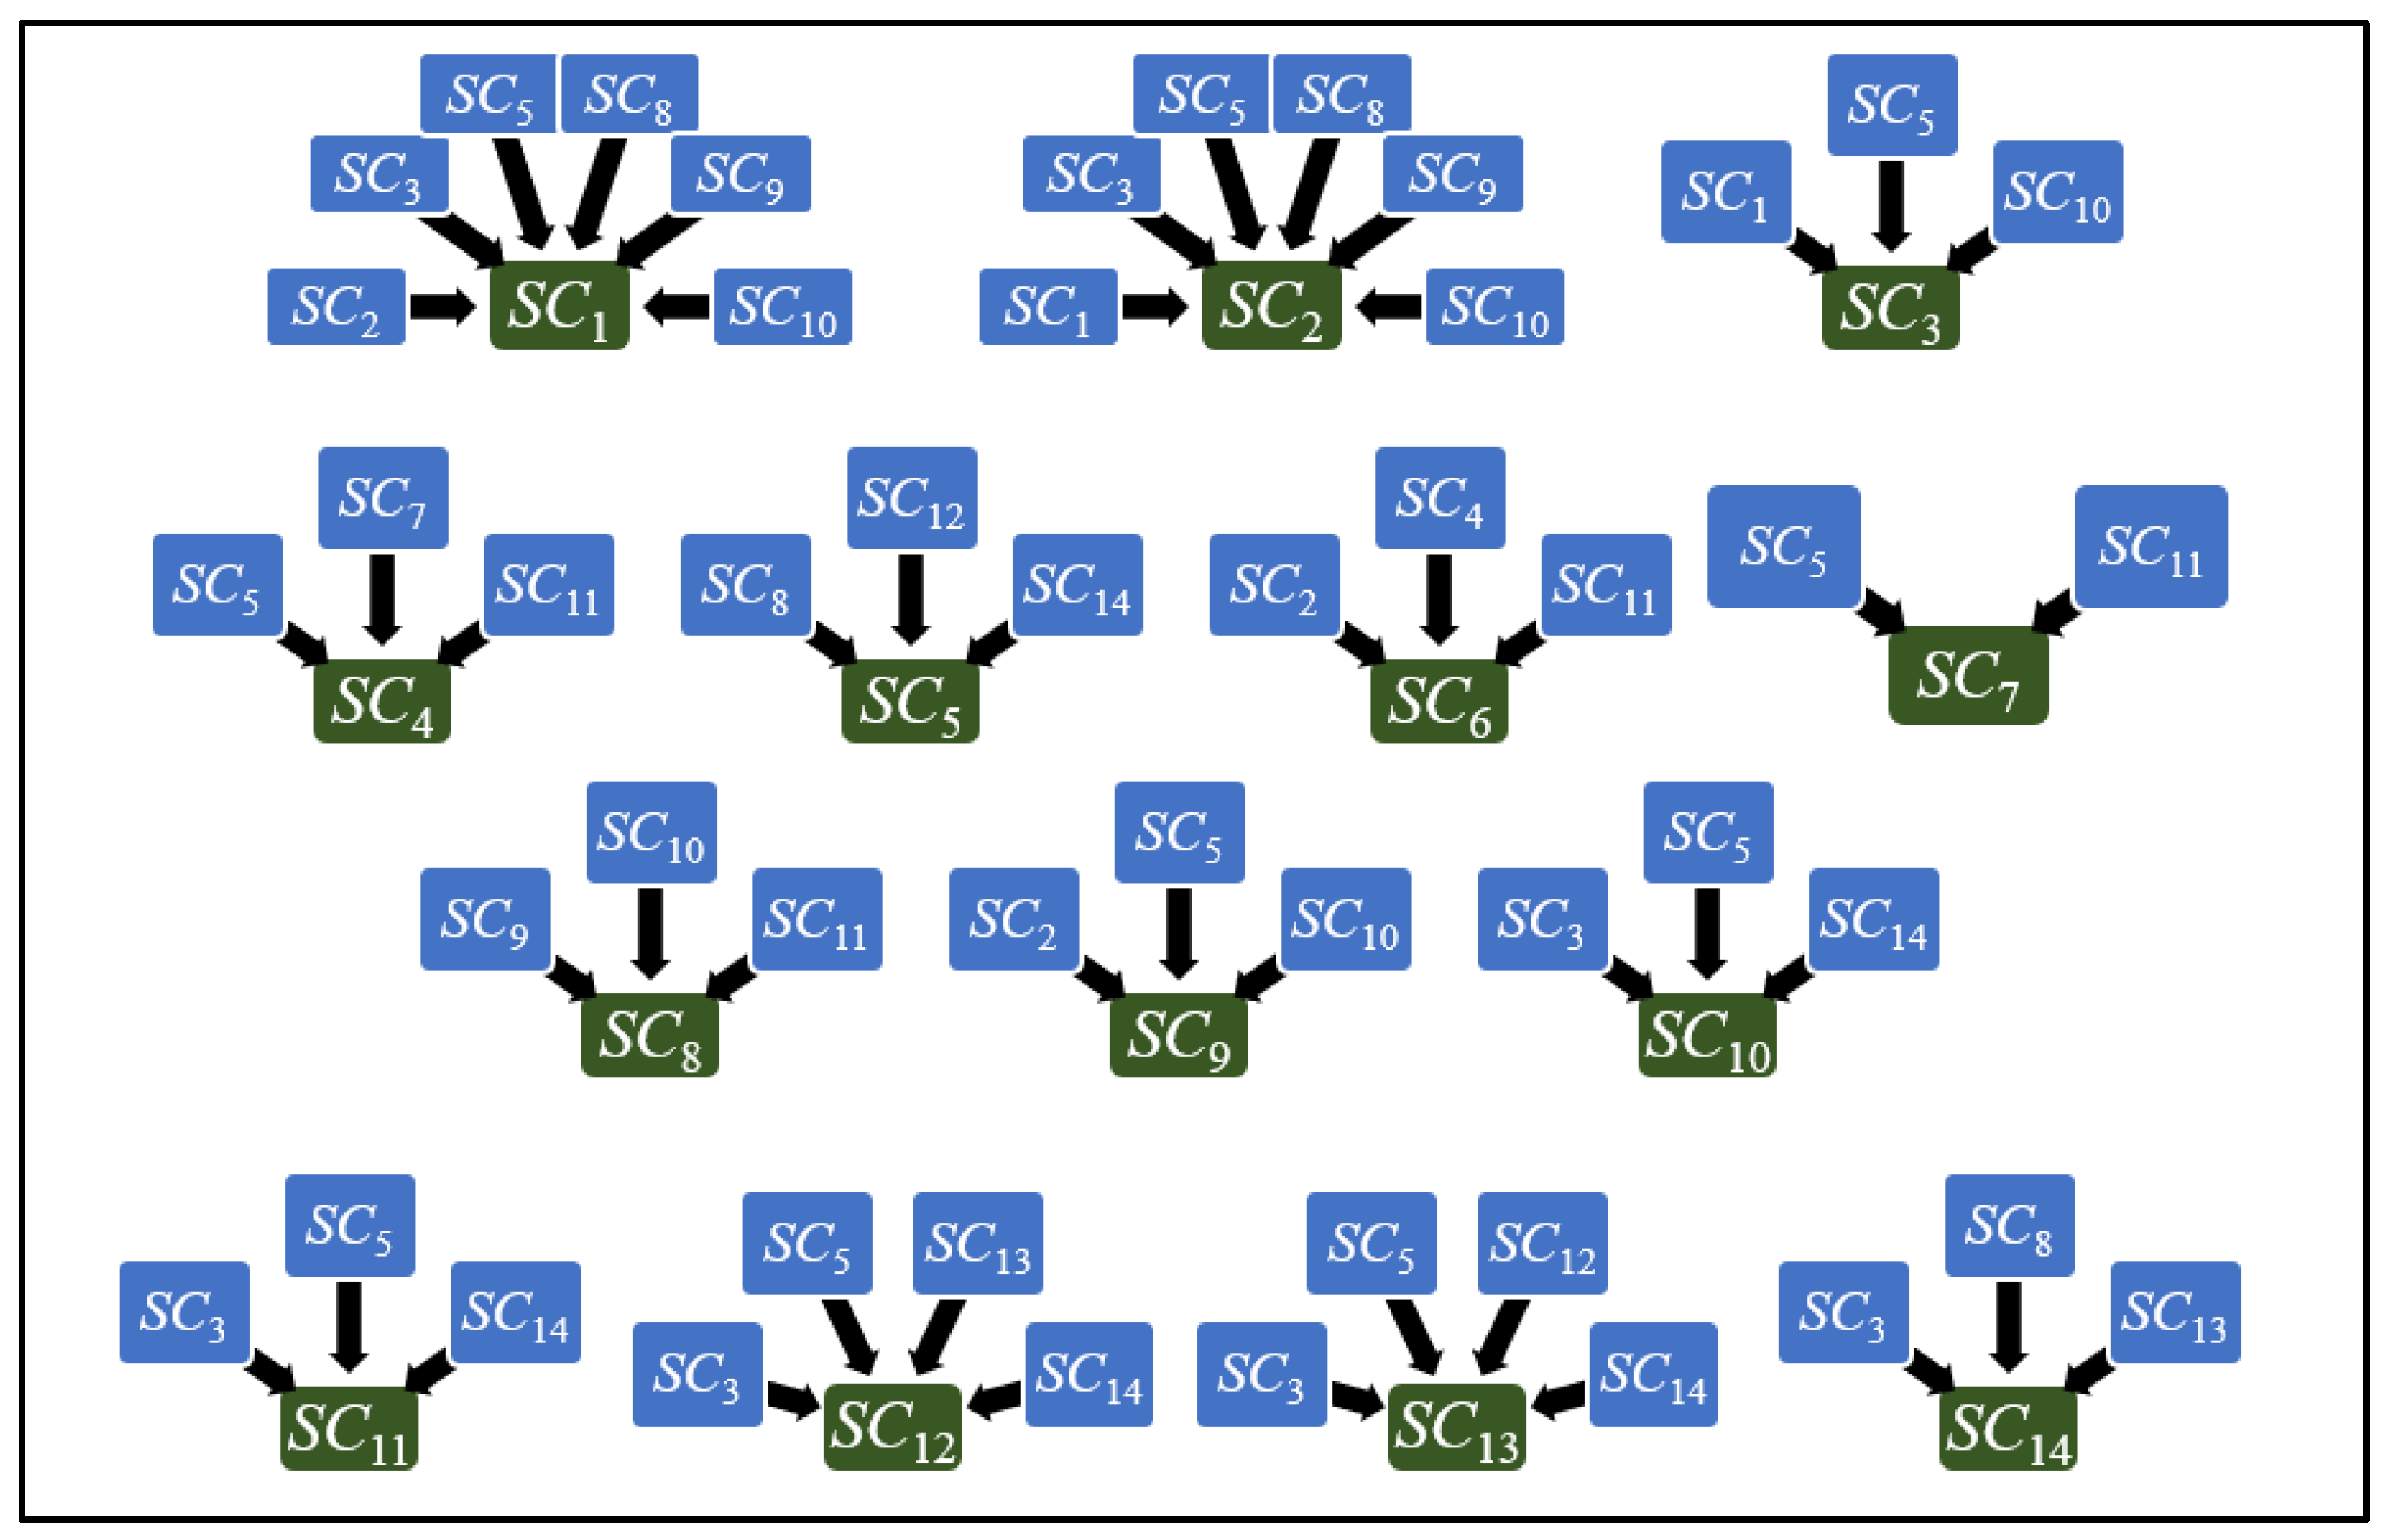
Figure 4 shows the internal dependence relation of the criterion layer, and Figure 5 shows the internal dependence relationship of the sub-criterion layer.

4.3. Stage 2: The Construction of Decision Model Based on FANP

The authors of this paper designed the expert questionnaire and consulted the experts based on the evaluation model constructed in the first stage. The group of 20 experts consisted of 10 university teachers who teach logistics or related fields and 10 professional managers and warehouse-related management personnel. Due to COVID-19, each expert finished the questionnaire in a one-to-one online manner from February to March 2020.
  • Step 1: Construct the problem and model.
According to the evaluation model established above, the authors of this paper evaluated the pallet specifications of enterprise A’s supply chain system through resource integration. After the pallet specifications were decided, alternatives were determined to be self-purchase, lease, and exchange system. As a consequence, the authors of this paper analyzed the three plans to help the decision makers of enterprise A choose the most appropriate plan for future development. The FANP evaluation decision model is shown in Figure 6.
  • Step 2: Construct the TFN.
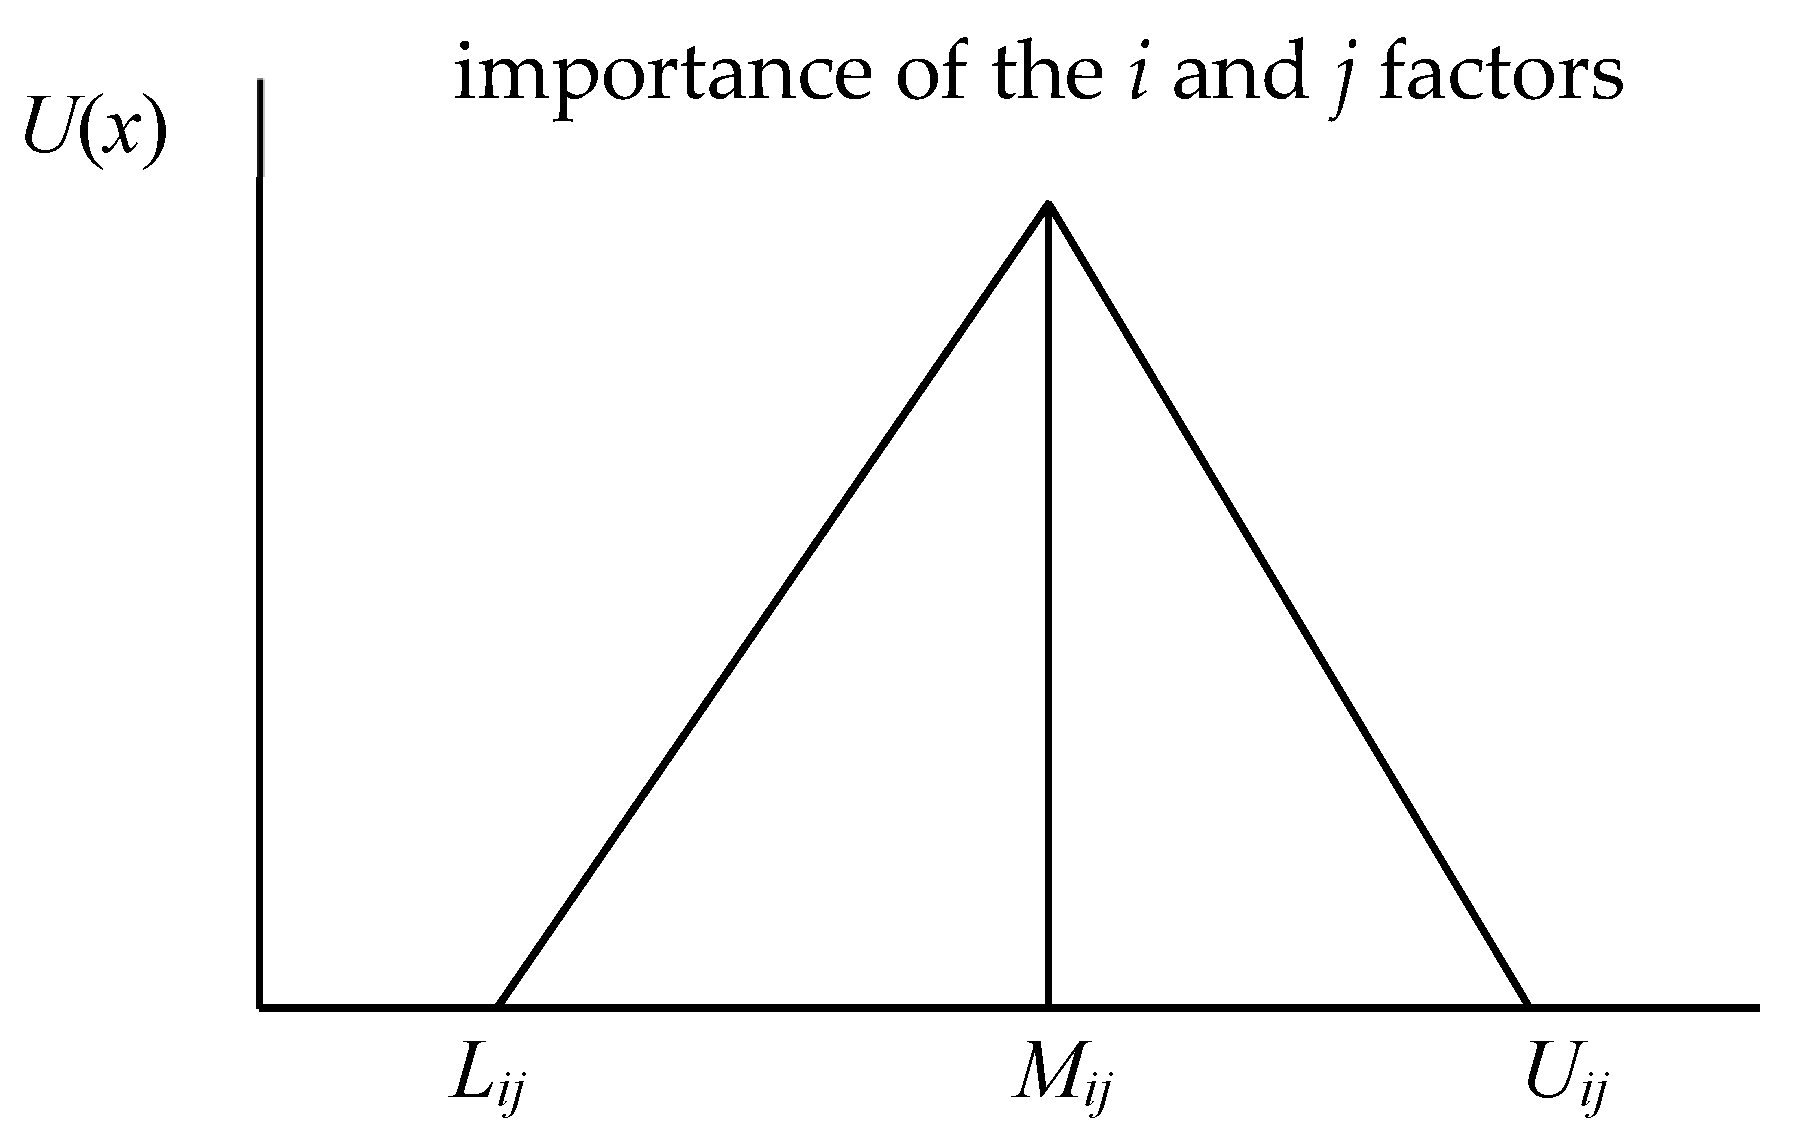
Based on the questionnaire answered by the 20 experts mentioned above, the authors of this paper used Equations (1)–(4) to establish triangular fuzzy numbers. Each expert compared the decision criteria in pairs and provided relative scores.
  • Step 3: Construct a fuzzy pair-wise comparison matrix and defuzzification.
A fuzzy pair-wise comparison matrix was constructed by 20 experts according to a pair-wise comparison between criteria. For example, in the 4 × 4 matrix in Table 2, the diagonal angle of the matrix is divided into upper and lower triangles from the top left to the bottom right. We only need to consult experts on the upper triangle of the matrix, and the lower triangle is the reciprocal of the upper triangle. Therefore, this matrix has six questions, such as a ˜ 12 ,   a ˜ 13 ,   a ˜ 14 ,   a ˜ 23 ,   a ˜ 24 and a ˜ 34 , which are answered by 20 experts.
After filling in the blanks, the fuzzy pair-wise comparison matrix could be established using TNF. For example, the first item in the matrix was a ˜ 12 . After the 20 experts separately answered the questions, there were 20 ratio values, with a minimum value of 0.111, a geometric average value of 0.266, and a maximum value of 2 (this was the TNF). The other five questions, a ˜ 13 ,   a ˜ 14 ,   a ˜ 23 ,   a ˜ 24 and a ˜ 34 were also established in a fuzzy pair-wise comparison matrix according to this concept.
After the establishment of the fuzzy pair-wise comparison matrix, defuzzification could be carried out using Formulas (6) and (7). In this paper, the values of α and β were found to equal 0.5, which indicated that the decision makers think the uncertainty of the future environment is stable and attitudes towards the future are neutral [31]. Therefore, we defuzzified them. The TNF values of a ˜ 12 were found to be 0.111 and 0.266, so defuzzification could be carried out as follows:
f 0.5   ( L 12 ) = ( 0.266 0.111 ) × 0.5 + 0.111 = 0.189 .
f 0.5   ( U 12 ) = 2 ( 2 0.266 ) × 0.5 = 1.133 .
g 0.5 , 0.5   ( a ˜ 12 ) = 0.5 × 0.189 + ( 1 0.5 ) × 1.133 = 0.661 .
g 0.5 , 0.5   ( a ˜ 21 ) = 1 0.661 = 1.513 .
when a ˜ 13 ,   a ˜ 14 ,   a ˜ 23 ,   a ˜ 24 ,   a ˜ 34 have also been counted, new comparison matrices were constructed, as shown in Table 3.
  • Step 4: Determine eigenvectors and supermatrix formation.
(1) Calculate the eigenvector matrix W21.
According to the defuzzification of Table 2, a comparison matrix was established and the values of eigenvectors were calculated. Table 3 shows the eigenvector, CI, and CR values of W21.
(2) Determine the eigenvector matrices of W32 and W43.
In this paper, the above-mentioned steps 2 and 3 were used for answering. The fuzzy comparison matrix of W32 as established, as shown in Table 4. Then, as previously discussed in step 2, defuzzification was performed and the eigenvector of each matrix was calculated. Finally, the values of W32 and W43 were constructed according to their eigenvector values. In addition, the CI and CR values of the matrix were both less than 0.1. W32 was intended to be used to evaluate the relative importance of each sub-criteria in criteria and the sorting result, as shown in Equation (11). When evaluating the sub-criterion “cost” of the decision-making model, the eigenvectors (weights) of the corresponding three sub-criteria were found to be as follows: the pallet cost (SC1) was 0.648, the maintenance cost (SC2) was 0.101, and the operation cost (SC3) was 0.251. Following the evaluation of the “efficiency” of the sub-criteria of the decision-making model, the eigenvectors (weights) of the corresponding three sub-criteria were found to be as follows: the pallet surface utilization rate (SC4) was 0.122, the operational efficiency (SC5) was 0.573, the pallet capacity load (SC6) was 0.156, and the loading efficiency of the transport vehicle (SC7) was 0.149. When evaluating the sub-criteria “economy” of the decision-making model, the eigenvectors (weights) of the corresponding three sub-criteria were calculated as follows: the investment return rate (SC8) was 0.642, the enterprise development expectation evaluation (SC9) was 0.106, and the return on total assets (SC10) was 0.252. When evaluating the sub-criteria “flow” of the decision-making model, the eigenvectors (weights) of the corresponding three sub-criteria were found to be as follows: the vehicle-carrying efficiency (SC11) was 0.266, the pallet flow in the supply chain (SC12) was 0.053, the warehouse channel circulation (SC13) was 0.118, and the warehouse handling equipment compatibility (SC14) was 0.563.
C 1 C 2 C 3 C 4 S C 1 S C 2 S C 3 S C 4 S C 5 S C 6 S C 7 S C 8 S C 9 S C 10 S C 11 S C 12 S C 13 S C 14 [ 0.648 0 0 0 0.101 0 0 0 0.251 0 0 0 0 0.122 0 0 0 0.573 0 0 0 0.156 0 0 0 0.149 0 0 0 0 0.642 0 0 0 0.106 0 0 0 0.252 0 0 0 0 0.266 0 0 0 0.053 0 0 0 0.118 0 0 0 0.563 ]
In the same way as W32 was calculated above, the eigenvector of W43 was calculated, as shown in Table 5.
(3) Determine the eigenvector matrices of W22 and W33 to understand the interactions between criteria and sub-criteria.
Table 6 shows the fuzzy comparison matrix and eigenvector values of W22.
The calculation results of the feature vector matrix W22 are as follows:
C 1 C 2 C 3 C 4 W 22 = C 1 C 2 C 3 C 4 [ 0.568 0.055 0.276 0.276 0.114 0.564 0.061 0.061 0.051 0.118 0.539 0.539 0.267 0.263 0.124 0.124 ]
The eigenvector matrix of W33 was determined with the calculation method of W22, and the results are shown in Table 7.
(4) Determine the results of the FANP.
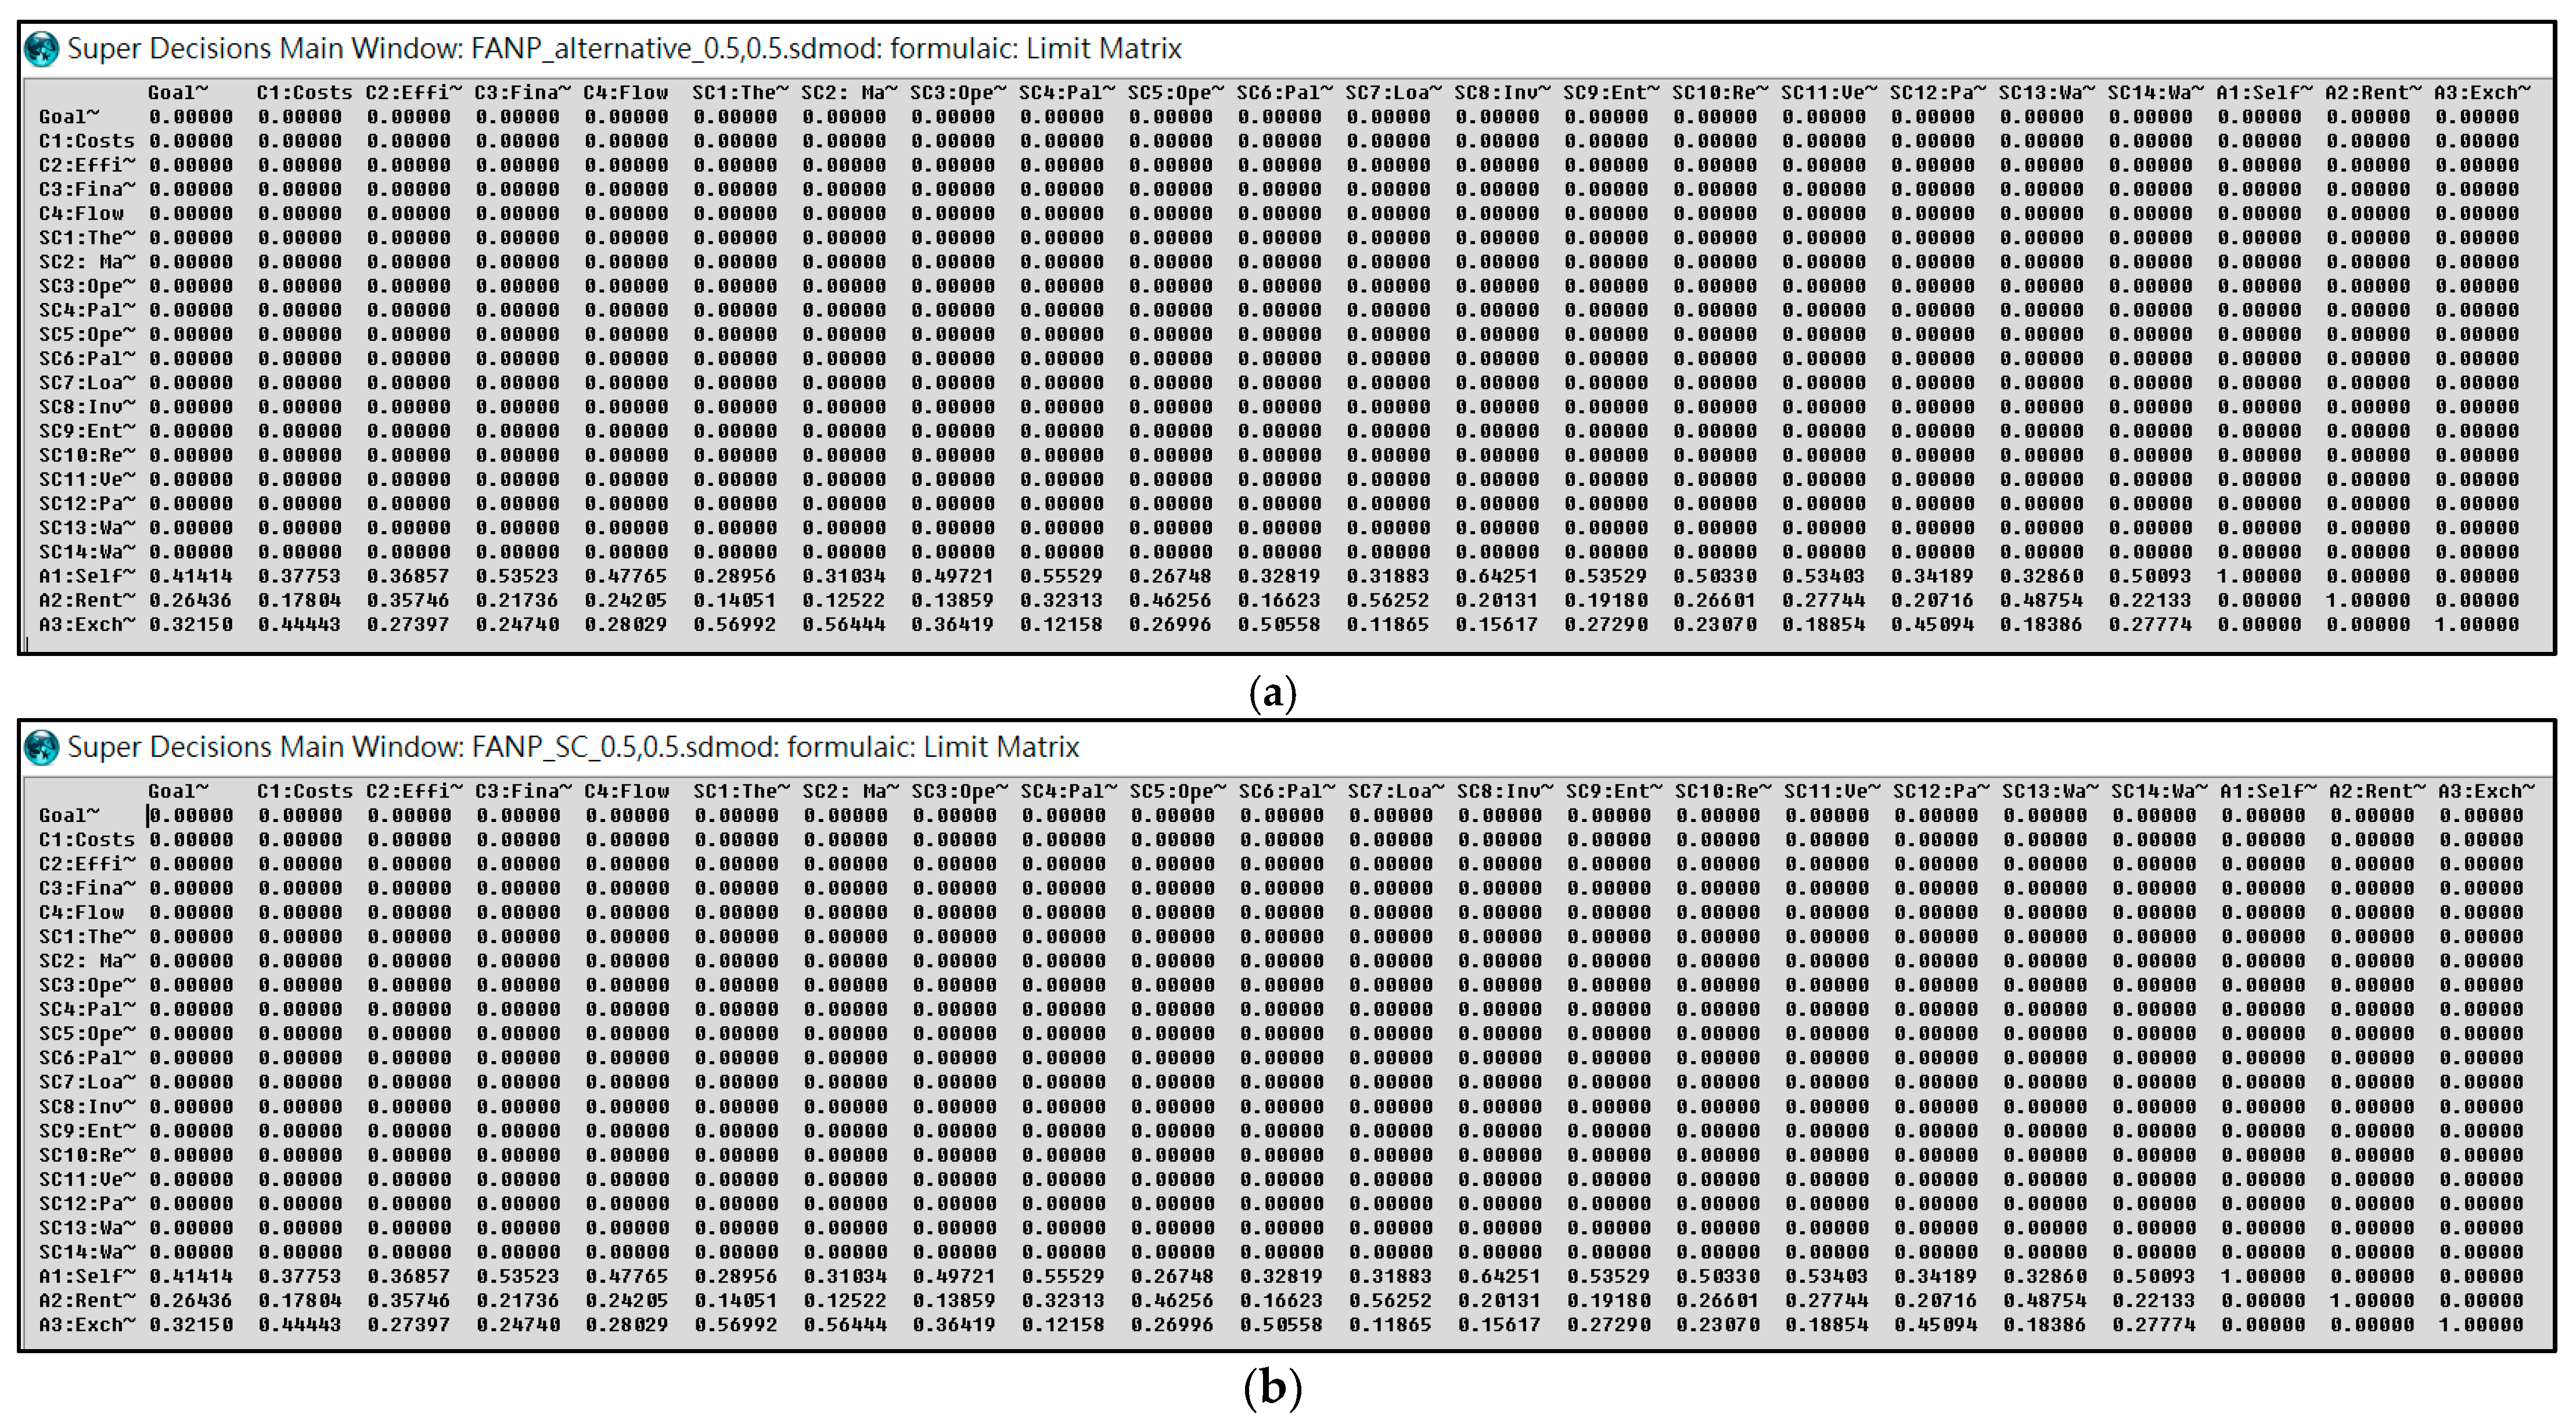
First, the supermatrix was created after the eigenvector matrices of W21, W32, W43, W22, and W33 were obtained, as shown in 
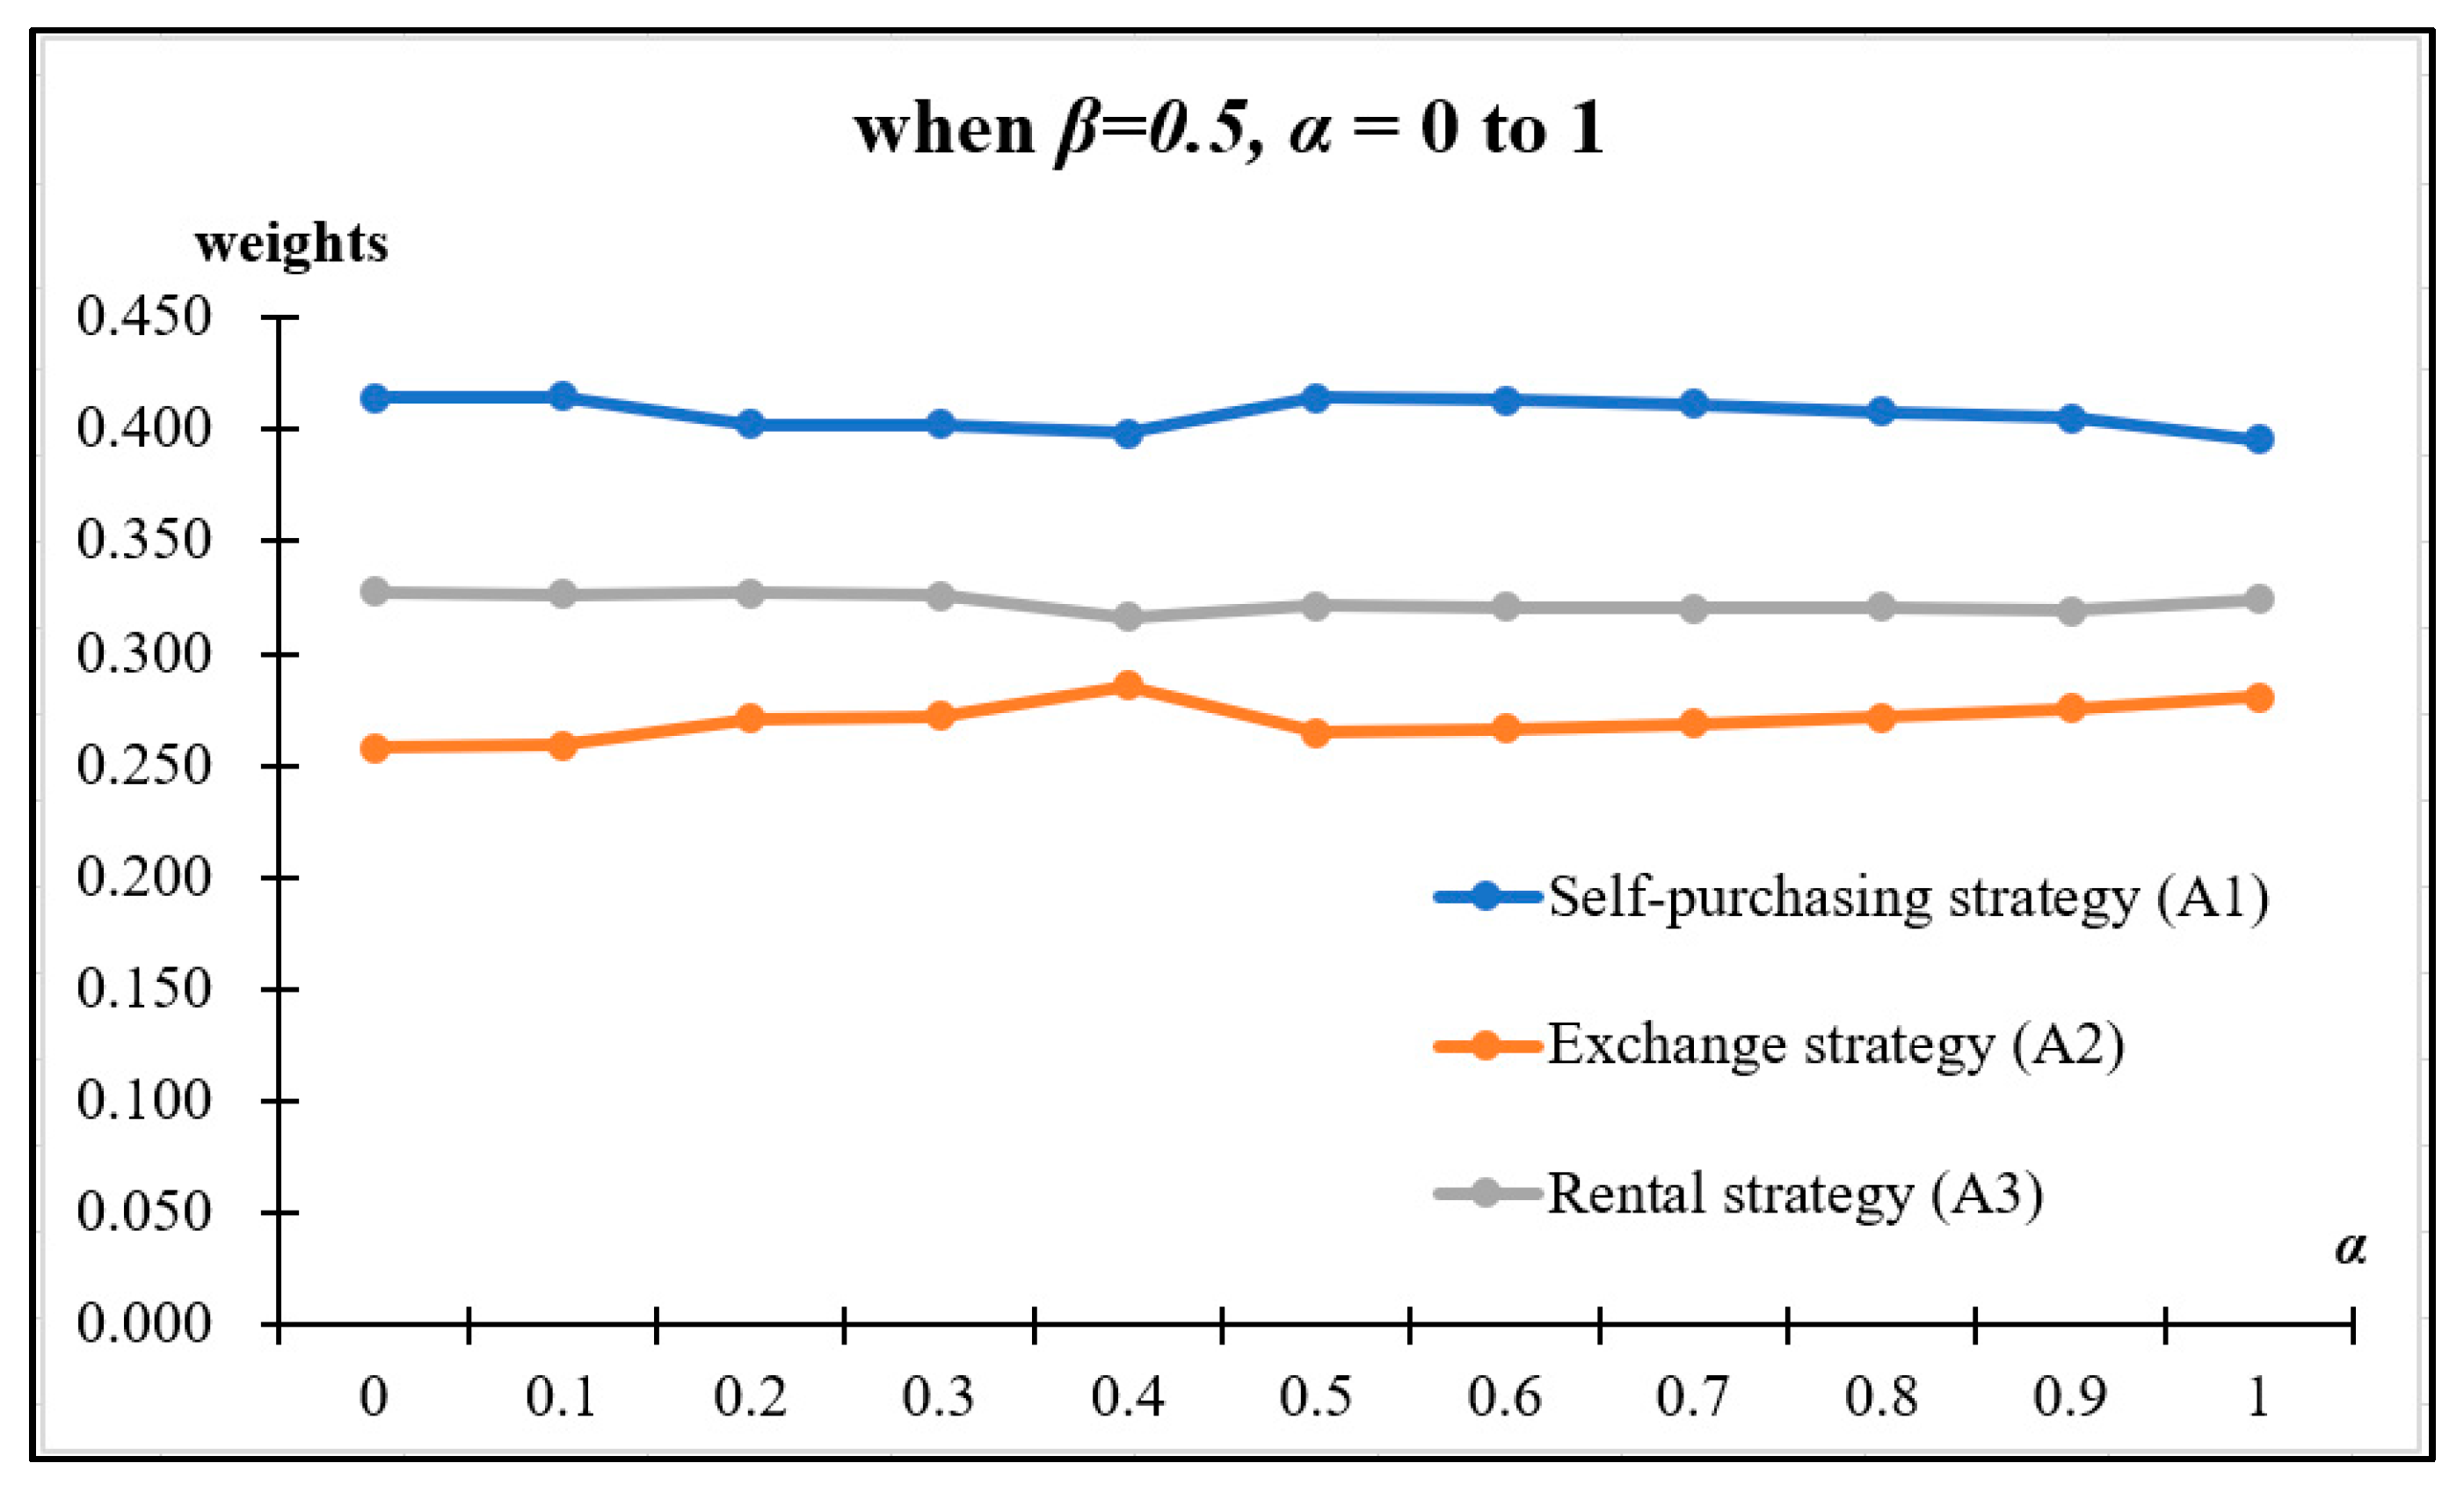
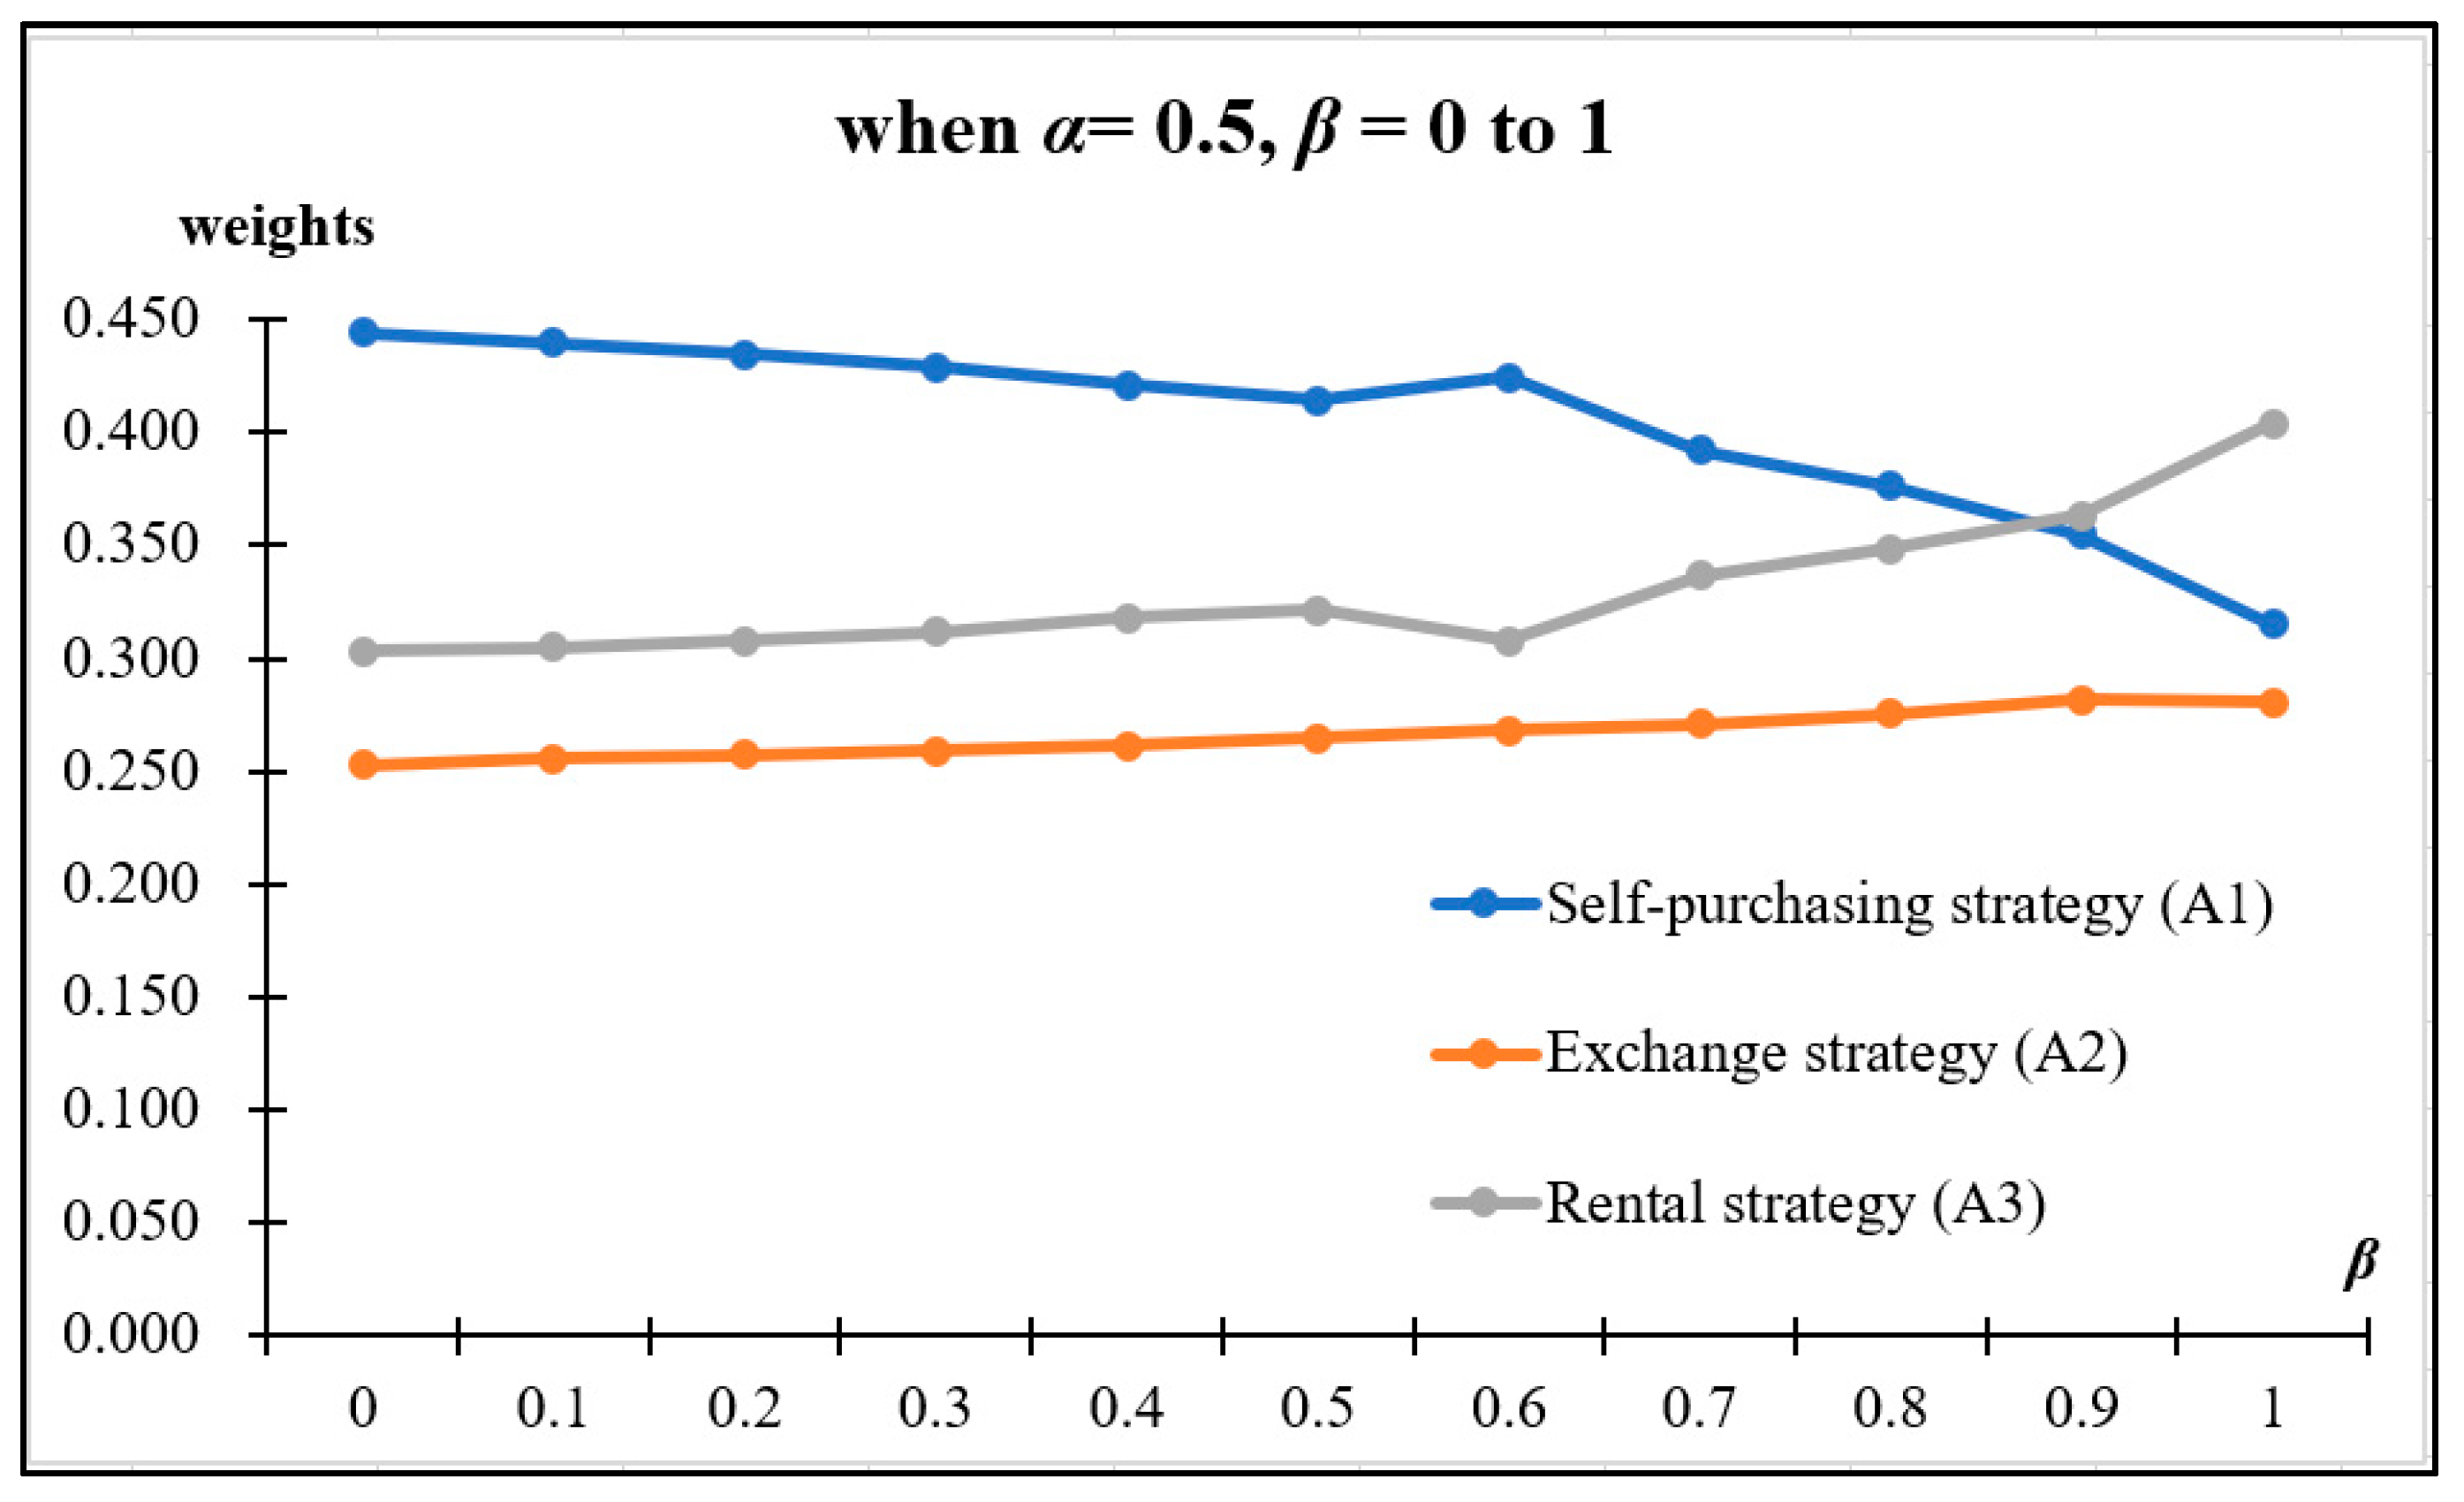
Table 8. Then, the supermatrix was weighted, and the matrix limit operation was used to solve the final order of the scheme. Super decisions were used in this paper to calculate the result of the limit, and the order of options was self-purchase strategy (A1) 0.414 > rental strategy (A3) 0.322 > exchange strategy (A2) 0.263. The optimal ordering was found to be the self-purchase strategy (0.398), and the limit of the supermatrix is shown in Figure 7.
(5) Discussion and final decision.
Based on the results obtained by the FANP, the authors of this paper provided the evaluation results and feedback to the expert decision-making group of enterprise A, and then they discussed the results of the priority order of criteria and program importance. The details are as follows.
(5.1) Priority order of importance of criteria.
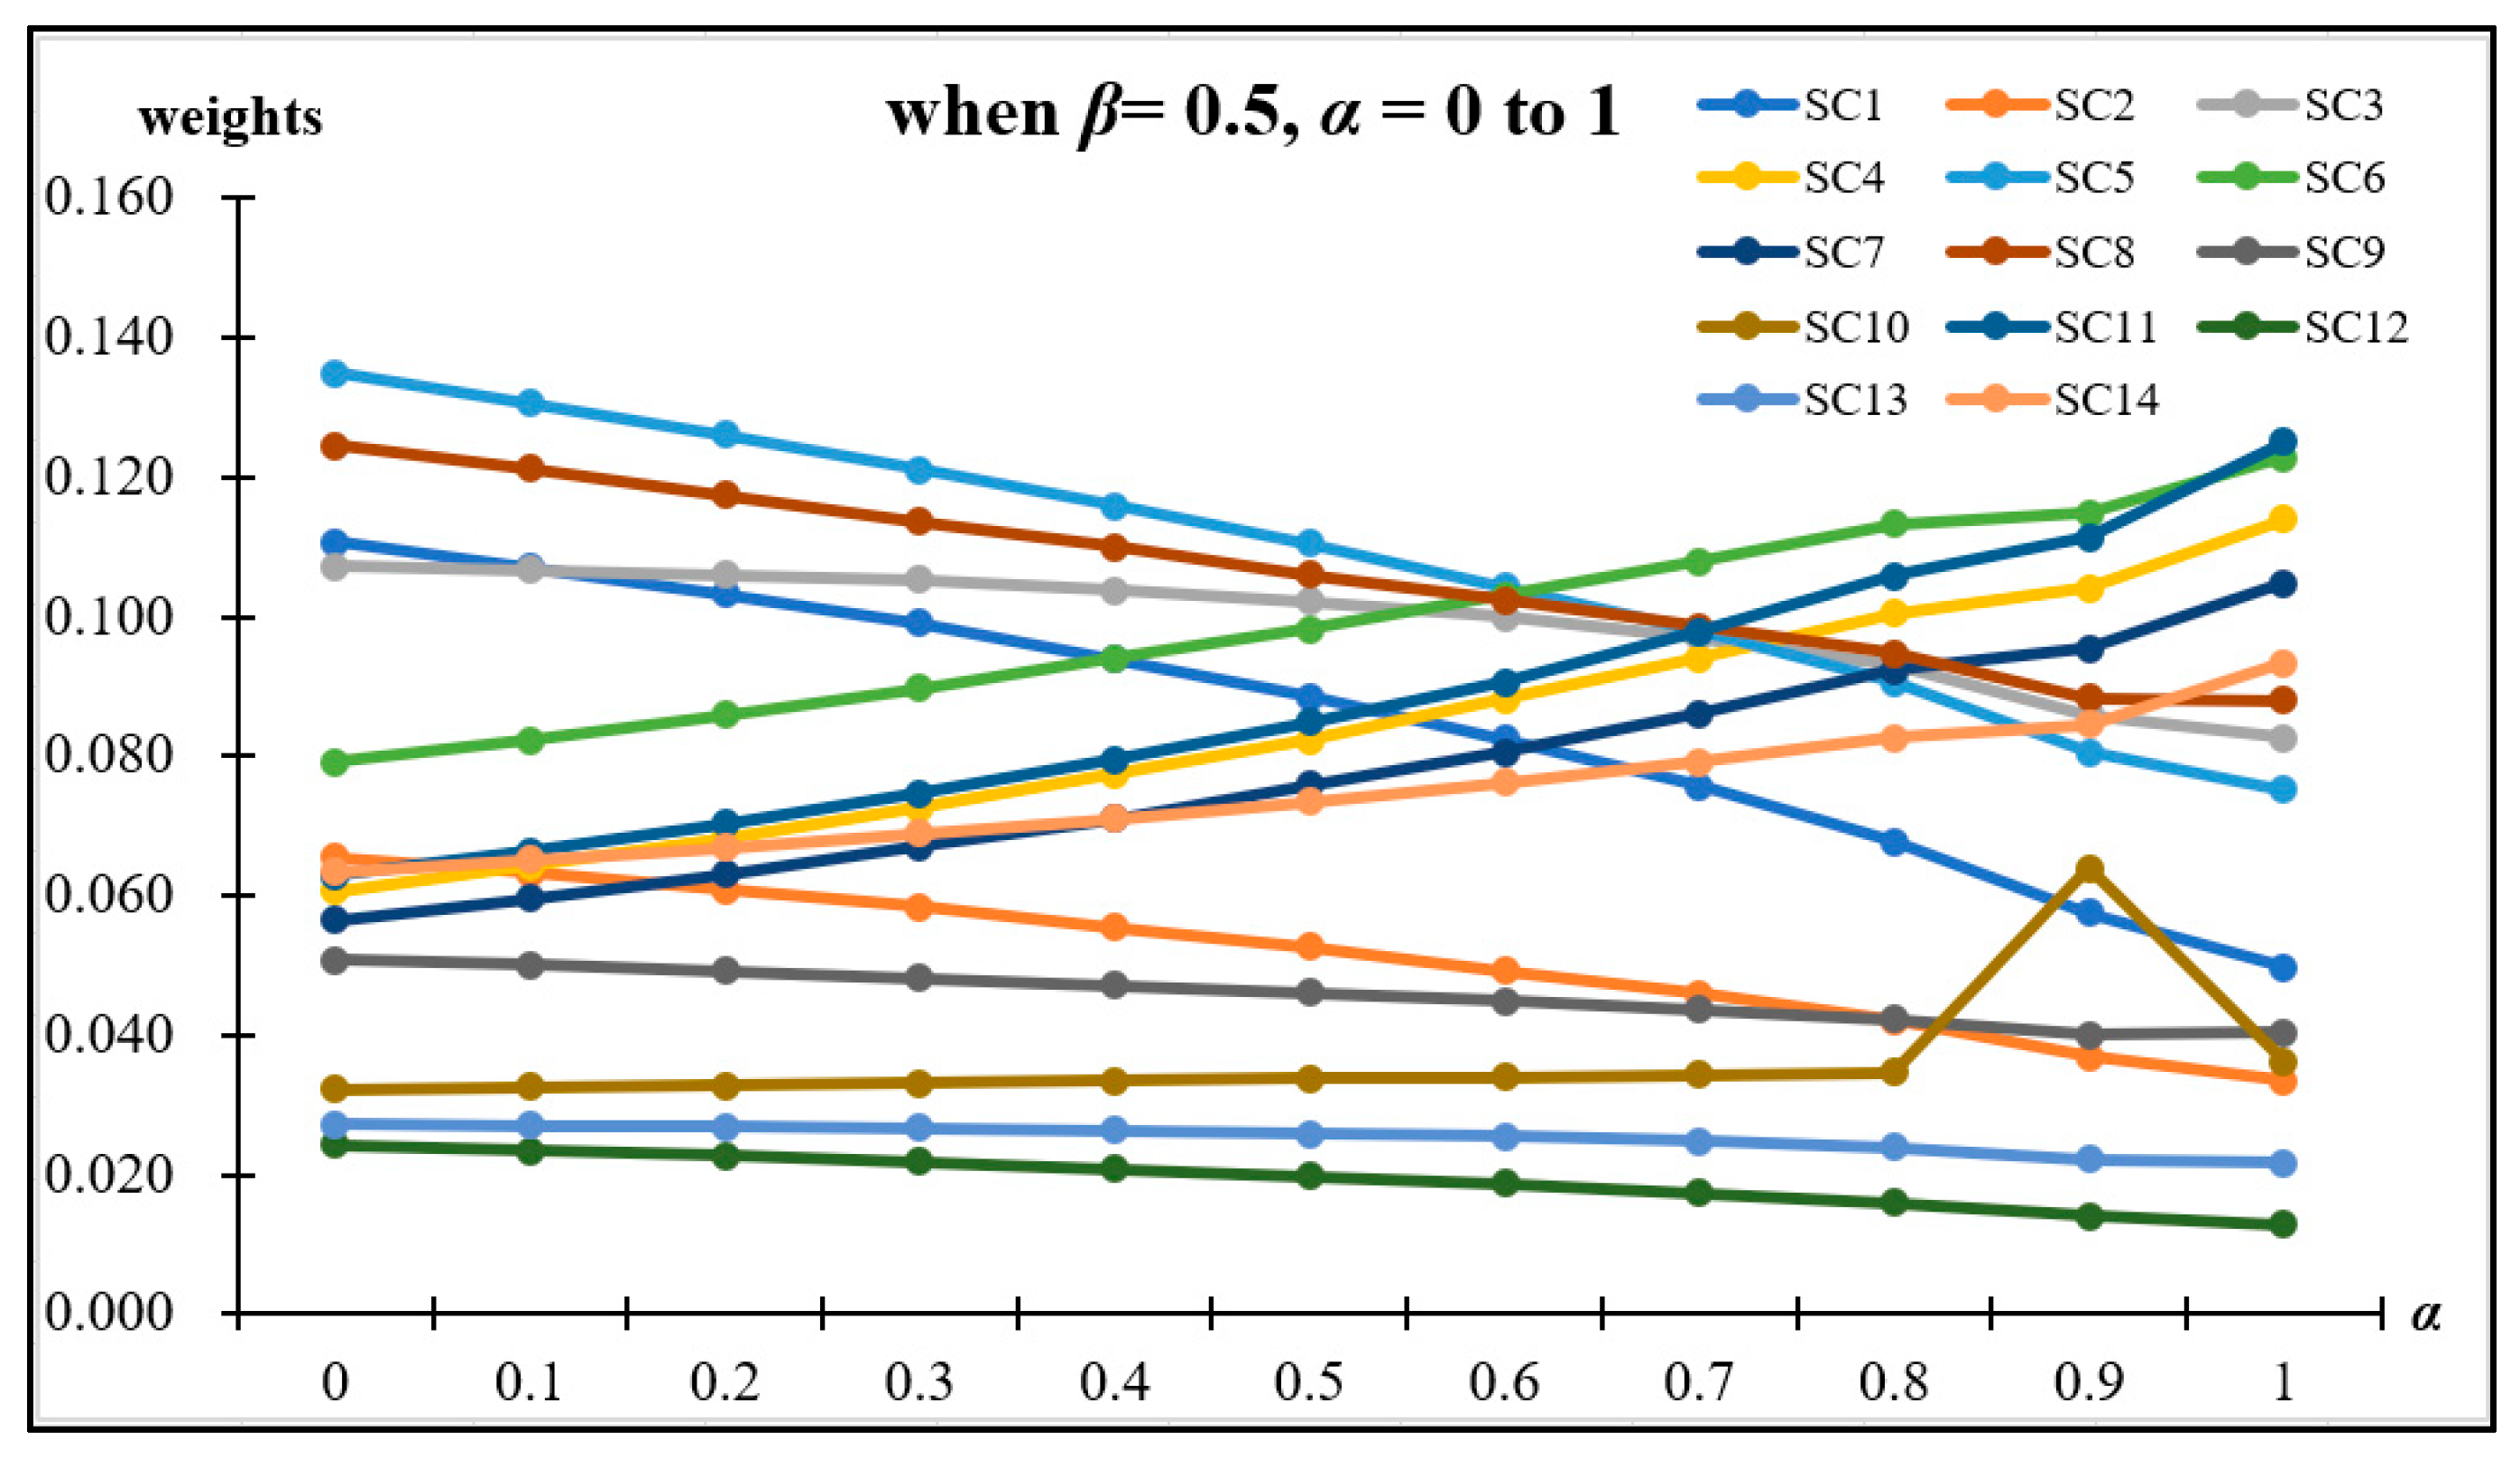
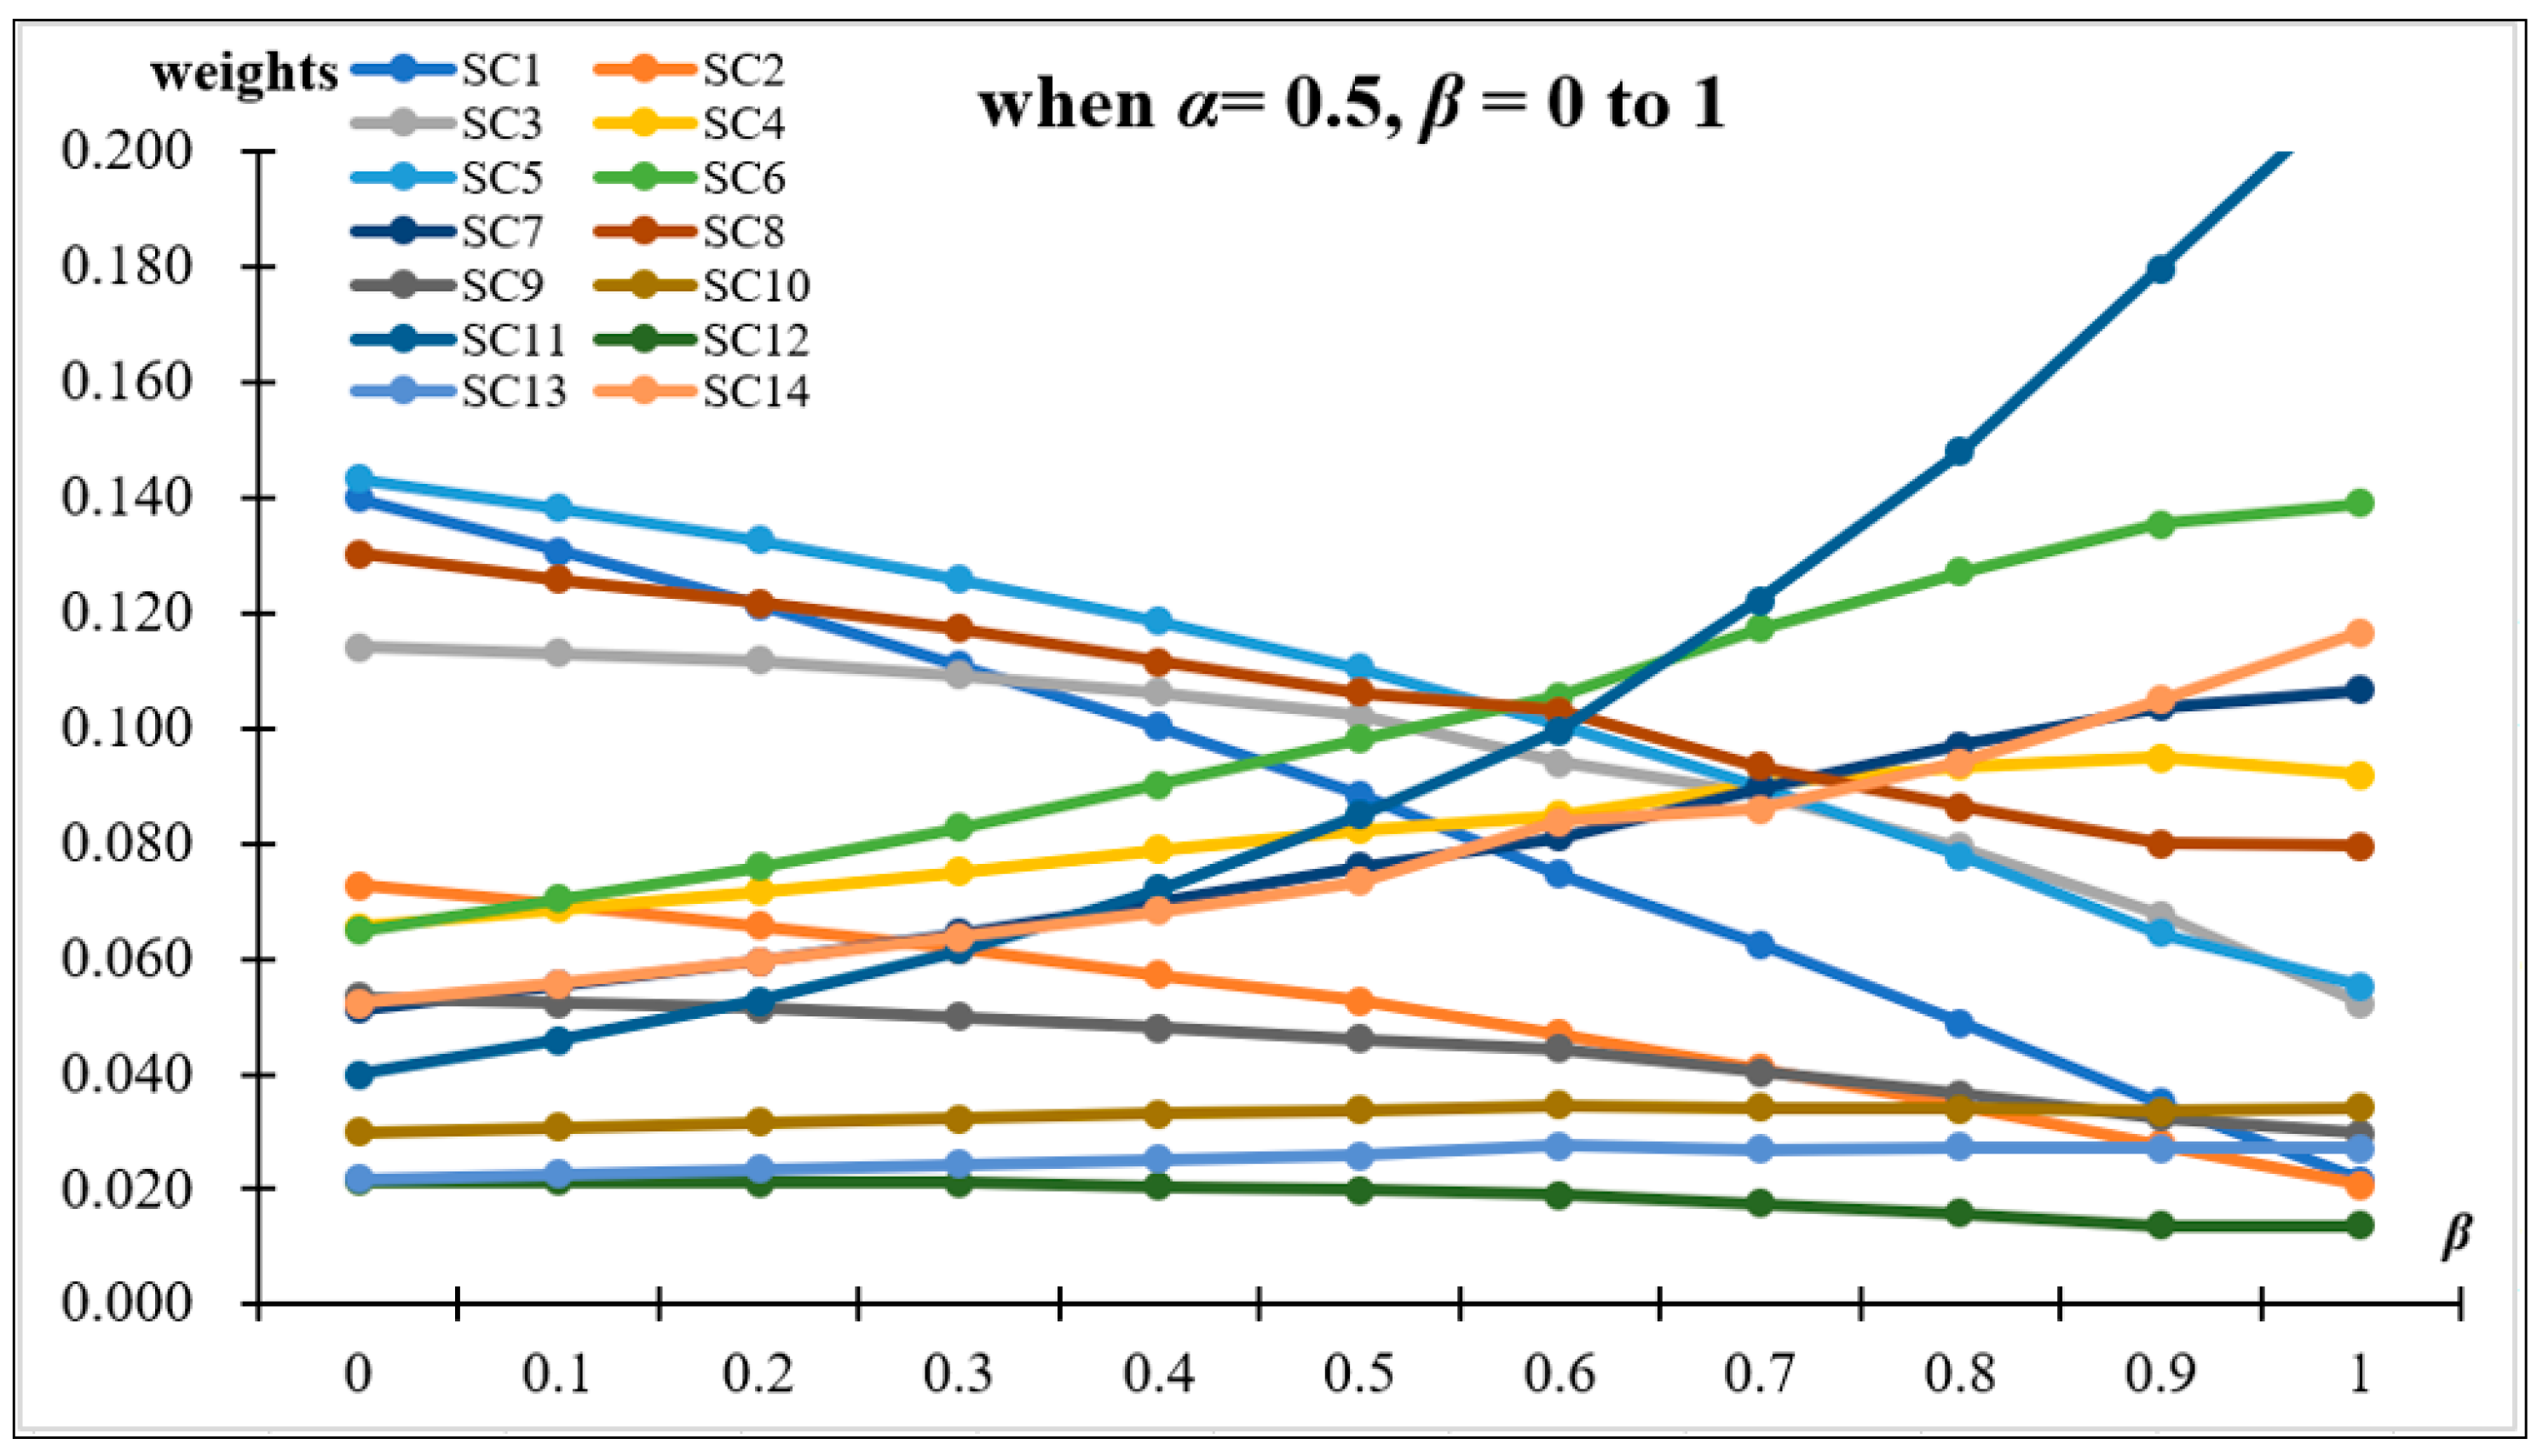
The weights of the 14 sub-criteria were ranked as follows: operational efficiency (SC5) 0.110 > investment return rate (SC8) 0.106 > operating cost (SC3) 0.102 > pallet cargo capacity (SC6) 0.098 > total cost (SC1) 0.089 > vehicle-carrying volume (SC11) 0.085 > pallet surface utilization rate (SC4) 0.082 > loading efficiency of transport vehicle (SC7) 0.076 > warehouse handling equipment compatibility (SC14) 0.073 > maintenance cost (SC2) 0.053 > enterprise development expectation evaluation (SC9) 0.046 > return on total assets (SC10) 0.034 > warehouse channel flow (SC13) 0.026 > pallet flow in the supply chain (SC12) 0.020.
It was found that operation efficiency was the highest ranked, which means that the operation efficiency of enterprise logistics is highly dependent on the rapid circulation of goods. The circulation speed of goods represents the modernization level of enterprise logistics; therefore, the stronger the circulation, the higher the modernization level and the better the economy. Therefore, the construction of shared resources will be an important task for the future development of logistics. Operation efficiency affects investment income and operation cost, which illustrates that manpower should not occupy a large proportion of the operation of enterprise logistics and that investment automation and mechanization are the main directions for the strategic layouts of enterprise logistics. Mechanization operation can effectively reduce distribution costs, and a higher level of mechanization is the key to reducing the cost of enterprise logistics operation. Automation and mechanization represent standards of uniformity, as well as increased efficiency and cost reduction, that result in investment benefits for enterprises.
The second most important factors were found to be transportation volume, pallet surface utilization rate, pallet loading efficiency, and warehouse handling equipment compatibility, which indicates that enterprise logistics have higher requirements for the utilization rate of distribution facilities. Under daily fixed operating costs, higher equipment utilization can reduce the cost of cargo transportation and is beneficial to the development of the enterprise. Compared to the previous several criteria, enterprise logistics comprise a conventional auxiliary business, so the importance of enterprise logistics development expectation evaluation and return on total assets is lower. The warehouse channel flow and the supply chain pallet flow were found to be the least important factors because the facilities and equipment of automated warehousing are not innovative and the importance of their development has been fully considered.
(5.2) Results of priority ranking of the scheme.
The authors of this paper provided the evaluation results and feedback to the decision-making experts of enterprise A; they considered the self-purchase strategy to be the best, followed by the leasing strategy. The difference of weight between these two was found to be minor, but self-purchase was still assessed as a better option for the development of the supply chain system. Therefore, the decision-making group decided to synchronously proceed with the self-purchase and leasing strategies. The plan is to purchase 1/3 pallets and lease 2/3 pallets in the first year, purchase 2/3 pallets and lease 1/3 pallets in the second year, and purchase the final 1/3 pallets in the third year.
In summary, when considering the resource integration strategy of the chain supermarket logistics system, the primary task must be improving the operational efficiency of the facilities and equipment of the logistics center, followed by lowering the investment cost. Only by improving operational efficiency can enterprises save operating costs and create future value for enterprises.

4.4. Fuzzy Sensitivity Analysis

In this study, the sensitivity analysis of the evaluation decision scheme was conducted through α and β values. Decision makers can determine α according to the uncertainty of the future investment environment, where a higher α value represents a higher uncertainty of the future environment, that is, the higher the risk degree of the future investment environment. On the contrary, the smaller the α value, the more stable the future environment will be, that is, the lower the risk degree of the future investment environment. In addition, decision makers can determine the β value according to their judgment, where a β value = 0 indicates that decision makers have an optimistic attitude towards the future investment environment. Conversely, β = 1 indicates that decision makers have a pessimistic attitude towards the future investment environment. In the following analysis, we simulated the conditions of α = 0.5 and β = 0 to 1 and those of β = 0.5 and α = 0 to 1, and we compared the results for the FANP and the ANP.

4.4.1. Sensitivity Analysis of Assessment Criteria

As shown in Figure 8, when β = 0.5 and α = 0 to 1, the decision makers’ preference for the future investment environment is mild (that is, between optimism and pessimism). The risk degree of the future investment environment can be simulated and analyzed from large to small by α = 0 to 1. When the risk degree of investment is the lowest (α = 0), the top five evaluation criteria are SC5, SC8, SC3, SC6, and SC1. They steadily develop until α = 0.7 and the importance changes. However, when α = 1, they no longer have the highest orders of importance; rather, they have middle orders of importance and an ectopic situation with the criterion originally ranked in the middle. The results showed that, unless there is a major investment risk (such as war or financial crisis), the results of the importance ranking of criteria will be stable in the future investment environment, which is also consistent with the results of α = 0.5 and β = 0.5.
As shown in Figure 9, when α = 0.5 and β = 0 to 1, the risk of the future investment environment will be minor (which means that the future environment will be stable). We were able to simulate and analyze the decision preference of decision makers from large to small by β = 0 to 1. The results presented here are very similar to those analyzed in Figure 9, which shows that in the future investment environment, regardless of the preference of decision makers, the importance order of criteria will only change if they are extremely pessimistic, which is also consistent with the results of α = 0.5 and β = 0.5.

4.4.2. Sensitivity Analysis of Investment Plan

As shown in Figure 10, when β = 0.5 and α = 0 to 1 (that is, the decision preference of decision maker for the future investment environment is mild regardless of the risk of the future investment environment (α = 0 to 1)), the ranking result of the three investment strategies remained stable. The ordering result was found to be self-purchasing strategy (A1) > rental strategy (A3) > exchange strategy (A2); this is consistent with the results of α = 0.5 and β = 0.5.
As shown in Figure 11, when α = 0.5 and β = 0 to 1 (that is, the future environment will be stable), regardless of whether the preference of decision makers is pessimistic or optimistic (β = 0 to 1), the ordering results of the three investment strategies was found to be self-purchasing strategy (A1) > rental strategy (A3) > exchange strategy (A2). This result was stable. However, when β = 0.9, strategies 1 and 3 changed in order, but this result was consistent with the selected strategy (i.e., the strategy based on self-purchased pallets, phased procurement, and leasing strategy), which is also consistent with the results of α = 0.5 and β = 0.5.

4.4.3. Comparison of Results between FANP and ANP Investment Schemes

As shown in Table 9, based on the above-mentioned analysis results, when the future environment has been decided to be stable and decision makers have a very pessimistic attitude (α = 0.5 and β = 1), the ranking results of the FANP and the ANP were found to be consistent. The results showed that if the decision maker has a very pessimistic attitude, rental strategy (A3) may be a relatively stable investment strategy for the enterprise, though it may cause the loss of the competitiveness of the enterprise.
To confirm the application value of the FANP, unpredictable uncertainties and risks were simulated and analyzed in this study. The results mostly confirmed the predicted results of the FANP (α and β = 0.5) paired with other groups, i.e., self-purchasing strategy (A1) > exchange strategy (A2) > rental strategy (A3). The final result was found to be suitable for the future development of the enterprise.

5. Conclusions and Suggestions

On the basis of focus groups and the FANP, the authors of this paper have proposed an evaluation model and method for a resource integration strategy for the chain supermarket supply system; these can help resolve major decisions regarding pallet resource sharing investment in the supply chain system. In addition, following the analysis and verification of the investment strategy of pallets, our research results proved the availability of the proposed model. The authors of this paper hope that the proposed method can provide a reference for the decision makers of the chain supermarket industry or related industries and a new idea for the construction of a supply chain system or logistics center. Based on our results, we propose the following specific suggestions for decision makers and researchers.
(1)
Suggestions for decision makers in the practical field.
The authors of this study constructed a system of evaluation criteria (indicators) and suggest that the decision makers of chain supermarket logistics systems or related industries can adopt this evaluation system for their investment projects. It is worth mentioning that the operation efficiency of enterprise logistics has a great dependence on the rapid circulation of goods, and investment automation and mechanization are the main directions for the strategic layouts of enterprise logistics. Since logistics facilities are relatively specific service objects and have high operational efficiencies, the development of modern logistics has focused on improving efficiency, reducing costs, and bettering services in transportation, storage, and other related fields. Therefore, it is suggested that enterprises should actively integrate and apply cross-industry and cross-enterprises to promote the comprehensive utilization of facilities when carrying out functional transformation development. Additionally, the authors of this paper also prioritize the importance of the evaluation criteria, and the decision makers of chain supermarket systems or related industries could formulate specific development strategies according to respective importance.
(2)
Suggestions for academic researchers.
The authors of this paper constructed a system of evaluation criteria (indicators) and suggest that future research can evaluate the same problem in different industries. In addition, in terms of the application of the FANP, the authors of this paper simulated different investment environments and decision preferences, and they verified the practicality and effectiveness of the FANP in group decision making. However, the authors of this study did not adopt other methods (such as MCDM, FMCDM, or linear programming methods) for analysis. It is recommended that information be collected when available; future research can focus on specific criteria or indicators of quantitative criteria weights or use a different optimization method for analysis and comparison. For instance, if quantitative data can be obtained, researchers should compare quantitative analysis with a combination of qualitative and quantitative methods to verify the objective results of these different methods in the same environment.

Author Contributions

Conceptualization, H.-L.L. and C.-T.L.; Formal analysis, H.-L.L.; Methodology, H.-L.L. and C.-T.L.; Project administration, H.-L.L. and Y.-Y.M.; Writing—review & editing, Y.-Y.M. All authors have read and agreed to the published version of the manuscript.

Funding

The authors gratefully acknowledge the financial support from the Education Department of Fujian Province, China [grant number JAS21309] and Sanming University [grant numbers A202104, 19YG06S].

Institutional Review Board Statement

Not applicable.

Informed Consent Statement

Not applicable.

Data Availability Statement

Not applicable.

Conflicts of Interest

The authors declare no conflict of interest.

References

  1. China Industrial Research Institute. Report of Market Survey and Future Trend of Chinese Supermarket; China Industrial Research Institute: Beijing, China, 2021. [Google Scholar]
  2. Lin, H.L.; Cho, C.C.; Ma, Y.Y.; Hu, Y.Q.; Yang, Z.H. Optimization plan for excess warehouse storage in e-commerce–based plant shops: A case study for Chinese plant industrial. J. Bus. Econ. Manag. 2019, 20, 897–919. [Google Scholar] [CrossRef] [Green Version]
  3. Yavas, V.; Ozkan-Ozen, Y.D. Logistics centers in the new industrial era: A proposed framework for logistics center 4.0. Transp. Res. Part. E Logist. Transp. Rev. 2020, 135, 101864. [Google Scholar] [CrossRef]
  4. Pham, T.Y.; Ma, H.M.; Yeo, G.T. Application of Fuzzy Delphi TOPSIS to locate logistics centers in Vietnam: The Logisticians’ perspective. Asian J. Shipp. Logist. 2017, 33, 211–219. [Google Scholar] [CrossRef]
  5. Lin, H.L.; Ma, Y.Y. A new method of storage management based on ABC classification: A case study in Chinese supermarkets’ distribution center. SAGE Open 2021, 11, 21582440211023193. [Google Scholar] [CrossRef]
  6. Tan, Z.; Li, H.; He, X. Optimizing parcel sorting process of vertical sorting system in e-commerce warehouse. Adv. Eng. Inform. 2021, 48, 101279. [Google Scholar] [CrossRef]
  7. Tarapata, Z.; Nowicki, T.; Antkiewicz, R.; Dudzinski, J.; Janik, K. Data-driven machine learning system for optimization of processes supporting the distribution of goods and services—A case study. Procedia Manuf. 2020, 44, 60–67. [Google Scholar] [CrossRef]
  8. Sherif, S.U.; Asokan, P.; Sasikumar, P.; Mathiyazhagan, K.; Jerald, J. Integrated optimization of transportation, inventory and vehicle routing with simultaneous pickup and delivery in two-echelon green supply chain network. J. Clean. Prod. 2021, 287, 125434. [Google Scholar] [CrossRef]
  9. Mandal, J.; Goswami, A.; Wang, J.; Tiwari, M.K. Optimization of vehicle speed for batches to minimize supply chain cost under uncertain demand. Inf. Sci. 2020, 515, 26–43. [Google Scholar] [CrossRef]
  10. Al Theeb, N.; Smadi, H.J.; Al-Hawari, T.H.; Aljarrah, M.H. Optimization of vehicle routing with inventory allocation problems in Cold Supply Chain Logistics. Comput. Ind. Eng. 2020, 142, 106341. [Google Scholar] [CrossRef]
  11. Lin, H.L.; Cho, C.C. An ideal model for a merger and acquisition strategy in the information technology industry: A case study for investment in the Taiwanese industrial personal computer sector. J. Test. Eval. 2020, 48, 775–794. [Google Scholar] [CrossRef]
  12. Mubarik, M.S.; Kazmi, S.H.A.; Zaman, S.I. Application of gray DEMATEL-ANP in green-strategic sourcing. Technol. Soc. 2021, 64, 101524. [Google Scholar] [CrossRef]
  13. Wan, X.; Liu, X.; Du, Z.; Du, Y. A novel model used for assessing supply chain sustainability integrating the ANP and ER approaches and its application in marine ranching. J. Clean. Prod. 2021, 279, 123500. [Google Scholar] [CrossRef]
  14. Lu, M.T.; Tsai, J.F.; Shen, S.P.; Lin, M.H.; Hu, Y.C. Estimating sustainable development performance in the electrical wire and cable industry: Applying the integrated fuzzy MADM approach. J. Clean. Prod. 2020, 277, 122440. [Google Scholar] [CrossRef]
  15. Eskandari, D.; Gharabagh, M.J.; Barkhordari, A.; Gharari, N.; Panahi, D.; Gholami, A.; Teimori-Boghsani, G. Development of a scale for assessing the organization’s safety performance based fuzzy ANP. J. Loss Prev. Process. Ind. 2021, 69, 104342. [Google Scholar] [CrossRef]
  16. Mistarihi, M.Z.; Okour, R.A.; Mumani, A.A. An integration of a QFD model with Fuzzy-ANP approach for determining the importance weights for engineering characteristics of the proposed wheelchair design. Appl. Soft Comput. 2020, 90, 106136. [Google Scholar] [CrossRef]
  17. Nilashi, M.; Ahmadi, H.; Ahani, A.; Ravangard, R.; bin Ibrahim, O. Determining the importance of hospital information system adoption factors using fuzzy analytic network process (ANP). Technol. Forecast. Soc. Chang. 2016, 111, 244–264. [Google Scholar] [CrossRef]
  18. Merton, R.K. The Focused Interview: A Manual of Problems and Procedures; Free Press: Hong Kong, China, 1956. [Google Scholar]
  19. Stewart, D.S.; Shamdasani, P.N. Focus Group Interviews in Education and Psychology; SAGE Publications: Thousand Oaks, CA, UAS, 1990. [Google Scholar]
  20. Mokarrari, K.R.; Torabi, S.A. Ranking cities based on their smartness level using MADM methods. Sustain. Cities Soc. 2021, 72, 103030. [Google Scholar] [CrossRef]
  21. Yazdi, A.K.; Komijan, A.R.; Wanke, P.F.; Sardar, S. Oil project selection in Iran: A hybrid MADM approach in an uncertain environment. Appl. Soft Comput. 2020, 88, 106066. [Google Scholar] [CrossRef]
  22. Lin, H.L.; Lin, C.T. Establishing a combined forecasting model: A case study on the logistic demand of Nanjing’s green tea industry in China. Technol. Econ. Dev. Econ. 2021, 27, 71–95. [Google Scholar] [CrossRef]
  23. Saaty, T.L. The Analytic Hierarchy Process; McGraw-Hill Publications: New York, NY, USA, 1980. [Google Scholar]
  24. Saaty, T.L. Decision Making with Dependence and Feedback: The Analytic Network Process; RWS Publications: Pittsburgh, PA, USA, 1996. [Google Scholar]
  25. Chukwuma, E.C.; Okonkwo, C.C.; Ojediran, J.O.; Anizoba, D.C.; Ubah, J.I.; Nwachukwu, C.P. A GIS based flood vulnerability modelling of Anambra State using an integrated IVFRN-DEMATEL-ANP model. Heliyon 2021, 7, e08048. [Google Scholar] [CrossRef]
  26. Rao, S.H. A hybrid MCDM model based on DEMATEL and ANP for improving the measurement of corporate sustainability indicators: A study of Taiwan high speed rail. Res. Transp. Bus. Manag. 2021, 41, 100657. [Google Scholar] [CrossRef]
  27. Nasouri, M.; Bidhendi, G.N.; Hoveidi, H.; Amiri, M.J. Parametric study and performance-based multi-criteria optimization of the indirect-expansion solar-assisted heat pump through the integration of Analytic Network process (ANP) decision-making with MOPSO algorithm. Sol. Energy 2021, 225, 814–830. [Google Scholar] [CrossRef]
  28. Vyas, V.; Uma, V.; Ravi, K. Aspect-based approach to measure performance of financial services using voice of customer. J. King Saud Univ. Comput. Inf. Sci. 2019, in press. [Google Scholar] [CrossRef]
  29. Demirel, H.; Şener, B.; Yildiz, B.; Balin, A. A real case study on the selection of suitable roll stabilizer type for motor yachts using hybrid fuzzy AHP and VIKOR methodology. Ocean. Eng. 2020, 217, 108125. [Google Scholar] [CrossRef]
  30. Lin, J.K.; Lin, H.L.; Wang, W.Y.C.; Chang, C.H.; Lin, C.T. An evaluation model for property-purchasing plans based on a hybrid multi-criteria decision-making model. Mathematics 2020, 8, 860. [Google Scholar] [CrossRef]
  31. Chang, C.W.; Horng, D.J.; Lin, H.L. A measurement model for experts knowledge-based systems algorithm using fuzzy analytic network process. Expert Syst. Appl. 2011, 38, 12009–12017. [Google Scholar] [CrossRef]
  32. Ngan, S.L.; How, B.S.; Teng, S.Y.; Promentilla, M.A.B.; Yatim, P.; Er, A.C.; Lam, H.L. Prioritization of sustainability indicators for promoting the circular economy: The case of developing countries. Renew. Sustain. Energy Rev. 2019, 111, 314–331. [Google Scholar] [CrossRef] [Green Version]
  33. Li, C.; Negnevitsky, M.; Wang, X. Prospective assessment of methanol vehicles in China using FANP-SWOT analysis. Transp. Policy 2020, 96, 60–75. [Google Scholar] [CrossRef]
  34. Aghasafari, H.; Karbasi, A.; Mohammadi, H.; Calisti, R. Determination of the best strategies for development of organic farming: A SWOT–Fuzzy Analytic Network Process approach. J. Clean. Prod. 2020, 277, 124039. [Google Scholar] [CrossRef]
  35. Ahmadi, S.H.R.; Noorollahi, Y.; Ghanbari, S.; Ebrahimi, M.; Hosseini, H.; Foroozani, A.; Hajinezhad, A. Hybrid fuzzy decision making approach for wind-powered pumped storage power plant site selection: A case study. Sustain. Energy Technol. Assess. 2020, 42, 100838. [Google Scholar] [CrossRef]
  36. Wu, Y.; Tao, Y.; Zhang, B.; Wang, S.; Xu, C.; Zhou, J. A decision framework of offshore wind power station site selection using a PROMETHEE method under intuitionistic fuzzy environment: A case in China. Ocean. Coast. Manag. 2020, 184, 105016. [Google Scholar] [CrossRef]
  37. Feyzi, S.; Khanmohammadi, M.; Abedinzadeh, N.; Aalipour, M. Multi-criteria decision analysis FANP based on GIS for siting municipal solid waste incineration power plant in the north of Iran. Sustain. Cities Soc. 2019, 47, 101513. [Google Scholar] [CrossRef]
  38. Zadeh, L. Fuzzy sets. Inf. Control 1965, 8, 338–353. [Google Scholar] [CrossRef] [Green Version]
  39. Buckley, J.J. Fuzzy hierarchical analysis. Fuzzy Sets Syst. 1985, 17, 233–247. [Google Scholar] [CrossRef]
  40. Van Laarhoven, P.J.; Pedrycz, W. A fuzzy extension of Saaty’s priority theory. Fuzzy Sets Syst. 1983, 11, 229–241. [Google Scholar] [CrossRef]
Figure 1. Research framework.
Mathematics 09 03210 g001
Figure 2. Triangular fuzzy number (TFN).
Mathematics 09 03210 g002
Figure 3. Status of the operation process.
Mathematics 09 03210 g003
Figure 4. The relationship of mutual influence among evaluation criteria.
Mathematics 09 03210 g004
Figure 5. The internal dependency of the sub-criterion layer.
Mathematics 09 03210 g005
Figure 6. The FANP evaluation decision model.
Mathematics 09 03210 g006
Figure 7. The limit supermatrix is displayed as: (a) description of the alternatives; (b) description of the sub-criteria.
Mathematics 09 03210 g007
Figure 8. Simulation of the sub-criteria (when β = 0.5 and α = 0 to 1).
Mathematics 09 03210 g008
Figure 9. Simulation of the sub-criteria (when α = 0.5 and β = 0 to 1).
Mathematics 09 03210 g009
Figure 10. Simulation of the investment plan (when β = 0.5 and α = 0 to 1).
Mathematics 09 03210 g010
Figure 11. Simulation of the investment plan (when α = 0.5 and β = 0 to 1).
Mathematics 09 03210 g011
Table 1. Definitions of evaluation criteria and scheme.
CriteriaSub-CriteriaDefinition
Costs (C1)The total cost (SC1)The cost of purchasing pallets (which is determined by the number of pallets purchased)
Maintenance costs (SC2)The maintenance costs of pallets
Operating costs (SC3)Management costs generated by the operation of pallets
Efficiency (C2)Pallet surface utilization rate (SC4)The proportion of the bottom area of the packing goods stacked at the bottom of the pallet
Operational efficiency (SC5)The volume of business completed per unit of time under working condition
Pallet cargo capacity (SC6)The quantity of goods carried on pallets under standard loading conditions
Loading efficiency of transport vehicle (SC7)The maximum load and weight of a vehicle that can be loaded at one time
Financing (C3)Investment return rate (SC8)Ratio of total net income to total investment
Enterprise development expectation evaluation (SC9)Logistics market share increase rate and operating profit growth
Return on total assets (SC10)Return on assets equals to net profit after tax divided by total assets; this is used to measure the net profit per unit of assets
Flow(C4)Vehicle-carrying volume (SC11)Maximum cargo mass that a vehicle can carry under certain loading conditions
Pallet flow in the supply chain (SC12)The smoothness of the transfer and circulation of pallets in the supply chain
Warehouse channel flow (SC13)Accessibility of pallet flow in warehouse and distribution center
Warehouse handling equipment compatibility (SC14)Compatibility of pallets with handling and storage equipment
AlternativeDefinition
Self-purchasing strategy (A1)Investment by the enterprise itself but with a higher cost
Exchange strategy (A2)In the supply chain system, when goods are transferred from suppliers, manufacturers, logistics centers, wholesalers, retail stores, and other goods circulation recipients; pallets of the same specifications are used; and the same quantity is exchanged between roles
Rental strategy (A3)The pallet rent system is operated by a franchise that has a large quantity of pallets to meet the needs of its target customers. At the same time, offices can be set up in various places to be responsible for the marketing, supply, recycling, and maintenance of pallets
Table 2. Fuzzy pair-wise comparison matrix for W21.
C1C2C3C4
C11, 1, 10.111, 0.266, 23, 3.693, 70.250, 0.814, 2
C2---1, 1, 12, 4.018, 80.330, 0.685, 3
C3------1, 1, 10.200, 0.345, 0.500
C4---------1, 1, 1
Table 3. Pair-wise comparison matrices and eigenvectors for W21.
C1C2C3C4Eigenvectors
C11.000 0.661 4.347 0.970 0.281
C21.513 1.000 4.509 1.175 0.366
C30.230 0.222 1.000 0.348 0.079
C41.031 0.851 2.877 1.000 0.274
Table 4. Fuzzy pair-wise comparison matrix and eigenvectors (α and β = 0.5) for W32.
C1SC1SC2SC3Eigenvectors
SC11, 1, 13, 7.380, 80.500, 2.416, 50.648
SC2---1, 1, 10.167, 0.2230.101
SC3------1, 1, 10.251
C2SC4SC5SC6SC7Eigenvectors
SC41, 1, 10.111, 0.185, 0.3330.500, 0.392, 50.250, 0.470, 0.50.122
SC5---1, 1, 14, 6.580, 90.125, 2.591, 30.573
SC6------1, 1, 12, 3.928, 50.156
SC7---------1, 1, 10.149
C3SC8SC9SC10Eigenvectors
SC81, 1, 12, 7.120, 80.5, 2.868, 40.642
SC9---1, 1, 10.500, 0.414, 0.3330.106
SC10------1, 1, 10.252
C4SC11SC12SC13SC14Eigenvectors
SC111, 1, 13, 6.160, 70.125, 2.091, 40.143, 4.835, 50.266
SC12---1, 1, 10.111, 0.172, 10.111, 0.114, 0.1670.053
SC13------1, 1, 10.111, 0.136, 0.2500.118
SC14---------1, 1, 10.563
Table 5. Eigenvectors for W43.
Sub-CriteriaSC1SC2SC3SC4SC5SC6SC7
Alternatives
A10.1920.2510.6330.6430.1050.2420.267
A20.0910.1010.1020.2530.6110.1130.651
A30.7170.6480.2650.1040.2840.6450.082
AlternativesSC8SC9SC10SC11SC12SC13SC14
Sub-Criteria
A10.7220.7160.5760.6070.2950.2740.473
A20.1920.1070.2730.2810.0790.6300.228
A30.0860.1770.1510.1120.6260.0960.299
Table 6. Fuzzy aggregate pair-wise comparison matrices and eigenvectors (α and β = 0.5) for W22.
Cost (C1)C1C2C3C4Eigenvectors
C11, 1, 10.111, 0.124, 0.3000.111, 0.366, 0.5000.125, 0.212. 0.2500.568
C2---1, 1, 13, 4.460, 81, 3.420, 40.114
C3------1, 1, 10.143, 0.354, 0.5000.051
C4---------1, 1, 10.267
Efficiency (C2)C1C2C3C4Eigenvectors
C1 1, 1, 1 0.500, 6.010, 7 0.143, 0.352, 0.500 0.143, 3.208, 6 0.055
C2---1, 1, 10.125, 0.163, 0.3330.111, 0.318, 0.5000.564
C3------1, 1, 11, 5.420, 80.118
C4---------1, 1, 10.263
Financing (C3)C1C2C3C4Eigenvectors
C11, 1, 10.500, 6.010, 70.143, 0.352, 0.5000.143, 3.208, 60.276
C2---1, 1, 10.125, 0.163, 0.3330.111, 0.318, 0.5000.061
C3------1, 1, 11, 5.420, 80.539
C4---------1, 1, 10.124
Flow (C4)C1C2C3C4Eigenvectors
C11, 1, 10.111, 0.170, 0.3330.167, 0.288, 0.5000.111, 0.124, 0.2000.276
C2---1, 1, 11, 3.440, 50.111, 0.366, 0.5000.061
C3------1, 1, 10.125, 0.221, 0.2500.539
C4---------1, 1, 10.124
Table 7. Eigenvectors for W43.
Sub-CriteriaSC1SC2SC3SC4SC5SC6SC7
Alternatives
A10.1920.2510.633 0.643 0.105 0.242 0.267
A20.0910.1010.102 0.253 0.611 0.113 0.651
A30.7170.6480.265 0.104 0.284 0.645 0.082
Sub-CriteriaSC8SC9SC10SC11SC12SC13SC14
Alternatives
A10.7220.716 0.576 0.607 0.295 0.274 0.473
A20.1920.107 0.273 0.281 0.079 0.630 0.228
A30.0860.177 0.151 0.112 0.626 0.096 0.299
Table 8. The supermatrix.
GOALC1C2C3C4SC1SC2SC3SC4SC5SC6SC7SC8SC9SC10SC11SC12SC13SC14A1A2A3
GOAL1.0000.000 0.000 0.000 0.000 0.000 0.000 0.000 0.000 0.000 0.000 0.000 0.000 0.000 0.000 0.000 0.000 0.000 0.000 0.000 0.000 0.000
C10.281 0.568 0.055 0.276 0.276 0.000 0.000 0.000 0.000 0.000 0.000 0.000 0.000 0.000 0.000 0.000 0.000 0.000 0.000 0.000 0.000 0.000
C20.3660.114 0.564 0.061 0.061 0.000 0.000 0.000 0.000 0.000 0.000 0.000 0.000 0.000 0.000 0.000 0.000 0.000 0.000 0.000 0.000 0.000
C30.079 0.051 0.118 0.539 0.539 0.000 0.000 0.000 0.000 0.000 0.000 0.000 0.000 0.000 0.000 0.000 0.000 0.000 0.000 0.000 0.000 0.000
C40.2740.267 0.263 0.124 0.124 0.000 0.000 0.000 0.000 0.000 0.000 0.000 0.000 0.000 0.000 0.000 0.000 0.000 0.000 0.000 0.000 0.000
SC10.648 0.000 0.000 0.000 0.648 0.364 0.259 0.418 0.000 0.000 0.000 0.000 0.000 0.000 0.000 0.000 0.000 0.000 0.000 0.000 0.000 0.000
SC20.101 0.000 0.000 0.000 0.101 0.116 0.342 0.000 0.000 0.000 0.080 0.000 0.000 0.358 0.000 0.000 0.000 0.000 0.000 0.000 0.000 0.000
SC30.251 0.000 0.000 0.000 0.251 0.195 0.139 0.327 0.000 0.000 0.000 0.000 0.000 0.000 0.463 0.000 0.048 0.050 0.358 0.000 0.000 0.000
SC40.000 0.122 0.000 0.000 0.000 0.000 0.000 0.000 0.531 0.000 0.268 0.000 0.000 0.000 0.000 0.145 0.000 0.000 0.000 0.000 0.000 0.000
SC50.000 0.573 0.000 0.000 0.000 0.106 0.000 0.097 0.068 0.417 0.000 0.118 0.000 0.353 0.295 0.000 0.095 0.095 0.000 0.000 0.000 0.000
SC60.000 0.156 0.000 0.000 0.000 0.000 0.119 0.000 0.000 0.000 0.522 0.000 0.000 0.000 0.000 0.289 0.000 0.000 0.000 0.000 0.000 0.000
SC70.000 0.149 0.000 0.000 0.000 0.000 0.000 0.000 0.277 0.000 0.000 0.613 0.000 0.000 0.000 0.077 0.000 0.000 0.000 0.000 0.000 0.000
SC80.000 0.000 0.642 0.000 0.000 0.053 0.060 0.000 0.000 0.311 0.000 0.000 0.365 0.000 0.000 0.000 0.000 0.000 0.343 0.000 0.000 0.000
SC90.000 0.000 0.106 0.000 0.000 0.088 0.033 0.000 0.000 0.000 0.000 0.000 0.295 0.113 0.000 0.000 0.000 0.000 0.000 0.000 0.000 0.000
SC100.000 0.000 0.252 0.000 0.000 0.078 0.048 0.158 0.000 0.000 0.000 0.000 0.119 0.176 0.108 0.000 0.000 0.000 0.000 0.000 0.000 0.000
SC110.000 0.000 0.000 0.266 0.000 0.000 0.000 0.000 0.124 0.000 0.130 0.269 0.000 0.000 0.000 0.489 0.000 0.000 0.000 0.000 0.000 0.000
SC120.000 0.000 0.000 0.053 0.000 0.000 0.000 0.000 0.000 0.111 0.000 0.000 0.000 0.000 0.000 0.000 0.168 0.163 0.000 0.000 0.000 0.000
SC130.000 0.000 0.000 0.118 0.000 0.000 0.000 0.000 0.000 0.000 0.000 0.000 0.000 0.000 0.000 0.000 0.366 0.403 0.112 0.000 0.000 0.000
SC140.000 0.000 0.000 0.563 0.000 0.000 0.000 0.000 0.000 0.161 0.000 0.000 0.221 0.000 0.134 0.000 0.323 0.289 0.187 0.000 0.000 0.000
A10.000 0.000 0.000 0.000 0.000 0.192 0.251 0.633 0.643 0.105 0.242 0.267 0.722 0.716 0.576 0.607 0.295 0.274 0.473 1.0000.0000.000
A20.000 0.000 0.000 0.000 0.000 0.091 0.101 0.102 0.253 0.611 0.113 0.651 0.192 0.107 0.273 0.281 0.079 0.630 0.228 0.0001.0000.000
A30.000 0.000 0.000 0.000 0.000 0.717 0.648 0.265 0.104 0.284 0.645 0.082 0.086 0.177 0.151 0.112 0.626 0.096 0.299 0.0000.000 1.000
Table 9. The comparison of the FANP and the ANP.
FANP (α and β = 0.5)ANPFANP (α = 0.5, β = 1)
Self-purchasing strategy (A1)0.414 (1)0.300 (2)0.315 (2)
Exchange strategy (A2)0.264 (3)0.295 (3)0.281 (3)
Rental strategy (A3)0.322 (2)0.403 (1)0.404 (1)
Publisher’s Note: MDPI stays neutral with regard to jurisdictional claims in published maps and institutional affiliations.

