Article

Statistical Inference of Left Truncated and Right Censored Data from Marshall–Olkin Bivariate Rayleigh Distribution

1
School of Mathematics, Yunnan Normal University, Kunming 650500, China
2
School of Mathematics and Statistics, Xidian University, Xi’an 710071, China
3
Department of Administrative Sciences, Université du Québec en Outaouais, Gatineau, QC J9A 1L8, Canada
4
Department of Mathematical Sciences, University of South Dakota, Vermillion, SD 57069, USA
*
Author to whom correspondence should be addressed.
Mathematics 2021, 9(21), 2703; https://doi.org/10.3390/math9212703
Submission received: 27 September 2021 / Revised: 19 October 2021 / Accepted: 22 October 2021 / Published: 25 October 2021
(This article belongs to the Special Issue Statistical Simulation and Computation II)

Abstract

:
In this paper, statistical inference and prediction issue of left truncated and right censored dependent competing risk data are studied. When the latent lifetime is distributed by Marshall–Olkin bivariate Rayleigh distribution, the maximum likelihood estimates of unknown parameters are established, and corresponding approximate confidence intervals are also constructed by using a Fisher information matrix and asymptotic approximate theory. Furthermore, Bayesian estimates and associated high posterior density credible intervals of unknown parameters are provided based on general flexible priors. In addition, when there is an order restriction between unknown parameters, the point and interval estimates based on classical and Bayesian frameworks are discussed too. Besides, the prediction issue of a censored sample is addressed based on both likelihood and Bayesian methods. Finally, extensive simulation studies are conducted to investigate the performance of the proposed methods, and two real-life examples are presented for illustration purposes.

1. Introduction

In lifetime data analysis, due to the complex internal structure and external environment, units frequently fail for a variety of causes, such failure causes are called competing risks in the literature and compete with each other in the whole life cycle. In standard sketches, the observed competing risks data of each unit is the earliest occurrence among all the causes, and the data includes the lifetime as well as the cause indicator. Under conventional studies, discussions for the competing risks model are usually made based on the assumption that all causes of failure are independent for the purpose of simplicity and concision. Such independent based competing risks models have been discussed by many authors, for example, some works of Mao and Shi [1], Varghese and Vaidyanathan [2], Davies and Volterman [3], Lodhi et al. [4], and Ren and Gui [5]. For more details, one can refer to the monographs by Crowder [6] for review. However, according to the actual operating mechanism of living products, the assumption of independence is often untenable in practice. For example, in the study of colon cancer, the factors of failure are cancer recurrence or death, and Lin et al. [7] mentioned that these two factors are dependent. For a plane with four engines, if one of the engines breaks down, the other engines will bear more pressure and have a greater possibility of failure. Thus, the plane has a higher risk of breaking down. It can be found that as the causes of plane failure, these engines are positively dependent. In addition, the dependent competing risks also exist in the diabetic retinopathy study that was carried out by the National Eye Institute. This study aimed to discuss the effect of laser treatment in delaying the onset of blindness in patients with diabetic retinopathy. For each patient in this study, one eye was chosen for laser treatment and the other was not. The final observed data includes the minimum time to blindness and indicator pointing the treated or other eye failed first. Besides, the study also recorded the associated data on simultaneous blindness of both eyes. Obviously, there is some connection between the lifetimes of two eyes for each patient in this situation. Hence, it is more appropriate to utilize a dependent competing risks model to describe the relationship between all failure causes. In general, the dependent competing risks model could be used to provide more accurate inferential results than the independent one. When two dependent failure causes of an individual exist, the Marshall–Olkin bivariate type model may provide better fitting for dependent competing risk data. In literature, the Marshall–Olkin bivariate exponential (MOBE) distribution was firstly proposed by Marshall and Olkin [8] due to its nice distributional properties and concise form, and some other Marshall–Olkin bivariate type distributions have also been further extended and studied by many authors. For instance, Feizjavdian and Hashemi [9] investigated Diabetic retinopathy data by using Marshall–Olkin bivariate Weibull distribution (MOBW). Bayesian analysis of dependent competing risks model utilizing Marshall–Olkin bivariate Pareto (MOBP) distribution was considered by Paul et al. [10]. Shen and Xu [11] studied the parameter estimation of MOBW distribution based on different methods. Wang et al. [12] considered the statistical inference of the dependent competing risks model by using the MOBW distribution.
Observations collected in practice often appear as censored data and/or truncated data due to complex practical limitations. When both truncation and censoring phenomenon occur, such observations are called truncated and censored data in literature, and the left truncated and right censored (LTRC) data is one of the most important characteristics among them. This type of data is very common in many application fields such as economics, medicine, engineering, biology, among others. For left truncation, it means that only after a certain time point, the failure of a product occurs and is observed; whereas right censoring means that a product fails after a certain time point, but its specific failure time cannot be observed. In recent years, the inferential studies for LTRC data has been discussed by many researchers (e.g., Shen [13], Zhao et al. [14] and Ranjan et al. [15]). Especially, there is successful application of LTRC data from the real-life example introduced by Hong et al. [16], where the mentioned data set is about the lifetimes of approximately 150,000 high-voltage power transformers in the electrical industry of the US. These power transformers were installed at different time points, and their working status began to be recorded after 1980 but the recording work stopped after 2008. Obviously, the power transformers data could be viewed as LTRC data. If a power transformer was installed before 1980 and failed afore 1980, then its information would be unobserved. If it was installed before 1980 but failed after 1980, then its information could be available and it was regarded as left truncated data. Further, if a transformer failed after 2008 and the real failure time could not be obtained, then it would be recorded as right censored data. Therefore, due to its widely applications in practice, analysis work for LTRC data has been extensively discussed by many authors. For example, Emura and Shiu [17] studied the estimation of unknown parameters and model selection for LTRC data. Jiang et al. [18] developed a nonparametric likelihood-based estimation procedure by using B-splines. Kundu et al. [19] provided the Bayesian inference for the unknown parameters of MOBW distribution when LTRC competing risk model is available with independent causes.
Motivated by the reasons mentioned above and due to the simplicity and practicability of the Marshall–Olkin type bivariate distribution, this paper aims to discuss the statistical inference for LTRC data with dependent competing risks. When the dependent causes of failure is modeled by Marshall–Olkin Rayleigh (MOBR) distribution, various estimators are provided for unknown model parameters from classical and Bayesian perspectives, and extensive simulation studies and real life examples are carried out to compare the performance of different methods.In addition, for the sake of clarity, the main motivations and contributions of our paper could be presented as follows. Firstly, although there are many inferential works along with LTRC data, studies for LTRC data with multiple causes of failure is rare in existing literatures. One of main applicability of the proposed approaches is that our paper takes the competing risks into account for LTRC data which sometimes seems more meaningful and proper for practical situations. Secondly, due to complex internal and external operating mechanism of components, dependent failure causes are more appropriate to model the cross correlation between different causes of failure. Thus, the later proposed dependent lifetime distribution may feature appealing fitting performance for various competing risks. Finally, from practical perspective, competing risks are mostly positively dependent due to the phenomenon that one cause’s survival would increase the chance of another cause’s survival in many applicative situations. Therefore, multivariate statistical models having positive dependence will provide proper fitting performance in analysis. In this paper, a Marshall–Olkin type bivariate model is used for LTRC competing risks data. To the best of our acknowledge, this problem has not been discussed before in literature.
The rest of this paper is organized as follows. Model description, some notations, and prior information are presented in Section 2. When there is no order restriction among parameters, classical and Bayesian estimations are discussed in Section 3 and Section 4, respectively. In Section 5, both classical and Bayesian inferences are presented under parameter restriction situation. The prediction issue for right censored sample is addressed in Section 6. In Section 7, simulation studies are conducted and two real life examples are analyzed for illustration. Finally, some concluding remarks are given in Section 8.

2. Model Description and Priors

2.1. Marshall–Olkin Bivariate Rayleigh Distribution

Let X i , i = 1 , 2 , 3 be independent random variables that follow the Rayleigh distributions with parameters σ i > 0 , i = 1 , 2 , 3 , respectively. The aforementioned Rayleigh distributions with parameters σ i > 0 , i = 1 , 2 , 3 , are respectively labeled by Rayleigh ( σ i ) , i = 1 , 2 , 3 and have the associated probability density function (PDF) and cumulative distribution function (CDF) can be expressed respectively as
f ( x ; σ i ) = x σ i e x 2 2 σ i and F ( x ; σ i ) = 1 e x 2 2 σ i , σ i > 0 , x > 0 .
Correspondingly, the associated Survival function (SF) can be written as
S ( x ; σ i ) = e x 2 2 σ i , σ i > 0 , x > 0 .
Let T 1 = min ( X 1 , X 3 ) and T 2 = min ( X 2 , X 3 ) , then the random vector ( T 1 , T 2 ) is said to follow MOBR distribution with parameters σ 1 , σ 2 and σ 3 , denoted as ( T 1 , T 2 ) MOBR ( σ 1 , σ 2 , σ 3 ) . Further, the joint SF of ( T 1 , T 2 ) can be presented as
S T 1 , T 2 ( t 1 , t 2 ) = S ( t 1 ; σ 1 ) S ( t 2 ; σ 2 + σ 3 ) , t 1 < t 2 S ( t 1 ; σ 1 + σ 3 ) S ( t 2 ; σ 2 ) , t 1 > t 2 S ( t ; σ 123 ) , t 1 = t 2 = t ,
whereas the associated joint PDF of ( T 1 , T 2 ) is given by
f T 1 , T 2 ( t 1 , t 2 ) = f ( t 1 ; σ 1 ) f ( t 2 ; σ 2 + σ 3 ) , t 1 < t 2 f ( t 1 ; σ 1 + σ 3 ) f ( t 2 ; σ 2 ) , t 1 > t 2 σ 3 σ 123 f ( t ; σ 123 ) , t 1 = t 2 = t
with σ 123 = σ 1 + σ 2 + σ 3 .
Moreover, T 1 and T 2 follow Rayleigh distributions with parameters σ 1 + σ 3 and σ 2 + σ 3 , respectively, and T = min ( T 1 , T 2 ) follows the Rayleigh distribution with parameter σ 1 + σ 2 + σ 3 . Further, when σ 3 = 0 , one could note from the joint SF that the random variables T 1 and T 2 are statistically independent. Hence, σ 3 can be regarded as the dependence structure between T 1 and T 2 .

2.2. Notation

Suppose a lifetime testing experiment with n N identical units. For each experimental unit, let T be the lifetime of the unit, and there is a left truncated time point τ L and a pre-determined right censored point τ R ( > τ L ) for T. In testing, every unit can be placed before or after τ L , whereas it can fail before or after τ R . In our studies, if one unit was put on the test before τ L , and failed before τ L , then it is discarded. The information can be recorded only if the unit fails after τ L or is censored after τ R . Thus, the observations under this test are regarded as LTRC data. For the sake of completeness and concision, following notations are used in the rest of the paper.
  • T i j : latent failure time of the ith unit due to cause j , j = 1 , 2
  • τ i L : left truncated time of the ith unit
  • τ i R : right censored time of the ith unit
  • T i : observed lifetime of the ith unit, i.e., T i = min { T i 1 , T i 2 }
  • δ i : the indicator variable of the ith unit with
    δ i = 1 , i th   unit   fails   due   to   cause   1 2 , i th   unit   fails   due   to cause   2 3 , i th   unit   fails   due   to causes   both   1   and   2 0 i th   units   is   censored
  • ν i : truncated indicator variable of the ith unit with
    ν i = 1 , i th   is   not   truncated 0 , i th   unit   is   truncated
  • I 0 : set of indices of censored observations
  • I j : set of indices of failures due to cause j , j = 1 , 2 , 3
  • n j : cardinality of I j , j = 1 , 2 , 3 . Let n 123 = n 1 + n 2 + n 3 .
In this paper, for n units, the random vectors of causes of failures ( T i 1 , T i 2 ) , i = 1 , 2 , , n are independent and identically distributed following MOBR ( σ 1 , σ 2 , σ 3 ) . Under such experimental sketch, the latent LTRC competing risks failure observations can be recorded as
( t 1 , δ 1 , ν 1 ) , ( t 2 , δ 2 , ν 2 ) , , ( t n , δ n , ν n ) .

2.3. Prior Assumptions

2.3.1. Prior without Order Restriction

In this subsection, for model parameters σ 1 , σ 2 and σ 3 , a general flexible prior is considered here when there is no order restriction among the model parameters.
Following the similar line of Pena and Gupta [20], let σ 123 follow a gamma prior with hyper-parameters ( a 0 , b 0 ) and density
π 0 ( σ 123 | a 0 , b 0 ) = b 0 a 0 Γ ( a 0 ) σ 123 a 0 1 e b 0 σ 123 , a 0 > 0 , b 0 > 0 , σ 123 > 0 .
Further, for given σ 123 , the bivariate random vector σ 1 σ 123 , σ 2 σ 123 is assumed to have a Dirichlet prior with hyper-parameters c 1 , c 2 , c 3 and density
π σ 1 σ 123 , σ 2 σ 123 σ 123 , c 1 , c 2 , c 3 = Γ ( c 1 + c 2 + c 3 ) Γ ( c 1 ) Γ ( c 2 ) Γ ( c 3 ) σ 1 σ 123 c 1 1 σ 2 σ 123 c 2 1 σ 3 σ 123 c 3 1 .
Therefore, the joint prior density of ( σ 1 , σ 2 , σ 3 ) can be written from (4) and (5) as
π σ 1 , σ 2 , σ 3 | a 0 , b 0 , c 1 , c 2 , c 3 = Γ ( c 1 + c 2 + c 3 ) Γ ( a 0 ) ( b 0 σ 123 ) a 0 c 1 c 2 c 3 × b 0 c 1 Γ ( c 1 ) σ 1 c 1 1 e b 0 σ 1 b 0 c 2 Γ ( c 2 ) σ 2 c 2 1 e b 0 σ 2 b 0 c 3 Γ ( c 3 ) σ 3 c 3 1 e b 0 σ 3 .
It is seen from (6) that the joint prior density of ( σ 1 , σ 2 , σ 3 ) is characterized by Gamma–Dirichlet model with parameters a 0 , b 0 , c 1 , c 2 and c 3 , denoted as GD ( a 0 , b 0 , c 1 , c 2 , c 3 ) . One could also observe that the Gamma–Dirichlet prior is a very flexible model and the prior information among σ 1 , σ 2 and σ 3 can be dependent and independent in consequence by choosing proper hyper-parameters. For example, when a 0 = c 1 + c 2 + c 3 , the model parameters σ i , i = 1 , 2 , 3 are independent gamma priors with hyper-parameters b 0 and c i , i = 1 , 2 , 3 , respectively.

2.3.2. Prior with Order Restriction

In addition, according to historical information, expert experience as well as other information, sometimes there may be extra priori information that one failure cause is more likely to occur than the other one. In view of this situation, it is more reasonable to consider an order restriction between the unknown model parameters. In this paper, following the suggestion of Samanta and Kundu [21], an order prior distribution is considered for ( σ 1 , σ 2 , σ 3 ) when the order restriction is σ 1 < σ 2 is available and the associated density function of the order restriction prior is given by
π o ( σ 1 , σ 2 , σ 3 | a 0 , b 0 , c 1 , c 2 , c 3 ) = Γ ( c 1 + c 2 + c 3 ) Γ ( a 0 ) ( b 0 σ 123 ) a 0 ( c 1 + c 2 + c 3 ) i = 1 3 b 0 c i Γ ( c i ) × σ 3 c 3 1 e b 0 σ 123 σ 1 c 1 1 σ 2 c 2 1 + σ 2 c 1 1 σ 1 c 2 1 ,
denoted as OGD ( a 0 , b 0 , c 1 , c 2 , c 3 ) . Here, this order prior distribution could be viewed as ordered Gamma–Dirichlet distribution.

3. Classical Inference

In this section, when there is no order restriction, the maximum likelihood estimates (MLEs) for unknown parameters are established, and associated approximate confidence intervals (ACIs) are also constructed as well.

3.1. Maximum Likelihood Estimation

In order to construct the likelihood function of parameters σ 1 , σ 2 and σ 3 , a helpful theorem about the likelihood contribution for each LTRC data ( t i , δ i , ν i ) , i = 1 , 2 , , n is proposed as follows.
Theorem 1.
Let the latent LTRC competing risks data (3) be from MOBR ( σ 1 , σ 2 , σ 3 ) . The likelihood contribution of ( t i , δ i , ν i ) , i = 1 , 2 , , n can be given as follows
L ( t i , δ i , ν i ) = t i σ 1 e t i 2 σ 123 / 2 , δ i = 1 , ν i = 1 t i σ 2 e t i 2 σ 123 / 2 , δ i = 2 , ν i = 1 t i σ 3 e t i 2 σ 123 / 2 , δ i = 3 , ν i = 1 e t i 2 σ 123 / 2 , δ i = 0 , ν i = 1 t i σ 1 e t i 2 σ 123 / 2 e τ i L 2 σ 123 / 2 , δ i = 1 , ν i = 0 t i σ 2 e t i 2 σ 123 / 2 e τ i L 2 σ 123 / 2 , δ i = 2 , ν i = 0 t i σ 3 e t i 2 σ 123 / 2 e τ i L 2 σ 123 / 2 , δ i = 3 , ν i = 0 e t i 2 σ 123 / 2 e τ i L 2 σ 123 / 2 , δ i = 0 , ν i = 0
Proof. 
See Appendix A. □
Based on Theorem 1, the likelihood function of parameters σ 1 , σ 2 and σ 3 can be expressed as
L ( σ 1 , σ 2 , σ 3 ) = i I 1 t i σ 1 e t i 2 σ 123 / 2 ν i t i σ 1 e t i 2 σ 123 / 2 e τ i L 2 σ 123 / 2 1 v i × i I 2 t i σ 2 e t i 2 σ 123 / 2 ν i t i σ 2 e t i 2 σ 123 / 2 e τ i L 2 σ 123 / 2 1 ν i × i I 3 t i σ 3 e t i 2 σ 123 / 2 ν i t i σ 3 e t i 2 σ 123 / 2 e τ i L 2 σ 123 / 2 1 ν i × i I 0 e t i 2 σ 123 / 2 ν i e t i 2 σ 123 / 2 e τ i L 2 σ 123 / 2 1 ν i = σ 1 n 1 σ 2 n 2 σ 3 n 3 exp σ 123 i = 1 n t i 2 2 ( 1 ν i ) τ i L 2 2 · i I 1 I 2 I 3 t i ,
and corresponding log-likelihood function can be written as
l ( σ 1 , σ 2 , σ 3 ) = n 1 log σ 1 + n 2 log σ 2 + n 3 log σ 3 σ 123 i = 1 n t i 2 2 ( 1 ν i ) τ i L 2 2 + i I 1 I 2 I 3 log t i .
The MLEs of unknown parameters σ 1 , σ 2 and σ 3 are established in the following theorem.
Theorem 2.
Let the latent LTRC competing risks data (3) be from the MOBR ( σ 1 , σ 2 , σ 3 ) . For n j > 0 , j = 1 , 2 , 3 , the MLE of σ j can be given by
σ j ^ = n j i = 1 n t i 2 2 ( 1 ν i ) τ i L 2 2 , j = 1 , 2 , 3 .
Proof. 
See Appendix B. □

3.2. Approximate Confidence Intervals

In this section, the ACIs of the unknown parameters σ 1 , σ 2 and σ 3 are constructed by using Fisher information matrix and asymptotic approximation theory under no order restriction case. The Fisher information matrix of ρ = ( σ 1 , σ 2 , σ 3 ) is given by
I ρ = [ I i j ] i , j = 1 , 2 , 3 = E l 2 ( σ 1 , σ 2 , σ 3 ) σ i σ j ,
where for i , j = 1 , 2 , 3 , the elements of the Fisher information matrix are
I 11 = n 1 σ 1 2 , I 22 = n 2 σ 2 2 , I 33 = n 3 σ 3 2 and I i j = 0 .
Under some mild regularity conditions, the asymptotic distribution of the MLE ρ ^ of ρ  is
ρ ^ ρ d N ( 0 , I 1 ( ρ ^ ) ) ,
where ‘ d ’ denotes convergence in distribution and I 1 ( ρ ^ ) is the inverse of the Fisher information matrix I ( ρ ) which can be given by
I 1 ( ρ ^ ) = V a r ( σ ^ 1 ) C o v ( σ ^ 1 , σ ^ 2 ) C o v ( σ ^ 1 , σ ^ 3 ) C o v ( σ ^ 2 , σ ^ 1 ) V a r ( σ ^ 2 ) C o v ( σ ^ 2 , σ ^ 3 ) C o v ( σ ^ 3 , σ ^ 1 ) C o v ( σ ^ 3 , σ ^ 2 ) V a r ( σ ^ 3 ) .
For arbitrary 0 < α < 1 , a 100 ( 1 α ) % ACIs of the parameters σ j , j = 1 , 2 , 3 can be constructed by
σ ^ j z α / 2 V a r ( σ ^ j ) , σ ^ j + z α / 2 V a r ( σ ^ j ) , j = 1 , 2 , 3 ,
where z α / 2 is the upper α -th quantile of the standard normal distribution.
Sometimes, the ACIs constructed by this method may have a negative lower bound. In order to overcome this shortcoming, the logarithmic transformation and delta method are utilized to obtain the asymptotic normality distribution of log σ j ^ , j = 1 , 2 , 3 as
log ( σ ^ j ) log ( σ j ) V a r ( log σ ^ j ) d N ( 0 , 1 ) , j = 1 , 2 , 3 ,
where V a r ( log ( σ ^ j ) ) V a r ( σ ^ j ) / σ ^ j 2 , j = 1 , 2 , 3 . Therefore, a 100 ( 1 α ) % ACI of σ j , j = 1 , 2 , 3 can be established as
σ ^ j exp z α / 2 V a r ( σ ^ j ) σ ^ j , σ ^ j exp z α / 2 V a r ( σ ^ j ) σ ^ j , j = 1 , 2 , 3 .

4. Bayesian Inference

As an alternative method to likelihood inference, Bayesian inference has received wide attentions in statistical analysis due to its capability of incorporating prior knowledge. In this section, the Bayesian estimates (BEs) under squared error loss function are provided when there is no order restriction for model parameters and corresponding Bayesian high posterior density (HPD) credible intervals of unknown parameters are also constructed.
Based on expressions (6) and (9) and denote w = i = 1 n t i 2 2 τ i L 2 2 , the posterior density of σ 1 , σ 2 and σ 3 can be obtained as
π σ 1 , σ 2 , σ 3 | d a t a σ 123 ( a 0 + n 123 ) ( n 1 + c 1 ) ( n 2 + c 2 ) ( n 3 + c 3 ) σ 1 n 1 + c 1 1 e ( b 0 + w ) σ 1 × σ 2 n 2 + c 2 1 e ( b 0 + w ) σ 2 σ 3 n 3 + c 3 1 e ( b 0 + w ) σ 3 .
From (11), it can be known that the posterior distribution of parameter vector ( σ 1 , σ 2 , σ 3 ) follows GD ( a 0 + n 123 , b 0 + w , n 1 + c 1 , n 2 + c 2 , n 3 + c 3 ) . Besides, for any function of σ 1 , σ 2 and σ 3 namely η ( σ 1 , σ 2 , σ 3 ) , its Bayesian estimation η ^ ( σ 1 σ 2 , σ 3 ) under squared error loss can be expressed as
η ^ B ( σ 1 , σ 2 , σ 3 ) = 0 + η ( σ 1 , σ 2 , σ 3 ) π ( σ 1 , σ 2 , σ 3 | d a t a ) d σ 1 d σ 2 d σ 3 .
It is seen that there is no closed form for BE η ^ B ( σ 1 , σ 2 , σ 3 ) . In order to find the associated estimate, following Algorithm 1 is utilized where the associated HPD credible interval is also provided.
Algorithm 1 The Bayesian estimate for η ( σ 1 , σ 2 , σ 3 ) .
  • Step 1: Generate parameter ( σ 1 , σ 2 , σ 3 ) from Gamma–Dirichlet distribution GD ( b 0 + w 1 , a 0 + n 123 , n 1 + c 1 , n 2 + c 2 , n 3 + c 3 ) .
  • Step 2: Repeat Step 1 M times, and ( σ 1 1 , σ 2 1 , σ 3 1 ) , ( σ 1 2 , σ 2 2 , σ 3 2 ) , , ( σ 1 M , σ 2 M , σ 3 M ) can be obtained.
  • Step 3: The approximate Bayesian estimate can be computed from
    η ^ B = 1 M i = 1 M η ( σ 1 i , σ 2 i , σ 3 i ) .
  • Step 4: Denote η i = η ( σ 1 i , σ 2 i , σ 3 i ) , i = 1 , , M . To construct credible interval of η , arrange η i , i = 1 , , M in ascending order as η ( 1 ) , η ( 2 ) , , η ( M ) . Then for arbitrary 0 < α < 1 , a 100 ( 1 α ) % credible interval of η can be established as
    η ( [ s ] ) , η ( [ s + ( 1 α ) M ] ) , s = 1 , 2 , , [ M α ] ,
    where [ y ] denotes the greatest integer less than or equal to y. Therefore, the 100 ( 1 α ) % HPD credible interval can be constructed as
    η ( [ s ] ) , η ( [ s + ( 1 α ) M ] ) ,
    where s th satisfying
    η ( [ s + ( 1 α ) M ] ) η ( [ s ] ) = min s = 1 , 2 , , [ M α ] η ( [ s + ( 1 α ) M ] ) η ( s ) .

5. Inference with Order Restriction

In this section, under the condition of order restriction information σ 1 < σ 2 , the estimates for unknown parameters σ 1 , σ 2 and σ 3 are established from both classical and Bayesian perspectives, respectively.

5.1. Classical Inference with Order Restriction

Theorem 3.
Let the latent LTRC competing risks data (3) follow MOBR ( σ 1 , σ 2 , σ 3 ) and the order restriction σ 1 < σ 2 be available. For given n j , j = 1 , 2 , 3 , the MLEs of σ j , j = 1 , 2 , 3 can be presented as
σ ˜ j = n j i = 1 n t i 2 2 ( 1 ν i ) τ i L 2 2 , j = 1 , 2 , n 1 < n 2 σ ˜ 1 = σ ˜ 2 = n 1 + n 2 2 i = 1 n t i 2 2 ( 1 ν i ) τ i L 2 2 , n 1 n 2 and σ ˜ 3 = n 3 i = 1 n t i 2 2 ( 1 ν i ) τ i L 2 2 .
Proof. 
See Appendix C. □

5.2. Bayesian Inference with Order Restriction

From (7) and (9), the joint posterior distribution of σ 1 , σ 2 and σ 3 can be written as
π o ( σ 1 , σ 2 , σ 3 | d a t a ) π ˜ ( σ 1 , σ 2 , σ 3 ) h ( σ 1 , σ 2 , σ 3 ) ,
where
π ˜ ( σ 1 , σ 2 , σ 3 ) = σ 123 ( a 0 + n 123 ) ( 2 n 123 + c 1 + c 2 + c 3 ) σ 3 2 n 3 + c 3 1 e ( b 0 + w ) σ 123 × σ 1 n 1 + n 2 + c 1 1 σ 2 n 1 + n 2 + c 2 1 + σ 2 n 1 + n 2 + c 1 1 σ 1 n 1 + n 2 + c 2 1
and
h ( σ 1 , σ 2 , σ 3 ) = σ 123 n 123 σ 1 n 2 σ 2 n 1 σ 3 n 3 .
It is seen that π ˜ ( σ 1 , σ 2 , σ 3 ) is OGD ( a 0 + n 123 , b 0 + w , n 1 + c 1 + n 2 , n 1 + n 2 + c 2 , 2 n 3 + c 3 ) , and one could use the way suggested by Samanta and Kundu [21] to generate random samples from the ordered Gamma–Dirichlet distribution. Similarly, since it is difficult to obtain the explicit form of BE for unknown parameters under squared error loss function, Algorithm 2 is presented as follows.
Algorithm 2 The Bayesian estimate for η ( σ 1 , σ 2 . σ 3 ) with order restriction.
  • Step 1: Generate ( σ 1 , σ 2 , σ 3 ) from OGD ( a 0 + n 123 , b 0 + w , n 1 + c 1 + n 2 , n 1 + n 2 + c 2 , 2 n 3 + c 3 ) .
  • Step 2: Repeat Step 1 M times, and ( σ 1 ( 1 ) , σ 2 ( 1 ) , σ 3 ( 1 ) ) , , ( σ 1 ( M ) , σ 2 ( M ) , σ 3 ( M ) ) can be obtained.
  • Step 3: Compute η i = η ( σ 1 ( i ) , σ 2 ( i ) , σ 3 ( i ) ) .
  • Step 4: Calculate the weights
    w i = h ( σ 1 ( i ) , σ 2 ( i ) , σ 3 ( i ) ) i = 1 M h ( σ 1 ( i ) , σ 2 ( i ) , σ 3 ( i ) ) .
  • Step 5: Compute the BE of η ( σ 1 , σ 2 , σ 3 ) under squared error loss function as η ^ B ( σ 1 , σ 2 , σ 3 ) = j = 1 M w j η j .
  • Step 6: To construct a 100 ( 1 α ) % ( 0 < α < 1 ) credible interval of η ( σ 1 , σ 2 , σ 3 ) , order η j for j = 1 , 2 , , M , say η ( 1 ) < η ( 2 ) < < η ( M ) and arrange w j accordingly to get w ( 1 ) , , w ( M ) . Note that w ( 1 ) , , w ( M ) may not be ordered.
  • Step 7: A 100 ( 1 α ) % credible interval can be obtained as ( η j 1 , η j 2 ) , where j 1 and j 2 satisfy
    j 1 , j 2 1 , 2 , , M , j 1 < j 2 and i = j 1 j 2 w ( i ) 1 α < i = j 1 j 2 + 1 w ( i ) .
    The 100 ( 1 α ) % HPD credible interval of η ( σ 1 , σ 2 , σ 3 ) becomes ( η ( j 1 ) , η ( j 2 ) ) , where 1 j 1 j 2 M satisfy
    i = j 1 j 2 w ( i ) 1 α i = j 1 j 2 + 1 w ( i ) and η ( j 2 ) η ( j 2 ) η ( j 2 ) η ( j 1 ) .

6. Prediction

Besides parameter estimation, it is of importance to discuss the prediction issue for the lifetime of censored samples in both theoretical study and practical application. This prediction problem has been discussed by many authors. For example, the work of Abdel-Hamid [22], Ahmed [23], Kotb and Raqab [24] and Zhang and Shi [25]. Recall that I 0 and τ i R are the set of right censored samples and right censored time of the ith sample respectively. Since the real failure time of right censored sample is unobserved, we focus on the sample which belongs to I 0 in this section. The likelihood-based point predictions (LPPs) for the lifetime of right censored samples are established, and associated likelihood-based prediction intervals (LPIs) are constructed too. Besides, the Bayesian predictors (BPs) and Bayesian prediction intervals (BPIs) for the lifetime of these right censored samples are also given as another alternative prediction methods.
For i I 0 , let Y i be the future failure time of censored sample, the conditional PDF and SF of Y i for given τ i R can be written as
f ( y i | Y i > c i ; σ 1 , σ 2 , σ 3 ) = y i σ 123 e σ 123 ( y i 2 2 τ i R 2 2 ) , y i > τ i R ,
and
S ( y i | Y i > c i ; σ 1 , σ 2 , σ 3 ) = e σ 123 ( y i 2 2 τ i R 2 2 ) , y i > τ i R ,
respectively.

6.1. Classical Prediction

In order to obtain the LPP and LPI for Y i , a theorem is presented as follows.
Theorem 4.
Let the latent LTRC competing risk data (3) follow MOBR ( σ 1 , σ 2 , σ 3 ) and Y i , i I o be the future time of censored sample. For given n j > 0 , j = 1 , 2 , 3 , one has that
(1) 
the point prediction of Y i is given by
y i = 2 log 0.5 σ 123 + τ i R 2 .
(2) 
the 100 ( 1 α ) % prediction interval for Y i is constructed as
τ i R 2 2 σ 123 log α 2 , τ i R 2 2 σ 123 log ( 1 α 2 ) .
Proof. 
See Appendix D. □
Based on Theorem 4, by using the substitution method as ( σ ^ 1 , σ ^ 2 , σ ^ 3 ) for ( σ 1 , σ 2 , σ 3 ) , then the LPP and LPI for Y i can be established respectively.

6.2. Bayesian Prediction

In order to find the BP and BPI for Y i , another theorem is proposed as follows.
Theorem 5.
Let the latent LTRC competing risk data (3) follow MOBR ( σ 1 , σ 2 , σ 3 ) and Y i , i I o be the future failure time of censored sample. For given joint prior density G D ( a 0 , b 0 , c 1 , c 2 , c 3 ) and n j > 0 , j = 1 , 2 , 3 , one has that
(1) 
The BP of Y i under squared error loss function can be given by
Y ^ i B = τ i R + ( b 0 + w ) a 0 + n 123 c i + b 0 + w + y i 2 2 τ i R 2 2 ( a 0 + n 123 ) d y i .
(2) 
The associated BPI L , U of Y i can be obtained by solving the following equations
1 2 λ U ( a 0 + n 123 ) ( 2 b 0 + 2 w ) a 0 + n 123 2 b 0 + 2 w + U 2 τ i R 2 a 0 + n 123 + 1 = 0 1 + 2 λ L ( a 0 + n 123 ) ( 2 b 0 + 2 w ) a 0 + n 123 2 b 0 + 2 w + L 2 τ i R 2 a 0 + n 123 + 1 = 0 2 b 0 + 2 w 2 b 0 + 2 w + L 2 τ i R 2 a 0 + n 123 2 b 0 + 2 w 2 b 0 + 2 w + U 2 τ i R 2 a 0 + n 123 ( 1 α ) = 0 .
Proof. 
See Appendix E. □

7. Numerical Illustration

7.1. Simulation Studies

In this section, a Monte Carlo simulation study is conducted to evaluate the performance of proposed estimation methods when LTRC dependent competing risks data are obtained. For comparison, the absolute bias (ABs) and mean square errors (MSEs) are used to assess the performance of point estimates, while average lengths (ALs) and coverage probabilities (CPs) are utilized to assess the performance of interval estimates under different combinations of sample size n and truncation rate p. In this paper, we take two sets of parameters as true parametric values, which are σ 1 = 1.5 , σ 2 = 2 , σ 3 = 2.5 and σ 1 = 1 , σ 2 = 1.3 , σ 3 = 2 respectively. For these two sets of parameters, we consider the informative priors whose corresponding setting of hyper-parameters ( a 0 , b 0 , c 1 , c 2 , c 3 ) are chosen as (360,60,0.7185,0.9583,1.1979) and (185.43,0.6476,0.8419,1.2952), respectively. Furthermore, we make different choices for the sample size n such as 50, 80 and 100. Besides, the fixed truncation rates p (TR) are chosen to be 0.2, 0.4 and 0.6. In various combinations of designed scenarios, the classical and Bayesian estimates of the unknown parameters are established, and the corresponding evaluation quantities are obtained based on 10,000 simulation runs. For both non order restriction and order restriction cases, the simulation results are presented in Table 1, Table 2, Table 3, Table 4, Table 5, Table 6, Table 7 and Table 8, where the confidence level for interval estimates is set to be 0.95.
From the results in Table 1, Table 2, Table 3 and Table 4, it is observed for point estimates that
(1)
For fixed truncation rate, the performance of MLEs in terms of ABs and MSEs gets better with increase of sample size n. Furthermore, BEs show the same trend as well.
(2)
When there is no order restriction between unknown parameters, for fixed sample size n, the ABs and MSEs of point estimates based on both classical and Bayesian inference increase as truncation rate increases.
(3)
Regardless of an order restriction between unknown parameters, the ABs and MSEs of BEs are always smaller than those of MLEs.
Moreover, from the results in Table 5, Table 6, Table 7 and Table 8, we can observe following conclusions for interval estimates
(1)
For fixed sample size n, the ALs of interval estimates get smaller as truncation rate decreases.
(2)
For fixed truncation rate, the performance of both ACIs and HPD credible intervals in terms of ALs get better with the sample size increases.
(3)
Under different combinations of sample size and truncation rate, the ALs of HPD credible intervals are always smaller than those of ACIs and the CPs of HDP credible intervals are always around the nominal confidence level and better than the CPs of ACIs.
(4)
According to the results of ALs and CPs, interval estimates from both classical and Bayesian methods work satisfactory in general. Especially, it is noted that the CPs of some ACIS are consistently too high. One possible explanation for this may be that ACIs based on asymptotic normality of the MLEs have nearly two to three times estimated interval lengths compared with HPD intervals.

7.2. Illustrative Examples

Dataset 1: The dataset is the aforementioned diabetic retinopathy complete risks data, which can be obtained from Samanta and Kundu [21]. The original complete competing risks failure times were presented in terms of day and we rescale the times in terms of 500 days which will do not affect the analysis results. In order to generate LTRC competing risks data, we have randomly chosen 20 % data from the original complete dataset as left-truncated data and their 5 % values are used as left truncated times. Correspondingly, another 4 % data from the origin dataset are randomly chosen as right-censored data. That is to say, the truncation rate and censoring rate are 20% and 4% respectively in this illustration. The detailed LTRC competing risks data set is presented in Table A1 of Appendix F.
In this data set, δ = 1 means that the eye was selected for laser treatment, while δ = 2 means that the eye was not given the laser treatment. Besides, if both two eyes of a patient have failed simultaneously, then δ = 3 ; and if there is no eye failure until the end of observation, then δ = 0 . t i is the observed time to ith patient, and ν i is the indicator that shows whether ith blindness is left truncated. Further, τ i L denotes left truncated time of ith blindness. Since there is no prior information about the unknown parameters, we adopted the almost non-informative prior suggested by Samanta and Kundu [21], which has hyper-parameters ( a 0 , b 0 , c 1 , c 2 , c 3 ) = ( 0.001 , 0.001 , 1 , 1 , 1 ) . The confidence level for ACI and credible interval is set to be 0.95.
In order to check the goodness-of-fit of this data set, the Kolmogorov-Smirnov (KS) test is used. The results show that KS distance is 0.1282, and related p-value is 0.1936, which means the empirical and fitted CDF are very close. Based on classical and Bayesian framework, the point estimates with their estimated standard errors (ESEs) of unknown parameters are established, and associated interval estimates are constructed as well, which are presented in Table 9. From this table, it is seen that MLEs and BEs of unknown parameters are very close to each other, but the latter performs better in terms of their ESEs. Furthermore, the lengths of HPD credible intervals are smaller than those of ACIs. Recall that T = min ( T 1 , T 2 ) follows Rayleigh ( σ 123 ) , then the corresponding PDF and CDF plots based on both MLEs and BEs can be obtained and shown in Figure 1. While there are some differences between the MLEs and BEs of each parameter, σ i , i = 1 , 2 , 3 , the MLE and BE based of σ 123 are almost the same. Thus, it can be found that both PDF and CDF plots obtained by the two methods are almost coincident in Figure 1, which also means the performance of Bayesian inference based on non-informative prior is similar to that of classical inference. In addition, from Table A1, it can be found that three censored patients, whose numbers are 15, 31 and 65. The associated real lifetimes of them can be obtained from the original table in Samante and Kundu [21], which are 1.5800, 1.4340 and 1.4540. The prediction results for them are shown in Table 10.
Dataset 2: The dataset used from from Kundu et al. [19] is about the LTRC competing risks lifetimes of high-voltage power transformers, where there are just two failure causes. In order to obtain the dependent LTRC competing risks data, we randomly select 10 % data from Kundu et al. [19] example, and treated these data as failure times due to causes one and two simultaneous. In addition, for the purpose of computational convenience, we divide all data by 100 for sake of simplicity. The final data are shown in Table A2 of Appendix G, where the truncation rate and the censoring rate are set to be 30% and 53%, respectively, in this illustration which are as same as the dataset given in Kundu et al. [19].
Similar to Dataset 1, the significance level is set to be 0.05. We take ( 0.1 , 0.1 , 0.1 , 0.1 , 0.1 ) as the values of hyper-parameter ( a 0 , b 0 , c 1 , c 2 , c 3 ) , which are also almost non-informative prior. The estimates of unknown parameters are specifically presented in Table 11. It is seen that MLEs and BEs are very close to each other, but the ESEs of the latter is smaller than that of the former. Besides, the interval lengths of HPD credible intervals are smaller than ACIs. In general, in terms of estimation for model parameters in this dataset, the Bayesian method performs better than classical methods. Figure 2 shows that two curves are very close to each other in both PDF and CDF plots, which also reflects the estimates of σ 123 based on two different methods are not much different. In addition, there are 53 % censored samples in this dataset, and the prediction issue of them is considered. Since the size of censored samples is very large, we only present the predictions of partial censored samples shown in Table 12.

8. Conclusions

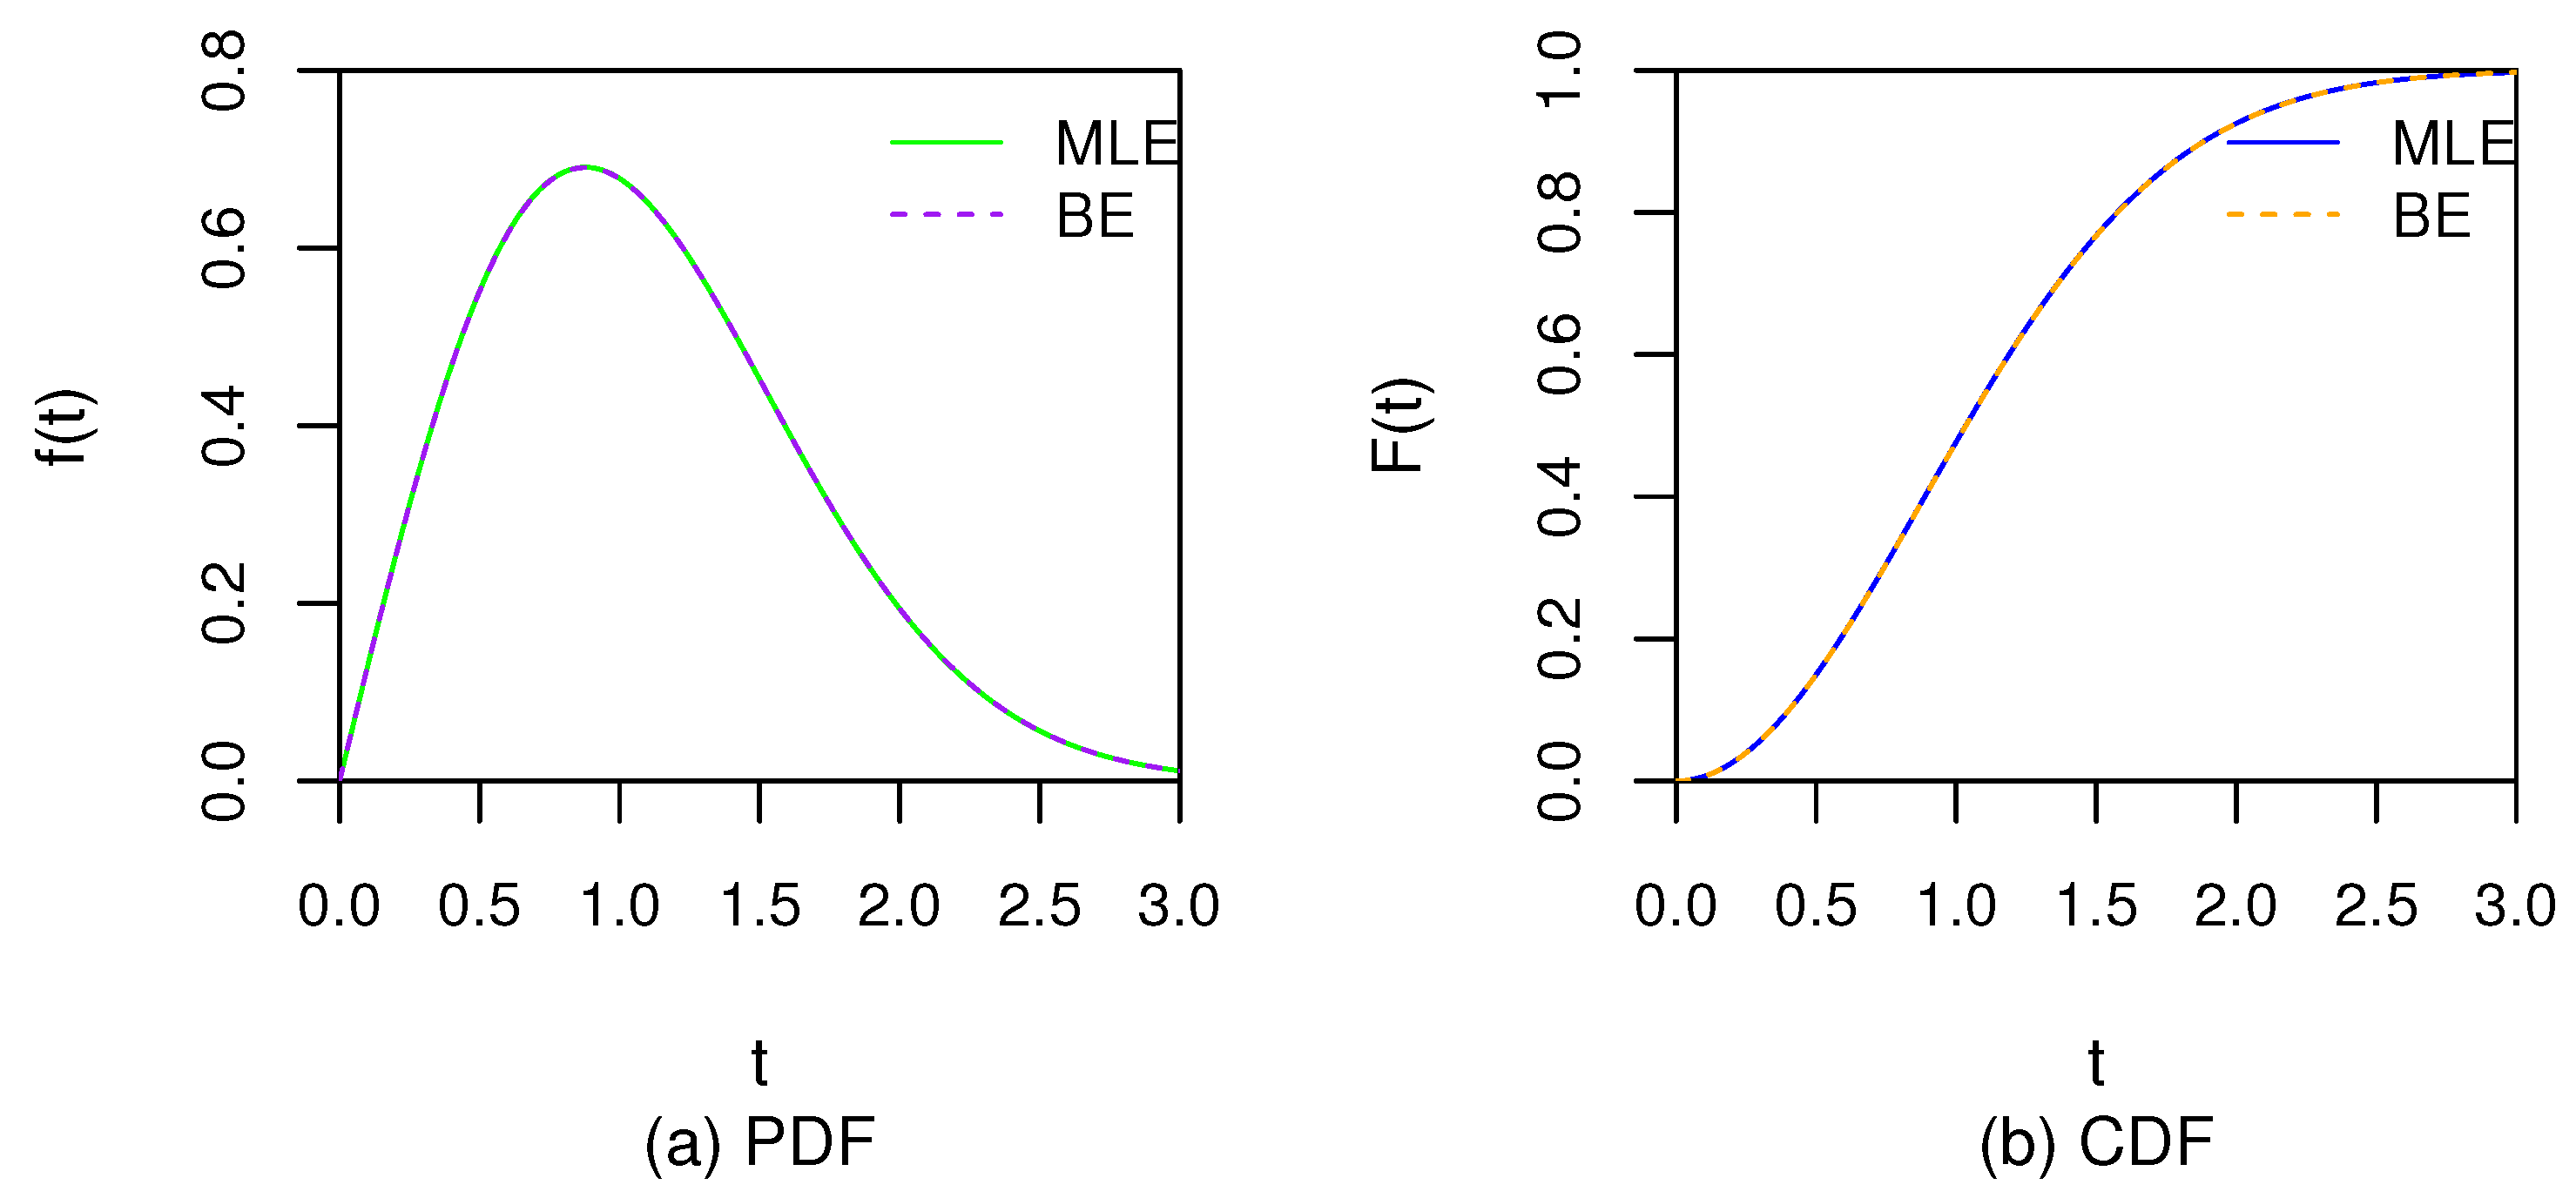
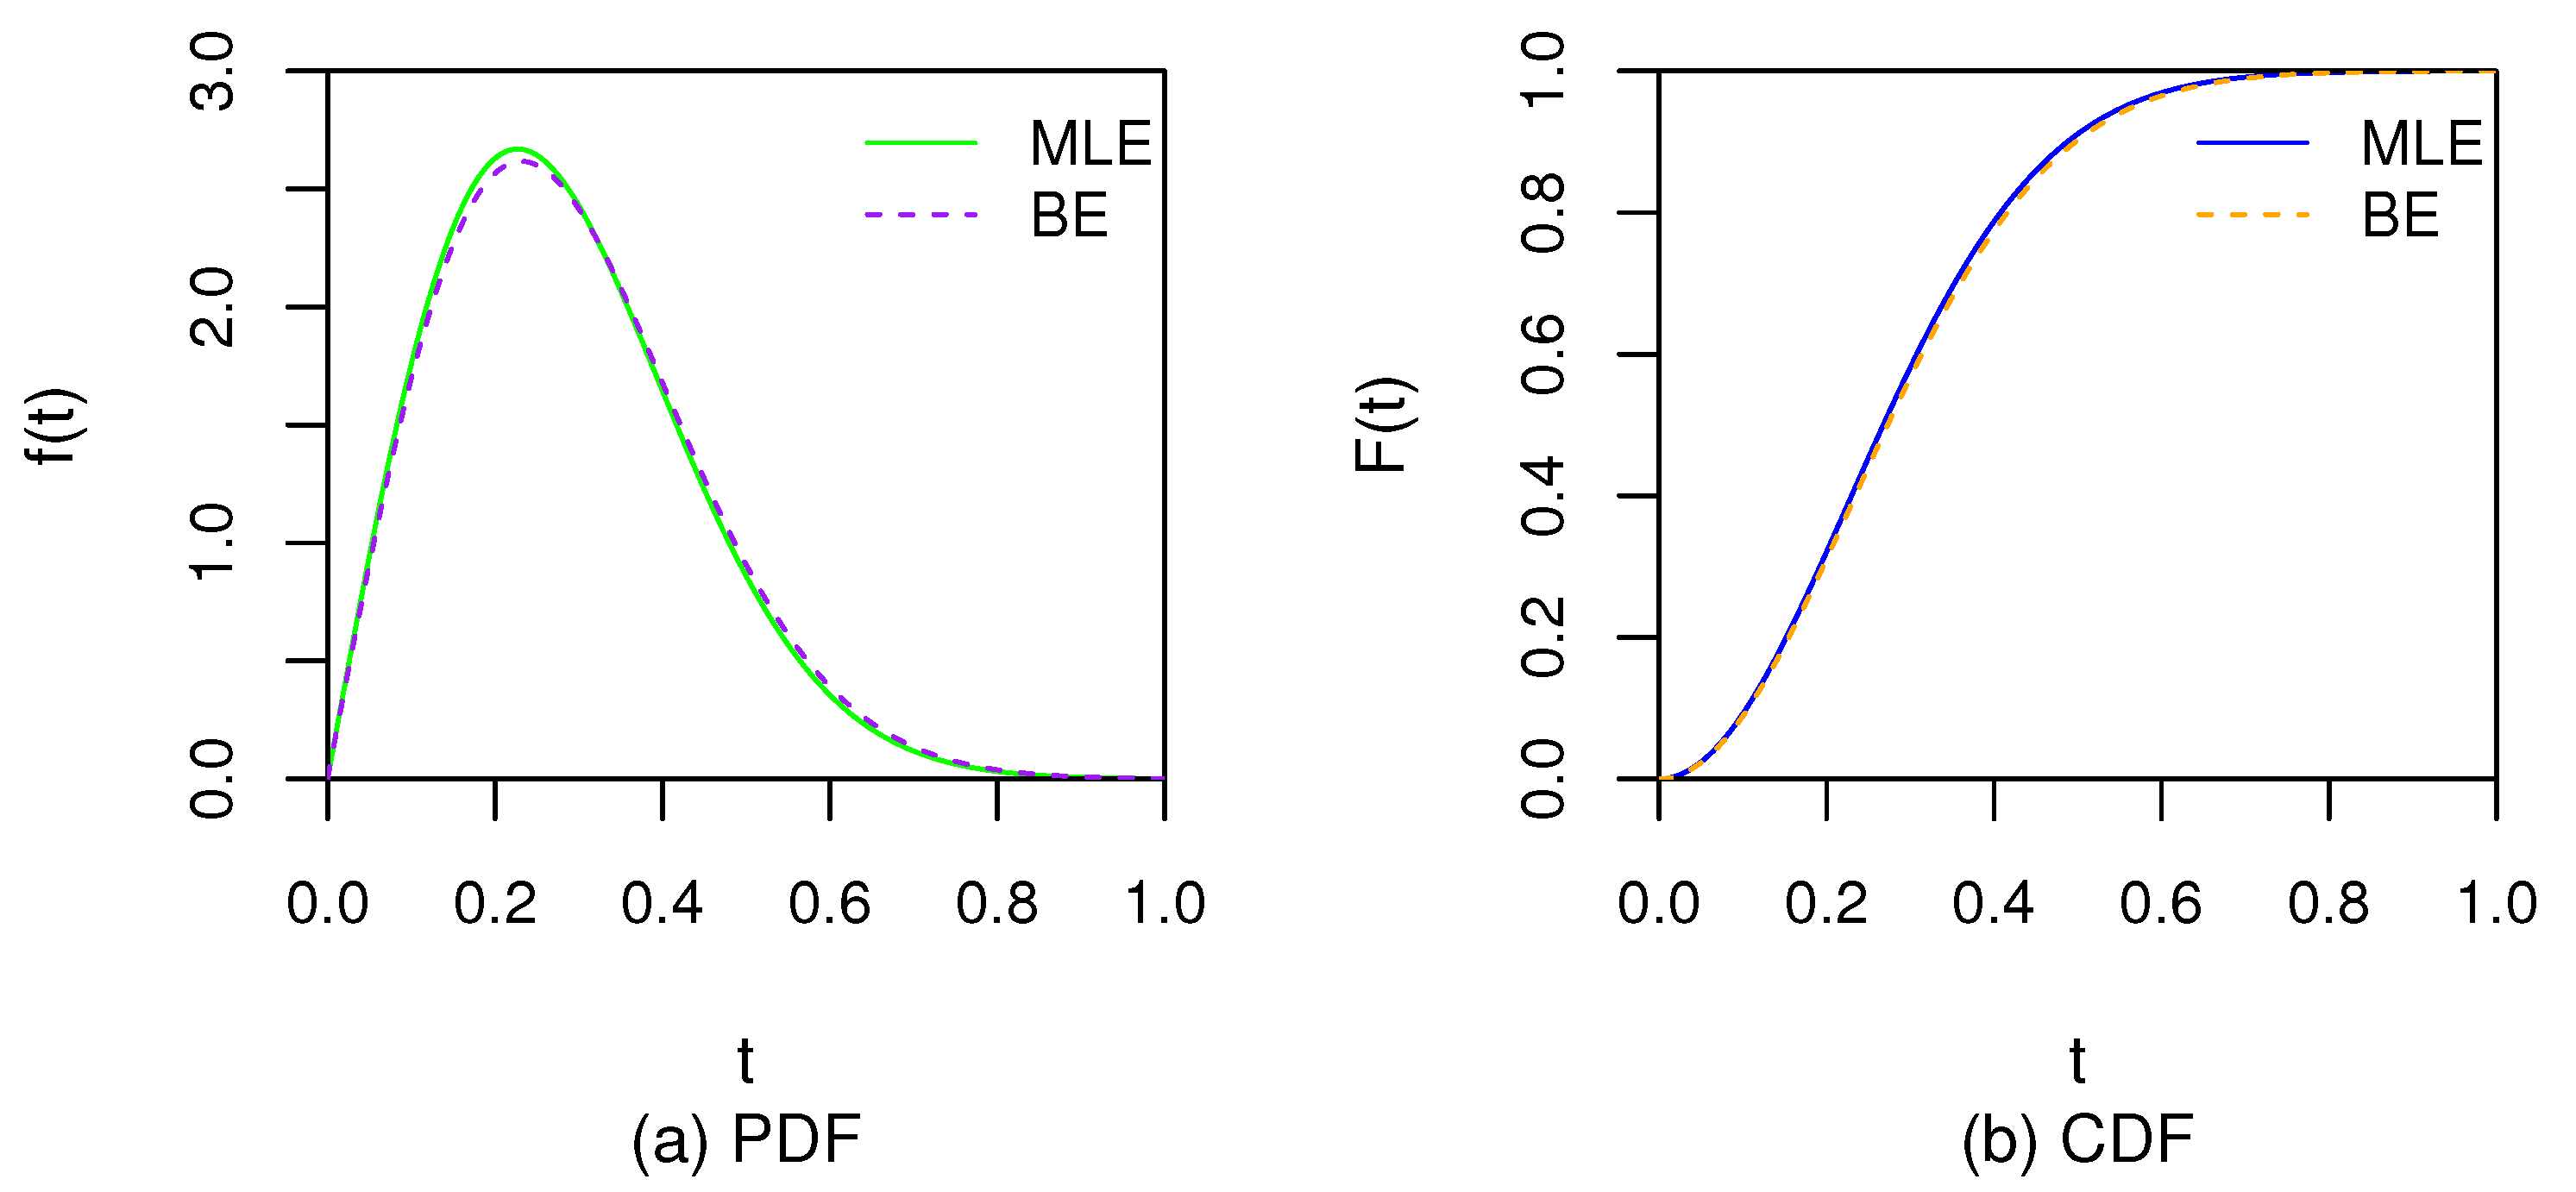
In this paper, classical and Bayesian inferences for LTRC dependent competing risks data have been discussed. When the dependent competing risks is distributed by the Marshall–Olkin bivariate Rayleigh model, the maximum likelihood estimators of unknown parameters are established, and associated approximate confidence intervals are also constructed. Furthermore, Bayesian estimates and corresponding high posterior density credible intervals are developed as well. In addition, when order restriction information between parameters is available, the point and interval estimates for unknown parameters are also provided based on classical and Bayesian frameworks. In order to investigate the lifetimes of censored samples, prediction formulae are also developed from classical and Bayesian perspectives, respectively. Finally, extensive simulation studies and two real life examples are carried out to evaluate the performance of proposed methods, and the results show that both classical and Bayesian inference works satisfactorily. Moreover, if the priori information is sufficient, the results indicate that the Bayesian method perform better than the classical one under both order and non-order restriction situations.
In addition, although the main contents of the paper focus on the LTRC competing risks data with MOBR model, the work can also be extended (with proper modifications) to a more general Marshall–Olkin type bivariate model with baseline CDF as
F ( x ; θ ) = 1 F ¯ 0 ( x ) θ , x B , θ > 0 ,
where F ¯ 0 ( · ) = 1 F 0 ( · ) , F 0 ( · ) is a baseline CDF and B is the support of the baseline CDF F 0 ( · ) . This distribution family is called the proportional hazard rate model in literature and includes exponential distribution, Rayleigh distribution, Pareto distribution (one parameter) as its special cases. To be specific, let U i , i = 1 , 2 , 3 follow proportional hazard rate model with parameter θ i , i = 1 , 2 , 3 , T 1 = min ( U 1 , U 3 ) and T 2 = min ( U 2 , U 3 ) , then the joint SF of ( T 1 , T 2 ) can be expressed as
S T 1 , T 2 ( t 1 , t 2 ) = F ¯ 0 ( t 1 ) θ 1 F ¯ 0 ( t 2 ) θ 2 + θ 3 , t 1 < t 2 F ¯ 0 ( t 1 ) θ 1 + θ 3 F ¯ 0 ( t 2 ) θ 2 , t 1 > t 2 F ¯ 0 ( t ) θ 1 + θ 2 + θ 3 , t 1 = t 2 = t .
Following the similar procedures established above, statistical inferences for the LTRC dependent competing risks data from this Marshall–Olkin type bivariate model could be obtained based on both likelihood and Bayesian methods.
The current study includes the statistical inferences of population parameters and prediction of failure time for the censored units based on the LTRC dependent competing risks data from identical Marshall–Olkin type bivariate distribution. The left truncated time and right censored time for each unit under study could be different. When all left truncated times are equal to 0 and all right censored times are infinity, the LTRC dependent competing risks data is random sample obtained from the identical Marshall–Olkin type bivariate distribution. Therefore, the developed methodologies are not for non-stationary data. Based on the application and theoretical experiences from random sample, both Bayesian and MLE procedures are getting more accurate results when sample size is getting larger. Table 1, Table 2, Table 3 and Table 4 show both methods are getting more accurate estimates in terms of MSE and AB and Table 5, Table 6, Table 7 and Table 8 show both methods are getting more accurate confidence or credible interval in terms of AL as well as CP when sample size is getting larger under the same TR rate. Hence, both proposed estimation procedures are applicable for larger datasets. Specially, the limit distribution of MLE has been proved to be normal distribution when sample size n approaches to infinity in Section 3.2. The asymptotic normal distribution has true unknown parameters as mean vector and variance-covariance that is the inverse of Fisher information. When using a finite sample size, the estimated variance-covariance is usually not accurate and the estimated variance of MLE is usually inflated due to the TR rate and/or censored rate. However, the Bayesian procedure does not use limit distribution that usually requires larger sample size to get more accurate results. Therefore, the ACIs are usually not stable and have larger length than the HPDs given a sample size and TR rate; meanwhile the CPs for ACIs are sometimes much larger than or less than the nominal level; while all HPDs have CPs nearby the nominal level. However, the Bayesian method through the MCMC procedure usually needs more computation time than MLE does.

Author Contributions

Funding acquisition, L.Y.; Methodology, K.W. and L.W.; Writing–original draft, Y.L. All authors have read and agreed to the published version of the manuscript.

Funding

The authors would like to than the editor and the reviewers for their careful reading and insightful comments which have led to a substantial improvement to an earlier version of the paper. This research was supported by the National Natural Science Foundation of China (No. 12061091), the Yunnan Fundamental Research Projects (No. 202101AT070103) and the Doctoral Research Foundation of Yunnan Normal University (No. 00800205020503129).

Acknowledgments

Authors would like to thank the Editor and reviewers for their valuable comments and suggestions which improve this paper significantly.

Conflicts of Interest

The authors declare no conflict of interest.

Appendix A. The Proof of Theorem 1

When δ i = 1 , ν i = 1 , it means that the ith unit is not left truncated and fails due to cause 1. That is to say, T 1 i = t i and T 2 i > t i . Thus, the likelihood contribution of the ith unit can be expressed as
lim d t i 1 0 p ( t i 1 < T i 1 < t i 1 + d t i 1 , T i 2 > t i 2 ) d t i 1 ( t i 1 , t i 2 ) = ( t i , t i ) .
When δ i = 1 , ν i = 0 , it means that the ith unit is left truncated and its failure factor is cause 1. These messages imply that T i = min ( T 1 i , T 2 i ) > τ i L , T 1 i = t i and T 2 i > t i . Therefore, the likelihood contribution of the ith unit under this case can be written as
lim d t i 1 0 p ( t i 1 < T i 1 < t i 1 + d t i 1 , T i 2 > t i 2 | min ( T i 1 , T i 2 ) > τ i L ) d t i 1 ( t i 1 , t i 2 ) = ( t i , t i ) .
For other failure cases of the ith unit, the likelihood contributions can be obtained by the above approaches similarly. Finally, the likelihood contribution of the ith unit under different values of δ i and ν i can be presented as
L ( t i , δ i , ν i ) = f ( t i ; σ 1 ) S ( t i ; σ 2 + σ 3 ) , δ i = 1 , ν i = 1 S ( t i ; σ 1 + σ 3 ) f ( t i ; σ 2 ) , δ i = 2 , ν i = 1 σ 3 f ( t i ; σ 123 ) σ 123 , δ i = 3 , ν i = 1 S ( t i ; σ 123 ) , δ i = 0 , ν i = 1 f ( t i ; σ 1 ) S ( t i ; σ 2 + σ 3 ) S ( τ i L ; σ 123 ) , δ i = 1 , ν i = 0 S ( t i ; σ 1 + σ 3 ) f ( t i ; σ 2 ) S ( τ i L ; σ 123 ) , δ i = 2 , ν i = 0 σ 3 f ( t i ; σ 123 ) σ 123 S ( τ i L ; σ 123 ) , δ i = 3 , ν i = 0 S ( t i ; σ 123 ) S ( τ i L ; σ 123 ) , δ i = 0 , ν i = 0 .
Based on expressions (1) and (2), this theorem can be proved.

Appendix B. The Proof of Theorem 2

Taking derivative of l ( σ 1 , σ 2 , σ 3 ) with respect to σ j , j = 1 , 2 , 3 respectively and equating them to zero, one has that
σ ^ j = n j i = 1 n t i 2 2 ( 1 ν i ) τ i L 2 2 , j = 1 , 2 , 3 .
Using inequality log σ j σ j ^ σ j σ ^ j 1 , j = 1 , 2 , 3 for σ j σ ^ j > 0 , it can be obtained that
n j log σ j σ j i = 1 n t i 2 2 ( 1 ν i ) τ i L 2 2 n j + n j log σ ^ j .
Utilizing above equality and the expression n j = σ ^ j i = 1 m t i 2 2 ( 1 ν i ) τ i L 2 2 , it is seen that
l ( σ 1 , σ 2 , σ 3 ) n 1 log σ ^ 1 + n 2 log σ ^ 2 + n 3 log σ ^ 3 ( n 1 + n 2 + n 3 ) + i I 1 I 2 I 3 log t i = n 1 log σ ^ 1 + n 2 log σ ^ 2 + n 3 log σ ^ 3 σ ^ 123 i = 1 n t i 2 2 ( 1 ν i ) τ i L 2 2 + i I 1 I 2 I 3 log t i ,
where σ ^ 123 = σ ^ 1 + σ ^ 2 + σ ^ 3 , and equality holds iff σ j = σ ^ j , j = 1 , 2 , 3 . Therefore, the assertion is proved.

Appendix C. The Proof of Theorem 3

Similar to the proof of Theorem 2, when n 1 < n 2 , the MLEs of unknown parameters ( σ 1 , σ 2 , σ 3 ) under the order restriction σ 1 < σ 2 can be obtained and the values are same as those of Theorem 1, which can be given by
σ ˜ j = n j i = 1 n t i 2 2 ( 1 ν i ) τ i L 2 2 , j = 1 , 2 , 3 .
When n 1 n 2 , the MLEs obtained in Theorem 1 do not hold under the order restriction σ 1 < σ 2 . In this situation, the likelihood function (10) is maximized in the line σ 1 = σ 2 = σ under the order restriction σ 1 < σ 2 . Therefore, corresponding MLEs σ j ˜ , j = 1 , 2 , 3 can be obtained by satisfying
max ( σ , σ 3 ) = ( n 1 + n 2 ) log σ + n 3 log σ 3 ( 2 σ + σ 3 ) i = 1 n t i 2 2 ( 1 ν i ) τ i L 2 2 + i I 1 I 2 I 3 log t i .
By taking derivative with respect to σ and σ 3 of the above expression and equating it to zero, then it can be obtained that
σ ˜ 1 = σ ˜ 2 = σ = n 1 + n 2 2 i = 1 n t i 2 2 ( 1 ν i ) τ i L 2 2 and σ 3 ˜ = n 3 i = 1 n t i 2 2 ( 1 ν i ) τ i L 2 2 .
Thus, this Theorem is proved.

Appendix D. The Proof of Theorem 4

According to (14), it is seen that Z i = Y i 2 2 c i 2 2 follows exponential distribution with parameter σ 123 . Let E 0.5 be the median of this distribution, and regard it as the point where Z i is most likely to be. From equation 1 exp σ 123 E 0.5 = 0.5 , it can be obtained that E 0.5 = log 0.5 / σ 123 . Thus, the point prediction of Y i can be computed by Z i = log 0.5 / σ 123 , which is
y i = 2 log 0.5 σ 123 + c i 2 .
Further, the 100 ( 1 α ) % prediction interval ( L , U ) for Y i can be constructed by the following two equations
p Z i < L 2 2 c i 2 2 = α 2 , and p Z i > U 2 2 c i 2 2 = α 2 .
Therefore, the theorem is proved.

Appendix E. The Proof of Theorem 5

From expression (11) and (14), the predictive density of Y i can be given as
f ( y i | c i ) = E p o s t e r i o r G D f ( y i | Y i > c i ; σ 1 , σ 2 , σ 3 ) = 0 + 0 + 0 + f ( y i | Y i > c i ; σ , σ 2 , σ 3 ) π ( σ 1 , σ 2 , σ 3 | d a t a ) d σ 1 d σ 2 d σ 3 = y i ( a 0 + n 123 ) ( b 0 + w ) a 0 + n 123 ( b 0 + w + w 1 ) a 0 + n 123 + 1 ,
where c 123 = c 1 + c 2 + c 3 and w 1 = y i 2 2 c i 2 2 . For above integral, its integrand function is the pdf of G D ( a 0 + n 123 + 1 , b 0 + w + w 1 , n 1 + c 1 , n 2 + c 2 , n 3 + c 3 ) , so integral value is equal to 1. Hence, the BE of Y i under squared error loss function can be obtained by
Y ^ i B = c i + y i f ( y i | c i ) d t = c i + ( b 0 + w ) a 0 + n 123 c i + ( b 0 + w + y i 2 2 c i 2 2 ) ( a 0 + n 123 ) d y i .
Similarly, the predictive survival function of Y i can be presented based on (11) and (15) as
S ( y i | c i ) = E p o s t e r i o r G D S ( y i | Y i > c i ; σ , σ 2 , σ 3 ) = 0 + 0 + 0 + S ( y i | Y i > c i ; σ 1 , σ 2 , σ 3 ) π ( σ 1 , σ 2 , σ 3 | d a t a ) d σ 1 d σ 2 d σ 3 = b 0 + w b 0 + w + w 1 a 0 + n 123 .
From expression (A1), S ( L | c i ) S ( U | c i ) = 1 α can be written as
2 b 0 + 2 w 2 b 0 + 2 w + L 2 c i 2 a 0 + n 123 2 b 0 + 2 w 2 b 0 + 2 w + U 2 c i 2 a 0 + n 123 ( 1 α ) = 0 ,
In order to minimize U L under the restriction of expression (A2), Lagrange method can be utilized. Hence, the HPD predictive interval ( L , U ) of Y i , can be obtained by solving the following equations:
1 2 λ U ( a 0 + n 123 ) ( 2 b 0 + 2 w ) a 0 + n 123 2 b 0 + 2 w + U 2 c i 2 a 0 + n 123 + 1 = 0 1 + 2 λ L ( a 0 + n 123 ) ( 2 b 0 + 2 w ) a 0 + n 123 2 b 0 + 2 w + L 2 c i 2 a 0 + n 123 + 1 = 0 2 b 0 + 2 w 2 b 0 + 2 w + L 2 c i 2 a 0 + n 123 2 b 0 + 2 w 2 b 0 + 2 w + U 2 c i 2 a 0 + n 123 ( 1 α ) = 0 .
Thus, the theorem is proved.

Appendix F. Dataset 1

Table A1. Diabetic retinopathy data.
i12345678910
t i 0.53200.18200.30800.57001.16601.09400.15801.24401.41400.9380
δ i 1223121322
ν i 1101011101
τ i L 000.196600.25120001.19920
i11121314151617181920
t i 0.18602.62601.61000.68800.57370.25001.55400.61200.83000.6140
δ i 1211022112
ν i 1111101111
τ i L 000000.08160000
i21222324252627282930
t i 1.27401.15400.35601.03400.54402.27402.96800.63000.57402.5040
δ i 2212331121
ν i 0111110100
τ i L 0.8675000000.738200.05781.0616
i31323334353637383940
t i 0.53541.28400.28200.81400.71203.30600.85401.39800.07201.3340
δ i 0121132121
ν i 1011111110
τ i L 00.857000000000.1557
i41424344454647484950
t i 1.17600.94200.25200.70000.70001.32601.13401.93200.40600.1680
δ i 2312132331
ν i 1111101101
τ i L 000000.9948000.07550
i51525354555657585960
t i 0.78402.28001.80202.49400.89601.80800.55201.04000.97000.4960
δ i 1213221122
ν i 1111011111
τ i L 00000.211400000
i61626364656667686970
t i 1.00600.84600.57000.63000.55360.42000.81801.16800.71002.6040
δ i 1222022111
ν i 1111101111
τ i L 000000.06480000
i71
t i 0.4540
δ i 2
ν i 0
τ i L 0.2233

Appendix G. Dataset 2

Table A2. High-voltage power transformers data.
i123456789101112
t i 0.350.210.450.240.310.250.290.240.340.330.450.37
δ i 212323222201
ν i 000000000000
τ i L 0.190.160.180.180.190.180.160.200.170.180.170.17
i131415161718192021222324
t i 0.210.210.300.280.200.350.470.420.280.320.290.26
δ i 223223011231
ν i 000000000000
τ i L 0.200.170.170.160.190.200.190.200.200.190.190.20
i252627282930313233343536
t i 0.460.180.210.270.340.310.210.280.200.230.190.27
δ i 031221000000
ν i 000000111111
τ i L 0.180.160.170.200.180.17000000
i373839404142434445464748
t i 0.230.180.070.190.280.260.220.240.090.220.210.22
δ i 022300002000
ν i 111111111111
τ i L 000000000000
i495051525354555657585960
t i 0.220.240.170.250.200.200.230.220.200.260.230.20
δ i 002000000000
ν i 111111111111
τ i L 0000.0100000000
i616263646566676869707172
t i 0.220.280.220.240.180.210.210.250.230.100.190.19
δ i 202032002100
ν i 111111111111
τ i L 000000000000
i737475767778798081828384
t i 0.220.170.230.220.260.160.280.200.250.080.170.24
δ i 030001022120
ν i 111111111111
τ i L 000000000000
i858687888990919293949596
t i 0.280.260.140.110.220.220.260.190.240.280.200.22
δ i 002200000000
ν i 111111111111
τ i L 000000000000
i979899100
t i 0.140.260.260.19
δ i 3000
ν i 1111
τ i L 0000

References

  1. Mao, S.; Shi, Y.M. Exact inference for joint Type-I hybrid censoring model with exponential competing risks data. Acta. Math. Appl. Sin. 2017, 33, 645–658. [Google Scholar] [CrossRef]
  2. Varghese, A.S.; Vaidyanatha, V.S. Parameter estimation of Lindley step stress model with independent competing risk under Type-I censoring. Commun. Stat. Theor. Meth. 2020, 49, 3026–3043. [Google Scholar] [CrossRef]
  3. Davies, K.F.; Volterman, W. Progressively Type-II censored competing risks data from the linear exponential distribution. Commun. Stat. Theor. Meth. 2020, 1–17. [Google Scholar] [CrossRef]
  4. Lodhi, C.; Tripathi, Y.M.; Wang, L. Inference for a general family of inverted exponentiated distributions with partially observed competing risks under generalized progressive hybrid censoring. J. Stat. Comput. Simul. 2021, 91, 2503–2526. [Google Scholar] [CrossRef]
  5. Ren, J.; Gui, W. Statistical Analysis of Adaptive Type-II Progressively Censored Competing Risks for Weibull Models. App. Math. Model. 2021, 98, 323–342. [Google Scholar] [CrossRef]
  6. Crowder, M.J. Classical competing risks. In Classical Competing Risks; CRC Press: Boca Raton, FL, USA, 2001. [Google Scholar]
  7. Lin, D.Y.; Sun, W.; Ying, Z. Nonparametric estimation of the gap time distribution for serial events with censored data. Biometrika 1999, 86, 59–70. [Google Scholar] [CrossRef]
  8. Marshall, A.W.; Olkin, I. A multivariate exponential distribution. J. Am. Stat. Assoc. 1967, 62, 30–44. [Google Scholar] [CrossRef]
  9. Feizjavadian, S.H.; Hashemi, R. Analysis of dependent competing risks in the presence of progressive hybrid censoring using Marshall–Olkin bivariate Weibull distribution. Comput. Stat. Data Anal. 2015, 82, 19–34. [Google Scholar] [CrossRef]
  10. Paul, B.; Dey, A.K.; Kundu, D. Bayesian analysis of three parameter absolute continuous Marshall–Olkin bivariate Pareto distribution. Commun. Stat. Case Stud. Data Anal. Appl. 2018, 4, 57–68. [Google Scholar] [CrossRef]
  11. Shen, Y.; Xu, A. On the dependent competing risks using Marshall–Olkin bivariate Weibull model: Parameter estimation with different methods. Commun. Stat. Theor. Meth. 2018, 47, 5558–5572. [Google Scholar] [CrossRef]
  12. Wang, Y.; Shi, Y.M.; Wu, M. Statistical inference for dependence competing risks model under middle censoring. J. Syst. Engrg. Electron. 2019, 30, 209–222. [Google Scholar]
  13. Shen, P.S. Semiparametric analysis of transformation models with dependently left truncated and right censored data. Commun. Stat. Simul. Comput. 2017, 46, 2474–2487. [Google Scholar] [CrossRef]
  14. Zhao, M.; Jiang, H.; Zhou, Y. Estimation of percentile residual life function with left truncated and right censored data. Commun. Stat. Theor. Meth. 2017, 46, 995–1006. [Google Scholar] [CrossRef]
  15. Ranjan, R.; Sen, R.; Upadhyay, S.K. Bayes analysis of some important lifetime models using MCMC based approaches when the observations are left truncated and right censored. Reliab. Eng. Syst. Safe. 2021, 214, 10747. [Google Scholar] [CrossRef]
  16. Hong, Y.; Meeker, W.Q.; McCalley, J.D. Prediction of remaining life of power transformers based on left truncated and right censored lifetime data. Ann. Appl. Stat. 2009, 857–879. [Google Scholar] [CrossRef] [Green Version]
  17. Emura, T.; Shiu, S.K. Estimation and model selection for left truncated and right censored lifetime data with application to electric power transformers analysis. Commun. Stat. Simul. Comput. 2016, 45, 3171–3189. [Google Scholar] [CrossRef]
  18. Jiang, W.W.; Ye, Z.S.; Zhao, X.Q. Reliability estimation from left truncated and right censored data using splines. Stat. Sin. 2020, 30, 845–875. [Google Scholar]
  19. Kundu, D.; Mitra, D.; Ganguly, A. Analysis of left truncated and right censored competing risks data. Comput. Stat. Data Anal. 2017, 108, 12–26. [Google Scholar] [CrossRef]
  20. Pena, E.A.; Gupta, A.K. Bayes estimation for the Marshall–Olkin exponential distribution. J. R. Stat. Soc. B. 1990, 52, 379–389. [Google Scholar]
  21. Samanta, D.; Kundu, D. Bayesian inference of a dependent competing risk data. J. Stat. Comput. Simul. 2021, 91, 3069–3086. [Google Scholar] [CrossRef]
  22. Abdel-Hamid, A.H. Properties, estimations and predictions for a Poisson-half-logistic distribution based on progressively Type-II censored samples. App. Math. Model. 2016, 40, 7164–7181. [Google Scholar] [CrossRef]
  23. Ahmed, E.A. Estimation and prediction for the generalized inverted exponential distribution based on progressively first-failure-censored data with application. J. Appl. Stat. 2017, 44, 1576–1608. [Google Scholar] [CrossRef]
  24. Kotb, M.S.; Raqab, M.Z. Inference and prediction for modified Weibull distribution based on doubly censored samples. Math. Comput. Simul. 2017, 132, 195–207. [Google Scholar] [CrossRef]
  25. Zhang, C.; Shi, Y.M. Statistical prediction of failure times under generalized progressive hybrid censoring in a simple step-stress accelerated competing risks model. J. Syst. Engrg. Electron. 2017, 28, 282–291. [Google Scholar]
Figure 1. The PDF and CDF plots based on MOBR distribution with MLEs and BEs under Dataset 1.
Mathematics 09 02703 g001
Figure 2. The PDF and CDF plots based on MOBR distribution with MLEs and BEs under Dataset 2.
Mathematics 09 02703 g002
Table 1. ABs and MSEs (within bracket) for parameters without order restriction when ( σ 1 , σ 2 , σ 3 ) = ( 1.5 , 2 , 2.5 ) .
σ 1 σ 2 σ 3
nTRMLEBEMLEBEMLEBE
5020%0.35770.28270.41330.30840.46550.3221
[0.2039][0.1246][0.2744][0.1492][0.3423][0.1625]
40%0.37210.28280.44050.31150.49630.3243
[0.2254][0.1264][0.3208][0.1517][0.4105][0.1639]
60%0.47440.29140.64400.31690.76200.3333
[0.4676][0.1332][0.6986][0.1586][0.9613][0.1735]
8020%0.28130.23110.32550.25240.36880.2621
[0.1234][0.0832][0.1655][0.0993][0.2121][0.1071]
40%0.29910.23570.34750.25540.38390.2623
[0.1436][0.0867][0.1981][0.1027][0.2424][0.1084]
60%0.45350.24080.56230.26150.67930.2794
[0.3356][0.0915][0.5031][0.1072][0.7146][0.1224]
10020%0.24750.20430.29320.22700.33280.23781
[0.0962][0.0655][0.1339][0.0801][0.1723][0.0880]
40%0.26360.20850.30580.22620.35120.2395
[0.1120][0.0680][0.1505][0.0811][0.1995][0.0903]
60%0.42030.22300.52810.24350.64310.2615
[0.2837][0.0786][0.4337][0.0926][0.6297][0.1079]
Table 2. ABs and MSEs (within bracket) for parameters without order restriction when ( σ 1 , σ 2 , σ 3 ) = ( 1 , 1.3 , 2 ) .
σ 1 σ 2 σ 3
nTRMLEBEMLEBEMLEBE
5020%0.24200.19870.28450.21660.35390.2379
[0.0940][0.0615][0.1262][0.0745][0.1993][0.0895]
40%0.25500.19870.29190.21970.38170.2424
[0.1061][0.0622][0.1424][0.0750][0.2413][0.0915]
60%0.36060.21110.43270.23050.59900.2564
[0.2202][0.0701][0.3120][0.0835][0.5835][0.1024]
8020%0.19160.16250.22350.17920.28130.1980
[0.0579][0.0411][0.0786][0.0505][0.1243][0.0620]
40%0.20120.16350.23320.17960.29910.2021
[0.0655][0.0420][0.0879][0.0507][0.2435][0.0640]
60%0.30740.17710.37170.19390.53190.2258
[0.1555][0.0504][0.2217][0.0600][0.4375][0.0805]
10020%0.17190.14620.19800.16000.25460.1805
[0.0467][0.0338][0.0612][0.0402][0.0997][0.0510]
40%0.18170.14970.20810.16370.26770.1859
[0.0534][0.0352][0.0703][0.0422][0.1176][0.0539]
60%0.28270.16320.35230.18490.50690.2183
[0.1291][0.0426][0.1937][0.0537][0.3816][0.0746]
Table 3. ABs and MSEs (within bracket) for parameters with order restriction when ( σ 1 , σ 2 , σ 3 ) = ( 1.5 , 2 , 2.5 ) .
σ 1 σ 2 σ 3
nTRMLEBEMLEBEMLEBE
5020%0.32770.20160.38310.23010.46550.3290
[0.1670][0.0646][0.2408][0.0867][0.3423][0.1700]
40%0.33590.19870.41320.23560.49630.3332
[0.1791][0.0627][0.2925][0.0902][0.4105][0.1726]
60%0.47440.19230.64400.25190.76200.3403
[0.3696][0.0589][0.7006][0.1045][0.9613][0.1810]
8020%0.26330.15760.30550.18000.36880.2700
[0.1070][0.0399][0.1461][0.0526][0.2121][0.1140]
40%0.27760.15630.33050.18570.38390.2692
[0.1209][0.0392][0.1826][0.0559][0.2424][0.1143]
60%0.42580.15570.56540.20760.67930.2866
[0.2857][0.0387][0.5080][0.0703][0.7146][0.1295]
10020%0.13900.08620.16260.12130.24480.1723
[0.0862][0.0310][0.1213][0.0425][0.1723][0.0934]
40%0.24820.13860.29320.16400.35120.2459
[0.0976][0.0308][0.1403][0.0440][0.1995][0.0955]
60%0.39880.14580.53090.19190.64310.2680
[0.2473][0.0333][0.4365][0.0596][0.6297][0.1141]
Table 4. ABs and MSEs (within bracket) for parameters with order restriction when ( σ 1 , σ 2 , σ 3 ) = ( 1 , 1.3 , 2 ) .
σ 1 σ 2 σ 3
nTRMLEBEMLEBEMLEBE
5020%0.22070.14980.26140.16860.35390.2427
[0.0762][0.0348][0.1087][0.0466][0.1993][0.0933]
40%0.22780.14710.27310.17300.38170.2467
[0.0815][0.0336][0.1289][0.0491][0.2413][0.0951]
60%0.31940.14160.43390.19940.59900.2620
[0.1659][0.0313][0.3149][0.0633][0.5835][0.1075]
8020%0.17790.11970.20770.13290.28130.2030
[0.0493][0.0225][0.0684][0.0290][0.1243][0.0654]
40%0.18410.11630.22000.14020.29910.2066
[0.0535][0.0212][0.0802][0.0321][0.1456][0.0668]
60%0.28280.11380.37470.17150.53190.2302
[0.1270][0.0205][0.2243][0.0468][0.4375][0.0840]
10020%0.16180.10660.18670.1190.25460.1851
[0.0410][0.0182][0.0546][0.0234][0.0997][0.0537]
40%0.16820.10480.19760.12670.26770.1898
[0.0446][0.0174][0.0646][0.0262][0.1176][0.0565]
60%0.26520.10760.35370.16380.50690.2222
[0.1104][0.0184][0.1950][0.0421][0.3816][0.0776]
Table 5. ALs and CPs (within bracket) for parameters without order restriction when ( σ 1 , σ 2 , σ 3 ) = ( 1.5 , 2 , 2.5 ) .
σ 1 σ 2 σ 3
nTRACIHPDACIHPDACIHPD
5020%2.23361.40662.97801.53103.71821.6287
[0.9569][0.9494][0.9763][0.9446][0.9899][0.9528]
40%2.45011.41653.26951.54074.09971.6407
[0.9718][0.9588][0.9865][0.9461][0.9939][0.9548]
60%3.24671.44374.32191.57015.40621.6708
[0.9860][0.9573][0.9949][0.9450][0.9986][0.9523]
8020%1.68191.14692.22781.24742.80151.3341
[0.9605][0.9515][0.9793][0.9479][0.9913][0.9571]
40%1.83991.15762.45831.26303.06851.3484
[0.9750][0.9521][0.9887][0.9446][0.9951][0.9575]
60%2.43791.19093.23151.29934.05291.3868
[0.9748][0.9584][0.9898][0.9533][0.9960][0.9525]
10020%1.48281.03811.97881.13412.46461.2122
[0.9641][0.9529][0.9819][0.9528][0.9907][0.9549]
40%1.62631.05182.15641.14572.70361.2277
[0.9790][0.9566][0.9900][0.9536][0.9950][0.9552]
60%2.12911.08652.83941.18583.55481.2699
[0.9670][0.9509][0.9829][0.9527][0.9916][0.9485]
Table 6. ALs and CPs (within bracket) for parameters without order restriction when ( σ 1 , σ 2 , σ 3 ) = ( 1 , 1.3 , 2 ) .
σ 1 σ 2 σ 3
nTRACIHPDACIHPDACIHPD
5020%1.22740.99091.59611.08032.45671.2363
[0.9216][0.9529][0.9471][0.9445][0.9792][0.9572]
40%1.33881.00161.74681.09382.69541.2512
[0.9373][0.9549][0.9630][0.9479][0.9877][0.9604]
60%1.78141.03662.32001.13173.56461.2927
[0.9398][0.9580][0.9705][0.9507][0.9936][0.9564]
8020%0.93520.80961.21480.88421.86951.0221
[0.9222][0.9522][0.9461][0.9407][0.9803][0.9549]
40%1.01780.82251.32790.89942.04581.0401
[0.9405][0.9542][0.9672][0.9503][0.9914][0.9590]
60%1.35230.86451.75350.94402.70091.0908
[0.9156][0.9529][0.9491][0.9504][0.9796][0.9479]
10020%0.82360.73261.07780.80381.64960.9325
[0.9198][0.9483][0.9551][0.9495][0.9803][0.9565]
40%0.90380.74801.17460.81841.81070.9516
[0.9416][0.9562][0.9666][0.9512][0.9905][0.9576]
60%1.18420.79051.54510.86642.37621.0068
[0.9038][0.9522][0.9313][0.9475][0.9683][0.9412]
Table 7. ALs and CPs (within bracket) for parameters with order restriction when ( σ 1 , σ 2 , σ 3 ) = ( 1.5 , 2 , 2.5 ) .
σ 1 σ 2 σ 3
nTRACIHPDACIHPDACIHPD
5020%2.13730.98853.08721.31423.71821.7206
[0.9572][0.9662][0.9936][0.9825][0.9899][0.9358]
40%2.34610.99583.38721.32394.09971.7315
[0.9724][0.9696][0.9964][0.9844][0.9939][0.9380]
60%3.10781.01374.47991.34495.40621.7596
[0.9907][0.9749][0.9971][0.9821][0.9986][0.9411]
8020%1.64050.82892.27271.10202.80151.4584
[0.9615][0.9746][0.9923][0.9742][0.9913][0.9422]
40%1.79490.83762.50711.11033.06851.4714
[0.9779][0.9718][0.9963][0.9761][0.9951][0.9433]
60%2.38210.86203.31321.13724.06351.5053
[0.9870][0.9691][0.9905][0.9840][0.9960][0.9457]
10020%1.45860.76382.00481.01892.46461.3472
[0.9650][0.9743][0.9911][0.9655][0.9907][0.9431]
40%1.59930.77202.18521.02882.70361.3626
[0.9808][0.9756][0.9964][0.9728][0.9950][0.9474]
60%2.09130.79802.88001.05613.55481.4035
[0.9807][0.9631][0.9835][0.9829][0.9916][0.9476]
Table 8. ALs and CPs (within bracket) for parameters with order restriction when ( σ 1 , σ 2 , σ 3 ) = ( 1 , 1.3 , 2 ) .
σ 1 σ 2 σ 3
nTRACIHPDACIHPDACIHPD
5020%1.16630.71011.66560.82672.45671.1797
[0.9262][0.9615][0.9824][0.9562][0.9792][0.9063]
40%1.27240.71761.82240.83612.69541.1930
[0.9440][0.9636][0.9865][0.9597][0.9877][0.9096]
60%1.68960.74382.42490.86453.56461.2351
[0.9647][0.9661][0.9768][0.9480][0.9936][0.9100]
8020%0.90700.60001.24550.67291.86950.9861
[0.9276][0.9610][0.9741][0.9482][0.9803][0.9073]
40%0.98780.60921.36060.68302.04581.0041
[0.9488][0.9607][0.9841][0.9536][0.9914][0.9078]
60%1.31180.64011.79800.71742.70091.0527
[0.9398][0.9585][0.9523][0.9480][0.9796][0.9049]
10020%0.80610.55181.09660.60901.64960.9055
[0.9259][0.9622][0.9751][0.9320][0.9803][0.9084]
40%0.88330.56241.19670.62161.81070.9257
[0.9527][0.9623][0.9813][0.9448][0.9905][0.9057]
60%1.15890.59501.57240.65692.37620.9784
[0.9273][0.9378][0.9343][0.9494][0.9683][0.9095]
Table 9. Estimates for unknown parameters under Diabetic retinopathy data.
ParameterMLE [ESE]BE [ESE]ACI [Length]HPD [Length]
σ 1 0.5342 [0.1010]0.5292 [0.0366](0.4661,0.6023) [0.1362](0.4427,0.5761) [0.1334]
σ 2 0.5723 [0.1045]0.5668 [0.0369](0.5019,0.6428) [0.1045](0.4774,0.6159) [0.0369]
σ 3 0.1908 [0.0603]0.2003 [0.0269](0.1501,0.2315) [0.0603](0.1502,0.2295) [0.0269]
Table 10. Prediction under Diabetic retinopathy data.
iLPPBPLPIBPI
151.18221.7174(0.8790,1.5704)(0.7932,1.7819)
311.16421.7020(0.8545,1.5569)(0.7869,1.7906)
651.17261.7092(0.8660,1.5632)(0.7899,1.7866)
Table 11. Estimates for unknown parameters under high-voltage power transformers data.
ParameterMLE [ESE]BE [ESE]ACI [Length]HPD [Length]
σ 1 4.1205 [1.3030]3.9760 [0.4878](3.2416,4.9994) [1.7578](2.9046,4.5173) [1.6127]
σ 2 11.1253 [2.1411]10.6770 [0.5888](9.6812,12.5694) [2.8882](8.9477,11.6209) [2.6732]
σ 3 4.1205 [1.3030]3.9644 [0.4878](3.2416,4.9994) [1.7578](2.7957,4.3822) [1.5865]
Table 12. Prediction results under high-voltage power transformers data.
iLPPBPLPIBPI
950.33400.4939(0.2640,0.4280)(0.2259,0.4814)
960.34640.5038(0.2795,0.4377)(0.2300,0.4758)
990.37310.5252(0.3119,0.4591)(0.2387,0.4640)
1000.32820.4892(0.2565,0.4234)(0.2239,0.4841)
Publisher’s Note: MDPI stays neutral with regard to jurisdictional claims in published maps and institutional affiliations.

