Article

Exploring an Efficient POI Recommendation Model Based on User Characteristics and Spatial-Temporal Factors

1
School of Business Administration, Zhejiang Gongshang University, Hangzhou 310018, China
2
Modern Business Research Center, Zhejiang Gongshang University, Hangzhou 310018, China
3
Academe of Zhejiang Culture Industry Innovation & Development, Zhejiang Gongshang University, Hangzhou 310018, China
4
School of Computer Science and Information Engineering, Zhejiang Gongshang University, Hangzhou 310018, China
5
School of Management and E-Business, Zhejiang Gongshang University, Hangzhou 310018, China
*
Author to whom correspondence should be addressed.
Mathematics 2021, 9(21), 2673; https://doi.org/10.3390/math9212673
Submission received: 1 September 2021 / Revised: 14 October 2021 / Accepted: 20 October 2021 / Published: 21 October 2021
(This article belongs to the Section Mathematics and Computer Science)

Abstract

:
The advent of mobile scenario-based consumption popularizes and gradually maturates the application of point of interest (POI) recommendation services based on geographical location. However, the insufficient fusion of heterogeneous data in the current POI recommendation services leads to poor recommendation quality. In this paper, we propose a novel hybrid POI recommendation model (NHRM) based on user characteristics and spatial-temporal factors to enhance the recommendation effect. The proposed model contains three sub-models. The first model considers user preferences, forgetting characteristics, user influence, and trajectories. The second model studies the impact of the correlation between the locations of POIs and calculates the check-in probability of POI with the two-dimensional kernel density estimation method. The third model analyzes the influence of category of POI. Consequently, the above results were combined and top-K POIs were recommended to target users. The experimental results on Yelp and Meituan data sets showed that the recommendation performance of our method is superior to some other methods, and the problems of cold-start and data sparsity are alleviated to a certain extent.

1. Introduction

With the prevalence of smart mobile devices, location-based social networks (LBSNs) such as Foursquare, Gowalla, and Yelp have grown rapidly and become increasingly popular in recent years [1]. These platforms have offered users a way to share their life experiences in the form of a check-in. As a result, a large amount of user movement information can be obtained from the LBSNs, which provide a great opportunity to better analyze user behavior and preferences for a point of interest (POI) [2,3]. The POI recommendation service is designed to recommend the POIs and corresponding products to users and meets the potential needs of users, enhancing user experience to a certain extent eventually. Nowadays, in the mobile scenario-based consumption, it is a run-of-the-mill practice of sharing one’s personal experiences, comments, scores, and moods at various POIs on localized service platforms when users check-in at restaurants, bars, shopping malls, museums, art galleries, and parks to evaluate services and share experiences. The personalized POI recommendation services integrated with situational stimulation based on mining and analyzing users’ massive check-in information, comments, and relevant behavior are favored by service providers. In order to better increase user experience in mobile scenarios, the industry and academia focus on how to improve the quality of POI recommendation service, stimulate new consumption vitality, and meet the accurate and diverse needs of users.
Most of the existing POI recommendation methods are based on the following factors to analyze user preferences and calculate personalized recommendation results. (1) Historical scoring and comments. The visited POIs are customarily scored and commented, which is revealing in the user’s preference for a certain POI intuitively. Ren et al. [4] proposed a joint probability generation model named GTSCP to simulate the decision-making process of a user’s checked-in behavior, while effectively disposing of data sparsity. Xiong et al. [5] proposed a method of POI recommendation of Communication-Based Social Networks (CBSNs), an approach that portrayed users’ interests by integrating user relationships and potential emotions in user comments at the same time as getting rid of the untrustworthy issue in LBSNs. (2) Geographical location. The geographical location of the POI has a close bearing on the user’s checked-in behavior [6]. (3) The category of POI. Generally, each POI belongs to a category, and this category factor significantly affects the user’s activities. Zhang et al. [7] developed a new hierarchical category transformation (HCT) framework, which employed transformation among different levels of the category to capture users’ preferences under different categories and utilizes the hierarchical dependency between POI and categories to figure out cold start. (4) Multidimensional factors. Some scholars proposed POI recommendation methods based on check-in scoring, geographical location, and check-in time [3,8].
However, current research on POI recommendation rarely conducts more in-depth studies on complex factors of users (i.e., considers a single factor or uses a single model based on many factors). In addition, it does not perform additional subdivision of important factors (i.e., considers influence of these factors on fine dimensions). Therefore, it is essential to address the problems that the current POI recommendation methods are insufficient for users’ multi-source heterogeneous data fusion, which leads to poor recommendation quality. This paper proposes a hybrid POI recommendation model integrating users’ characteristics and space-time factors. The proposed model consists of three sub-models. The first model considers factors including user preference, user influence, forgetting characteristics, and historical trajectory. The second model refines the recommendation by looking into the correlation between the positions of POI, which are not considered in the first model and calculates the visit probability of POI. The third model produces corresponding recommendation results by weighting the POI category preference. Subsequently, the above recommendation results are fused and top-K POIs are recommended to the target users. Compared with the current POI recommendation models, we not only considered many factors on fine-dimensions, but also used complementary sub-models to achieve high quality POI recommendation. The experimental results showed that the proposed method improves the accuracy of recommended results and alleviates the problems of cold-start and data sparsity to a certain extent. Theoretically, our study contributes to the effective usage of multidimensional data science and analytics for POI recommender system design. In practice, our results can be used to improve the quality of personalized POI recommendation services for websites and applications.
The contributions of this paper are as follows:
(1)
A hybrid POI recommendation model is proposed, which fully considers user preference, user influence, forgetting characteristics, trajectory, geographic location relevance, and category.
(2)
A method to quantify the emotion of a user’s comment is suggested, regarding the influence of the emotional degree and emotional polarity of the comment text.
(3)
Aiming at the feature that the user’s preference on POI visited recently is higher than that one visited previously, an effective forgetting function is proposed.
(4)
Considering the correlation between the locations of POIs, a two-dimensional kernel density estimation function is used to estimate the individualized two-dimensional check-in probability density of each user and to obtain the probability.
(5)
The influence of the POI categories on the user’s check-in behavior is analyzed. Weighting the POI category preference to calculate the user’s preference for the category is performed afterward.

2. Literature Review

In recent years, POI recommendation is in vogue in the field of personalized recommendation. Traditional personalized recommendation methods are widely migrated and applied to POI recommendations. Scholars have proposed POI recommendation methods based on collaborative filtering technology [9,10,11,12], content-based POI recommendation methods [13,14,15], location-based social network POI recommendation methods [16,17,18,19], etc.
The POI recommendation method based on collaborative filtering technology calculates the user’s preference for POI through mining and analyzing the user’s check-in information, thus generating recommendation results [20]. Common methods include [21] memory-based collaborative filtering recommendation method and model-based collaborative filtering recommendation method. Memory-based collaborative filtering method uses check-in data to calculate the similarity between users or POIs, thus generating recommendation results. Model-based collaborative filtering [22,23,24] usually uses matrix decomposition technology to construct a “user-POI” matrix, analyze the correlation between the two, and express each user and POI as a K-dimensional potential vector, respectively. Wang et al. [9] proposed a trust-enhanced user similarity calculation method based on network representation learning, which combined the preference of trust-enhanced users for potential POI with the influence of POI’s geography and check-in time. Xu [25] proposed a novel recommendation method based on the MapReduce framework, which considered many factors and improved the collaborative filtering model through a novel similarity calculation process. Si et al. [26] used the K-means algorithm to divide users into active users and inactive users, taking into account the influence of users’ check-in time characteristics, and made POIs’ recommendations based on the collaborative filtering method. Xu [27] proposed a novel recommendation method based on matrix decomposition technology of social networks by clustering users and considering various complex factors. Zhang et al. [28] proposed a new approach, called LORE, to exploit sequential influence on location recommendations. First, LORE incrementally mined sequential patterns from location sequences and represented the sequential patterns as a dynamic Location-Location Transition Graph.
Content-based POI recommendation is used to judge the user’s preference by analyzing the user’s data (such as gender and age) and location characteristics (such as tags and categories), thus making a recommendation [20]. Ren et al. [29] proposed a context-aware POI recommendation probability matrix factorization method. This method effectively integrated context information, geographic information, social information, category information, and popular information. Xu et al. [30] considered seasonal and weather background information in the mining and recommendation process, and proposed a POI recommendation method based on the historical theme distribution of users traveling in other cities and given environmental information. Kolahkaj et al. [31] used the dynamic context modeling method to integrate context information into the recommendation process that would provide dynamic tourism recommendations for tourists according to their current context information. Gavalas and Kenteris [32] combined context information (such as the current user’s location, time, weather conditions, and places that the user has visited) to expand collaborative filtering technology, thus improving the recommendation system in a pervasive environment. Xu et al. [33] established an improved trust relationship measurement method by determining direct and indirect trust relationships and then integrated the comprehensive trust relationship, user preferences, check-in time, and geographical location into the matrix decomposition model.
The POI recommendation method based on location social network refers to understanding user behaviors and preferences through location information in a new heterogeneous network and recommending POI that users may be interested in [34]. POI recommendations using user check-in history are usually influenced by many factors such as geography, time, sequence, and society [35]. Liu et al. [36] proposed a recommendation method based on geographic time perception hierarchical attention network (GT-HAN). They established a “geography-time” attention network to reveal the relationship between the overall sequence dependence and different POIs and adaptively selected relevant check-in activities from the check-in history to learn users’ preferences so that GT-HAN could distinguish users’ preferences for different POIs. Xiong et al. [5] proposed a latent probabilistic generative model called HI-LDA (Heterogeneous Information-based LDA), which could accurately capture users’ words on CBSNs by taking into full consideration the information on LBSNs including geographical effect as well as the abundant information including social relationship, users’ interactive behaviors, and comment content. Zhao et al. [37] proposed a POI mining method and a personalized recommendation model by fusing sentimental spatial context and geographical attributes of location. Rong et al. [38] proposed a novel POI recommendation approach called GeoEISo. The support vector regression (SVR) model based on Gaussian radial basis kernel function was used to predict the explicit trust value between users, and then a novel trust-based recommendation model was proposed, which introduced explicit and implicit social trust information into the POI recommendation process at the same time.
To sum up, the POI recommendation methods mentioned above analyze user-related context information from different dimensions and provide more accurate recommendation results to a certain extent. Some integrate social relationship, geographical information, and temporal information into the recommendation method to improve recommendation quality, while others consider user profiles and check-in features to improve the accuracy of the recommendation results. However, they lack the study of fine-grained factors and their correlations, as well as constructing a single model. Therefore, the recommendation effect needs further enhancement.

3. Hybrid POI Recommendation Model

To tackle the defect of existing methods, this paper proposes a novel hybrid POI recommendation model (NHRM) that integrates user characteristics and space-time factors. The model framework is shown in Figure 1. The model consists of three sub-models. The first model considers the influence of user preference, user influence, forgetting characteristics, and trajectory on the selection of POI, calculates user similarity based on collaborative filtering method, and generates corresponding recommendation results. The second model considers the influence of the correlation among the geographical locations of POI on the selection of POI, introduces a two-dimensional kernel density estimation method to calculate the visit probability of users to POI, and generates corresponding recommendation results. The third model analyzes the influence of POI category on POI selection and generates corresponding recommendation results by weighting the POI category preference. Finally, the above recommendation results are fused and top-K POIs are recommended to the target users.

3.1. POI Recommendation Sub-Model Integrated with Multidimensional Factors

This model considers the influence of user preference, user influence, forgetting characteristics, and trajectory on the selection of POI, calculates user similarity based on the collaborative filtering method, and generates corresponding recommendation results.

3.1.1. User Preference Analysis Based on Historical Scores and Comments

This paper analyzes users’ overall preferences for a certain POI from two dimensions: user history score and comment. Regarding the quantitative calculation of user comment information, this paper employs emotion scores to reflect user comment preference. The user’s emotion is divided into five levels for emotional degree, ranging from 1–5 points. At the same time, we set the emotion polarity of 1 for positive emotions and 2 for negative emotions.
Firstly, the emotional words in the comments are assigned corresponding values (1–5 points) according to the emotional degree. Then, based on emotion polarity, positive emotions are given positive values and negative emotions are given negative values. In view of the situation that negative words are placed before emotional words, the final emotion score of the user will be calculated by multiplying the emotion score by a certain negative value. (1) When the emotional words are positive emotions, namely, that the emotion score is 1 to 5 points, and when the emotion score is 4 points or more, we multiply the emotion score by −1 to obtain the final emotion score. If the emotion score is less than 3, multiply the emotion score by −0.5. (2) when that emotional word is a negative emotion, namely, that the emotion score is −5 to −1, and when the emotion score is −4 or lower, we multiply the emotion score by −1 to obtain the final emotion score. If the emotion score is greater than −3, multiply the emotion score by −0.5. Consider some special circumstances, that is, the use of negative words reverses the emotion polarity slightly. For example, there are extreme positive (negative) adjectives after negative words. Such as, if the emotion score of “Abundant” is 3, the score of “not abundant” is not directly reversed to −3, but multiplied by the weight of −0.5 to get −1.5. Consequently, the influence of modal verbs in the commentary text will be analyzed. In other words, the use of modal verbs will weaken the emotion degree of the commentary, such as words like “possible”. In this paper, the emotion score is multiplied by 0.5 to weaken the corresponding emotion degree. An example of affective analysis is shown in Table 1.
Based on the above principles, we perform word segmentation processing and emotion score calculation on the user’s comment information. The emotion score of user comments is determined by all emotional words in the comments. Assuming that the comment contains δ emotional word, the emotion score of user u for the comment of POI l is:
R u l = i = 1 l E m o t i o n a l s c o r e w o r d δ c o u n t w o r d  
By integrating user comments and scores, the comprehensive preference score of users for a certain POI is obtained, and the calculation formula is as follows:
R u l ¯ = R u l + R u l
where R u l ¯ is the comprehensive preference score of user u to POI l, R u l is the historical score of the user u to POI l, and R u l is the emotion score of the user u to POI l.

3.1.2. User Influence Calculation

This paper introduces the influence of user authority and user comment to measure the comprehensive influence of users. The calculation formula of user comprehensive influence is as follows:
U I v = ρ A I v + ϱ C I v
ρ + ϱ = 1
where A I v indicates the user authority influence score, C I v represents the score of user’s comment influence, and ρ , ϱ are adjustable parameters.
User authority influence A I refers to the influence of a user on other users on social platforms. In each social platform, the platform side will give users a certain identity rank based on the usage of users in various aspects of the platform. Generally speaking, the users ranked high have a longer platform service life and are more active in speaking and participating than users ranked low. The users who manage their social accounts attentively will have a higher rank and may have a higher influence on others. In the analysis of users of a series of localized life service platforms such as ‘Dianping’, this paper finds that these platforms will give authoritative ratings to users. According to the comprehensive usage and influence of users, they divide users into non-members and VIP users, and among VIP users, they are further divided into VIP users with different stars. For users with a higher star rating, they will have a stable fan base, and the quality of comments on POIs will be higher. When high-rank users send out high-quality comments, the authority will give more traffic to make them receive more attention correspondingly. Therefore, the authoritative influence calculation formula of user v is:
A I v = v i p v τ   ,       v   m e a n s   a   V I P   u s e r 0         ,                                                           o t h e r s
where v i p v represents the star rating or score of the VIP user and τ stands for the highest VIP grade or score for social platforms. For example, ‘Dianping’ divides VIP users into eight grades: lv1–lv8, when τ = 8 .
User comment influence   C I refers to the degree of influence of comments sent by users on the platform on other users. Generally speaking, the higher the enthusiasm of users to check in and comment on POIs, the higher the quality of the comments, the more users will give a thumbs-up, review, and favorite the comments. The comment information will spread faster also in social networks and its influence will be greater. This paper introduces the number of thumbs-up of user comments to measure the influence of user comments. The more thumbs-up, the greater the influence of this comment.
M T v = ξ = 1 δ M T v , ξ δ
where M T v represents the average number of thumbs-up of user v and M T v , ξ indicates the number of thumbs-up of the ξ -th comment of user v, while δ refers to the number of comments sent by users. Then the formula C I v for calculating the comment influence score of user v is as follows:
C I v = M T v M T m i n M T m a x M T m i n
where M T m i n represents the minimum of the average thumbs-up number for all users’ comments and M T m a x is the maximum of the average thumbs-up number for all users’ comments.

3.1.3. User Trajectory Similarity

The user’s trajectory can reflect the range and preference of the user’s frequent activities. In this paper, the trajectory similarity of users is calculated based on the geographical coordinates of m POIs recently visited by users. Assuming that the geographical location of the POI is expressed by longitude and latitude, the trajectory of a certain user u can be expressed as L u = l u 1 , l u 2 , l u m ,   l u i = l a t   α u i , l o n   β u i . The trajectory similarity of user u and user v is calculated as follows:
s i m t r a c k u , v = 1 i = 1 n d l u i ,   l v i
While
d l u i ,   l v i = 2 R a r c s i n s i n 2 l a t   α u i l a t   α v i 2 + c o s l a t   α u i c o s l a t   α v i s i n 2 l o n   β u i l o n   β v i 2
R stands for the radius of the earth.

3.1.4. User Similarity Based on Multidimensional Factors

After analyzing users’ historical scores and comments, the comprehensive preference of users for POIs is calculated. Considering that the user’s interest will vary with time, an effective forgetting function is proposed, which reflects the forgetting characteristics. The formula is as follows:
f u t , l = d · s i n a t i t m i n t m a x t m i n + b
where d = 4.278, a = 0.26, b = 0. 007731, and the above values are obtained by fitting a user forgetting curve. The t i denotes the check-in time of ith POI and t m i n and t m a x show the earliest and latest check-in times of all selected POIs, respectively.
Subsequently, this paper integrates user preferences, forgetting characteristics, user influence, and trajectory into similarity calculation. The specific formula is as follows:
s i m u v = l ϵ L R u l · f u t , l · R v l · f v t , l l ϵ L ( R u l · f u t , l ) 2 · l ϵ L ( R v l · f v t , l ) 2 · s i m t r a c k u , v · U I v
In this paper, P u j shows the final preference of the target user u to the POI j, and the calculation formula is as follows:
P u j = v U , v u s i m u v c v j
where s i m u v represents the similarity between the user u and the user v and c v j represents the check-in behaviors of the user v to the POI j. If the POI j has been visited by the user v, then   C v j = 1 . If the POI j is not visited by the user v, then C u l = 0 . We can arrange the POIs so that the target user has not checked-in from large to small, according to the corresponding preference degree, and generate a final recommendation.

3.2. Recommendation of Sub-Model Based on the Position Correlation among POIs

The correlation between the positions of POIs will also affect the selection of POIs. We use the two-dimensional kernel density estimation method to model the user’s two-dimensional geographical impact and estimate the density of the personalized two-dimensional check-in probability of each user. Kernel Density Estimation (KDE) [39] is a non-parametric estimation, which can learn the users historical check-in, estimate the unknown probability distribution to meet the personalized characteristics of the user’s check-in, and does not need to know the reference location or the user’s current location.
Given the user u, set L u = l 1 ,   l 2 ,   l 3 , ,   l m as the POI visited by the user, and each POI l i = l a t   α ,   l o n   β T is a two-dimensional vector, where l a t   α ,   l o n   β represents the longitude and latitude of the POI i ,   respectively. Kernel density estimation can be expressed as follows:
f x = 1 n σ 2 i = 1 n K x l i σ  
K (·) is a kernel function and σ is a smoothing parameter, named bandwidth. We use the standard two-dimensional kernel function:
K x = 1 2 π exp 1 2 x T x
and optimal bandwidth
σ = n 1 6 1 2 σ ^ T σ ^
where σ ^ is the marginal standard deviation of l u .
The probability of user u visiting the new location l k can be calculated as:
R g e o l k = 1 2 π n σ 2 i = 1 n e x p 1 2 σ 2 l k l i T l k l i
We sort the POIs that users have not visited according to the access probability from large to small to generate a final recommendation.

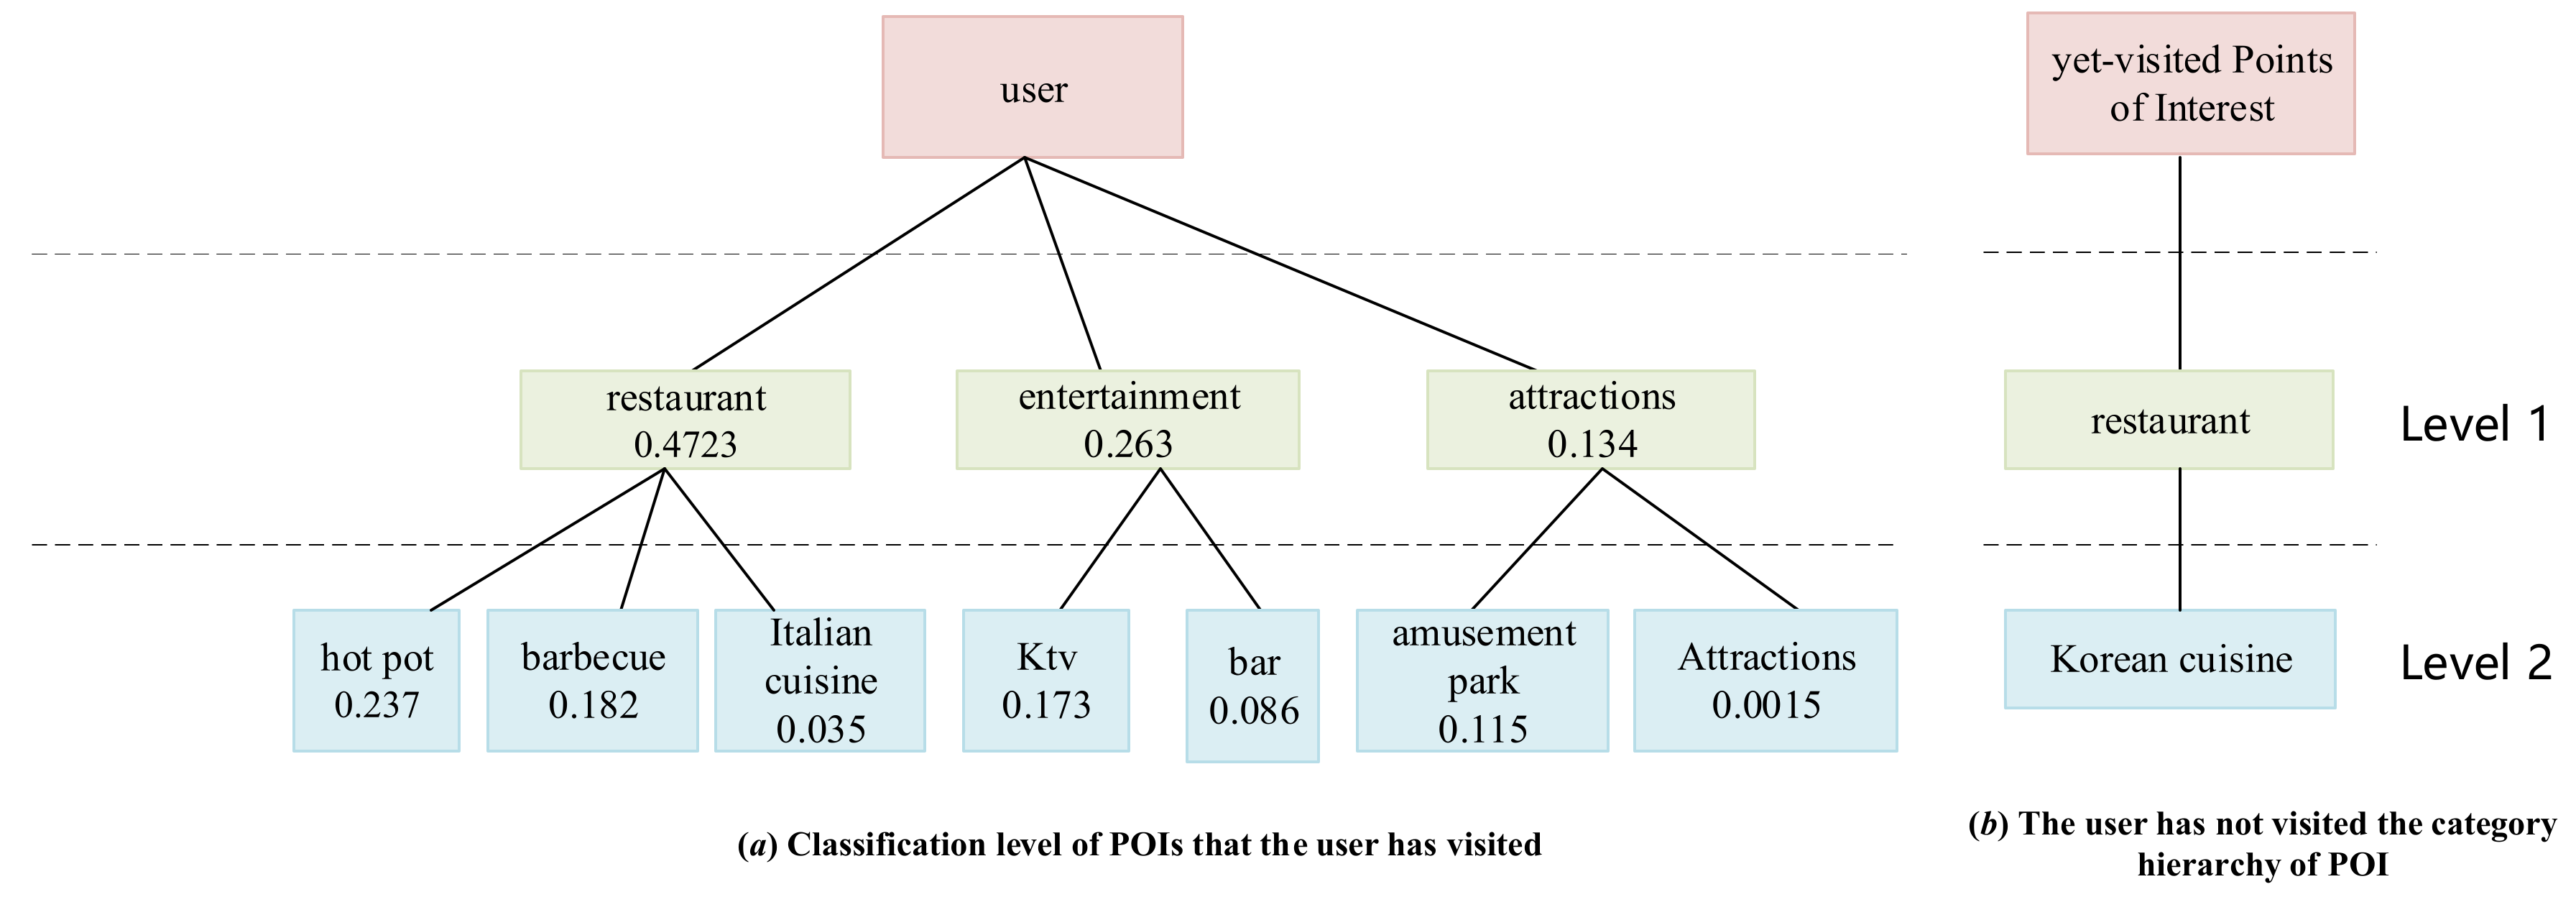
3.3. Recommendation of Sub-Model Based on POI Category

The categories of POIs selected by users can reflect users’ preferences to a great extent. Therefore, we can calculate the preference on the categories of POIs that users have visited to obtain the corresponding preference scores of different categories. According to the category preference score, the preference degree of POI that users have not visited is predicted, and the corresponding POI recommendation is implemented. Considering the influence differences of different levels of categories, this paper converts the categories of POIs visited by users into a two-layer TF-IDF tree. Each node in the tree represents the categories or subcategories of POI visited by users, and the corresponding value is the preference score (the value range is [0,1]). With a concrete example, given a target user and a POI that he or she has not visited, it is judged whether the POI is the POI that the target user is interested in. Assuming that the category of POI belongs to Korean cuisine, the category of POI visited by the user and the corresponding preference value is shown in Figure 2a. If only the sub-category layer (level 2) is considered, we may not recommend the POI to users because they have never visited the POI in this category, as shown in Figure 2b. However, considering that the user’s preference score for the parent category “restaurant” is 0.4723, which is higher than that of the other two categories, we believe that the user will be interested in this POI to a certain extent. In addition, we consider that the user’s preference for the parent category cannot fully represent his or her preference for the sub-category category, and there will also be cases where the user likes to go to various restaurants but does not like “Korean cuisine”. Therefore, we hold that the preference for the sub-category has a greater impact on the recommendation results, that is, the category level of the sub-level is higher.
Let c be a category in the hierarchical TF-IDF tree. Then, the preference score of the category is calculated as follows:
t f i d f c = n c n · l o g L L c
where n c is the number of visits to POIs of category c, n is the number of user visits to all POIs, L represents the number of POIs, and L c indicates the number of POIs of category c.
The user’s preference for a yet-visited POI can be calculated by weighting the preference value of its category. Given a POI l k , assume A = A 1 k A 2 k , , A H k is its category set, where H is the category level of l k and R c a t e l k stands for the user’s preference score for the POI l k . The formula is as follows:
R c a t e l k = h 1 , 2 , , H φ · t f i d f A h k
where φ = 1 2 H h represents the greater weight of the higher class level.
According to the preference scores of users at different POIs calculated, the recommendation results are generated after sorting from large to small.

3.4. Generate POI Recommendation Results

In this paper, a hybrid POI recommendation model integrating user characteristics and space-time factors is proposed, which consists of three sub-models. Model 1 integrates user preference, user influence, forgetting characteristics, and trajectory into similarity calculation, and then generates corresponding POI recommendation list list1. Model 2 considers the correlation between the locations of POI, introduces a two-dimensional kernel density estimation method, calculates the access probability of users to POI, and generates the corresponding recommendation list list2. Model 3 analyzes the influence of POI categories on users’ visit behavior and generates the corresponding recommendation list list3 by weighting the category preference of POI. Finally, the three recommendation lists are integrated to obtain the final recommendation result. The calculation formula is as follows:
R e c o m m e n d a t i o n   L i s t = α l i s t 1 + β l i s t 2 + γ l i s t 3
α + β + γ = 1  
Before integration, we assign the same value to the POIs in each recommendation list, and the value represents the order. Finally, the top-K POIs in the comprehensive recommendation list are recommended to the target users.

4. Experiment and Result Analysis

The experimental environment for this paper was the Windows 10 operating system, and Python was employed to realize the recommended method and comparison method proposed in this paper. In order to ensure the validity of the experiment, we applied cross-validation to test the performance of the POI recommendation methods. The cross-validation method used to conduct the experiments was k-fold cross-validation [39]. The procedure had a single parameter called k that referred to the number of groups that a given data sample was to be split into. In our experiment, we used 5-fold cross-validation, which means the results reported in this section are the mean values over five runs.

4.1. Experimental Preparation

4.1.1. Description of the Data Set

The experimental data adopted the benchmark data set Yelp (https://www.yelp.com/dataset, accessed on 10 February 2016) and the data set crawled from Meituan (https://www.meituan.com/, accessed on 15 January 2021) platform. The two data sets are described as follows.
Yelp is a well-known merchant review website in the United States, which includes merchants in restaurants, shopping centers, hotels, tourism, and other fields. Users can score merchants, submit comments, and exchange shopping experiences on the Yelp website. We used the open data set provided by the Yelp platform, which contains 30,887 users, 18,995 POIs, and 860,888 check-in records. Some data of Yelp are shown in Table 2.
Meituan is China’s leading e-commerce platform for life services, providing various life services such as gourmet restaurants, hotel tours, movie tickets, home decoration, beauty salons, sports, and fitness. Users can score, comment, and communicate with merchants on the platform. We crawled data of some merchants from January 2016 to May 2016. The data set contains 19,573 users, 10,682 POIs, and 467,887 check-in records. Some data of Meituan are shown in Table 3.

4.1.2. Recommended Effect Evaluation Metrics

In the experiment, we used four metrics to evaluate the accuracy of our proposed method: Precision, Recall, F-score, and Normalized Discount Cumulative Gain (nDCG). Each metric is specifically described as follows.
Precision: Indicates the probability of correctly predicting positive samples among samples predicted as positive samples. The higher the Precision is, the better the recommendation effect will be.
P r e c i s i o n   @   K = u R u T u K
Recall: Indicates the probability that the positive sample of the original sample is finally correctly predicted as a positive sample. The higher the Recall is, the better the recommendation effect will be.
R e c a l l   @   K = u R u T u T u
F-score: The Recall and Precision are weighed. The higher the F-score is, the better the recommendation effect will be.
F s c o r e   @   K = 2 P r e c i s i o n   @   K R e c a l l   @   K P r e c i s i o n   @   K + R e c a l l   @   K
nDCG: The evaluation used for ranking results reflects the accuracy of ranking. The higher the nDCG is, the better the recommendation effect will be. Assuming that we recommend k POIs, the calculation formula of n D C G k in the recommendation list is as follows:
C G k = i = 1 k r e l i
D C G k = i = 1 k 2 r e l i 1 l o g 2 i + 1
n D C G k = D C G k I D C G k
where CG (cumulative gain) is the cumulative gain, r e l i indicates the correlation or score of the i-th POI, DCG represents the discount cumulative gain, nDCGk is the normalized discount cumulative gain, and IDCG represents the discount cumulative gain under ideal conditions.

4.1.3. Comparison Method

We compared the method proposed in this paper (named NHRM) with the traditional and latest methods of recommending POIs. The comparison method is introduced as follows.
Pearson: This method utilizes the Pearson correlation coefficient to calculate the similarity between users and recommends POIs.
Matrix Factorization (MF): This method uses matrix factorization technology to recommend POIs.
CoRe [40]: This method combines geographical influence and social influence, and recommends POIs based on the check-in probability of each user on two-dimensional geographical coordinates.
UFC [41]: This method integrates user preferences, friend importance, and check-in relevance to recommend POIs to users.
DSPR [16]: This method adopts various context information (such as absolute time, the time for POI-POI conversion/distance and the type of POI) to explore users’ preferences and real-time requirements at the same time and proposes a new recommendation method for the next POI.

4.2. Experimental Results and Analysis

4.2.1. Parameters Determination

The method proposed in this paper involved five parameters, α , β , γ , ρ ,   and   ϱ . The value range was (0,1), and α + β + γ = 1 , ρ + ϱ = 1. In order to obtain the optimal parameter value, we took the F-score as the objective function and iteratively solved the optimal parameter value on the Yelp and Meituan data sets, respectively, where the iteration step size was set to 0.02. After iterative calculation, we found that when the parameter values α 0.63 ,   0.65 , β 0.21 ,   0.23 , γ 0.13   ,   0.15 , ρ 0.58   ,   0.61 , and ϱ 0.38   ,   0.41 , the F-score got the best value. Therefore, the values of the parameters in this paper are α = 0.64 , β = 0.22 , γ = 0.14 , ρ = 0.60 , ϱ = 0.40 .

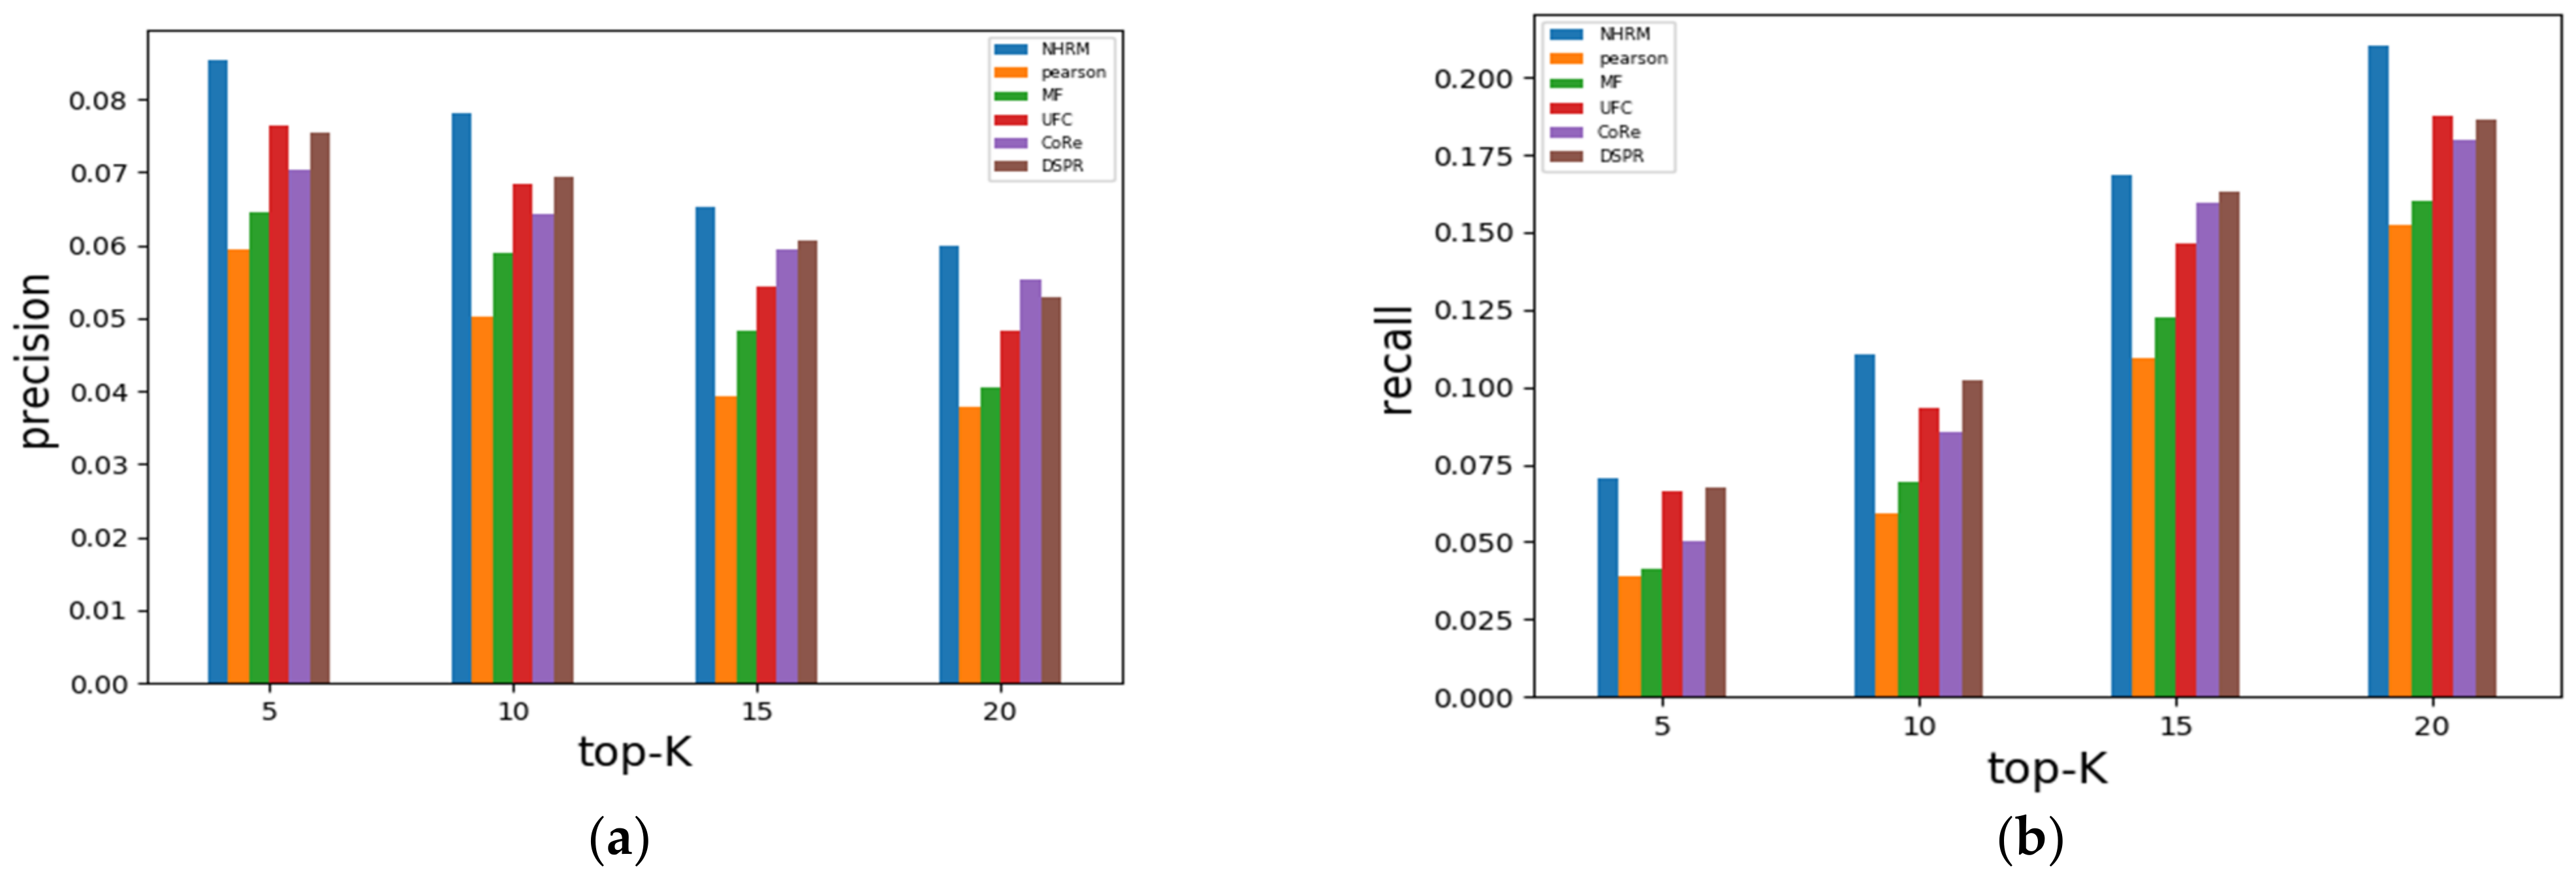
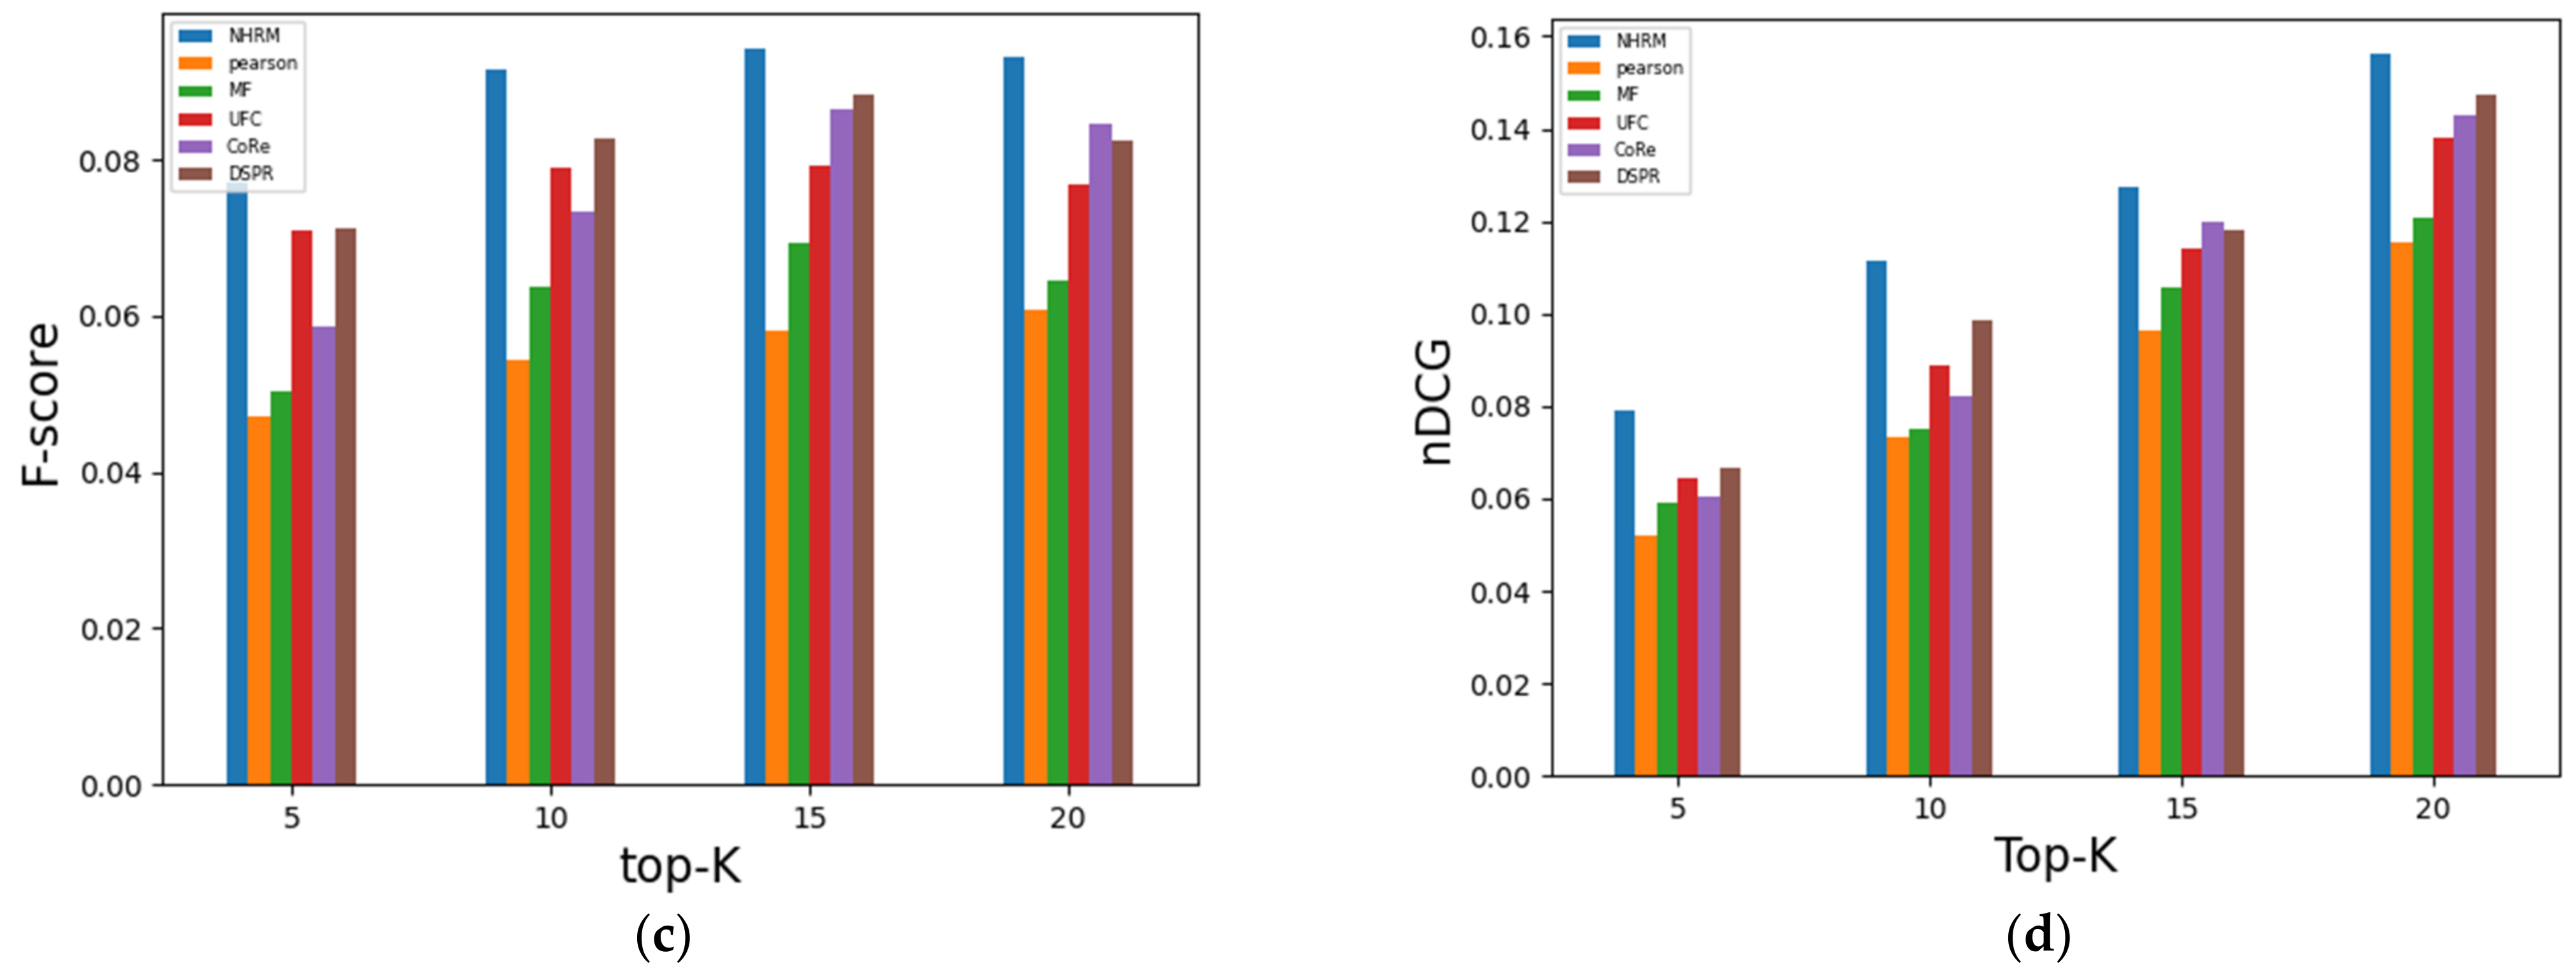
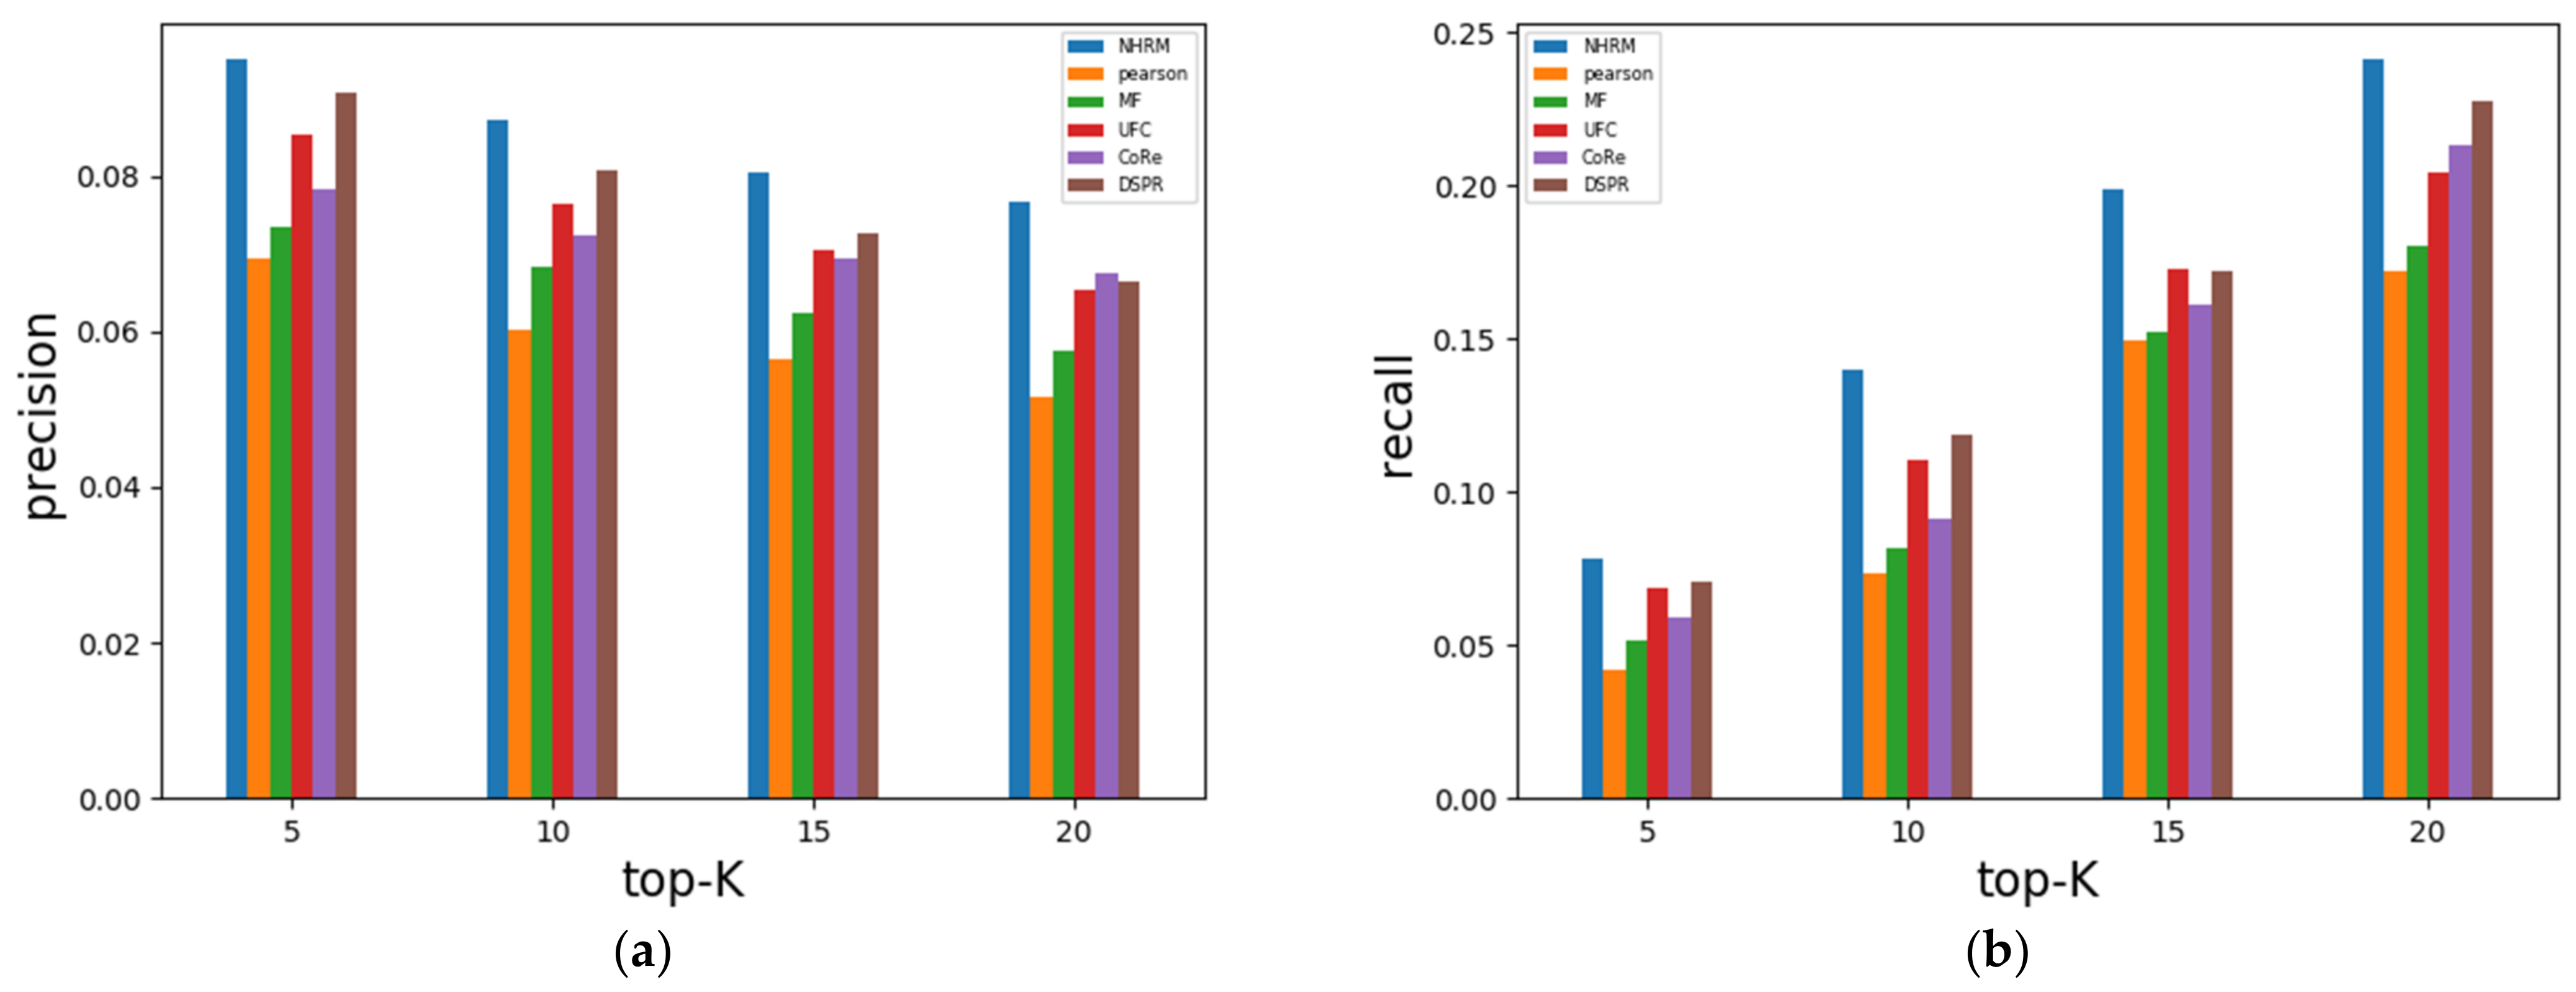
4.2.2. Results Analysis

In this paper, the performance of the method was investigated under different recommendation list lengths, that is, different POI recommendation numbers k. The recommendation numbers were set to 5, 10, 15, and 20. The experimental results of the method proposed in this paper and the comparison method are shown in Figure 3 and Figure 4.
It can be seen from Figure 3 that on the Yelp data set, when the recommended number was 15, compared with the Pearson, our method increased the Precision, Recall, F-score, and nDCG by 65.6%, 53.9%, 62.4%, and 31.9%, respectively. Compared with the MF, our method improved the Precision, Recall, F-score, and nDCG by 35.4%, 37.6%, 36.05%, and 20.4%, respectively. Compared with the UFC method, which combines user preference and check-in correlation, our method enhanced the Precision, Recall, F-score, and nDCG by 20.26%, 14.93%, 18.77%, and 11.7%, respectively. Compared with the CoRe, which combines geographical influence and social influence, our method refined the Precision, Recall, F-score, and nDCG by 10.12%, 5.78%, 8.91%, and 6.23%, respectively. Compared with the DSPR that uses context information to explore users’ preferences and real-time requirements at the same time, our method improved the Precision, Recall, F-score, and nDCG by 7.93%, 3.17%, 6.59%, and 8.02%, respectively. Similarly, when the recommended number was 5, 10, and 20, compared with the other five methods, our results were still the best.
Analysis of the results of Figure 4 showed that on the Meituan data set, when the recommended number was 15, compared with the Pearson, our method increased the Precision, Recall, F-score, and nDCG by 42.74%, 32.83%, 39.88%, and 35.02%, respectively. Compared with the MF, our method improved the Precision, Recall, F-score, and nDCG by 28.86%, 30.28%, 29.27%, and 22.78%, respectively. Compared with the UFC, our method upgraded the Precision, Recall, F-score, and nDCG by 14.21%, 15.03%, 14.45%, and 8.58%, respectively. Compared with the CoRe, our method improved the Precision, Recall, F-score, and nDCG by 15.99%, 22.94%, 17.99%, and 6.17%, respectively. Compared with the DSPR, our method increased the Precision, Recall, F-score, and nDCG by 10.75%, 15.16%, 12.02%, and 3.78%, respectively. Similarly, when the recommended number was 5, 10, and 20, compared with the other five methods, our results were still the best.
After analyzing the characteristics of the Pearson and the MF, it was seen that the Pearson only considers the user’s check-in score information and MF only uses the information of users and POIs but fails to fuse other useful information. However, our method not only integrates factors such as user preference, user influence, historical trajectory, and forgetting characteristics, but also considers the correlation between geographical locations of POI and the influence of POI categories. Therefore, the recommendation effect of our method is far better than Pearson and MF. Compared with the UFC, which combines user preference and check-in correlation, we consider more factors such as time, category, and user’s trajectory, which make our recommendation effect better than the UFC method. Compared with the CoRe, which combines geographical influence and social influence, the proposed method in this paper not only considers geographical location influence but also other factors such as category. Therefore, our recommended method is superior to the CoRe as a whole. Compared with the DSPR, which uses context information to explore users’ preferences and real-time needs at the same time, the proposed method considers the correlation between the positions of POI and the influence of POI categories on the selection of POI in addition to user preferences. Therefore, our recommended method is superior to DSPR as a whole.
Furthermore, the influence of the difference in the number of recommended POIs on the recommendation results was analyzed. We found that when the number of recommended POIs grows, the recommendation accuracy of each method will decrease. From a practical point of view, it is less likely that the POI ranked lower in the recommendation list will arouse users’ interest. However, the recall, F-score, and nDCG of all methods will increase with the increase of the number of recommendations, which means that the more recommendations, the more POIs that can be provided for users, and there is a certain probability that the provided POIs will be favored by users. Furthermore, the hybrid model proposed in this paper fully considers the complementarity of various factors in recommending users’ POIs and enriches the data. Therefore, the problems of cold-start and data sparsity are alleviated to a certain extent.

4.2.3. Limitations

POI recommendation methods have become extremely common in recent years and are applied in a variety of applications. Although our proposed method improves the accuracy of POI recommendation and is superior to some other POI recommendation methods, it suffers from two limitations. First, the method cannot provide more diverse results meeting users’ deep needs. The second limitation is that user influence is considered a non-fuzzy variable while it is a fuzzy variable.

5. Conclusions

POI recommendation can help consumers find the POIs they want quickly. Excellent POI recommendation services can provide results that meet user needs. Current POI recommendation methods are calling for upgrading in view of deficient fusion of users’ multi-source heterogeneous data and poor recommendation results. The refined recommendation model proposed in this paper, a hybrid POI recommendation model integrating users’ characteristics, time, and space, consists of three sub-models. The first model fully considers the influence of user preference, user influence, forgetting characteristics, and trajectory on the selection of POI, and generates corresponding POI recommendation results based on similarity calculation. The second model looks into the correlation between the positions of POI, and obtains the probability of the POI that the user has not visited based on the geographical location coordinates of the POI visited with the method of two-dimensional kernel density estimation. The recommendation results pop out then. The third model produces corresponding recommendation results on account of weighting the POI category preference after analyzing the influence of POI categories on users’ access behavior and calculating user’s category preference scores for each POI with the TF-IDF method. Subsequently, the recommendation results of the sub-model are fused and top-K POIs are recommended to the target users. Experimental results indicated that the method proposed in this paper is superior to some other methods in all evaluation indexes, and alleviates the problems of cold-start and data sparsity to a certain extent. The more accurate the recommendation result is, the more it can meet the needs of users.
In the future work, we will research in the following aspects: (1) Further subdivide the social relationships of users and integrate them into the POI recommendation model to improve the recommendation effect; (2) consider the trade-off among accuracy, diversity, and novelty of POI recommendation; and (3) apply the research achievement into various fields [42,43,44].

Author Contributions

C.X. and D.L. designed the study and conceived the manuscript. C.X. implemented the simulation experiments. X.M. and C.X. drafted the manuscript. X.M. and C.X. were involved in revising the manuscript. All authors have read and agreed to the published version of the manuscript.

Funding

This research was supported by the Philosophy and Social Science Foundation of Zhejiang Province (No. 21NDJC083YB), National Natural Science Foundation of China (No. 71702164), Natural Science Foundation of Zhejiang Province (No. LY20G010001), Science and technology plan project of Zhejiang Province (No. LGF19G010002, No. LGF20G010002, No. LGF20G010003), Contemporary Business and Trade Research Center, and Center for Collaborative Innovation Studies of Modern Business of Zhejiang Gongshang University of China (No. 2021SM05YB).

Institutional Review Board Statement

Not applicable.

Informed Consent Statement

Not applicable.

Data Availability Statement

The data used to support the findings of this study are available from the corresponding author upon request.

Conflicts of Interest

The authors declare that they have no competing interests.

References

  1. Zhou, X.; Mascolo, C.; Zhao, Z. Topic-enhanced memory networks for personalized point-of-interest recommendation. In Proceedings of the ACM SIGKDD, Anchorage, AK, USA, 4–8 August 2019; pp. 3018–3028. [Google Scholar]
  2. Shi, M.; Shen, D.; Kou, Y.; Nie, T.; Yu, G. Attentional Memory Network with Correlation-based Embedding for time-aware POI recommendation. Knowl.-Based Syst. 2021, 214, 106747. [Google Scholar] [CrossRef]
  3. Werneck, H.; Santos, R.; Silva, N.; Pereira, A.C.M.; Mourão, F.; Rocha, L. Effective and diverse POI recommendations through complementary diversification models. Expert Syst. Appl. 2021, 175, 114775. [Google Scholar] [CrossRef]
  4. Ren, X.; Song, M.; Song, J. Point-of-Interest recommendation based on the user check-in behavior. Chin. J. Comput. 2017, 40, 28–51. [Google Scholar]
  5. Xiong, X.; Qiao, S.; Han, N.; Xiong, F.; Bu, Z.; Li, R.; Yue, K.; Yuan, G. Where to go: An effective point-of-interest recommendation framework for heterogeneous social networks. Neurocomputing 2020, 373, 56–69. [Google Scholar] [CrossRef]
  6. Huang, L.; Ma, Y.; Liu, Y. Point-of-interest recommendation in location-based social networks with personalized geo-social influence. China Commun. 2015, 12, 21–31. [Google Scholar] [CrossRef]
  7. Zhang, L.; Sun, Z.; Zhang, J.; Kloeden, H.; Klanner, F. Modeling hierarchical category transition for next POI recommendation with uncertain check-ins. Inf. Sci. 2020, 515, 169–190. [Google Scholar] [CrossRef]
  8. Liu, X.; Yang, Y.; Xu, Y.; Yang, F.; Huang, Q.; Yang, H. Real-Time POI Recommendation via Modeling Long- and Short-Term User Preferences. Neurocomputing 2021, 467, 454–464. [Google Scholar] [CrossRef]
  9. Wang, W.; Chen, J.; Wang, J.; Chen, J.; Liu, J.; Gong, Z. Trust-Enhanced Collaborative Filtering for Personalized Point of Interests Recommendation. IEEE Trans. Ind. Inform. 2020, 16, 6124–6132. [Google Scholar] [CrossRef]
  10. Zeng, J.; Li, F.; He, X.; Wen, J. Fused Collaborative Filtering with User Preference, Geographical and Social Influence for Point of Interest Recommendation. Int. J. Web Serv. Res. 2019, 16, 40–52. [Google Scholar] [CrossRef]
  11. Jiao, X.; Xiao, Y.; Zheng, W.; Xu, L.; Wu, H. Exploring Spatial and Mobility Pattern’s Effects for Collaborative Point-of-Interest Recommendation. IEEE Access 2019, 7, 158917–158930. [Google Scholar] [CrossRef]
  12. Yao, L.; Sheng, Q.; Wang, X.; Zhang, W.; Qin, Y. Collaborative Location Recommendation by Integrating Multi-dimensional Contextual Information. ACM Trans. Internet Technol. 2018, 18, 1–24. [Google Scholar] [CrossRef] [Green Version]
  13. Cai, L.; Wen, W.; Wu, B.; Yang, X. A Coarse-to-Fine User Preferences Prediction Method for Point-of-interest Recommendation. Neurocomputing 2020, 422, 1–11. [Google Scholar] [CrossRef]
  14. Yu, D.; Wanyan, W.; Wang, D. Leveraging contextual influence and user preferences for point-of-interest recommendation. Multimed. Tools Appl. 2020, 8, 1487–1501. [Google Scholar] [CrossRef]
  15. Chen, Y.; Thaipisutikul, T.; Shih, T.K. A Learning-Based POI Recommendation with Spatiotemporal Context Awareness. IEEE Trans. Cybern. 2020, 99, 1–14. [Google Scholar] [CrossRef]
  16. Wang, H.; Li, P.; Liu, Y.; Shao, J. Towards Real-time Demand-aware Sequential POI Recommendation. Inf. Sci. 2021, 547, 482–497. [Google Scholar] [CrossRef]
  17. Chen, J.; Li, X.; Cheung, W.K.; Li, K. Effective successive POI recommendation inferred with individual behavior and group preference. Neurocomputing 2016, 210, 174–184. [Google Scholar] [CrossRef]
  18. Zhu, L.; Xu, C.; Guan, J.; Zhang, H. SEM-PPA: A semantical pattern and preference-aware service mining method for personalized point of interest recommendation. J. Netw. Comput. Appl. 2017, 82, 35–46. [Google Scholar] [CrossRef]
  19. Liu, K.; Yin, L.; Lu, F.; Mou, N. Visualizing and exploring POI configurations of urban regions on POI-type semantic space. Cities 2020, 99, 102610. [Google Scholar] [CrossRef]
  20. Hao, P.; Cheang, W.H.; Chiang, J.H. Real-time event embedding for POI recommendation. Neurocomputing 2019, 349, 1–11. [Google Scholar] [CrossRef]
  21. Adomavicius, G.; Tuzhilin, A. Toward the next generation of recommender systems: A survey of the state-of-the-art and possible extensions. IEEE Trans. Knowl. Data Eng. 2005, 17, 734–749. [Google Scholar] [CrossRef]
  22. Xing, S.; Liu, F.; Zhao, X.; Li, T. Points-of-interest recommendation based on convolution matrix factorization. Appl. Intell. 2018, 48, 2458–2469. [Google Scholar] [CrossRef]
  23. Davtalab, M.; Alesheikh, A. A POI recommendation approach integrating social spatio-temporal information into probabilistic matrix factorization. Knowl. Inf. Syst. 2021, 63, 65–85. [Google Scholar] [CrossRef]
  24. Hu, L.; Xing, Y.; Gong, Y.; Zhao, K.; Wang, F. Nonnegative matrix tri-factorization with user similarity for clustering in point-of-interest. Neurocomputing 2019, 363, 58–65. [Google Scholar] [CrossRef]
  25. Xu, C. A big-data oriented recommendation method based on multi-objective optimization. Knowl.-Based Syst. 2019, 177, 11–21. [Google Scholar] [CrossRef]
  26. Si, Y.; Zhang, F.; Liu, W. CTF-ARA: An adaptive method for POI recommendation based on check-in and temporal features. Knowl.-Based Syst. 2017, 128, 59–70. [Google Scholar] [CrossRef]
  27. Xu, C. A novel recommendation method based on social network using matrix factorization technique. Inf. Process. Manag. 2018, 54, 463–474. [Google Scholar] [CrossRef]
  28. Zhang, J.; Chow, C.; Li, Y. LORE: Exploiting sequential influence for location recommendations. In Proceedings of the 22nd ACM International Conference on Advances in Geographic Information Systems, SIGSPATIAL, Dallas, TX, USA, 4–7 November 2014; pp. 103–112. [Google Scholar]
  29. Ren, X.; Song, M.; Haihong, E.; Song, J. Context-aware probabilistic matrix factorization modeling for point-of-interest recommendation. Neurocomputing 2017, 241, 38–55. [Google Scholar] [CrossRef]
  30. Xu, Z.; Chen, L.; Chen, G. Topic based context-aware travel recommendation method exploiting geotagged photos. Neurocomputing 2015, 155, 99–107. [Google Scholar] [CrossRef]
  31. Kolahkaj, M.; Harounabadi, A.; Nikravanshalmani, A.; Chinipardaz, R. A hybrid context-aware approach for e-tourism package recommendation based on asymmetric similarity measurement and sequential pattern mining. Electron. Commer. Res. Appl. 2020, 42, 100978. [Google Scholar] [CrossRef]
  32. Gavalas, D.; Kenteris, M. A web-based pervasive recommendation system for mobile tourist guides. Pers. Ubiquitous Comput. 2011, 15, 759–770. [Google Scholar] [CrossRef]
  33. Xu, C.; Ding, A.S.; Zhao, K. A novel POI recommendation method based on trust relationship and spatial-temporal factors. Electron. Commer. Res. Appl. 2021, 48, 101060. [Google Scholar] [CrossRef]
  34. Chang, B.; Park, Y.; Kim, S.; Kang, J. DeepPIM: A Deep Neural Point-of-Interest Imputation Model. Inf. Sci. 2018, 465, 61–71. [Google Scholar] [CrossRef]
  35. Jiao, X.; Xiao, Y.; Zheng, W.; Wang, H.; Hsu, C. A novel next new point-of-interest recommendation system based on simulated user travel decision-making process. Future Gener. Comput. Syst. 2019, 100, 982–993. [Google Scholar] [CrossRef]
  36. Liu, T.; Liao, J.; Wu, Z.; Wang, Y.; Wang, J. Exploiting Geographical-Temporal Awareness Attention for Next Point-of-Interest Recommendation. Neurocomputing 2020, 400, 227–237. [Google Scholar] [CrossRef]
  37. Zhao, G.; Lou, P.; Qian, X.; Hou, X. Personalized location recommendation by fusing sentimental and spatial context. Knowl.-Based Syst. 2020, 196, 105849. [Google Scholar] [CrossRef]
  38. Rong, G.; Li, J.; Li, X.; Song, C.; Zhou, Y. A Personalized Point-of-Interest Recommendation Model via Fusion of Geo-social Information. Neurocomputing 2018, 273, 159–170. [Google Scholar]
  39. Mosteller, F.; Turkey, J. Data Analysis, Including Statistics. In The Handbook of Social Psychology; Gardner, L., Eliot, A., Eds.; Springer & Addison-Wesley: Reading, MA, USA, 1968; pp. 109–112. [Google Scholar]
  40. Zhang, J.; Chow, C. CoRe: Exploiting the personalized influence of two-dimensional geographic coordinates for location recommendations. Inf. Sci. 2015, 293, 163–181. [Google Scholar] [CrossRef]
  41. Zhou, J.; Liu, B.; Chen, Y.; Lin, F. UFC: A Unified POI Recommendation Framework. Arab. J. Sci. Eng. 2019, 44, 9321–9332. [Google Scholar] [CrossRef]
  42. Xiang, K.; Xu, C.; Wang, J. Understanding the Relationship Between Tourists’ Consumption Behavior and Their Consumption Substitution Willingness Under Unusual Environment. Psychol. Res. Behav. Manag. 2021, 14, 483–500. [Google Scholar] [CrossRef] [PubMed]
  43. Wang, J.; Xu, C.; Liu, W. Understanding the adoption of mobile social payment? From the cognitive behavioral perspective. Int. J. Mob. Commun. 2022, in press. [Google Scholar] [CrossRef]
  44. Tang, Z.; Hu, H.; Xu, C.; Zhao, K. Exploring an Efficient Remote Biomedical Signal Monitoring Framework for Personal Health in the COVID−19 Pandemic. Int. J. Environ. Res. Public Health 2021, 18, 9037. [Google Scholar] [CrossRef] [PubMed]
Figure 1. Framework of Hybrid Recommendation Model.
Mathematics 09 02673 g001
Figure 2. Example of POI Category Hierarchy.
Mathematics 09 02673 g002
Figure 3. Comparison of results on the Yelp data set. (a) comparison of Precision of each method on Yelp data set. (b) comparison of Recall of each method on Yelp data set. (c) comparison of F-score of each method on Yelp data set. (d) comparison of nDCG of each method on Yelp data set.
Mathematics 09 02673 g003aMathematics 09 02673 g003b
Figure 4. Comparison of results on Meituan data set. (a) comparison of Precision of each method on Meituan data set. (b) comparison of Recall of each method on Meituan data set. (c) comparison of F-score of each method on Meituan data set. (d) comparison of nDCG of each method on Meituan data set.
Mathematics 09 02673 g004aMathematics 09 02673 g004b
Table 1. Example of Emotion Analysis.
Emotional VocabularyEmotion DegreeEmotion PolarityEmotion ScoreAfter Adding Negative WordsFinal Score
Abundant313not abundant3 × −0.5 = −1.5
Incomparable happiness515not happy5 × −1 = −5
Dirty and messy42−4not messy−4 × −1 = 4
Satisfied414not satisfied4 × −1 = −4
Angry32−3not angry3 × 0.5 = 1.5
Table 2. Some data of Yelp.
UserPOITimeCategoriesCoordinateTimes
01381185638400.03 21 2(40.405245, −80.018538)4
3931231226592000.0110 2(40.4657148,79.9535041)4
3931021312732800.02 3(40.4484631,79.98940859)8
40113,3791310227200.06 11 2(40.489141799,79.8930872)4
49110,3301341244800.0502 22 138 2(40.459956,79.924269999)2
63263881291305600.087 31 103(36.0473627825,115.1710557)3
81641111283443200.012 13 4 15 326 2(36.1130255,115.1634847001)5
Table 3. Some data of Meituan.
UserPOITimeCategoriesCoordinateCommentStar
91762016/4/18 22:48fast food(116.372,40.107)Will come to eat again. Not bad! I will come to eat again.5
63892016/3/18 18:55hot pot(121.582,30.924)Taste good. I often come here. The boss is nice and hospitable. The taste is not bad. Not far from my home. Take-away is offered. Great!5
142902016/1/31 21:38fast food(116.451,39.924)Little noodles. The soup is extremely salty. I’m so disappointed.1
3022732016/5/23 15:54vegetarian diet(116.357,40.085)It’s really not easy to make vegetarian dishes delicious. Keep refueling.4
Publisher’s Note: MDPI stays neutral with regard to jurisdictional claims in published maps and institutional affiliations.

