Article

Sustainability, Big Data and Mathematical Techniques: A Bibliometric Review

by
Matilde Lafuente-Lechuga
,
Javier Cifuentes-Faura
* and
Ursula Faura-Martínez
Faculty of Economics and Business, University of Murcia, 30100 Murcia, Spain
*
Author to whom correspondence should be addressed.
Mathematics 2021, 9(20), 2557; https://doi.org/10.3390/math9202557
Submission received: 23 August 2021 / Revised: 6 October 2021 / Accepted: 8 October 2021 / Published: 13 October 2021

Abstract

:
This article has reviewed international research, up to the first half of 2021, focused on sustainability, big data and the mathematical techniques used for its analysis. In addition, a study of the spatial component (city, region, nation and beyond) of the works has been carried out and an analysis has been made of which Sustainable Development Goals (SDGs) have received the most attention. A bibliometric analysis and a fractal cluster analysis were performed on the papers published in the Web of Science. The results show a continuous increase in the number of published articles and citations over the whole period, demonstrating a growing interest in this topic. China, the United States and India are the most productive countries and there are more papers at the regional level. It has been found that the environmental dimension is the most studied and the least studied is the social dimension. The mathematical techniques used in the empirical work are mainly regression analysis, neural networks and multi-criteria decision methods. SDG9 and SDG11 are the most worked on. The trend shows a convergence in recent years towards big data applied to supply chains, Industry 4.0 and the achievement of sustainable cities.

1. Introduction

Big data is a fundamental tool in many areas. The collection, storage and mining of large datasets for information can create significant value for the global economy, as well as improve the productivity and competitiveness of both businesses and the public sector [1]. The use of big data makes it possible to collect, store and analyse a large amount of data in order to establish patterns and obtain estimators that can make real-time decisions about a given target [2,3], improving its performance and obtaining benefits [4].
The use of big data is on the rise as more and more organisations have to handle large databases and because of the availability and access to data due to globalisation [5]. Big data enables many companies to gain a greater competitive advantage over their competitors [6,7,8] as well as to solve specific organisational management problems [9]. Big data is not only used in companies and organisations, but increasingly also in the public sector [10,11,12], as it makes it possible to address many issues such as efficiency, productivity or transparency, and to solve problems arising from this [13].
In recent years, climate change, environmental degradation or resource depletion have become growing problems in society [14,15]. Therefore, governmental institutions and many collectives have mobilised to protect the environment and create a more sustainable world [16,17]. In 2015, the United Nations adopted the 2030 Agenda, which enacted the 17 Sustainable Development Goals (SDGs), aiming to achieve a cleaner, fairer and more sustainable world by 2030 [18].
With the emergence of big data, the aim is, through data analysis, to anticipate events and prevent environmental catastrophes or reduce environmental degradation, while at the same time achieving sustainable development.
Many companies and institutions use sustainability indicators to make decisions, as they can be a barometer of socio-economic conditions to monitor different aspects of global risk [19]. In addition, companies gain insight into market risks and opportunities by assessing different sustainability indicators [20]. These indicators can serve as an assessment tool to diagnose risks and reduce complexities, although their application is not easy [21].
To measure sustainable development, it is necessary to quantify the phenomena that represent such progress through indicators [22]. These include simple ones such as Gross Domestic Product (GDP), which measures a country’s economic development, and more complex ones such as immunisation against infectious diseases. The first set of indicators was published in 1996 in the form of a Driving-Force State-Response framework by the United Nations [23] to assess economic, social and environmental progress and provide the necessary information [24]. These indicators, which contribute to the achievement of the SDGs, can show the current state and evolution of the environment, as well as major concerns, which can help policy-makers to make important decisions based on the information provided [25]. The results measured through sustainable development indicators can help in the development of successful policies that lead to the reduction of environmental problems [26,27]. In this regard, Huovila et al. [28] conducted a comparative analysis of sustainability indicators for smart sustainable cities and concluded that the selection of the most appropriate indicators depends on factors such as the development stage of the city, the time scale of the assessment or the spatial scale. A growing body of work using big data and different mathematical models aims to establish ways to achieve sustainability [29,30,31,32].
The aim of this research is to carry out a review of the scientific production on the use of big data in sustainability using some kind of indicator to measure it, in order to show and analyse the intellectual, conceptual and social structures of the research, as well as its evolution and dynamic aspects.
Systematic literature reviews are very useful for researchers because they help them to go deeper into the field of study, to learn about trends, networks, works, authors with the most citations and to ask questions for future research. To these advantages can be added some risks such as “inflated” citations due to the abuse of self-citations, the need to define precise semantic search fields, etc. [33]. Bibliometric studies contemplate a formal and rigorous procedure that guarantees the quality of the results obtained by using increasingly sophisticated analysis techniques and software and increasingly systematic and complete compilations of scientific publications [34].
By means of bibliometric analysis, using the WoS (Web of Science) database, scientific production was quantified, and its impact was measured, describing how certain fields of research are related and how they evolve over time. In addition, the works were classified according to their empirical or conceptual approach. In the case of an empirical paper, the country where the practical application of the work took place was obtained and grouped into three different levels, micro, meso and macro [35,36], depending on the spatial scope of the document. The mathematical technique used and the SDG worked on were also analysed, as well as the type of sustainability indicator used. Specifically, the research questions were posed in the following terms:
  • Q1: What are the main trends in scientific production on sustainability based on big data?
  • Q2: Which SDGs do the papers relate to?
  • Q3: At what spatial level were the empirical papers conducted?
  • Q4: What kind of mathematical techniques are applied?

2. Materials and Methods

The type of research carried out in this work is exploratory, descriptive and quantitative based on the techniques and tools of bibliometric analysis of the documents stored in the WoS bibliographic database. This is one of the world’s most important databases of bibliographic references and citations of periodical publications. Its purpose is not to offer the text or abstracts (although they can be consulted) but to provide analysis tools that allow the scientific quality of publications to be assessed. One of the metrics it offers is Journal Citation Reports (JCR), the best-known quality indicator and one that is also evaluated by organizations that assess research activity. In WoS, only the highest-quality journals in each field are indexed [37].
The review process followed several distinct stages:
  • Time scale: as the importance afforded to sustainability has mainly occurred in the last decades, it was decided not to include time restrictions, obtaining all the documents up to 30 June 2021.
  • In the search of the existing literature in the WoS database, three words were always used, taking as a basis: “sustainab* and big data” to which were added: “indicator”, “index”, “assessment”, “evaluation”, “measurement”. Finally, the results found in each of them were joined according to the following sentence: “sustainab* and big data and indicator” OR “sustainab* and big data and index” OR “sustainab* and big data and assessment” OR “sustainab* and big data and evaluation” OR “sustainab* and big data and measuring”.
  • The required document type was article, also including review article. The result was n = 507 documents.
  • A preliminary reading of the abstract was initially carried out, followed by a more exhaustive reading of each article to verify that it met the established inclusion criteria. From the search carried out, we have eliminated those works (182 publications) that use some combination of the key words in a tangential way, without giving them the strict sense that our research pursues. For example, papers that include the word sustainability, but have nothing to do with mathematical techniques for sustainability, have been discarded. After this filtering, n = 325 documents were obtained, of which 34 are bibliometric studies (Figure 1).
The distribution of keywords in the 325 papers analysed is shown in Figure 2. The most prominent keyword is big data, followed by sustainability, which is compatible with the search query.
A new register was created to integrate the spatial dimension (micro, meso and macro) in the empirical documents:
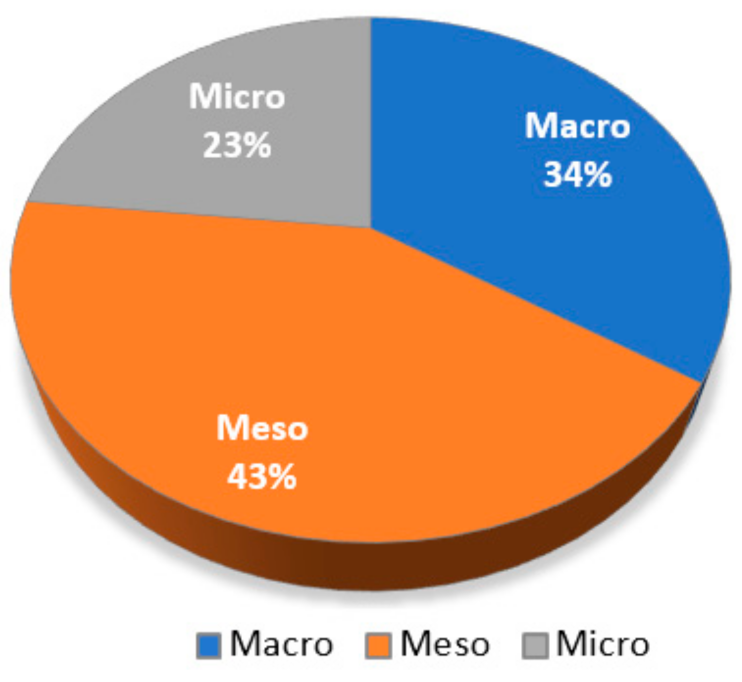
  • The denomination “micro-level” refers to the fact that the analysed document performs its empirical application in companies or places located in a small territory.
  • The term “meso-level” has been used when the work has been carried out in several places at the same time or in industrial parks.
  • The term “macro” refers to the fact that the document has a global or country-wide application.
It was also recorded which SDGs are being addressed, the type of indicator used (environmental, economic or social) and the mathematical techniques used. From the database completed with the new variables, we proceeded to answer the research objective of this work. This process has been divided into several phases leading to the analysis of how sustainability is being worked from big data and the mathematical techniques used for this purpose.
Regarding the software used to analyse scientific content, there are several programs such as Bibexcel [38], CiteSpace [39], CitNetExplorer [40], VOSviewer [41], CoPalRed [42], Bibliometrix [43], SciMAT [44], Science of Science (Sci2) [45], ScientoText [46] and VantagePoint [47]. Several papers [48,49,50,51] make a comparison between some of these programmes. According to [52], VOSviewer is a free software that offers suitable features for science mapping. Moreover, this tool has been used in several bibliometric studies, such as [53,54,55]. Aria and Cuccurello [43] highlight the value of the R package bibliometrix, which is also free and has been used in works such as [56,57,58]. In this work, VOSviewer has been used together with bibliometrix in order to improve the quality of the results by performing scientific map analyses to define trends more accurately.

3. Results

The review presents a combined perspective of a bibliometric analysis together with the spatial level analysed (meso, micro, macro) and the SDG considered.

3.1. Bibliometric Analysis

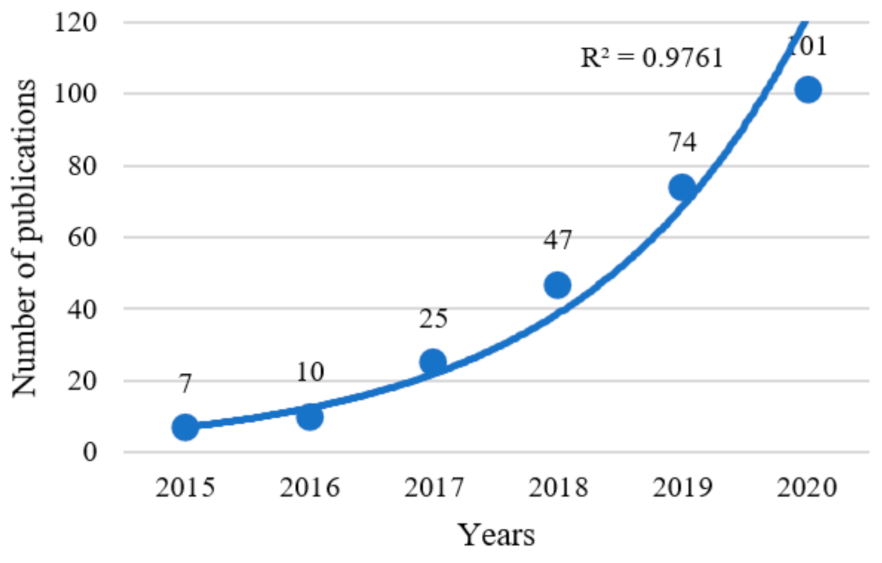
3.1.1. Number of Publications per Year

The number of publications per year is shown in Table 1. The first work using big data with sustainability indicators dates from 2015.
The number of papers has been growing from 7 in 2015 to 101 in 2020, which fits (see Figure 3) an exponential function (R2 = 0.9761). In the first half of 2021, 61 documents with the above requirements have been found and it is expected to continue at this rate, also following the exponential growth.

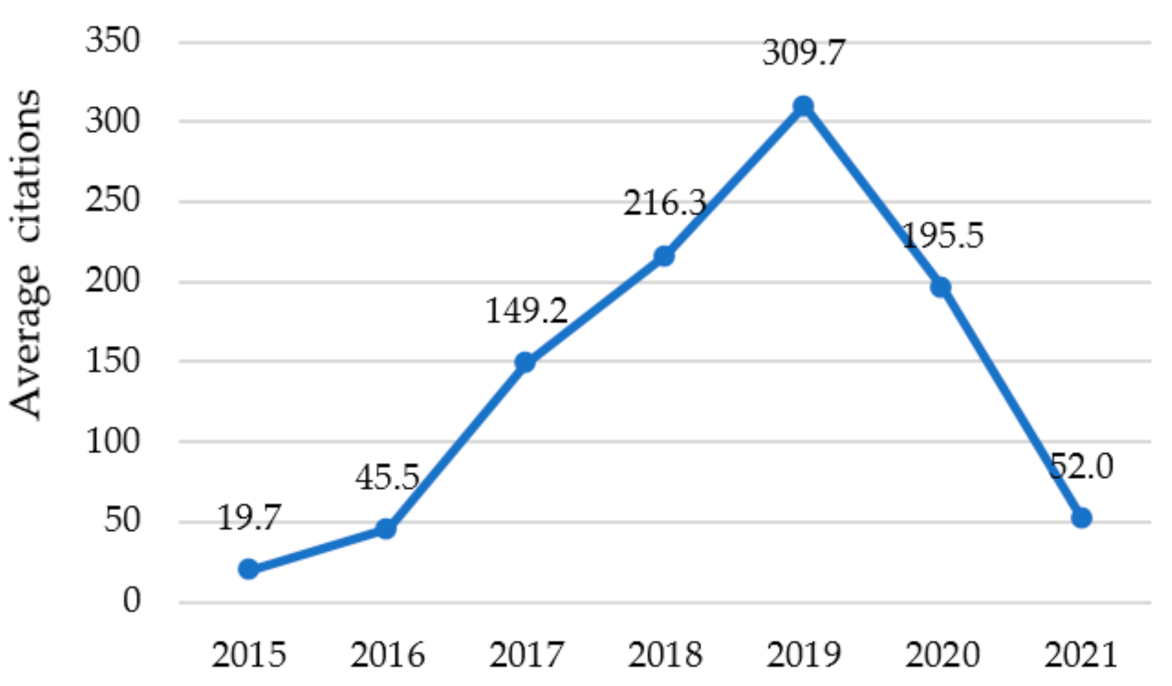
3.1.2. Average Number of Citations per Year per Publication

The evolution of the average number of citations per year per publication does not show a trend as regular as that of the number of articles (Figure 4).
Over the study period, two distinct periods can be observed in the average number of citations per year. The first, until 2019, with exponential growth, and then a significant decrease until the middle of 2021 (the latest information collected is in June 2021).

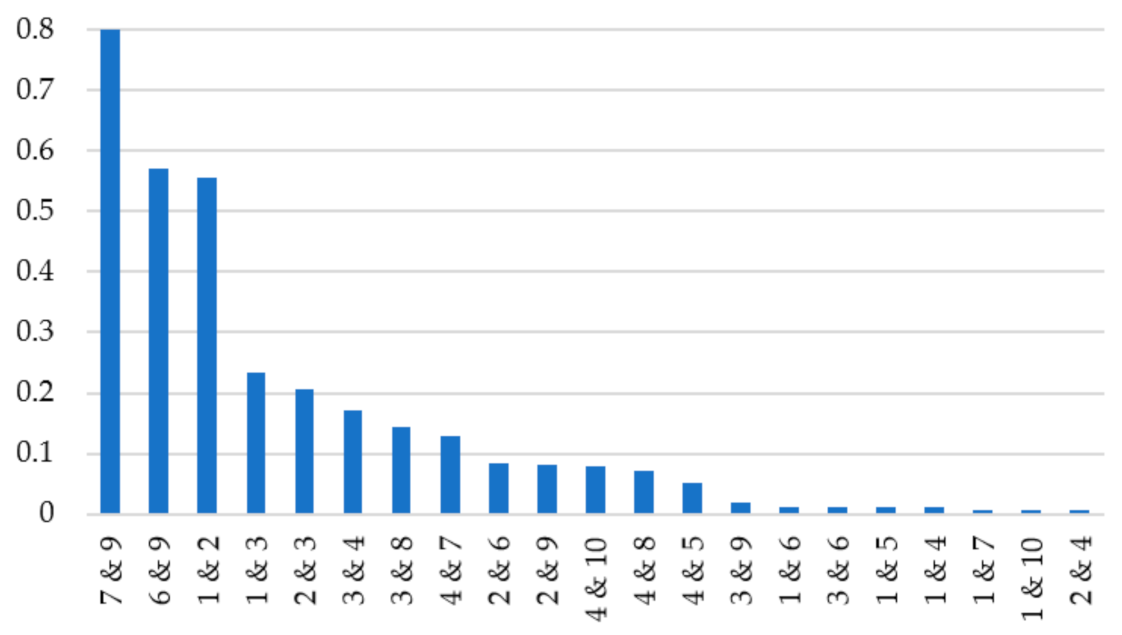
3.1.3. Distribution of Publications by Knowledge Area

The distribution by areas of knowledge shows a concentration on topics related to environmental sciences, technology, engineering, computer science and economics. Table 2 lists the top 10 most represented. Environmental Sciences Ecology stands out with 142 papers and Science Technology Other Topics with 121.
It is evident that an article may be associated with more than one area of knowledge, so that there are overlaps between these areas. A measure of the overlap between each pair of knowledge areas has been calculated from the top 10 most used. This index is defined as the quotient between the publications included simultaneously in both areas divided by the publications belonging to at least one of them. The higher the value of the indicator, the more publications in common between the two areas of knowledge.
Figure 5 shows the value of the overlap measure for those areas that have some publications in common, among the 10 included in Table 2. The areas of Remote Sensing and Construction Building Technology share 12 papers, with 15 and 12 publications respectively, in each of them, so their overlap is high. Energy Fuels with 21 publications and Construction Building Technology with 12, as well as Environmental Sciences and Ecology (with 142 publications) and Science Technology Other Topics (with 121) also have many publications in common, with the indicator of greater than 0.5 in both cases. However, Science Technology Other Topics and Computer Science share only 1 publication.

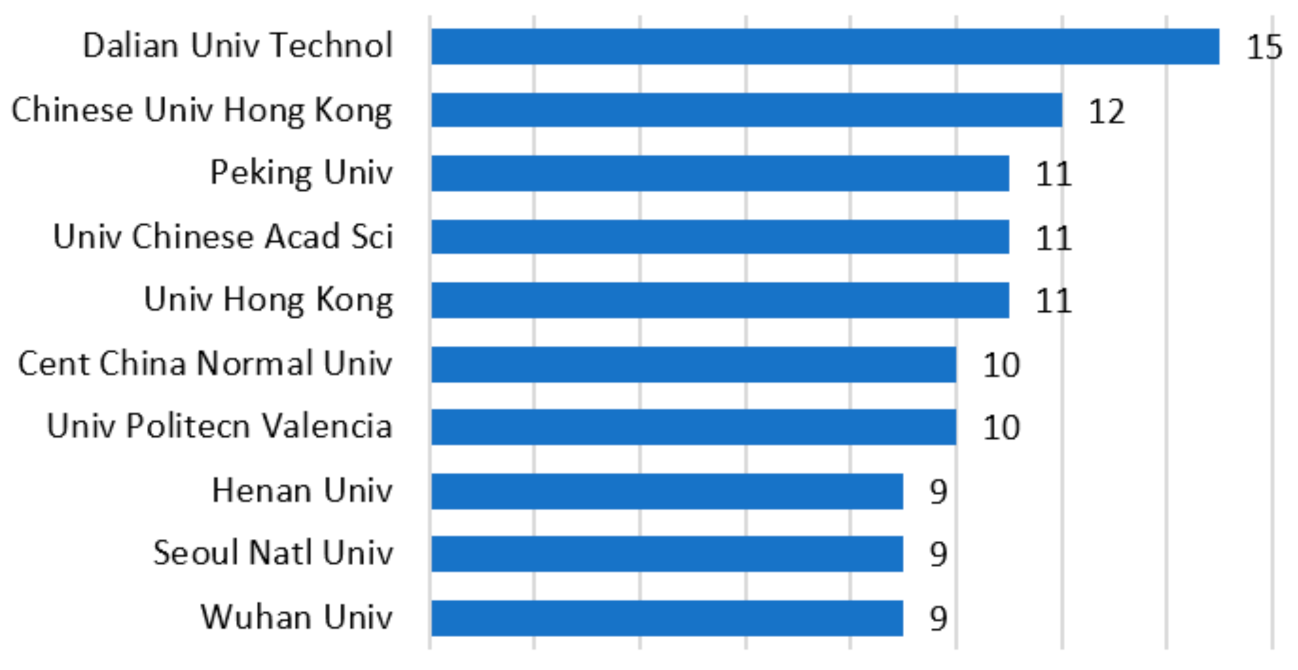
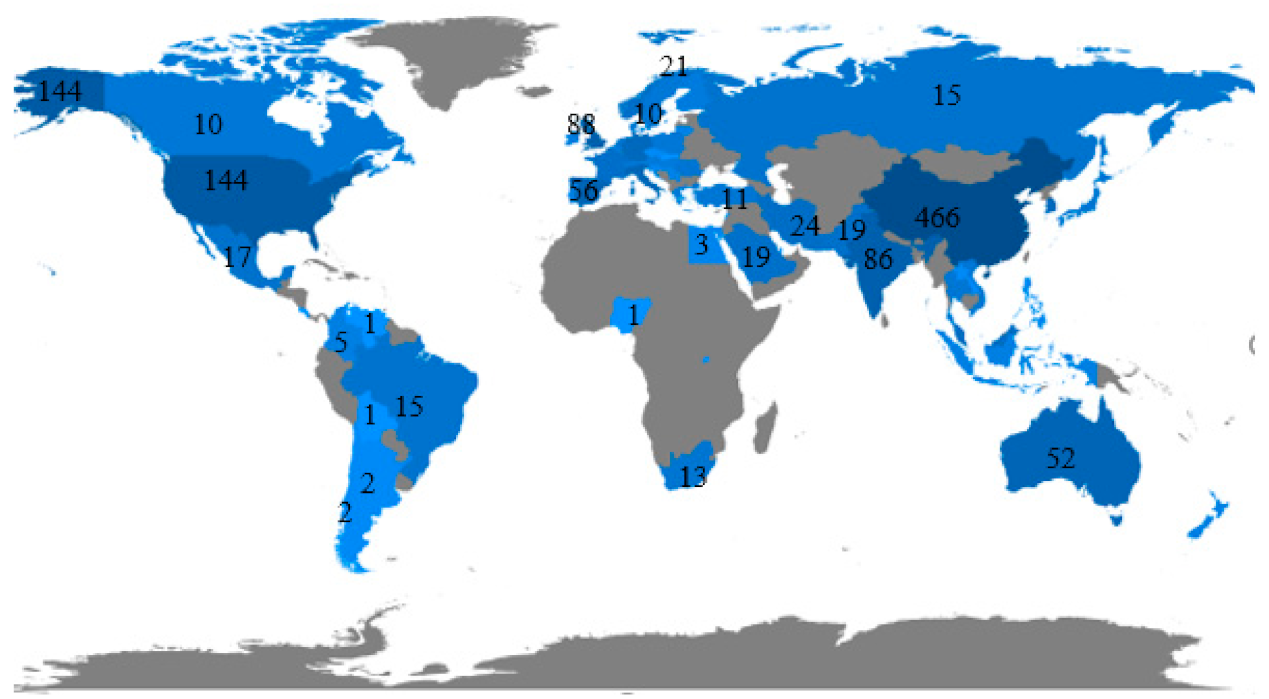
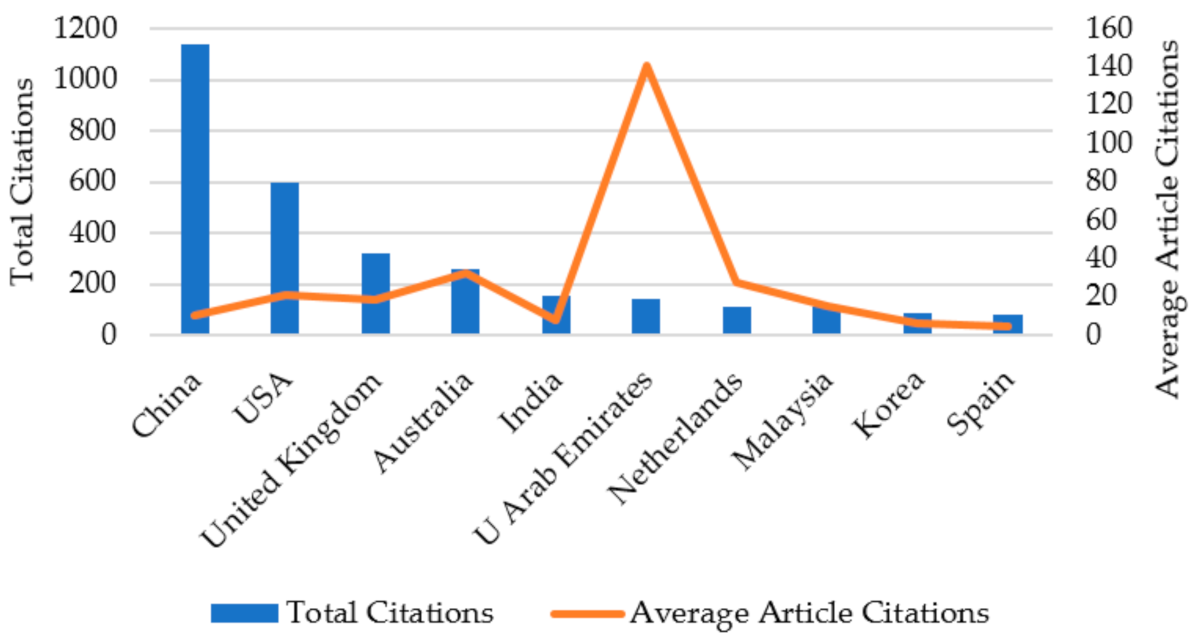
3.1.4. Distribution by Institution

Figure 6 shows the top 10 institutions, according to WoS, with the highest number of articles published. The institutions that provide the most researchers are located in Peoples R China, with Dalian University of Technology standing out with 15 publications, followed by the Chinese University of Hong Kong with 12 and Peking University, the University Chinese Academy of Sciences and the University of Hong Kong with 11. Only one is located in Spain, the Polytechnic University of Valencia, with 10 publications, the same as the Central China Normal University.
The Dalian University of Technology, which ranks first in this study, focuses on studies in the fields of science, engineering, technology, management science and economics. The Chinese University of Hong Kong, founded in 1963, is the oldest university institution in Hong Kong and ranks high in Science, Dentistry, Medicine, Engineering and Social Sciences in general. Peking University is known for emphasizing the teaching and research of the basic sciences and is especially focused on research. The fourth-ranked Chinese Academy of Sciences is a research centre focusing on fields such as environmental research, chemistry, engineering and computer science.
Figure 7 shows, in different shades of blue, the countries in which there are scientific researchers on this topic. Peoples R China stands out with 466 authors, followed by the United States with 144, the UK with 88 and India with 86.
Of the 325 manuscripts analysed, observing the author of correspondence of each one of them, 30.5% are researchers from Peoples R China, 8.9% from USA, 6.1% from India and 5.2% from Spain. The rest belong to 45 different countries.
Figure 8 shows the top 10 countries of authors with the highest number of citations and those with the highest average number of citations per year. As expected from the previous results, authors from Chinese institutions have the highest number of citations of their papers, although if the average number of citations per year is taken into account, the United Arab Emirates University stands out.

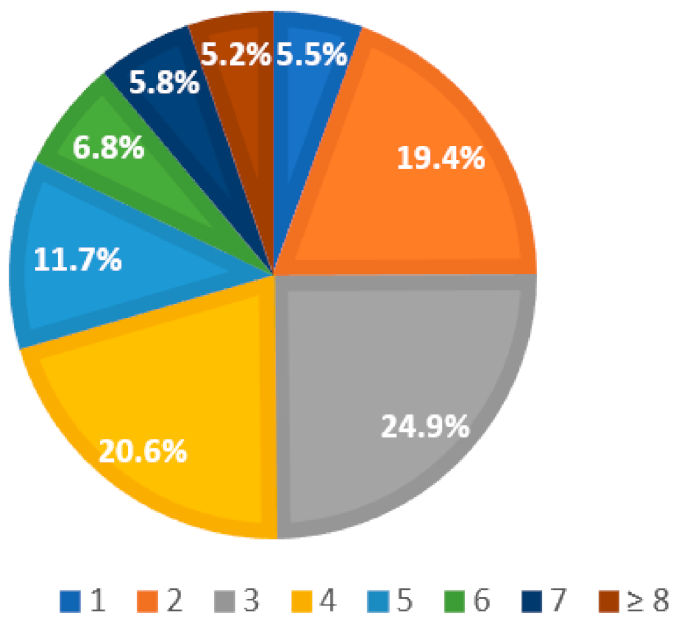
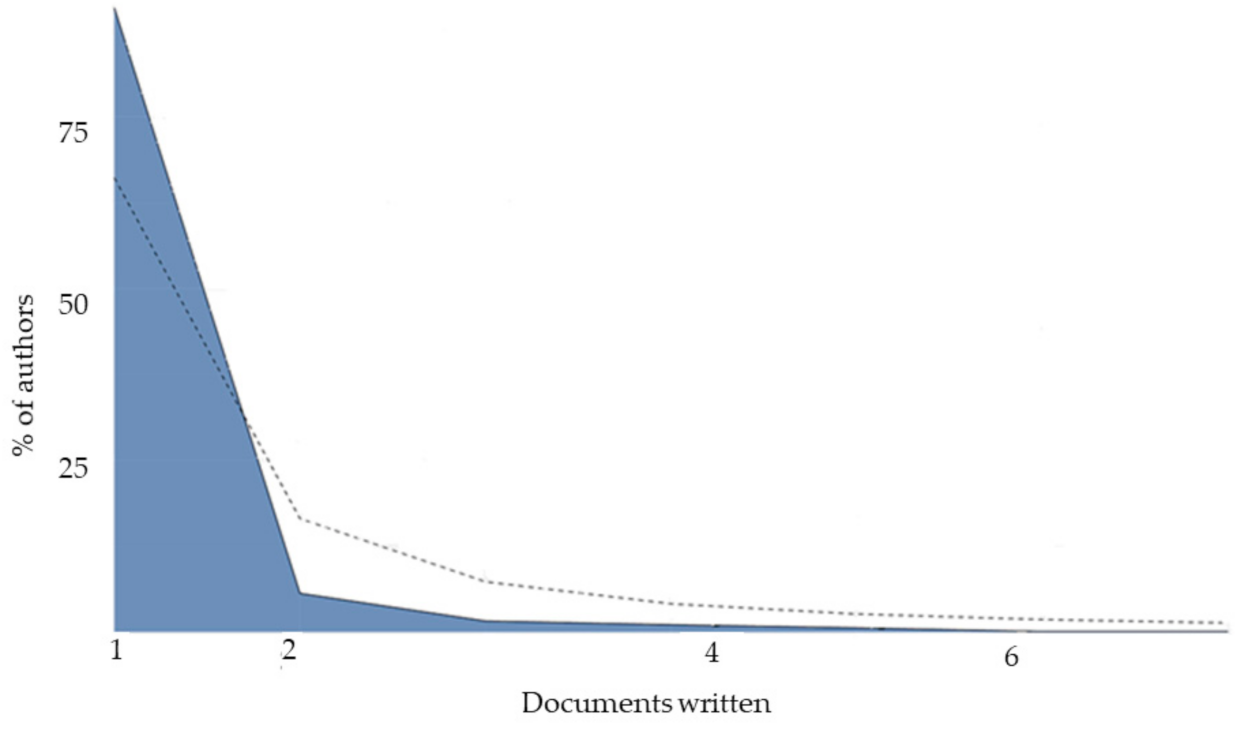
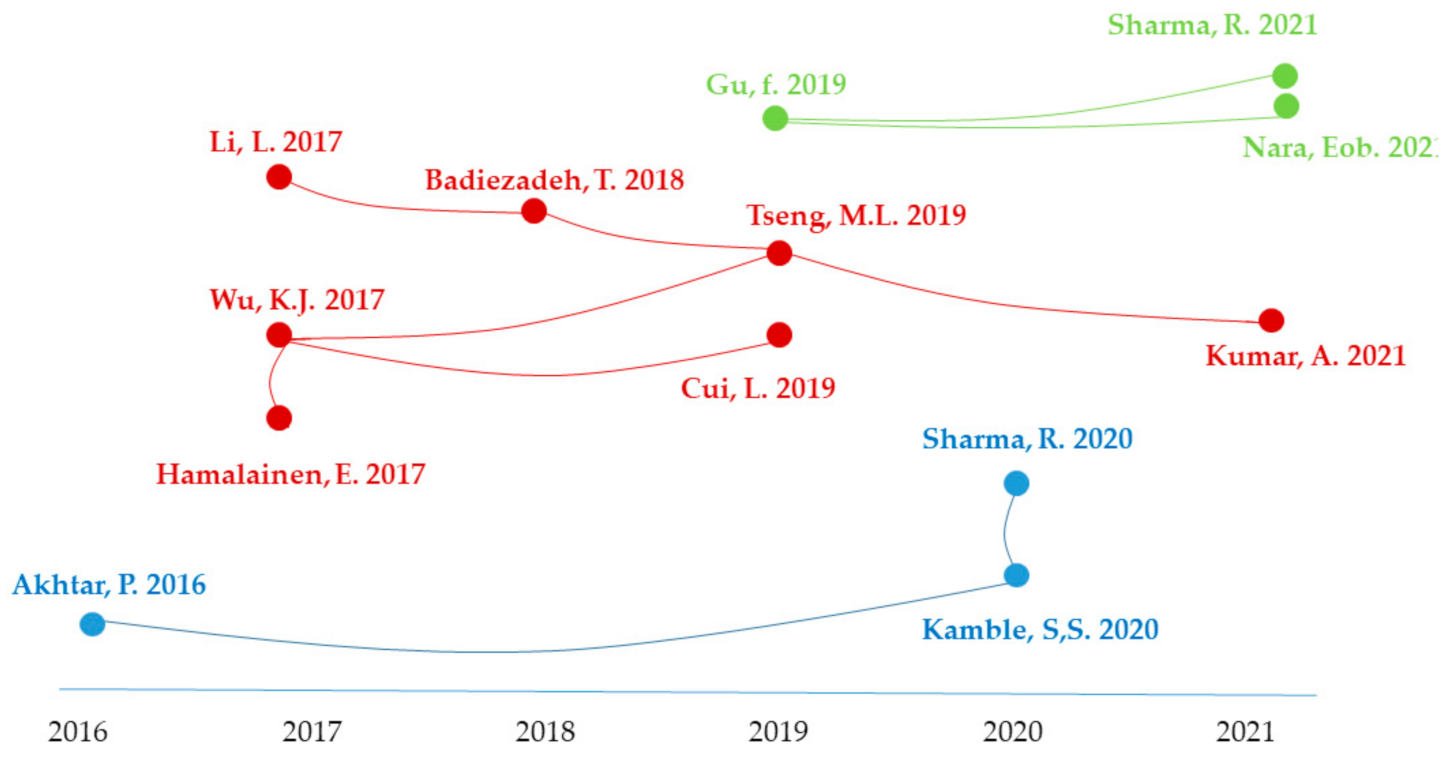
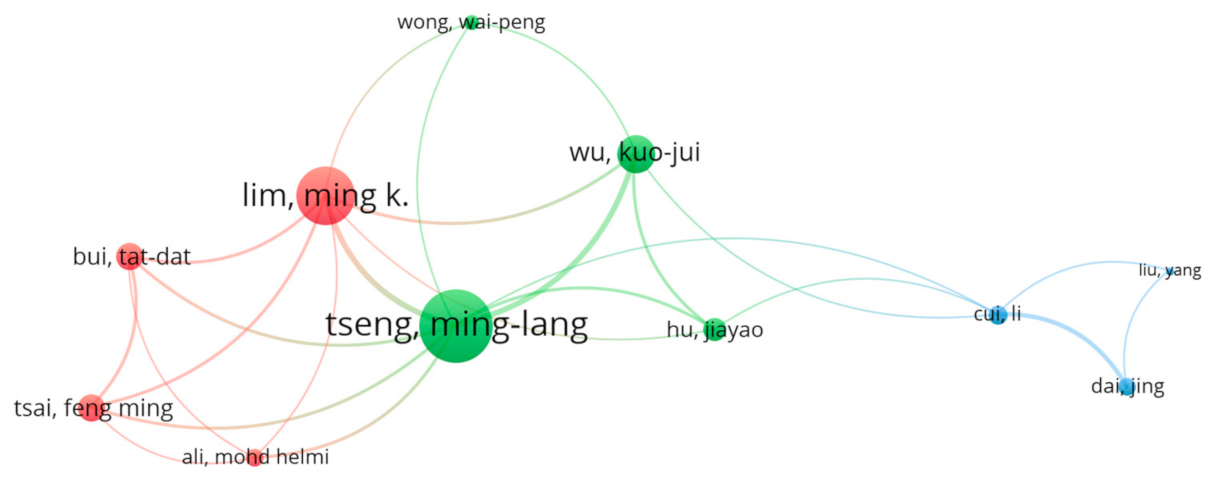
3.1.5. Productivity of Authors

Only 5.5% of the papers are signed by a single author (Figure 9), with three or four authors being the most frequent (almost 25% and 20.6%, respectively), and 5.2% of the documents are signed by more than seven authors.
The average number of authors per article is 4.14. If the 17 articles with more than 7 authors are not taken into account, the average is 3.6. This value of the associativity index indicates that there is a tendency towards group work when it comes to publishing the results of research in the subject analysed.
Among the listed articles, 1263 different authors have been identified with a range of publications between 1 and 7 articles. The percentage of authors with only one article, the so-called transience index or percentage of occasional authors, is over 90%. The author with the highest number of publications is Ming-Lang Tseng from the Taiwan University of Wufong in Taiwan, with articles on sustainable supply chain management.
To study the behaviour of author productivity, we used Lotka’s law of bibliometric quantification, which determines the productivity of authors based on a discrete probability distribution [59,60]. This law states that the number of authors publishing “n” papers is inversely proportional to the number of papers squared, An = A1/n2, where An is the number of authors signing n papers. In this way, it becomes known which are the elite authors in a discipline [61]. Figure 10 shows the frequency distribution of scientific productivity, showing that the level of productivity of the authors in this subject is small.
As the simple count of publications of each researcher is an unreliable measure to assess their contribution to the scientific world [62], other indicators such as the fractional index (FI), the total number of citations received by the papers, the citations per article and the average number of citations per year are shown in Table 3.
The fractional index takes into account the number of co-authors of each paper (the total FI per paper is 1, which is shared among all authors under the assumption that each contributed equally). Of the authors with the most papers, it is still Ming-Lang Tseng who has the highest fractional index (1.4), although Rick Edgeman has an index of 1.50 which does not appear in Table 3 because he has only two publications.
The number of citations received by authors is an indicator of the impact of their work in the scientific community, although this not only depends on its quality, but also on other factors such as the prestige of the author, the topicality of the subject or the journal of publication, which will condition the dissemination of the work. Donald Huisingh (with three articles) is the author with the most citations, more citations per article and per year. Ming-Lang Tseng occupies the second position in the total number of citations with 7 documents and is in lower positions in citations per article and per year (his first publication in this selected database is from 2015).
In order to simultaneously take into account the number of papers, total citations and citations per paper, the h-index has been calculated, which is not affected by having an excess of uncited papers or papers with many citations [63]. Ming-Lang Tseng stands out with an index equal to 6 and almost all the other authors in the top 10 have an index of 3 or 4. To distinguish between authors with a similar h-index, the g-index has been calculated, which is the order number of the position in which the number of accumulated citations is equal to or greater than the squared position number. This gives value to highly cited articles that would not have been recognized by the h-index because “once a paper belongs to the top h papers, its subsequent citations no longer ‘count’” [64]. With the exception of Ming-Lang Tseng with an index equal to 7, the other authors have the same relevance. To correct for the fact that researchers who have published later are disadvantaged in the calculation of the h-index, the m-index has been calculated. This is the result of dividing the h-index by the number of years that have passed since their first publication. In this case, Sachin S. Kamble (m-index = 1.5) is the most productive, followed by Ming-Lsang Tseng.
However, the paper by El-Kassar and Singh [65] has the highest number of citations (127), followed by Yigitcanla et al. [66], which reached 114, being also the ones with the highest average number of citations in the period analysed (Table 4). The first paper presents a holistic model that shows the relationship between green innovation and the factors that make it possible to cope with technological advances and increase business performance. The second paper reviews the literature on whether smart cities can be achieved without becoming fully sustainable.
In the study of direct correlations between the authors listed in this database, a group of seven authors stands out (Figure 11), who assess the sustainability of various business activities, focusing on efficiency. The group listed in green studies the sustainability of 4.0 companies and the blue group studies sustainable agriculture supply chain performance.
The analysis of co-authorships between authors again shows three clusters (Figure 12). The smaller the distance between two authors in the visualisation, the stronger their relationship. Stronger links are also represented by thicker lines.

3.1.6. Distribution by Journal

The papers are published in 166 different journals, and the 10 journals that publish the most account for more than 40% of the papers. Table 5 shows the ranking of the journals with at least 3 articles indexed in the WoS database, the area in which each of them works, the impact factor in 2020 and the quartile in which they are included. Most of these journals belong to the publishers Elsevier and MDPI.
The distribution by journals shows that Sustainability has the greatest number of articles published (58), grouping its papers in the areas of Environmental Studies, Green and Sustainable Science and Technology and Environmental Sciences. Its impact factor in 2020 is 3.251 and it is in the second quartile. It is followed by Journal of Cleaner Production (32) and Sustainable Cities and Society (10), which are located in the first quartile of their areas and their impact factors are, respectively, 7.246 and 7.587.
The impact factor in 2020 of the journal Resources, Conservation & Recycling in the areas of Engineering and Environmental Sciences (10.204) stands out with 6 papers that relate to sustainability, big data, indices and mathematical models. On the other hand, the journal Technological Forecasting and Social Change published the most cited paper, but this is not the journal with the highest impact.
If, in addition to the number of publications, the total number of citations and the h-index, the g-index and m-index are taken into account (Table 6), the journal with the greatest relevance in the subject analysed is the Journal of Cleaner Production. This coincides with the thematic distribution presented above, in which the areas of environmental sciences are the most relevant in this field.
Bradford’s Law or Bradford’s Law of dispersion of scientific literature is the description of a quantitative relationship between journals and scientific articles contained in a bibliography dealing with a given topic. It allows us to select the journals that are not only the most productive but also the most relevant to cover the area of knowledge being analysed [75,76]. The core of the most productive ones is represented in Figure 13, in which zone 1, covering 33% of the publications, is covered by only five journals, which fully coincide with the first journals in Table 6.

3.2. Aggregation of Documents

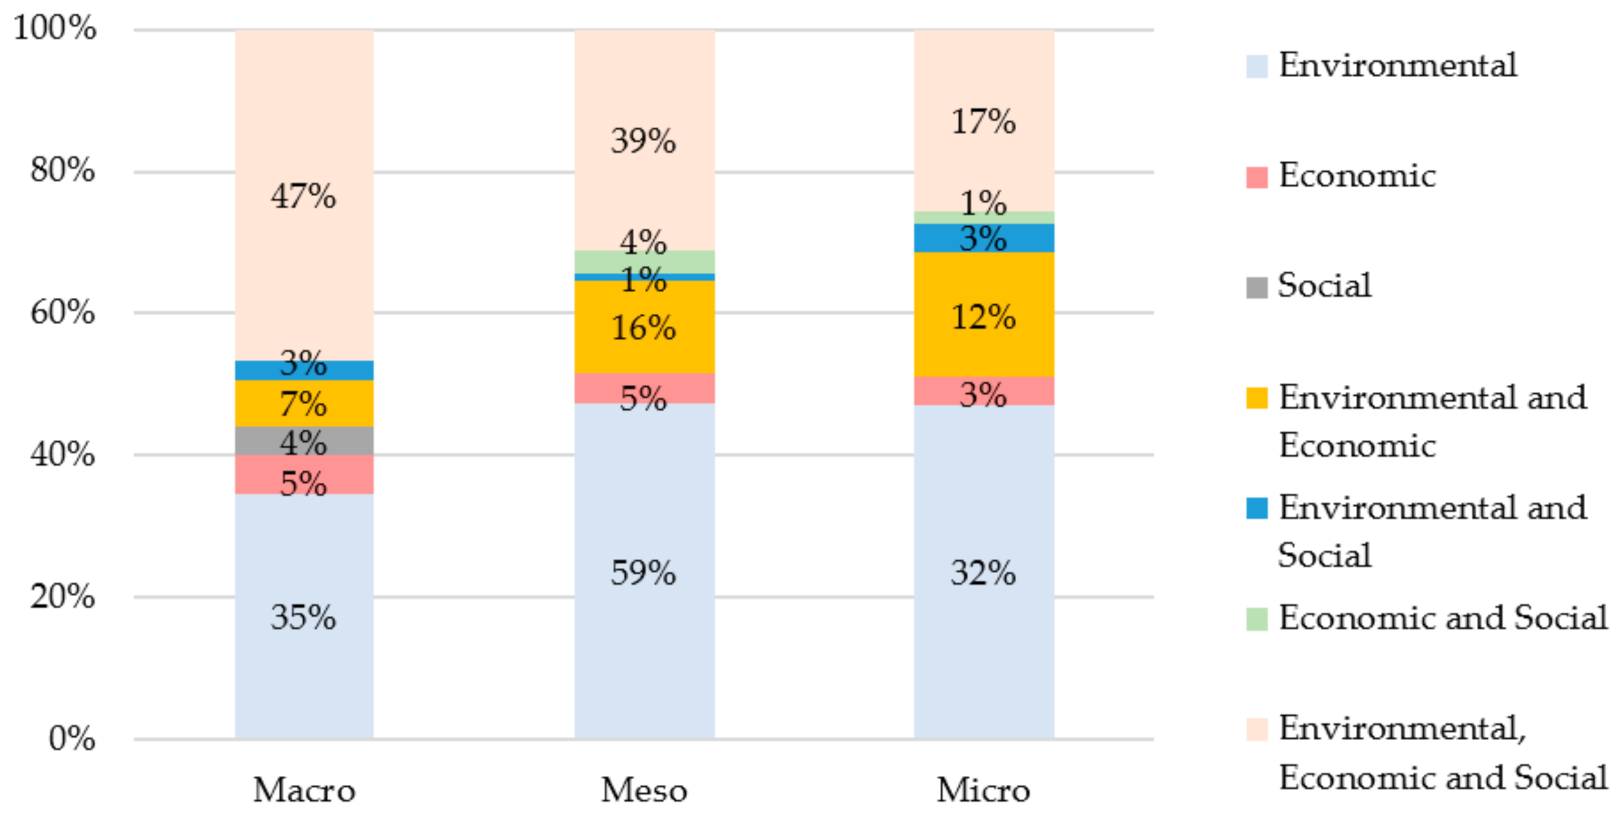
3.2.1. According to Sustainability Indicator and SDGs

In the review, the papers were classified according to whether they were empirical, theoretical or bibliometric. Almost 70% are empirical, just over 20% are theoretical and 10% are bibliometric.
Without taking into account bibliometric works, environmental sustainability is mainly studied (91.3%) either exclusively (43.6%), jointly with economic sustainability (10.8%), with social sustainability (2.1%) or with all three areas (34.8%). The least analysed type of sustainability is social sustainability (Figure 14).
The SDG that has received the most attention (Figure 15) is SDG9 (build resilient infrastructure, promote inclusive and sustainable industrialisation and foster innovation), followed by SDG11 (make cities inclusive, safe, resilient and sustainable) and further behind, SDG13 (take urgent action to combat climate change and its impacts), SDG6 (ensure access to water and sanitation for all) and SDG7 (ensure access to affordable, reliable, sustainable and modern energy). SDG1, SDG2, SDG5 and SDG10 have not been addressed and little attention has been paid to SDG16. Theoretical work has focused more on SDG9 (30.9%), SDG8 (14.7%) and SDG11 (14.7%).
The evolution over time of the SDGs worked on is shown in Figure 16. It can be seen that the papers examined up to June 2021 analyse 10 SDGs out of the 17 in total set out in UNESCO’s 2030 Agenda, as is the case with those published in 2020. In 2019, 11 SDGs were included and 10 in 2018.
In the empirical studies, sustainability indicators refer primarily to SDG11 (28.1%) and SDG9 (25.5%). Among the mathematical techniques used to analyse sustainability, based on big data, different multidimensional regression techniques stand out in 13% of the studies. Of these, 12% use neural networks and in the same proportion, analysis of different indicators (financial, lifecycle, entropy, tourism, mobility, risk, resilience, etc., depending on the topic analysed in the respective papers). The fuzzy methodology, either applied to the Delphi, the entropy weight method or the decision-making trial and evaluation, has been applied in 7% of the works. Multi-criteria decision-making (many of them with TOPSY) is used in 11.4% of the papers. Factor analysis, efficiency analysis and Geographic Information System are present in 6.5% of the empirical papers analysed. Various optimisation techniques such as cost minimisation or profit maximisation are found in 5.4% of the papers and predictive techniques in 5.9%. Qualitative analyses are also used, such as sentiment analysis (9.2%).

3.2.2. According to Spatial Level

The result of the WoS search, in the empirical works integrating spatial levels, shows 223 documents: 35% are developed in China, 7.5% are applied globally, 6.2% in India, 5.7% in the USA and the rest in different European and Asian countries. There is a predominance of Asian and North American organizations that support and fund research. The micro-level accounted for about 23%, and meso and macro for about 43% and 34%, respectively (Figure 17).
Relating the spatial component to the type of sustainability studied in each paper (Figure 18), at the macro-level, there is a predominance of papers that analyse the three types of sustainability together (47%) and those that work only on environmental sustainability (35%). Social sustainability is only analysed at this spatial level. At the meso-level, most of the papers consider only the environmental part (59%), although there is also a high percentage of articles that analyse all three types of sustainability (39%). At the micro-level, the papers are more evenly distributed according to the type of sustainability addressed, with those analysing the environmental component once again standing out (32%).
Most of the SDGs have been studied at all spatial levels. At the macro-level, SDG9 and SDG11 have the same weight. However, at the rest of the levels, SDG11 stands out from SDG9. At the meso-level, 21.3% of the works apply to SDG9 and 32.4% to SDG11. At the micro-level, 24.2% are dedicated to SDG9 and 27.4% to SDG11. There are SDGs that are only analysed at the macro-level (SDG16, SDG17) and only SDG4 and SD14 have not been analysed for large countries (Figure 19).
The mathematical techniques most used in empirical work at the macro-level are neural networks and those of a qualitative nature, such as sentiment analysis. To a lesser extent, regression and Geographic Information System techniques are also applied. At the meso-level, the most commonly used techniques are multi-criteria decision-making methods, although there are also studies where regression techniques and factor analysis are used. At the micro-level, there is a predominance of works that analyse different indicators related to the subject matter of each one of them (generally of an environmental nature) and carry out analyses of the efficiency and effectiveness of specific companies.
The articles that work with neural networks and multi-criteria decision-making techniques are more inclined to analyse SDG9. The analysis of different indicators or regression techniques are more applied in SDG11.

4. Discussion and Conclusions

Achieving sustainability is the most complicated situation facing our planet. With the emergence of big data, which makes it possible to manipulate and obtain information from a large amount of data, and the development of mathematical tools, ways are being sought to achieve the desired sustainability as soon as possible.
In this context, it is very useful to know the existing scientific production on the use of big data to solve problems, both theoretical and empirical, to make a product, a company, a city, a country, etc., sustainable, all this through indicators and mathematical techniques. At the same time, and in compliance with UNESCO’s Agenda 2030, it is important to see the relationship between the documents found and the 17 sustainable development goals in order to find out which SDGs most attract researchers. In this way, it will be possible to identify the main lines of research on this topic and provide possible suggestions for future research.
The bibliographic database chosen to locate the scientific production on this topic was the Web of Science, as it is one of the most important databases in the world for bibliographic references and citations of periodical publications. Once the documents obtained with the chosen keywords had been purified, 325 articles were analysed. Of these, 34 are bibliometric studies, 68 are theoretical works and the remaining 223 are empirical.
The number of publications has grown exponentially, which shows the enormous importance of these lines of work among researchers. The areas of knowledge that deal with this subject are related to environmental sciences, technology, engineering, computer science and economics.
The most productive research institutions are located in Peoples R China, with The Dalian University of Technology standing out with publications that focus mainly on studies in the field of environmental sciences and engineering. China is also home to the largest number of scientific researchers, followed by the United States.
It was found that almost all publications are authored by more than three authors, although more than 90% of the authors are occasional authors with only one signed article. The author with the highest number of publications is Ming-Lang Tseng, with papers on sustainable supply chain management. Donald Huisingh (with three documents) is the author with the most citations, more citations per document and per year. Ming-Lang Tseng ranks second in the total number of citations and is surpassed by other authors when the average number of citations per article and per year is taken into account. In the top 10 authors with the most publications on the topic analysed, Ming-Lang Tseng has a higher h- and g-index than the others and is the second most productive behind Sachin S. Kamble.
The papers with the highest number of citations and the most citations on average per year are El-Kassar and Singh [63] and Yigitcanla et al. [64]. The former studies how to improve business performance by innovating to improve global sustainability and the latter analyses all papers on smart cities.
Sustainability, Journal of Cleaner Production and Sustainable Cities and Society are, in that order, the journals with the highest number of published papers, and together with ISPRS International Journal of Geo-Information and IEEE Access, cover 33% of the publications. Of these journals, the Journal of Cleaner Production is the most relevant in the subject studied, taking into account not only the number of publications, but also the total number of citations and the h-, g- and m-indexes.
The environmental part of sustainability has received the most attention from researchers, followed by the economic and, to a lesser extent, the social. The greatest concern is with promoting innovation and entrepreneurship (SDG9) and making cities more environmentally, economically and socially sustainable (SDG11). There is no work on SDG1, SDG 2, SDG 5 and SDG 10, as these have not been taken into account in the selected papers.
In the empirical papers, the mathematical techniques used to analyse sustainability based on big data include multidimensional regression, neural networks and the analysis of different indicators depending on the sector in which the research is applied. Methodologies based on fuzzy analysis, multi-criteria decision-making, factor analysis, efficiency analysis, Geographic Information Systems and optimisation techniques are also used together with qualitative analysis, such as sentiment analysis.
When taking into account the spatial level at which empirical studies are carried out, meso-level studies predominate, followed by macro- and micro-level studies. At the macro-level, the focus is more on analysing the three spheres of sustainability together, with the works that only take into account the environmental dimension also being important. At the meso-level, there are more publications on the environmental part, followed by the three types of sustainability. At the micro-level, the papers are more evenly distributed according to the type of sustainability dealt with, with those that analyse the environmental component once again standing out (32%). Analysing only the social part is performed at the macro-level, with studies of mobile applications and social networks in particular.
Most of the SDGs have been studied for all spatial levels. At the micro- and meso-levels, SDG11 stands out against SDG9, while at the large country level, both SDGs have been studied in the same proportion. There are SDGs that are only analysed at the macro-level (SDG16, SDG17), and SDG4 and SDG14 have not been studied for large countries.
At the macro-level, neural networks, qualitative techniques, regression and Geographic Information System are more commonly used. At the meso-level, the most commonly used techniques are multi-criteria decision-making methods, and at the micro-level, different indicators are analysed, mainly environmental indicators, and company efficiency analyses are carried out.
The results show that big data applied to supply chains, Industry 4.0 and the achievement of sustainable cities are the most important topics of current trends. One of the most interesting topics is the study of innovative solutions for supply chains within production, with the aim of achieving environmentally, economically and socially viable production.
Among the main contributions of this research is that different branches of research in the field of sustainability analysis with big data have been identified and that, according to the analysis of the results, the growing role of environmental issues and Sustainable Development Goals 9 and 11 stands out.
Regarding the limitations of this research, it should be noted, firstly, that this study has been restricted to the database WoS. Secondly, only articles have been analysed. It would be interesting to consider a broader line of research that would include other databases such as Scopus and Google Scholar and other types of publications such as books or conference proceedings.

Author Contributions

Conceptualization, M.L.-L., J.C.-F. and U.F.-M.; methodology, M.L.-L., J.C.-F. and U.F.-M.; software, M.L.-L., J.C.-F. and U.F.-M.; validation, M.L.-L., J.C.-F. and U.F.-M.; formal analysis, M.L.-L., J.C.-F. and U.F.-M.; investigation, M.L.-L., J.C.-F. and U.F.-M.; resources, M.L.-L., J.C.-F. and U.F.-M.; data curation, M.L.-L. and U.F.-M.; writing—original draft preparation, M.L.-L.; writing—review and editing, J.C.-F.; supervision, U.F.-M. All authors have read and agreed to the published version of the manuscript.

Funding

This research received no external funding.

Institutional Review Board Statement

Not applicable.

Informed Consent Statement

Not applicable.

Data Availability Statement

Not applicable.

Conflicts of Interest

The authors declare no conflict of interest.

References

  1. Manyika, J.; Chui, M.; Brown, B.; Bughin, J.; Dobbs, R.; Roxburgh, C.; Hung Byers, A. Big Data: The Next Frontier for Innovation, Competition, and Productivity; McKinsey Global Institute: Columbia, WA, USA, 2011. [Google Scholar]
  2. Cowls, J.; Schroeder, R. Causation, correlation, and big data in social science research. Policy Internet 2015, 7, 447–472. [Google Scholar] [CrossRef]
  3. Verma, S.; Bhattacharyya, S.S. Micro-foundation strategies of IOT, BDA, Cloud Computing: Do they really matter in bottom of pyramid? Strateg. Dir. 2016, 32, 36–38. [Google Scholar] [CrossRef]
  4. Ylijoki, O.; Porras, J. Perspectives to definition of big data: A mapping study and discussion. J. Innov. Manag. 2016, 4, 69–91. [Google Scholar] [CrossRef]
  5. Amankwah-Amoah, J. An integrative process model of organisational failure. J. Bus. Res. 2016, 69, 3388–3397. [Google Scholar] [CrossRef] [Green Version]
  6. McAfee, A.; Brynjolfsson, E.; Davenport, T.H.; Patil, D.J.; Barton, D. Big data: The management revolution. Harv. Bus. Rev. 2012, 90, 60–68. [Google Scholar]
  7. Khade, A.A. Performing customer behavior analysis using big data analytics. Procedia Comput. Sci. 2016, 79, 986–992. [Google Scholar] [CrossRef] [Green Version]
  8. Calvard, T.S. Big data, organizational learning, and sensemaking: Theorizing interpretive challenges under conditions of dynamic complexity. Manag. Learn. 2016, 47, 65–82. [Google Scholar] [CrossRef] [Green Version]
  9. Marfo, J.S.; Boateng, R. Big Data and Organizational Learning: Conceptualizing the Link. In Second International Conference on E-Learning, E-Education, and Online Training; Springer: Cham, Switzerland, 2015; pp. 159–164. [Google Scholar]
  10. Gamage, P. New development: Leveraging ‘big data’ analytics in the public sector. Public Money Manag. 2016, 36, 385–390. [Google Scholar] [CrossRef]
  11. Desouza, K.C.; Jacob, B. Big data in the public sector: Lessons for practitioners and scholars. Adm. Soc. 2017, 49, 1043–1064. [Google Scholar] [CrossRef]
  12. Fredriksson, C.; Mubarak, F.; Tuohimaa, M.; Zhan, M. Big data in the public sector: A systematic literature review. Scand. J. Public Adm. 2017, 21, 39–62. [Google Scholar]
  13. Kim, G.H.; Trimi, S.; Chung, J.H. Big-data applications in the government sector. Commun. ACM 2014, 57, 78–85. [Google Scholar] [CrossRef]
  14. Creutzig, F.; Roy, J.; Lamb, W.F.; Azevedo, I.M.; De Bruin, W.B.; Dalkmann, H.; Edelenbosch, O.Y.; Geels, F.W.; Grubler, A.; Hepburn, C.; et al. Towards demand-side solutions for mitigating climate change. Nat. Clim. Chang. 2018, 8, 260–263. [Google Scholar] [CrossRef] [Green Version]
  15. Solomon, C.G.; LaRocque, R.C. Climate change—A health emergency. N. Engl. J. Med. 2019, 380, 209–211. [Google Scholar] [CrossRef] [PubMed]
  16. Holmberg, J.; Sandbrook, R. Sustainable development: What is to be done? In Policies for a Small Planet; Routledge: London, UK, 2019; pp. 19–38. [Google Scholar]
  17. Mauerhofer, V. Sustainable development law in (only) one world: Challenges and perspectives for governance and governments. In Sustainability and Law; Springer: Berlin/Heidelberg, Germany, 2020; pp. 15–31. [Google Scholar]
  18. Szopik-Depczyńska, K.; Kędzierska-Szczepaniak, A.; Szczepaniak, K.; Cheba, K.; Gajda, W.; Ioppolo, G. Innovation in sustainable development: An investigation of the EU context using 2030 agenda indicators. Land Use Policy 2018, 79, 251–262. [Google Scholar] [CrossRef]
  19. Liu, G. Development of a general sustainability indicator for renewable energy systems: A review. Renew. Sust. Energ. Rev. 2014, 31, 611–621. [Google Scholar] [CrossRef]
  20. Rahdari, A.H.; Rostamy, A.A.A. Designing a general set of sustainability indicators at the corporate level. J. Clean. Prod. 2015, 108, 757–771. [Google Scholar] [CrossRef]
  21. Shen, L.; Guo, X. Spatial quantification and pattern analysis of urban sustainability based on a subjectively weighted indicator model: A case study in the city of Saskatoon, SK, Canada. Appl. Geogr. 2014, 53, 117–127. [Google Scholar] [CrossRef]
  22. Cutaia, F. The Use of Landscape Indicators in Environmental Assessment. In Strategic Environmental Assessment: Integrating Landscape and Urban Planning; Springer: Berlin/Heidelberg, Germany, 2016; pp. 29–43. [Google Scholar]
  23. King, L.O. Functional sustainability indicators. Ecol. Indic. 2016, 66, 121–131. [Google Scholar] [CrossRef]
  24. Böhringer, C.; Jochem, P.E. Measuring the immeasurable—A survey of sustainability indices. Ecol. Econ. 2007, 63, 1–8. [Google Scholar] [CrossRef] [Green Version]
  25. Pupphachai, U.; Zuidema, C. Sustainability indicators: A tool to generate learning and adaptation in sustainable urban development. Ecol. Indic. 2017, 72, 784–793. [Google Scholar] [CrossRef]
  26. Huang, L.; Wu, J.; Yan, L. Defining and measuring urban sustainability: A review of indicators. Landsc. Ecol. 2015, 30, 1175–1193. [Google Scholar] [CrossRef]
  27. Dizdaroglu, D. Developing micro-level urban ecosystem indicators for sustainability assessment. Env. Impact Assess Rev. 2015, 54, 119–124. [Google Scholar] [CrossRef]
  28. Huovila, A.; Bosch, P.; Airaksinen, M. Comparative analysis of standardized indicators for Smart sustainable cities: What indicators and standards to use and when? Cities 2019, 89, 141–153. [Google Scholar] [CrossRef]
  29. Zavadskas, E.K.; Govindan, K.; Antucheviciene, J.; Turskis, Z. Hybrid multiple criteria decision-making methods: A review of applications for sustainability issues. Econ. Res.-Ekon. Istraz. 2016, 29, 857–887. [Google Scholar] [CrossRef] [Green Version]
  30. Farsi, M.; Hosseinian-Far, A.; Daneshkhah, A.; Sedighi, T. Mathematical and computational modelling frameworks for integrated sustainability assessment (ISA). In Strategic Engineering for Cloud Computing and Big Data Analytics; Springer: Berlin/Heidelberg, Germany, 2017; pp. 3–27. [Google Scholar]
  31. Rossberg, A.G. On the mathematics of sustainability. Nat. Sustain. 2018, 1, 615–616. [Google Scholar] [CrossRef]
  32. Hammad, A.W.; Rey, D.; Bu-Qammaz, A.; Grzybowska, H.; Akbarnezhad, A. Mathematical optimization in enhancing the sustainability of aircraft trajectory: A review. Int. J. Sustain. Transp. 2020, 14, 413–436. [Google Scholar] [CrossRef]
  33. Holden, G.; Rosenberg, G.; Barker, K. Bibliometrics: A potential decision making aid in hiring, reappointment, tenure and promotion decisions. Soc. Work Health Care 2005, 41, 67–92. [Google Scholar] [CrossRef] [PubMed]
  34. Ball, R. Handbook Bibliometrics; De Gruyter Saur, ETH-Library: Zürich, Switzerland, 2020. [Google Scholar]
  35. Ghisellini, P.; Cialani, C.; Ulgiati, S. A review on circular economy: The expected transition to a balanced interplay of environmental and economic systems. J. Clean. Prod. 2016, 114, 11–32. [Google Scholar] [CrossRef]
  36. De Pascale, A.; Arbolino, R.; Szopik-Depczyńska, K.; Limosani, M.; Ioppolo, G. A systematic review for measuring circular economy: The 61 indicators. J. Clean. Prod. 2020, 281, 124942. [Google Scholar] [CrossRef]
  37. Stahlschmidt, S.; Stephen, D. Comparison of Web of Science, Scopus and Dimensions databases. In KB Forschungspoolprojekt; DZHW: Hannover, Germany, 2020. [Google Scholar]
  38. Persson, O.; Danell, R.; Schneider, J.W. How to use Bibexcel for various types of bibliometric analysis. In Celebrating Scholarly Communication Studies: A Festschrift for Olle Persson at His 60th Birthday; Sweden, 2009; pp. 9–24. Available online: https://portal.research.lu.se/ws/files/5902071/1458992.pdf (accessed on 10 October 2021).
  39. Chen, C. CiteSpace II: Detecting and visualizing emerging trends and transient patterns in scientific literature. J. Assoc. Inf. Sci. Technol. 2006, 57, 359–377. [Google Scholar] [CrossRef] [Green Version]
  40. Van Eck, N.J.; Waltman, L. CitNetExplorer: A new software tool for analyzing and visualizing citation networks. J. Informetr. 2014, 8, 802–823. [Google Scholar] [CrossRef] [Green Version]
  41. Van Eck, N.J.; Waltman, L. Software survey: VOSviewer, a computer program for bibliometric mapping. Scientometrics 2010, 84, 523–538. [Google Scholar] [CrossRef] [Green Version]
  42. Bailón Moreno, R. Ingeniería del Conocimiento y Vigilancia Tecnológica Aplicada a la Investigación en el Campo de los Tensioactivos. Desarrollo de un Modelo Ciencimétrico Unificado; Universidad de Granada: Granada, Spain, 2013. [Google Scholar]
  43. Aria, M.; Cuccurullo, C. Bibliometrix: An R-tool for comprehensive science mapping analysis. J. Inf. 2017, 11, 959–975. [Google Scholar] [CrossRef]
  44. Cobo, M.J.; López-Herrera, A.G.; Herrera-Viedma, E.; Herrera, F. SciMAT: A new science mapping analysis software tool. J. Assoc. Inf. Sci. Technol. 2012, 63, 1609–1630. [Google Scholar] [CrossRef]
  45. Sci2 Team. Science of Science (Sci2) Tool. Indiana University and SciTech Strategies. 2009. Available online: https://sci2.cns.iu.edu (accessed on 15 August 2021).
  46. Uddin, A. ScientoText: Text & Scientometric Analytics. R Package Version 0.1. 2016. Available online: https://cran.r-project.org/web/packages/scientoText/index.html (accessed on 10 October 2021).
  47. Porter, A.L.; Cunningham, S.W. Tech Mining: Exploiting New Technologies for Competitive Advantage; Wiley-Interscience: Hoboken, NJ, USA, 2014. [Google Scholar]
  48. Sangam, S.; Mogali, M.S.S. Mapping and visualization software tools: A review. In Proceedings of the International Conference on Content Management in Networked, Tumkur University, Tumkur, India, 3–4 December 2012. [Google Scholar]
  49. Alhuay-Quispe, J. Evaluación de Software Aplicados a Estudios Métricos. IV Jornadas Académicas Bibliotecológicas yArchivísticas. Medellín-Colombia, 10 y 11 de Setiembre del 2015. Available online: http://eprints.rclis.org/27963/ (accessed on 10 August 2021).
  50. Moral-Muñoz, J.A.; Herrera-Viedma, E.; Santisteban-Espejo, A.; Cobo, M.J. Software tools for conducting bibliometric analysis in science: An up-to-date review. Prof. Inf. 2020, 29, e290103. [Google Scholar] [CrossRef] [Green Version]
  51. Pinto, A.L.; de Aquino Silva, R.; Dyck, A.F.; de Araújo, G.M.; Dutra, M.L. Expert Bibliometrics: An Application Service for Metric Studies of Information. In International Conference on Data and Information in Online; Springer: Berlin/Heidelberg, Germany, 2021; pp. 54–63. [Google Scholar]
  52. Wuni, I.Y.; Shen, G.Q.; Osei-Kyei, R. Scientometric Review of Global Research Trends on Green Buildings in Construction Journals from 1992 to 2018. Energy Build. 2019, 190, 69–85. [Google Scholar] [CrossRef]
  53. Yu, Y.; Li, Y.; Zhang, Z.; Gu, Z.; Zhong, H.; Zha, Q.; Yang, L.; Zhu, C.; Chen, E. A bibliometric analysis using VOSviewer of publications on COVID-19. Ann. Transl. Med. 2020, 8, 816. [Google Scholar] [CrossRef] [PubMed]
  54. Huang, T.; Wu, H.; Yang, S.; Su, B.; Tang, K.; Quan, Z.; Zhong, W.; Luo, X. Global trends of researches on sacral fracture surgery: A bibliometric study based on VOSviewer. Spine 2020, 45, E721–E728. [Google Scholar] [CrossRef]
  55. Xie, L.; Chen, Z.; Wang, H.; Zheng, C.; Jiang, J. Bibliometric and visualized analysis of scientific publications on atlantoaxial spine surgery based on Web of Science and VOSviewer. World Neurosurg. 2020, 137, 435–442. [Google Scholar] [CrossRef]
  56. Dervis, H. Bibliometric analysis using Bibliometrix an R Package. J. Scientometr. Res. 2019, 8, 156–160. [Google Scholar] [CrossRef]
  57. Jalal, S.K. Co-authorship and co-occurrences analysis using Bibliometrix R-package: A case study of India and Bangladesh. Ann. Libr. Inf. Stud. 2019, 66, 57–64. [Google Scholar]
  58. Rodríguez-Soler, R.; Uribe-Toril, J.; Valenciano, J.D.P. Worldwide trends in the scientific production on rural depopulation, a bibliometric analysis using bibliometrix R-tool. Land Use Policy 2020, 97, 104787. [Google Scholar] [CrossRef]
  59. Kumar, K. Author productivity of covid-19 research output globally: Testing lotka’s law in Kumar, K Dr, “Author Productivity of COVID-19 Research Output Globally: Testing Lotka’s Law”, 2020. Libr. Philos. Pract. E-J. 2020, 4372, 1–17. [Google Scholar]
  60. Tran, C.Y.; Aytac, S. Scientific Productivity, Lotka’s Law, and STEM Librarianship. Sci. Technol. Libr. 2021, 40, 316–324. [Google Scholar] [CrossRef]
  61. Da Silva, S.; Perlin, M.; Matsushita, R.; Santos, A.A.; Imasato, T.; Borenstein, D. Lotka’s law for the Brazilian scientific output published in journals. J. Inf. Sci. 2019, 45, 705–709. [Google Scholar] [CrossRef]
  62. Figueredo-Gaspari, E. Valoración curricular de las publicaciones científicas. Med. Clin 2005, 125, 661–665. [Google Scholar] [CrossRef] [PubMed]
  63. Vanclay, J.K. On the robustness of the h-index. J. Am. Soc. Inf. Sci. Technol. 2007, 58, 1547–1550. [Google Scholar] [CrossRef]
  64. Harzing, A.-W. Reflections on the h-Index. Research in International Management. 2007. Available online: https://harzing.com/publications/white-papers/reflections-on-the-h-index (accessed on 10 August 2021).
  65. El-Kassar, A.N.; Singh, S.K. Green innovation and organizational performance: The influence of big data and the moderating role of management commitment and HR practices. Technol. Soc. Chang. 2019, 144, 483–498. [Google Scholar] [CrossRef]
  66. Yigitcanla, T.; Kamruzzaman, M.; Foth, M.; Sabatini-Marques, J.; da Costa, E.; Ioppolo, G. Can cities become smart without being sustainable? A systematic review of the literature. Sustain. Cities Soc. 2019, 45, 348–365. [Google Scholar] [CrossRef]
  67. Wu, K.J.; Liao, C.J.; Tseng, M.L.; Lim, M.K.; Hu, J.; Tan, K. Toward sustainability: Using big data to explore the decisive attributes of supply chain risks and uncertainties. J. Clean. Prod. 2017, 142, 663–676. [Google Scholar] [CrossRef]
  68. Kissling, W.D.; Ahumada, J.A.; Bowser, A.; Fernandez, M.; Fernández, N.; García, E.A.; Guralnick, R.P.; Isaac, N.J.B.; Kelling, S.; Los, W.; et al. Building essential biodiversity variables (EBV s) of species distribution and abundance at a global scale. Biol. Rev. 2018, 93, 600–625. [Google Scholar] [CrossRef] [PubMed] [Green Version]
  69. Hazen, B.T.; Skipper, J.B.; Ezell, J.D.; Boone, C.A. Big data and predictive analytics for supply chain sustainability: A theory-driven research agenda. Comput. Ind. Eng. 2016, 101, 592–598. [Google Scholar] [CrossRef]
  70. Song, M.; Cen, L.; Zheng, Z.; Fisher, R.; Liang, X.; Wang, Y.; Huisingh, D. How would big data support societal development and environmental sustainability? Insights and practices. J. Clean. Prod. 2017, 142, 489–500. [Google Scholar] [CrossRef] [Green Version]
  71. Tsai, S.B.; Xue, Y.; Zhang, J.; Chen, Q.; Liu, Y.; Zhou, J.; Dong, W. Models for forecasting growth trends in renewable energy. Renew. Sustain. Energy Rev. 2017, 77, 1169–1178. [Google Scholar] [CrossRef]
  72. Li, Y.; Cao, Z.; Long, H.; Liu, Y.; Li, W. Dynamic analysis of ecological environment combined with land cover and NDVI changes and implications for sustainable urban–rural development: The case of Mu Us Sandy Land, China. J. Clean. Prod. 2017, 142, 697–715. [Google Scholar] [CrossRef]
  73. Kamble, S.S.; Gunasekaran, A.; Gawankar, S.A. Achieving sustainable performance in a data-driven agriculture supply chain: A review for research and applications. Int. J. Prod. Econ. 2019, 219, 179–194. [Google Scholar] [CrossRef]
  74. Mosavi, A.; Salimi, M.; Faizollahzadeh Ardabili, S.; Rabczuk, T.; Shamshirband, S.; Varkonyi-Koczy, A.R. State of the art of machine learning models in energy systems, a systematic review. Energies 2020, 12, 1301. [Google Scholar] [CrossRef] [Green Version]
  75. Dehdarirad, T.; Villarroya, A.; Barrios, M. Research on women in science and higher education: A bibliometric analysis. Scientometrics 2015, 103, 795–812. [Google Scholar] [CrossRef] [Green Version]
  76. Su, Y.S.; Lin, C.L.; Chen, S.Y.; Lai, C.F. Bibliometric Study of Social Network Analysis Literature. Libr. Hi Tech 2019, 38, 420–433. [Google Scholar] [CrossRef]
Figure 1. Research system for literature analysis.
Mathematics 09 02557 g001
Figure 2. Keyword distribution.
Mathematics 09 02557 g002
Figure 3. Exponential adjustment of the number of publications per year (2015–2020).
Mathematics 09 02557 g003
Figure 4. Average citations per year per publication.
Mathematics 09 02557 g004
Figure 5. Overlap—knowledge area.
Mathematics 09 02557 g005
Figure 6. Distribution by institution.
Mathematics 09 02557 g006
Figure 7. Distribution of authors by country based on Bibliometrix.
Mathematics 09 02557 g007
Figure 8. Total citations and average article citations by country.
Mathematics 09 02557 g008
Figure 9. Percentage of papers according to the number of authors.
Mathematics 09 02557 g009
Figure 10. The frequency distribution of scientific productivity with Bibliometrix.
Mathematics 09 02557 g010
Figure 11. Direct citation network based on Bibliometrix.
Mathematics 09 02557 g011
Figure 12. Collaboration network with VOSviewer.
Mathematics 09 02557 g012
Figure 13. Bradford’s Law based on Bibliometrix.
Mathematics 09 02557 g013
Figure 14. Distribution of papers by type of sustainability analysed.
Mathematics 09 02557 g014
Figure 15. Distribution of the papers by SDGs.
Mathematics 09 02557 g015
Figure 16. Distribution of the papers by SDGs studied.
Mathematics 09 02557 g016
Figure 17. Spatial level of empirical work.
Mathematics 09 02557 g017
Figure 18. Distribution of papers by spatial level and sustainability dimension.
Mathematics 09 02557 g018
Figure 19. Distribution of papers by spatial level and SDG analysed.
Mathematics 09 02557 g019
Table 1. Number of publications per year.
YearNumber of Publications
20157
201610
201725
201847
201974
2020101
202161
Total325
Table 2. Distribution by knowledge area.
Knowledge Area
1. Environmental Sciences Ecology142
2. Science Technology Other Topics121
3. Engineering90
4. Computer Science46
5. Business Economics34
6. Energy Fuels21
7. Remote Sensing15
8. Operations Research Management Science13
9. Construction Building Technology12
10. Physical Geography9
Table 3. Distribution by author.
AuthorArticlesFractional
Index
Total CitesTotal Cites/ArticlesTotal Citas/Yearh-Indexg-Indexm-Index
Tseng, Ming-Lang71.414120.128.2671.20
Cui, Li40.94511.311.3440.80
Mosavi, Amir40.76616.522.0341.00
Song, Malin40.910927.321.8340.60
Wu, Kuo-Jui40.913433.544.7440.80
Lim, Ming K.40.812230.524.4340.60
Kamble, Sachin S.30.99130.391.0331.50
Dai, Jing30.74013.320.0331.00
Huisingh, Donald31.119063.395.0330.60
Liu, Yang30.631.01.0130.33
Luthra, Sunil30.83110.310.3230.67
Table 4. Ranking of the 10 most cited papers.
ArtículoCitationsAverage
Green innovation and organizational performance: The influence of big data and the moderating role of management commitment and HR practices [65]12742.33
Can cities become smart without being sustainable? A systematic review of the literature [66]11438
Toward sustainability: using big data to explore the decisive attributes of supply chain risks and uncertainties [67] 9719.4
Building essential biodiversity variables (EBVs) of species distribution and abundance at a global scale [68] 9423.5
Big data and predictive analytics for supply chain sustainability: A theory-driven research agenda [69] 8914.83
How would big data support societal development and environmental sustainability? Insights and practices [70] 8016
Models for forecasting growth trends in renewable energy [71] 7314.6
Dynamic analysis of ecological environment combined with land cover and NDVI changes and implications for sustainable urban-rural development: The case of Mu Us Sandy Land, China [72] 7214.4
Achieving sustainable performance in a data-driven agriculture supply chain: A review for research and applications [73] 6432
State-of-the-Art of Machine Learning Models in Energy Systems, a Systematic Review [74] 6421.33
Table 5. Journals ordered by number of articles indexed in WoS.
SourcesNo. of ArticlesAreaWoS QuartileImpact Factor (2020)
Sustainability58EVSC, EVST, GSTQ23.251
Journal of Cleaner Production32ENG, EVSC, GSTQ19.297
Sustainable Cities and Society10CBT, EGF, GSTQ18.530
ISPRS International Journal of Geo-Information7CS, GEO, RTSQ23.390
IEEE Access6CS, ENG, TELQ24.48
Resources, Conservation & Recycling6ENG, EVSCQ110.204
Remote Sensing5EVSC, GES, ISP, RTSQ14.848
Journal of Enterprise Information Management4ISL, MNGQ15.396
Applied Sciences-Basel3CHE, PHY, ENG, MSCQ22.679
Computers & Operations Research3CS, ENG, ORMQ24.008
Energies3EFQ33.004
Environmental Science and Pollution Research3EVSCQ24.223
International Journal of Production Economics3ENGQ17.885
Technological Forecasting and Social Change3BUS, RUPQ18.593
BUS = Business, CBT = Construction and Building Technology, CHE = Chemistry, CS = Computer Science, EF = Energy and Fuels, ENG = Engineering, GEO = Geography, EVSC = Environmental Sciences, EVST = Environmental Studies, GES = Geosciences, GST = Green and Sustainable Science and Technology, ISL = Information Science and Library Science, ISP = Imaging Science and Photographic Technology, MNG = Management, MSC = Material Sciences, ORM = Operations Research & Management Science, PHY = Physics, RTS = Remote Sensing, RUP = Regional and Urban Planning, TEL = Telecommunications.
Table 6. Main indexes of the most published journals.
Sourceh-Indexg-Indexm-IndexTCNPPY-Start
Sustainability8111.6238582017
Journal of Cleaner Production18273.6767322017
Sustainable Cities and Society4100.8194102017
ISPRS International Journal of Geo-Information340.752072018
IEEE Access360.757062018
Resources Conservation and Recycling46113562018
Remote Sensing250.57352018
Journal of Enterprise Information Management24 1642021
Applied Sciences-Basel230.672532019
Computers & Operations Research330.758732018
TC = Total citations, NP = No. of publications, PY-start = year of the first article in the analysed database.
Publisher’s Note: MDPI stays neutral with regard to jurisdictional claims in published maps and institutional affiliations.

