1. Introduction
The automotive industry has recently shifted from developing advanced vehicles to smart transportation, which focuses on the evolution of new intelligent vehicles with autonomous driving and control capabilities [
1]. Autonomous Driving Vehicles (ADVs) are highly complex multidisciplinary products, which integrate sensors, automotive control, information processing, artificial intelligence and ultra-fast communication capabilities. The ADVs must have a precise knowledge of the locations of other vehicles in the vicinity. They should be able to determine how to reach the destination optimally without any human intervention [
2]. They should also comprehensively sense the surrounding environment for other road users and weather conditions to avoid collisions and accidents. Furthermore, it should detect road signs as well as other static road infrastructure details such as traffic lights, lanes, crosswalks, and speed bumps. In existing technologies, for detecting the surrounding environment in different driving conditions, the sensing systems use a range of cameras, radar, lidar, laser range finders and advanced autonomous driving algorithms [
3].
The vehicles on the road with some common interests can cooperatively form a platoon-based driving pattern whereby one vehicle follows another vehicle and maintains a small and nearly constant distance to the preceding vehicle. In this context, several mathematical models on car-following (CF) behaviour have been proposed by traffic engineers and traffic psychologists based on empirical examination and conceptual principles. The foundation of these models is based on simulations and traffic control theories. One of the early linear CF models has been proposed by Chandler et al. [
4] and Herman et al. [
5], while non-linear models proposed by Reuschel [
6], Pipes [
7], Gazis et al. [
8], Helbing and Tilch [
9], and Jiang et al. [
10]. Some of these models provided a steady-flow equation for traffic flow from the collected observational and experimental data. Moreover, they discussed several properties of actual traffic flow, such as unstable traffic flow, rise in traffic congestion and formulation of stop-and-go traffic scenarios.
However, these types of models are not suitable for predicting accurate gaps between the vehicles in dense traffic situations as the gap between the vehicles does not relax to an equilibrium value. For example, suppose the relative velocity between two vehicles is zero. In that case, the smallest value of the bumper-to-bumper (actual) gap will not necessarily initiate deceleration, which will result in an accident. Also, these models do not consider any speed limit restriction for vehicles speeding on the free road. To address the abovementioned challenges, Newell [
11] and Bando et al. [
12] proposed an Optimal Velocity Model (OVM) with an acceleration function with more improvements to provide accident-free driving. These CF models combine the vehicles’ desired velocity on a single road and free driving condition with implementing a new breaking strategy to avoid any collisions or accidents.
Moreover, these CF models play a crucial role in describing how one vehicle uninterruptedly follows another vehicle by maintaining its relative velocities with respect to the desired distance between them [
13,
14]. The follower vehicles would require an automatic control of velocity to the other platoon vehicles as well as their inter-vehicular distance to operate efficiently [
15]. Therefore, the CF model and vehicle platooning can be envisioned as the next progressive step towards the more advanced driver assistance systems such as dynamic platoon detection or avoidance of front collision, lane departure warning, autonomous acceleration, and emergency braking [
16]. We adopted one such CF model from the OVM family, called Intelligent Driver Model (IDM), for this research work.
Regarding platooning coordination, vehicular communication technologies can be used to develop cooperation among vehicles in traffic environments [
17]. The IEEE 802.11p and IEEE 1609-family standards are developed for vehicular communications in telematics. The Federal Communications Commission and European Telecommunications Standard Institute have mandated the use of 5.9 GHz frequency spectrum for Dedicated Short-Range Communication (DSRC) in the vehicular environment and safety-related application in Intelligent Transportation Systems (ITS). Technology-enabled vehicular communication includes Vehicle-to-Vehicle (V2V) and Vehicle-to-Infrastructure (V2I) communication, commonly known as Vehicle-to-Everything (V2X) communication [
18]. Moreover, the vehicular networking performance can be improved significantly by the platoon-based driving pattern, as the relatively fixed position of the vehicles in the single platoon can facilitate better cooperative communication [
19]. V2X communication can help detect surrounding environments more precisely and help promote a safe and accident-free driving environment for the vehicle platoon [
20]. The V2X communication can serve as an extra layer of protection in platoon based autonomous driving with vehicles periodically broadcasting Cooperative Awareness Messages (CAMs) to the neighbouring vehicles and infrastructure. It helps other vehicles accurately map their surroundings and improve decision-making capability [
21]. The coordination of vehicular communication technology with platoon-based traffic modelling can support and boost the development of safe and efficient semi-autonomous driving environments.
Considering the above remarks, in this work, we propose an integrated design of a V2X control architecture for a platoon of vehicles focusing on safety in urban and highway traffic environments. For this, we consider the well-known IDM as it emulates human driver’s physiological behaviours [
22]. It is to be noted that, in the context of this work, any other model such as a cooperative control-based model or a consensus control-based model could be used. Our focus is not on designing or improving CF models but rather investigating the numerical implementation of the V2X control architecture incorporating any kind of CF model. The contributions of the paper can be summarised in the following major folds:
- (1)
Firstly, an extension of the IDM is derived considering V2V and V2I communication together called V2X.
- (2)
Secondly, a channel estimation model for V2X communication is developed, optimising signal level altering physical layer parameters settings.
- (3)
Thirdly, six case studies are designed for integrating vehicular communication-centric coordination within different on-road vehicles in the platoon.
- (4)
Finally, the V2X Enabled Intelligent Driver Model (VX-IDM) model performance is assessed and compared with the state-of-the-art models considering standard vehicular parameter settings and metrics.
The rest of this paper is organised as follows.
Section 2 presents related work on autonomous vehicles.
Section 3 presents the details of the proposed framework VX-IDM for cooperative autonomous driving. The validity of the findings and results are discussed in
Section 4, followed by the conclusion presented in
Section 5.
2. Related Works
In this section, an overview of platoon-based vehicular communication and their implementation on vehicle platoon and implementation challenges are discussed and presented. Several empirical studies have been performed in the SARTRE project from 2009–2012 to evaluate and demonstrate vehicle platooning’s performance by implementing IEEE 802.11p-based communication systems [
23]. They successfully deployed a platoon of two trucks and three cars driven autonomously at a speed of 90 km/h with approximately 5–7 m inter-vehicular gap. In Japan’s national ITS project named Energy ITS, three fully autonomous trucks were successfully tested on an expressway at 80 km/h with 10 m of an inter-vehicular gap. They used 76 GHz radar and lidar to control longitudinal manoeuvres, while inter-vehicular communication is facilitated by the 5.8 GHz DSRC. For the European Truck Platooning Challenge, several major truck vendors—such as DAF, MAN, and Daimler—drove their trucks in platoons on public roads from various European Cities to Rotterdam in The Netherlands [
24]. The published work from these vendors indicates that they used IEEE 802.11p communication modules for inter-vehicular communication. Another study, called the PATH program, led by UC Berkeley and Volvo, successfully demonstrated the platoon of three IEEE 802.11p-equipped trucks driving on the busy 110 Interstate Freeway in Los Angeles with a 15 m inter-vehicular gap [
25,
26,
27].
These field trials certainly provide valuable information with a thorough analysis of platooning performance under a realistic radio propagation environment for V2X communication with actual vehicle dynamics. However, they do not account for emergency scenarios where the platoons on the highway would require more information about traffic, accidents, weather conditions further away from them on the road as they would not know how to refrain themselves from such an emergency situation if their information database only consists of the local driving environment rather than global driving environment. Therefore, V2I communication is necessary along with platooning, and therefore simulations are an essential tool to study the ability of different V2I technologies to meet the requirements of the ITS applications [
28,
29]. A comprehensive simulation framework to investigate the Adaptive Cruise Control (ACC) performance in noisy communication conditions is presented by [
30]. The results show that the ACC algorithm’s performance significantly depends on the broadcast frequency and loss ratio of the CAM messages.
In [
31,
32], a consensus-based study on platoon with multiple wireless control communication topologies are proposed in the presence of interference, delay and fading conditions. The results show the improvement in comfort level and safety of platoon drivers. Another study to investigate the inter platoon communication facilitated by IEEE 802.11p on control, safety, and dedicated service channels is proposed by [
33]. The results show that the guarantee of timely channel access for all packets within a specified deadline is achieved while still providing reasonable dissemination delay. The multiple adaptive CAM beaconing schemes are implemented in IEEE 802.11p for the ACC to manage and maintain the platoons on a freeway is evaluated in [
34,
35,
36]. The results show that this system met the stringent requirement regarding update frequency and communication reliability for ACC.
Furthermore, few more studies that evaluate ACC’s performance implemented with IEEE 802.11p are provided in [
37]. The Block Error Rate (BER) versus Signal-to-Noise Ratio (SNR) for wireless communication link and Packet Reception Rate (PRR) versus Distance for the system stability performances for Cellular-Vehicle-to-Everything (C-V2X) and IEEE 802.11p are compared and evaluated [
38]. To achieve the 10% BER target, the C-V2X provides 4–5 dB and 1.3 dB SNR gains over IEEE 802.11p in Line-of-Sight (LOS) condition and Non-Line-of-Sight (NLOS) condition, respectively. To achieve the 90% PRR target, the C-V2X provides a 95% and 55% gain in coverage over IEEE 802.11p in highway and urban scenarios, respectively [
39].
Similar models investigating the ACC performance in terms of complex traffic scenarios with V2V and V2I communication are suggested in the studies [
40,
41]. They designed a suitable vehicle driving strategy and proposed an improved consensus-based control algorithm for the Cooperative Driving System considering V2X communications for CF models. Network and traffic simulators are employed for studying platooning scenarios to support the simulations for wireless communication and complex traffic scenarios. The effects of V2X communication on system performance—such as transmission delay, transmission coverage, and measurement noise—is studied theoretically and verified by numerical simulations. However, none of these studies shows how wireless communication link and system stability gains of C-V2X would affect platoon performance. There is no mapping between the implementation of the wireless technologies and the achievable inter-vehicle distance or how the platoon would react and follow the policies enforced by the V2I communication.
3. A Framework for Cooperative Autonomous Vehicles
This section presents an IDM and channel estimation model for V2X communication in a platoon. Its focus is on the control mechanism of IDM and implementing IEEE 802.11p vehicular standards for ADVs in urban and highway driving environments.
3.1. IDM for a Platoon of ADVs
In this work, IDM is used with an 802.11p V2I channel for modelling communication for future ADVs [
22]. The IDM is a deterministic, autonomous, and microscopic CF model from the OVM family. This traffic flow model is used for the simulation of highway and urban traffic scenarios. The IDM considers the quadratic relation between speed and braking distance of the vehicles. It also considers the relative velocity
between the preceding and the following vehicle, which makes it accident-free.
The IDM uses two microscopic measures mainly, safe time gap or distance headway , and actual distance (gap) to calculate longitudinal spacing between the vehicles, which are dependent on the length of vehicles and the actual gap between the vehicles.
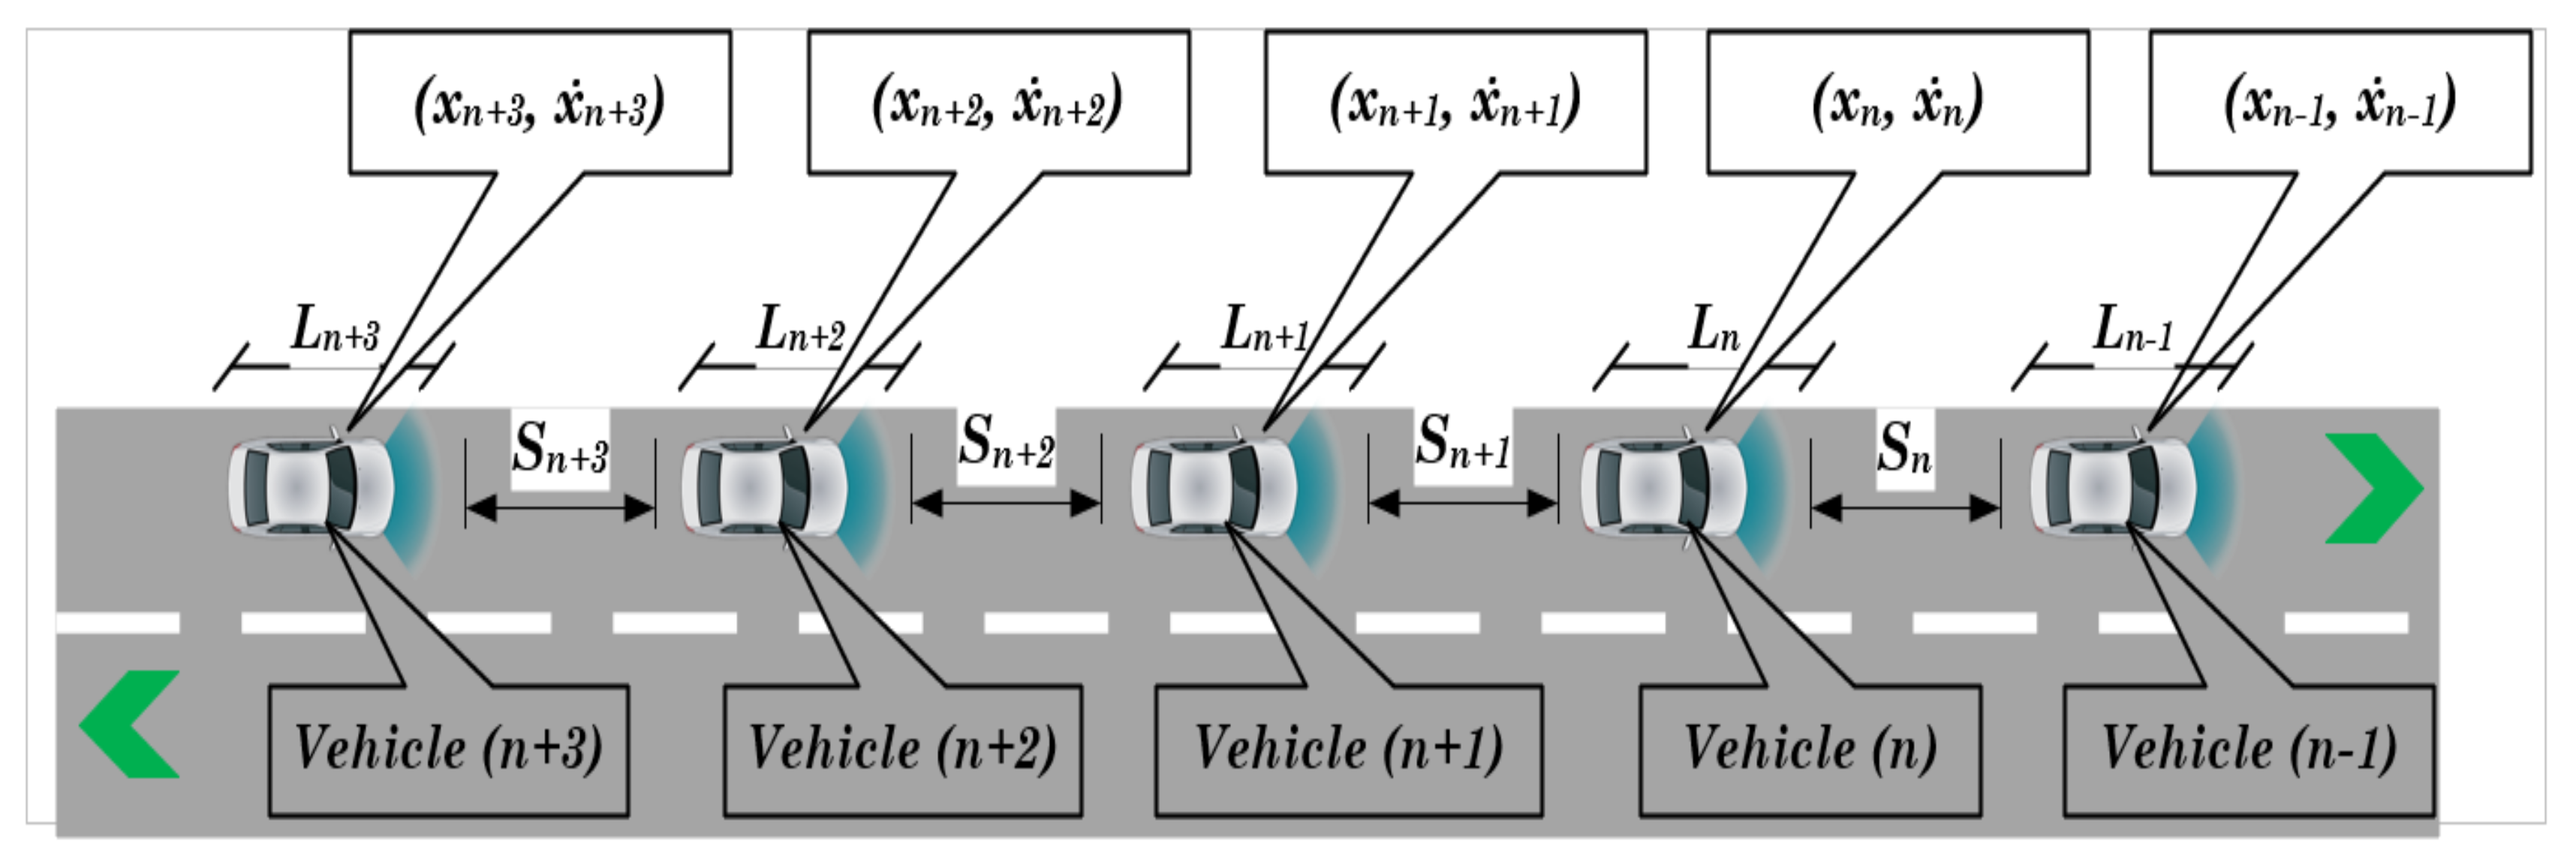
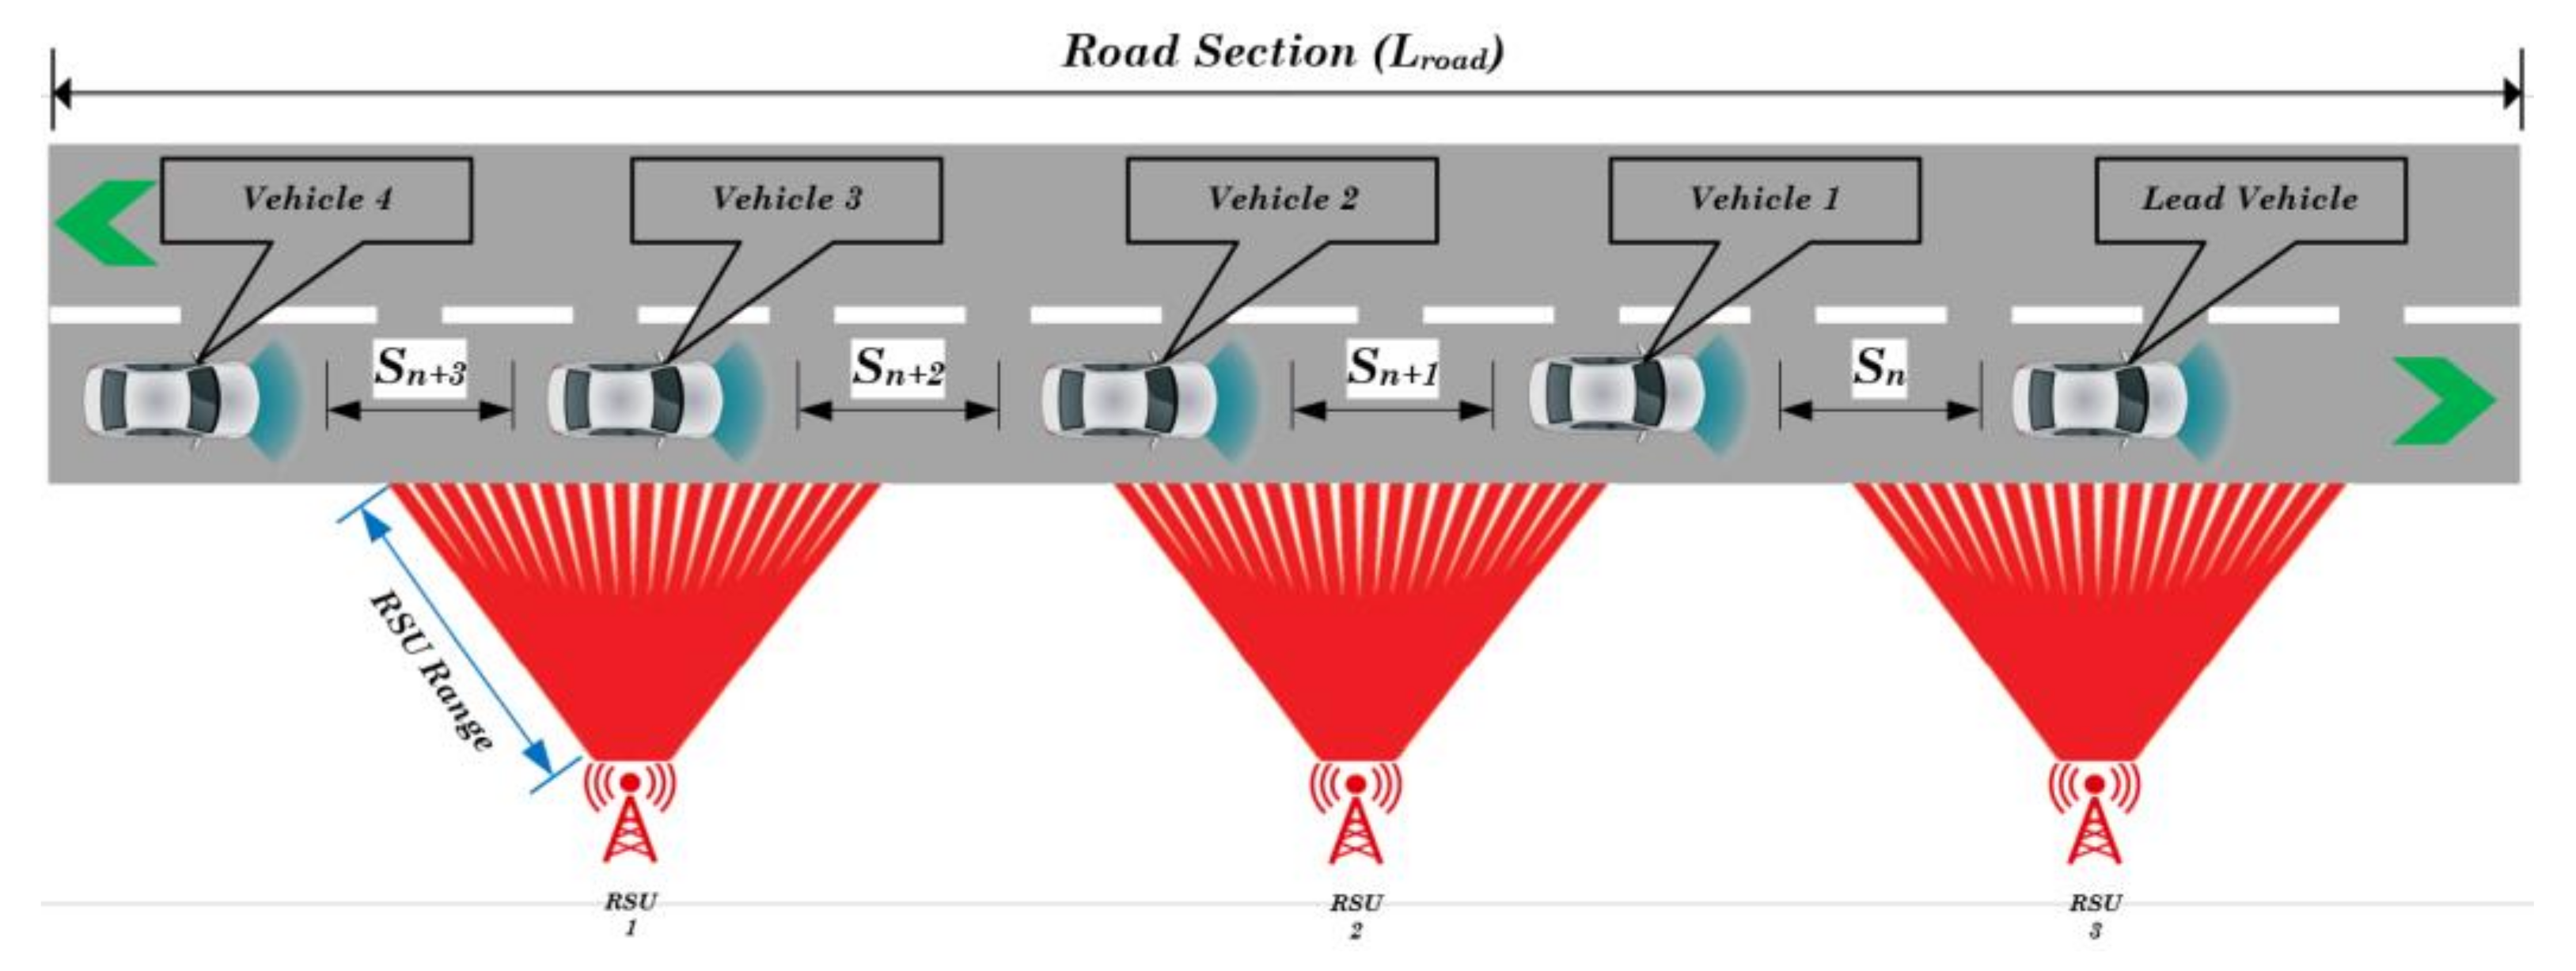
Figure 1 depicts the general layout of an IDM platoon with their notations as follows: the vehicles in a platoon are marked with an index
, where
represents the first vehicle in platoon followed by vehicle
and
denotes the maximum acceleration. Thus, the leader vehicle’s position and velocity at time
are characterised by
and
respectively. The actual distance (gap) between two vehicles is denoted by
at time
. Due to the presence of safe time gap
and considering the vehicle’s length
the actual gap between vehicles is expressed by
The relative velocity is a function of time
, and for the vehicle
it can be described by
With this definition, the acceleration equation of IDM for any vehicle
is given by
where the
is the desired gap and is determined by the equation
From the above equation, the free road acceleration and deceleration strategy of the vehicle
on the road within IDM is symbolized by the terms
However, the deceleration strategy is only effective if the actual gap
between vehicles is not significantly larger than the desired gap
. The follower vehicle’s acceleration is reduced from initial acceleration
to zero when vehicle
is approaching the leader vehicle
with the desired velocity
. The desired velocity,
for all the vehicles is kept constant as given in
Table 1. The computed acceleration from Equation (3) generates the velocity and displacement profile of the follower vehicles at time
based on the velocity and displacement of the platoon leader at time
. In our presented model, initially, the platoon leader moves with a constant velocity and then adopts to change in velocity when instructed by the Road Side Unit (RSU), i.e., V2I infrastructure.
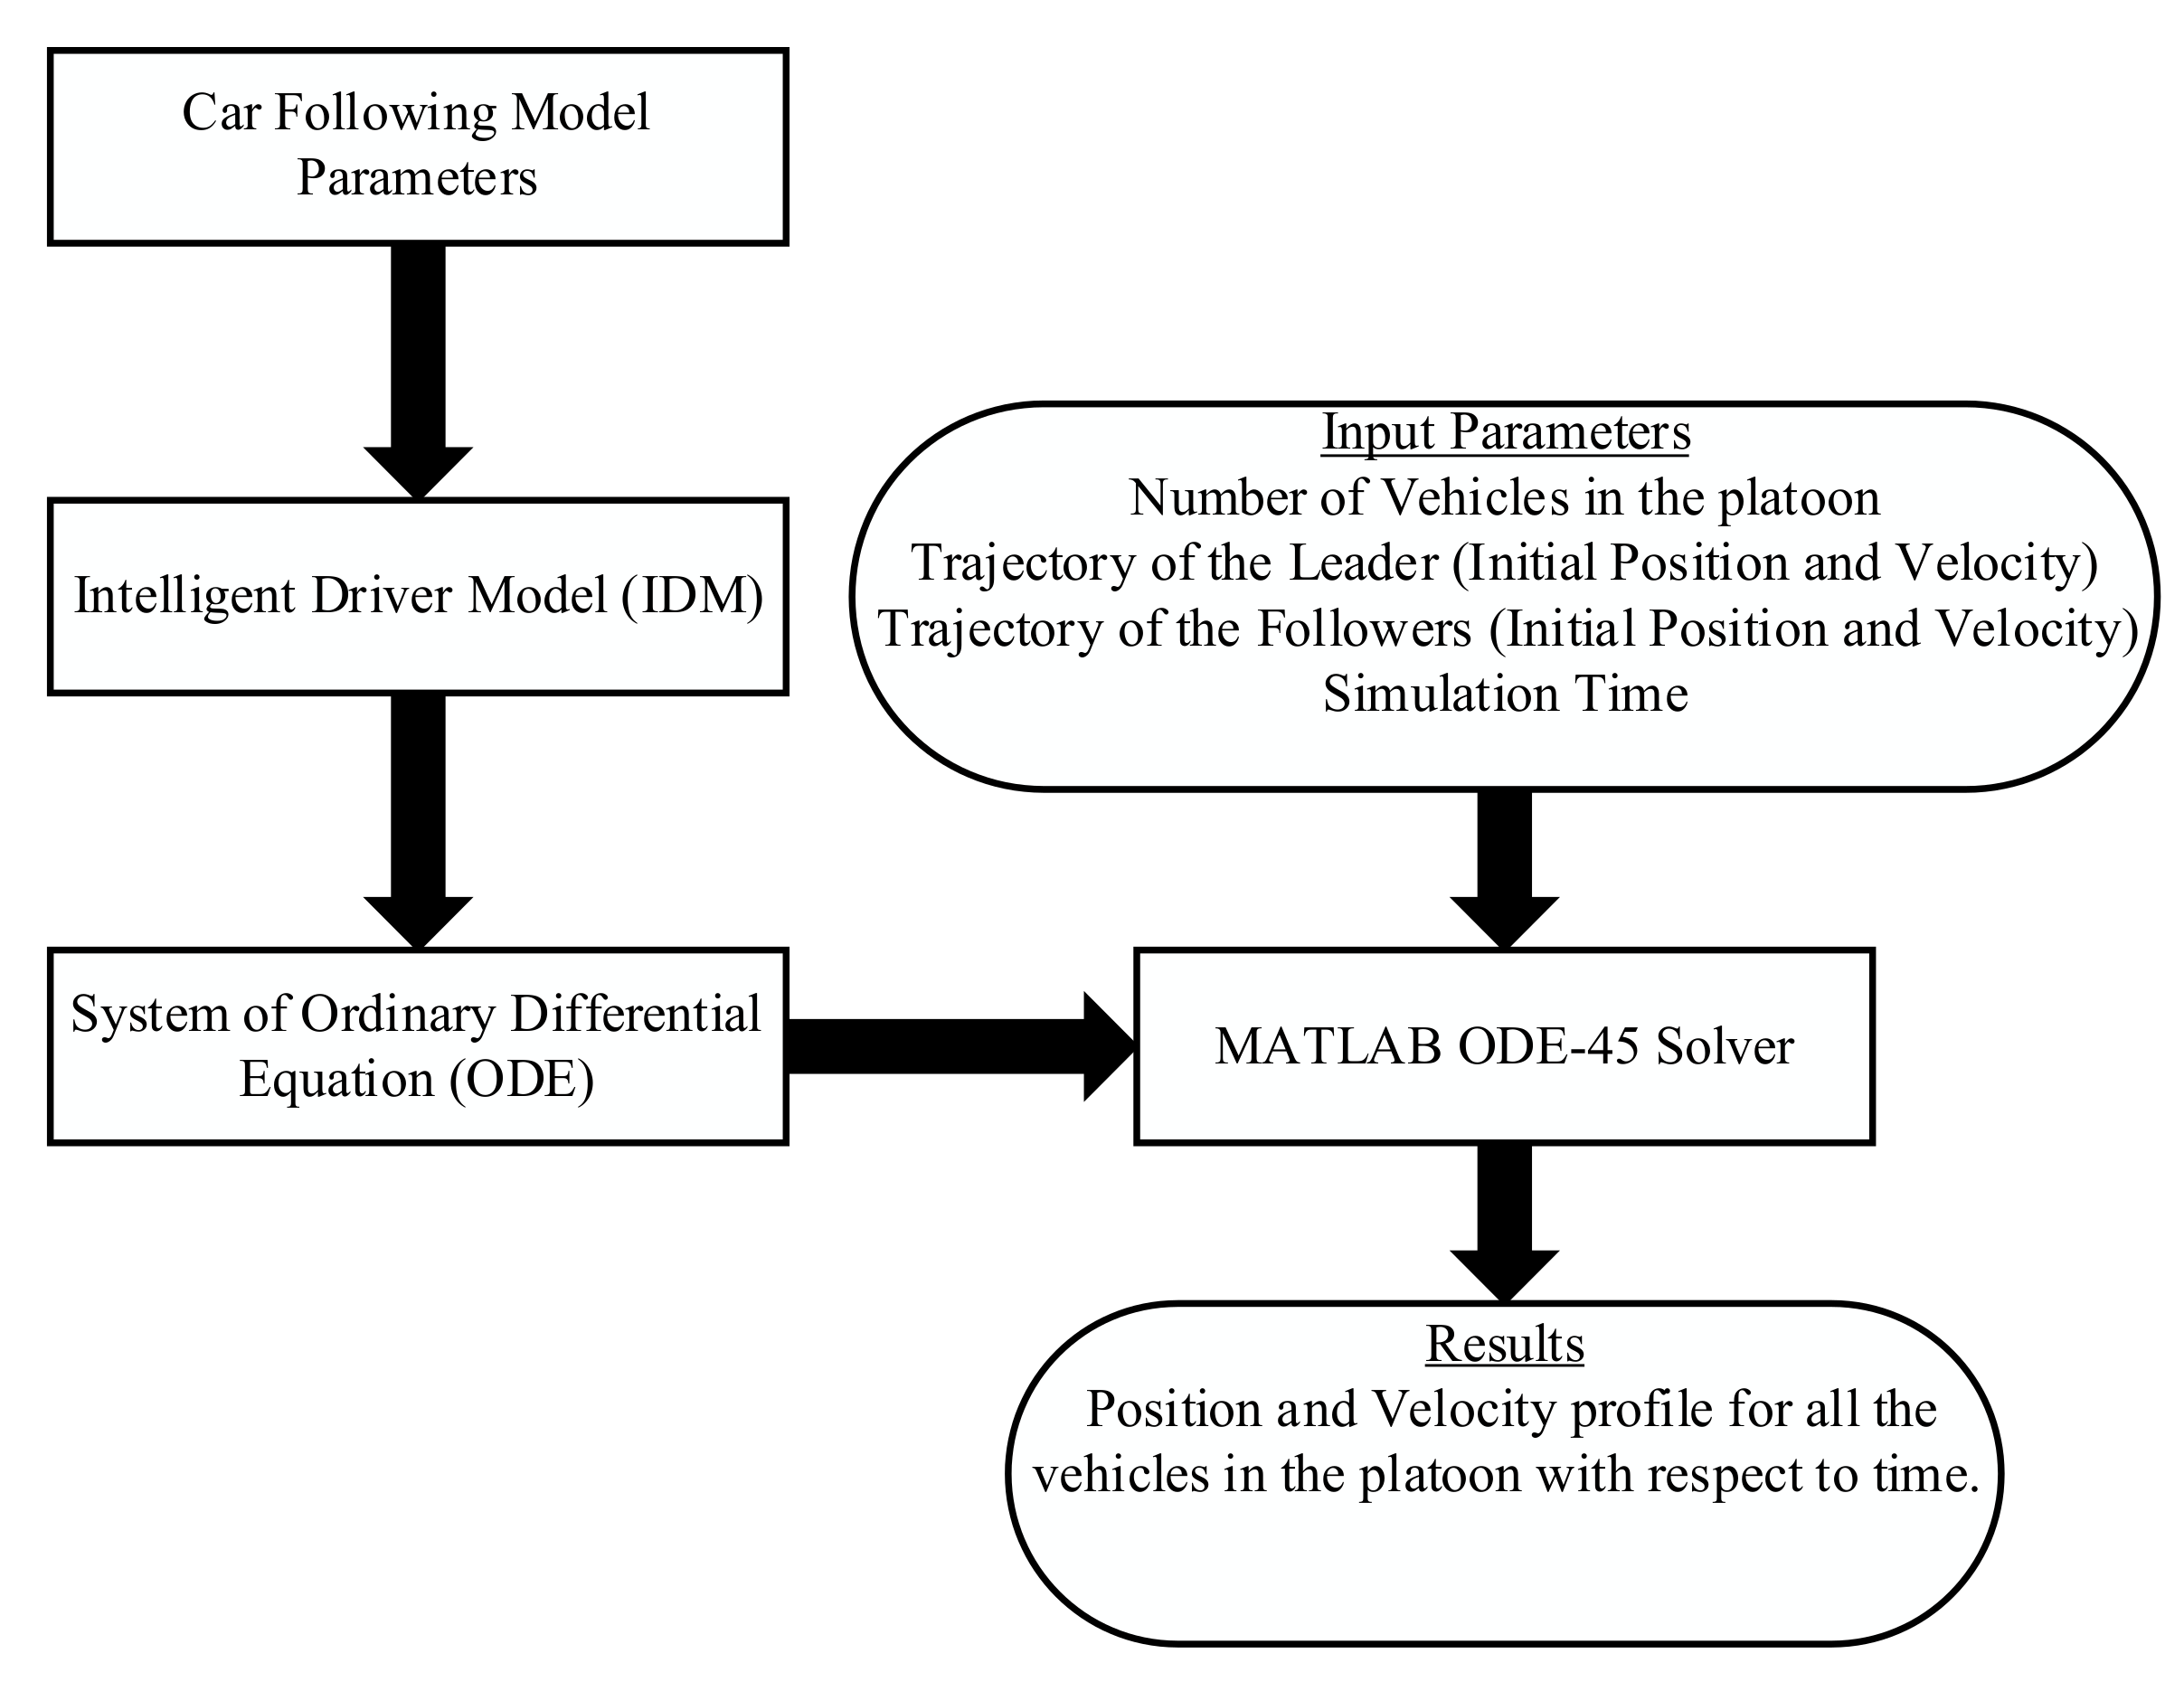
CF models are primarily defined in acceleration functions. The function defined for the IDM has second-order continuous partial derivatives. The only point at which this is not continuous is when , which means the actual gap between two vehicles is zero. In order to examine how each component of the model controls the results, this function was reordered as directly dependent on and transformed to an Ordinary Differential Equations (ODE-45) system. The position and velocity in these simulations were calculated using ODE-45 in MATLAB (version R2020a, MathWorks, Inc., Natick, MA, USA), which uses Runge–Kutta methods to solve systems of ordinary differential equations.
The parameters that were used to attain the results were in the form
. When running a simulation, the values in IDM are chosen ahead of time, i.e., the simulation runtime initialised with zero seconds and increased it by a step function every one second with 600-time steps in each second. Then this function is used to calculate the parameterised coefficients, and an ODE-45 solver can interpolate the function to find the position and velocity at any time. After initialising all vehicles’ positions and velocities (including the platoon leader) in the platoon, the second-order IDM equations are solved using an ODE-45 solver for the acceleration, displacement, and velocity for all vehicles.
Table 1 lists the parameters used for determining the velocity and displacement profile for the vehicle platoon.
The essential characteristics of the IDM Model, which makes it collision-free, are as follows:
- (1)
The model is collision-free with a unique dependency on .
- (2)
All the model parameters are known to be relevant and can be easily interpreted.
- (3)
All the model parameters are also empirically measurable and within the expected order of magnitude.
- (4)
The model is stable, and it can be calibrated using empirical data.
- (5)
The model functions can be numerically/analytically simulated.
- (6)
An identical macroscopic model is known for IDM, which simplifies the model’s calibration [
42].
3.2. Channel Estimation for V2X Communication
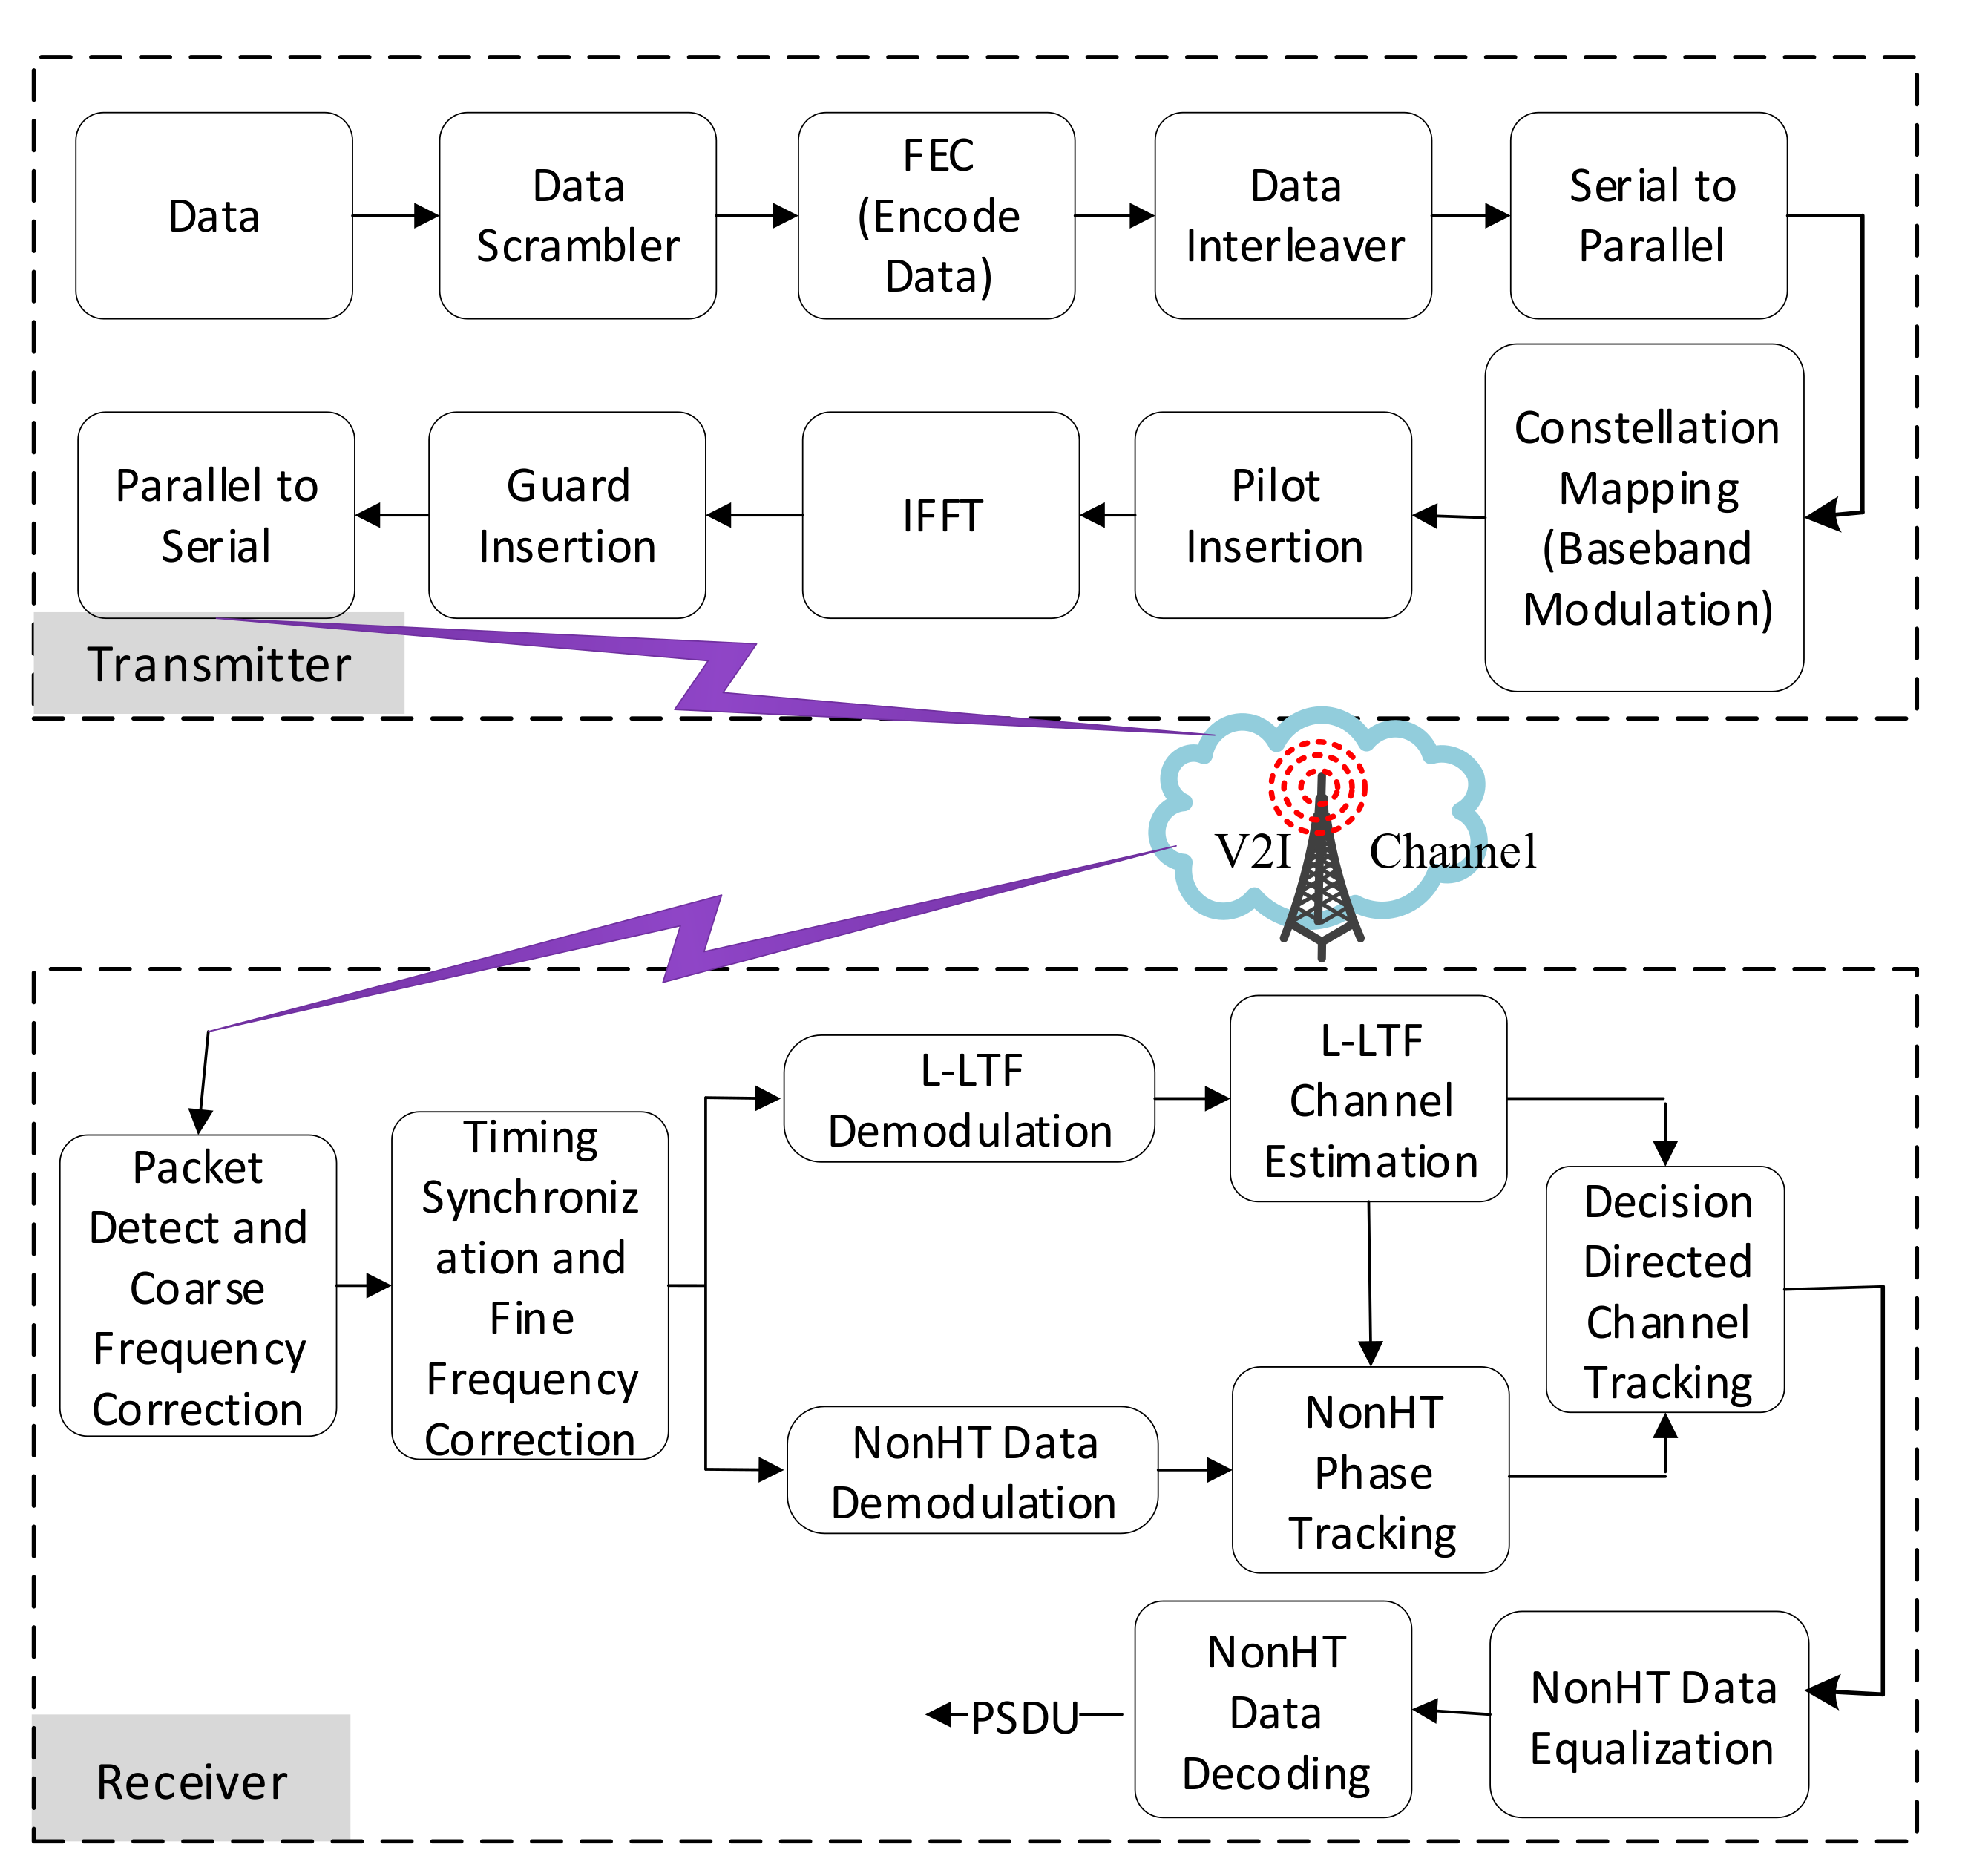
In this section, we investigated and proposed a channel estimation model for V2I communication. We employ the IEEE 802.11p vehicular standard and calculated path loss, PER, SNR, and throughput between transmitter and receiver end. The model is divided into three different parts, (i) path loss model, (ii) 802.11p model, and (iii) throughput model. The path loss model considers the effect of the signal’s path loss during transmission from the transmitter (RSU) and the receiver (platoon leader). The 802.11p transmitter and receiver model is shown in
Figure 2, and it calculates the PER and SNR at the receiver.
In contrast, the throughput model calculates the time lag during a platoon leader is entering the RSU’s range, and a data communication link is established. The attenuation of radio signal during propagation is termed path loss, and it includes the propagation losses due to the free space, absorption, and diffraction. The path loss is a function of the surrounding environment and the distance between the transmitter and the receiver
, given by
where
is the path loss exponent, which depends on the surrounding environment. An increase in the path loss leads to attenuation of radio signal (SNR), limiting the transmission range and data rates of the wireless channel between the receiver and the transmitter. Therefore, in our model, the path loss will determine the transmission range of the RSUs.
Table 2 lists the parameters for calculating path loss. We estimate the path loss using the free-space path loss model, given by
where,
is the path loss at distance
,
is the free space wavelength defined as the ratio of the velocity of radio signal
to the carrier frequency
of the radio signal. The SNR, without considering fading, can be calculated using the Equation (7).
where
is the transmitted power,
is the antenna gain at the transmitter,
is the antenna gain at receiver,
is the noise power, and
is the implementation noise.
is the additional power attenuation per meter distance and is given by the Equation (8)
In Equation (8),
,
,
, and
denotes Boltzmann constant, noise temperature, bandwidth, and noise figure, respectively. In our model, we consider SNR of
and it is obtained at the maximum distance between the transmitter and receiver at which transmission occurs. Therefore, the transmission range of the RSU (denoted as
) is derived from Equations (6) and (7) for a threshold SNR of
. Equations (6) and (7) are also used to obtain the SNR at each distance
from the transmitter. This SNR value is used to calculate the packet error over the transmitter’s distance in the next section. As the transmitter’s signal strength weakens depending on the distance or obstacle, a packet loss is probable during transmission. Therefore, we model the receiver’s internal working to identify the packet error from the SNR values obtained from the path loss model.
Table 2 and
Table 3 detail the values of all the parameters used in the simulation to calculate the path loss and SNR at a certain distance over the V2I channel in MATLAB.
The BER and PER affect the data rate and throughput received on the wireless channel. The BER of
is acceptable for the wireless LANs, while PER values depend on the various transmission parameters such as transmission power, the modulation scheme (transmission rate) and packet size [
45]. If BER and PER’s value is more than their threshold, then the transmitter and receiver cannot establish the connectivity. In IEEE 802.11 wireless standards, the transmitter transmits multiple bits, and they are grouped into packets to share the physical medium. The receiver receives these packets using the checksum in every packet to detect and discard the packets with any bit errors. We obtain the packet error loss at the receiver end. This packet error loss reduces the net data rate (Throughput) received at the receiver. This resulting throughput
of the wireless channel can be estimated using the Equation (9).
where,
denotes the bit rate of the modulation scheme. The throughput obtained at each receiver will also depend on the number of receivers
in communication with the RSU. A non-zero value of data packet size
is transmitted between transmitter and receiver with the finite throughput value, creates communication lag
between the transmitter and the receiver, which can be obtained as
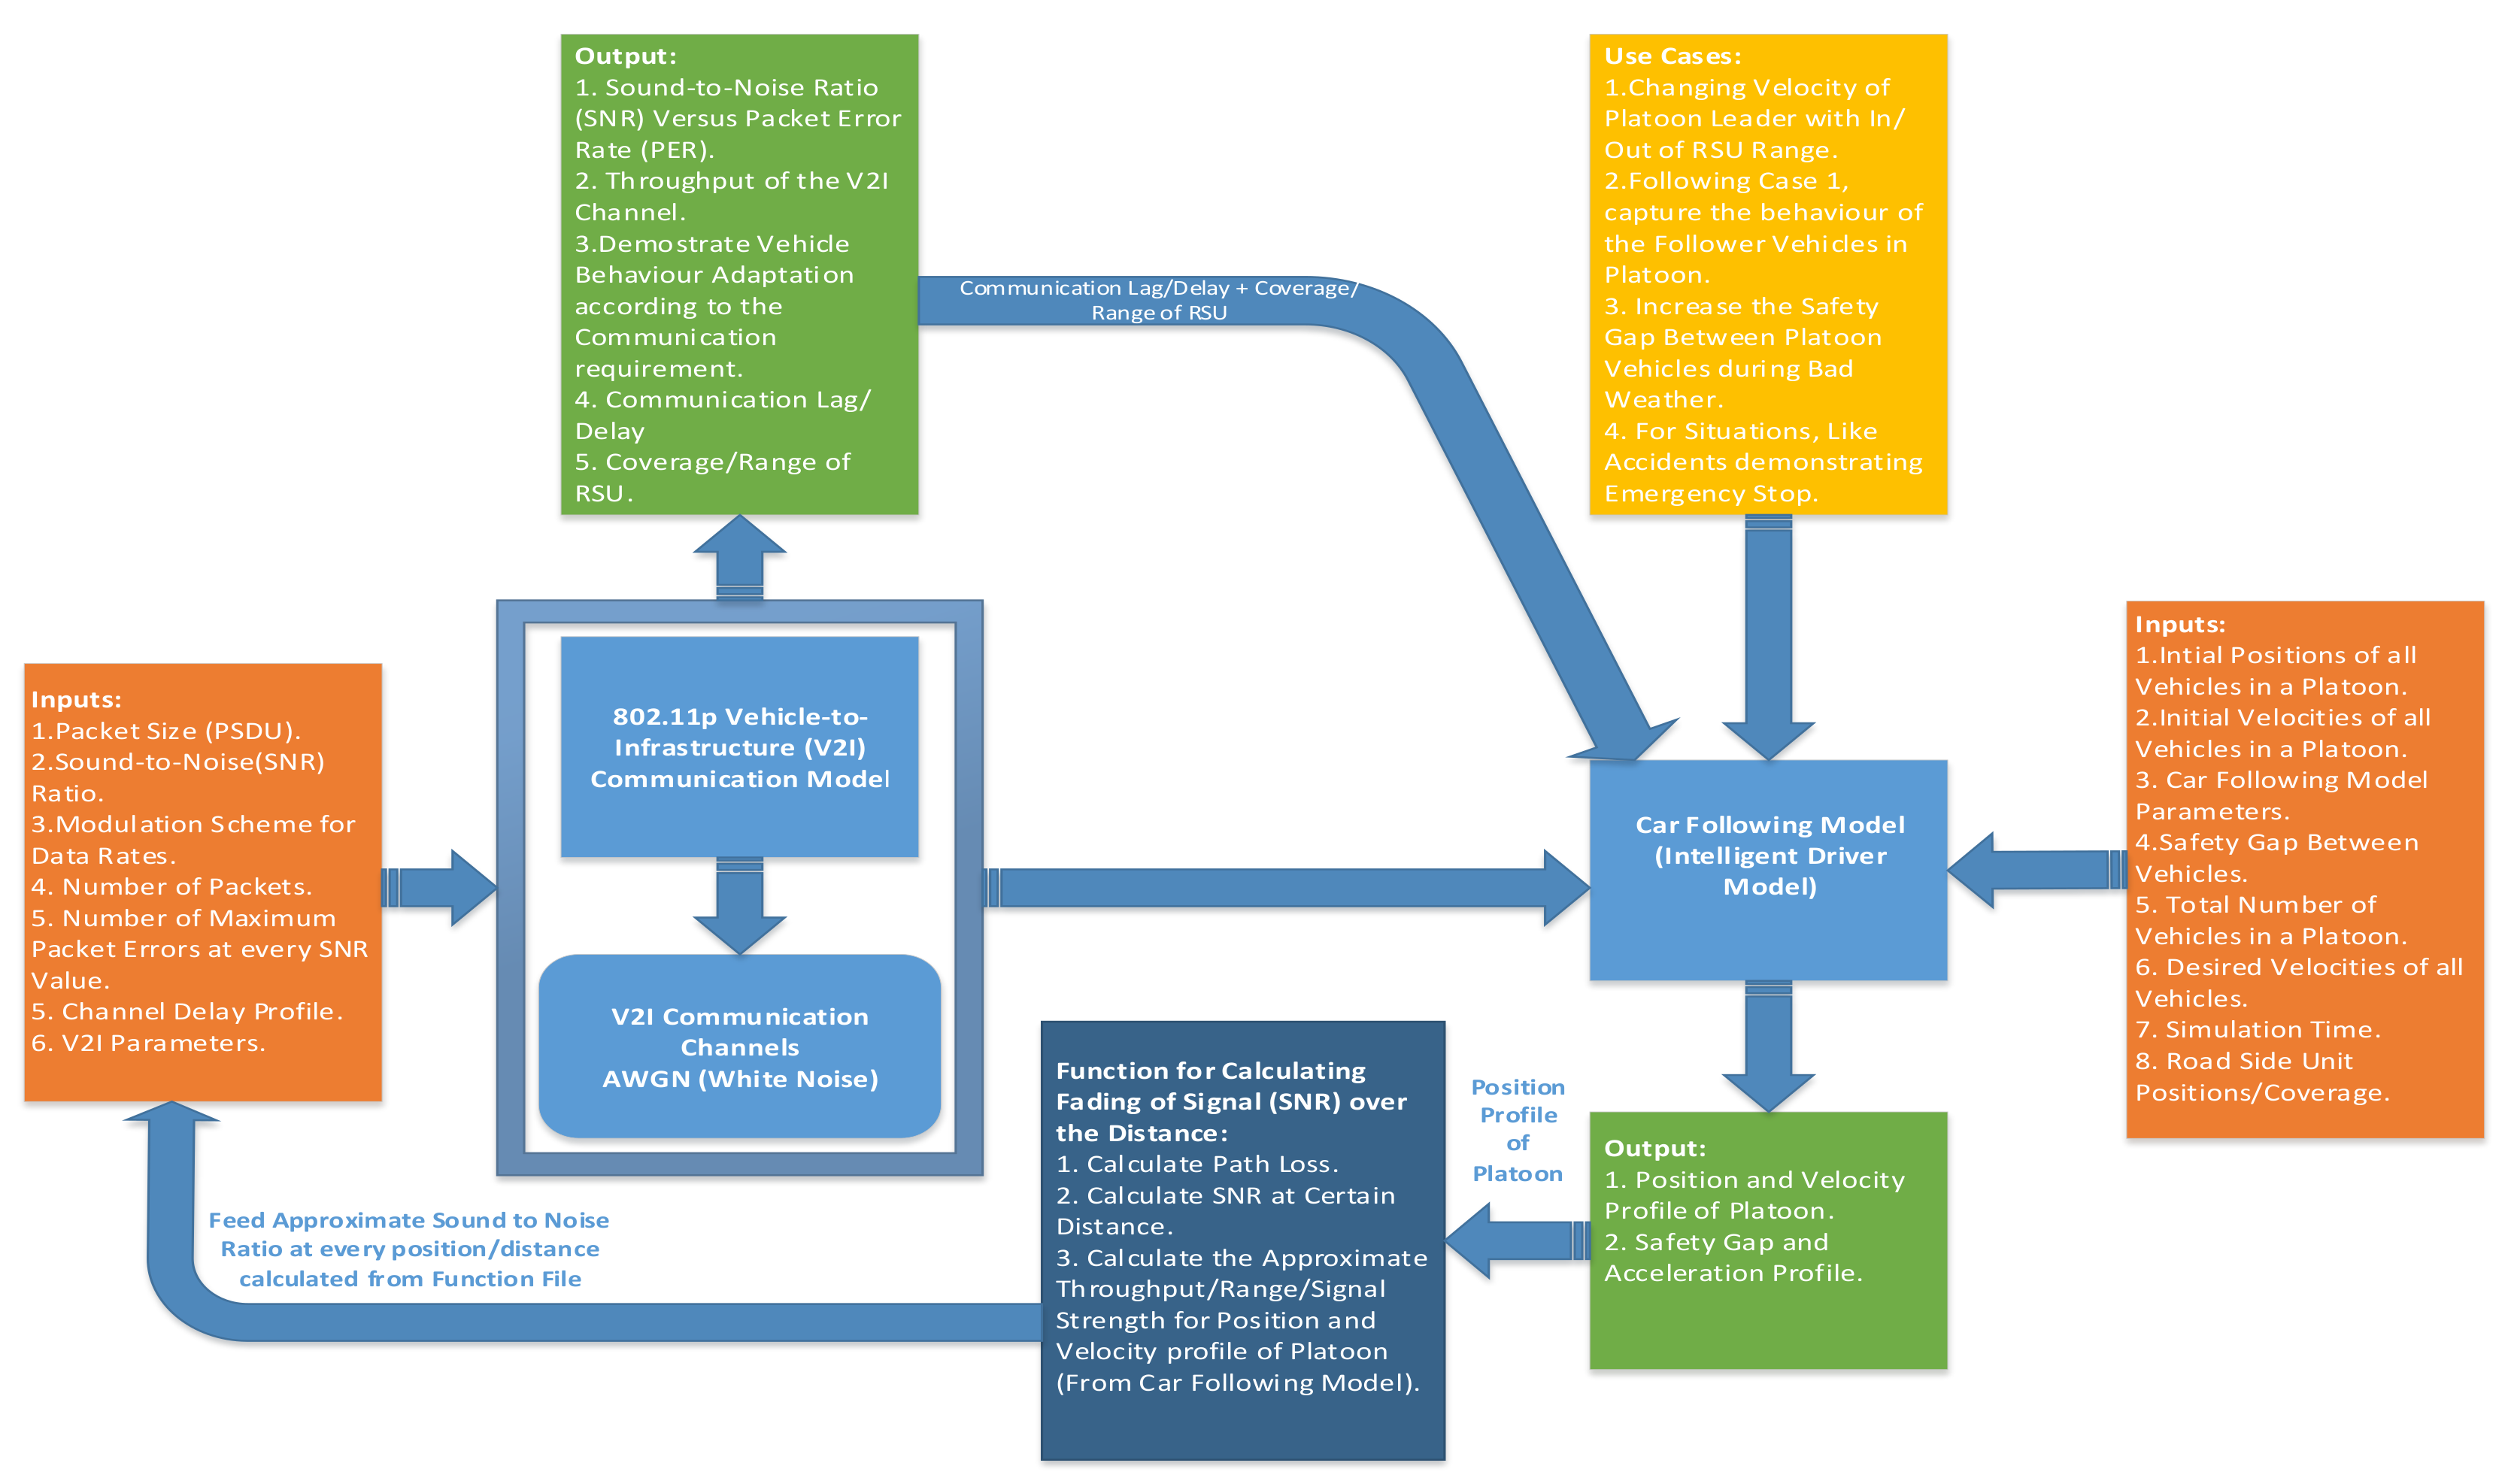
3.3. Development and Working of V2X Enabled IDM Model
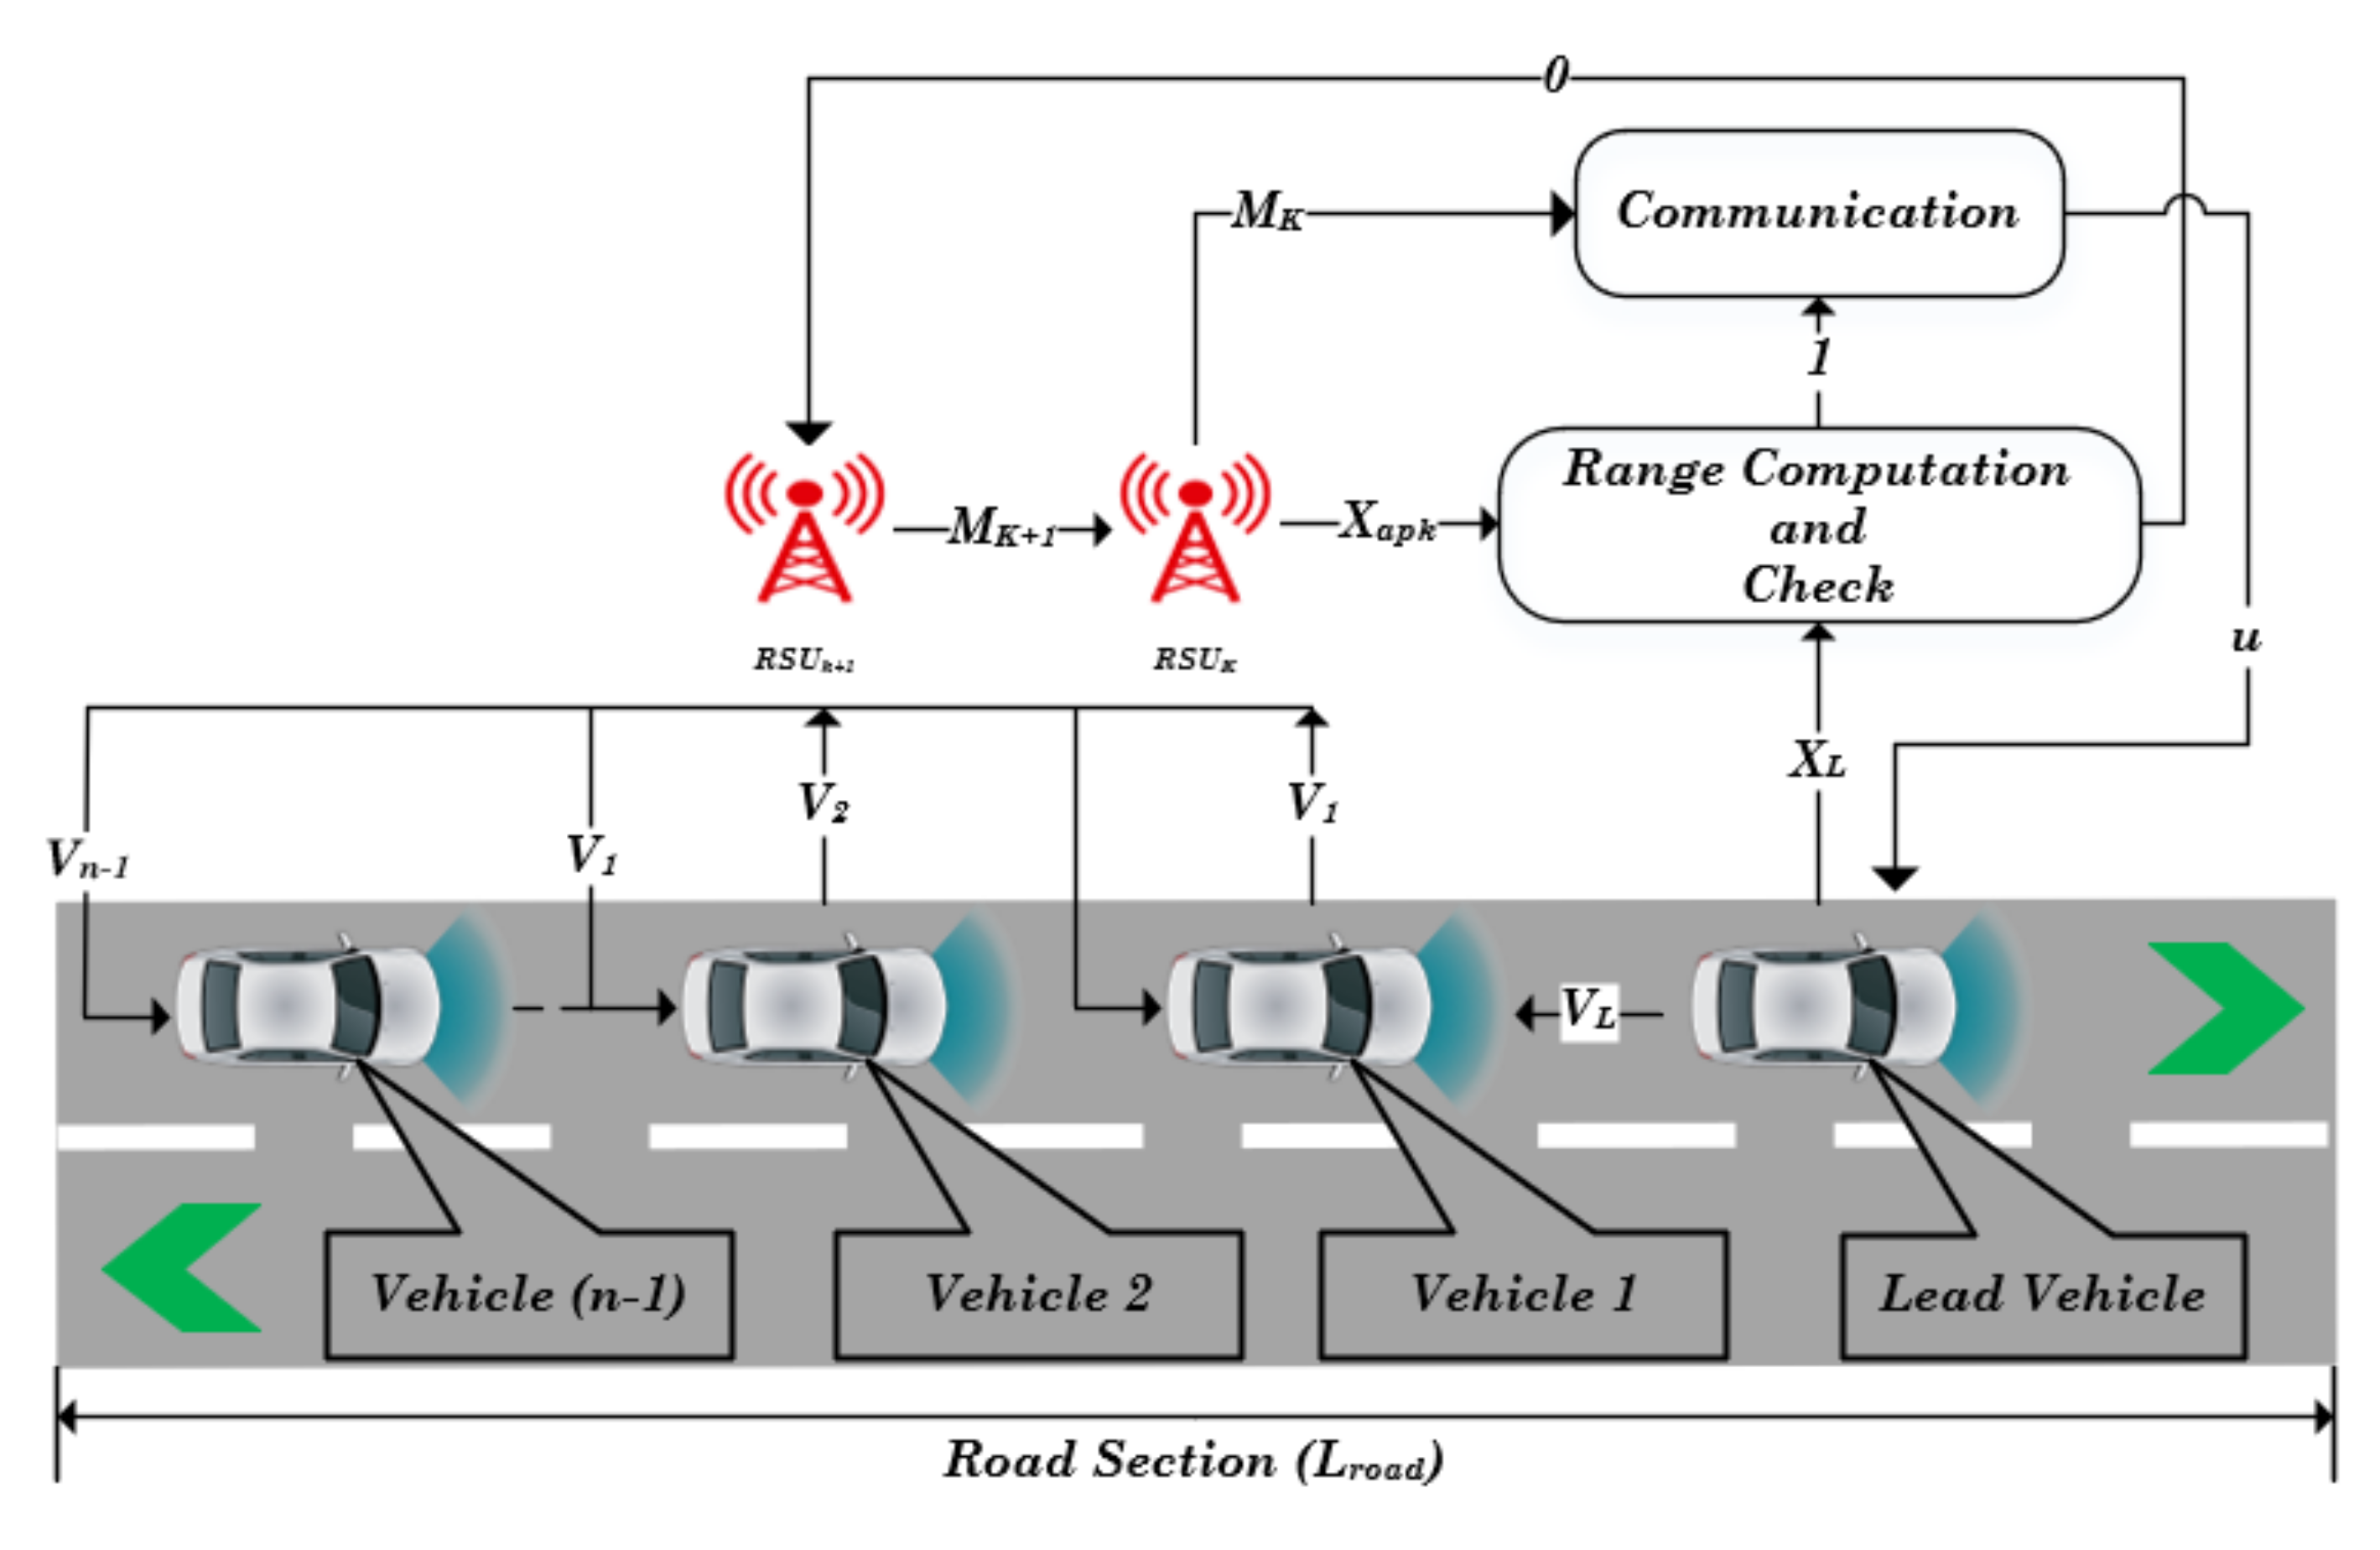
This section integrates the above discussed platoon-based CF model and the V2I communication scheme between the platoon leader and an RSU. By integrating these two, we demonstrate how a V2I communication scheme can control a platoon of vehicles’ motion while communicating only with a leader vehicle. The presence of a CF scheme within the platoon always ensures vehicles’ safety in the platoon. This, in turn, reduces the excess data generation and decision-making load on the RSU and provides an extra layer of control and safety. The V2I communication enables the transmission of periodic safety information, such as weather changes, traffic information and accident knowledge, to an entire platoon. At the same time, the IDM ensures that vehicles within a platoon are safe.
In our model, IDM controls the longitudinal motion of ADVs with sensors’ help and controls the acceleration, deceleration, safety time headway, and inter-distance (safety gap) between the ADVs. The IDM determines all platoon vehicles’ initial positions and velocities in the proposed model, along with their fixed safety gap (environment dependent) and maximum velocities (road type dependent) for all ADVs. The ADVs follow each other safely, maintaining the safety gap between them and adopting the platoon leader’s behaviour. To simulate the platoon of ADVs driving safely, without colliding with each other, the IDM uses the system of ODE-45 as mentioned in
Section 3.1 and
Figure 3 below shows the IDM integration in MATLAB using the ODE45 solver.
The proposed data-driven hybrid model integrates the 802.11p V2I communication channel with the IDM in MATLAB using ODE-45 and 802.11p simulation toolbox for vehicular channels. For the simulation, we used the IDM and 802.11p parameters from
Table 1,
Table 2 and
Table 3. The V2I communication is facilitated with the help of RSUs, and the RSUs transmit periodic information about traffic, weather conditions to the platoon leader of ADVs. Therefore, the vehicle’s driving behavior is controlled by the RSUs for V2I communication. However, when the vehicle is not in the communication range of the RSUs, the IDM plays a vital role to govern the safety of the vehicle platoon. Although both models work independently with their own limitations, their integration will facilitate the efficient and simultaneous operation of V2V and V2I communication for ADVs. Here, we identify the key parameters that interlink these two models, and they are depicted in
Figure 4. It also shows the simulation process using these parameters and how effectively they work together to govern the safety of ADVs.
The simplified modelling of the path loss mentioned in
Section 3.2 is very accurate and suitable for the vehicular environment. The path loss and SNR threshold will define the efficient range of the nearest available RSU. This model calculates the average path loss between ADVs and RSU in real-time for every distance instant from the IDM position profile data. It also determines if the ADVs are in the communication range of the RSU. We employed MATLAB’s IEEE 802.11p simulation tool for configuring the vehicular channel. This includes selecting waveform, channel, SNR, urban and highway LOS and NLOS configuration. The V2I wireless channel is configured using the time and frequency selective multipath Rayleigh fading channel specified in [
46].
The created channel object filters the real and complex input signal through the multipath V2I wireless channel to obtain the channel-impaired signal. For each SNR point, multiple packets (1000) of 1000 bytes are transmitted through the V2I channel, with the Binary Phase Shift Keying (BPSK) modulated Scheme and Modulation Coding Scheme (MCS) index of 2. Moreover, Root-Mean-Square (RMS) delay spread, Average path gains and RMS Doppler spread for different driving conditions are adopted from the real-world field trials mentioned in [
46,
47]. The V2I channel estimation is evaluated using SNR ranges from SNR threshold of 15 decibels (dB) to Maximum SNR of 60 decibels. For every SNR point, a Physical Layer Convergence Procedure (PLCP) and PLCP Service Data Unit (PSDU) is created and encoded to create a single packet waveform.
3.4. Case Studies for V2X Centric Cooperation in Autonomous Vehicles
The simulation layout of our integrated model is shown in
Figure 5. Here, we consider a road of length
with 3 RSU’s arranged at equal distances, and their transmission range is also depicted in
Figure 5. We considered a platoon consisting of five vehicles (including the leader) to be present on the road with given initial positions and velocities. As the platoon leader enters the transmission range of any RSU, communication is established between the platoon leader and the RSU after a certain time lag
. The leader relays information regarding the platoon, and the RSU (as an observer) provides new control parameters for the car-following model to the platoon leader. Presently, the distance between the RSU’s is kept such that their transmission ranges do not overlap. This is done primarily to avoid deciding between the controls of RSU when the platoon leader is in the overlap region and to show that in the loss of communication, how IDM controls the platoon trajectory for accident-free driving.
The general control layout of the integrated communication and IDM model is shown in
Figure 6. The platoon leader is given a constant velocity in the current model, controlled by the RSU’s. The other vehicles follow the platoon leader based on IDM, as discussed in
Section 3.1. As the platoon leader moves, the model compares the platoon leader’s position with the communication range of each RSU. The path loss model discussed in
Section 3.2 is used to approximate the range of RSUs. When the platoon leader enters the communication range, the RSU detects the platoon leader’s presence; however, message transmission is not established instantly. There is a marginal communication lag depending on the available data rate, interference, and the amount of data to be transferred, provided by the communication model discussed in
Section 3.2.
When a message transmission is established, the RSU provides new instructions to the platoon leader to control the vehicles’ behaviour in the platoon following IDM. These instructions comprise controlling the velocity, safety gap, platoon length, and vehicle’s acceleration based on the current safety information relayed to the RSU’s from our V2X controller model depicted in
Figure 6. The data shared by the platoon leader comprise information such as the number of vehicles in the platoon, position, and velocity of each vehicle in the platoon, condition of each vehicle, and emergency messages relayed from each vehicle. The RSUs periodically update this information and forward it to the platoon leader while remaining in the range of the RSU. Once the platoon leader leaves the RSU range, it retains the driving instructions provided by the preceding RSU while the simulation code compares their positions with the following RSU’s range. During this entire time, IDM controls the position of the other vehicles in the platoon. Therefore, the RSUs communicate only with the platoon leader, while IDM manages the other vehicles’ trajectories in the platoon. We designed six test cases simulating a few different driving scenarios to demonstrate this integrated communication and car-following model working.
Table 4 summarises the parameters’ initial and altered values for all test cases during simulation. The cases are described as follows:
Case I—response to multiple RSUs instructions: In this case, controlling the vehicles platoon’s velocities by multiple RSU’s is demonstrated. Each RSU enforces a different driving velocity on the platoon leader; the out-of-range velocity and the RSU imposed velocities are given in
Table 4. The
denotes the velocity of the leader,
denotes the path loss exponent depending on the driving environment, and
represents the number of platoons. The platoon is in Highway LOS condition; therefore, the communication parameters—such as average path gains, Doppler shift, and path loss exponent—are used as considered in [
48].
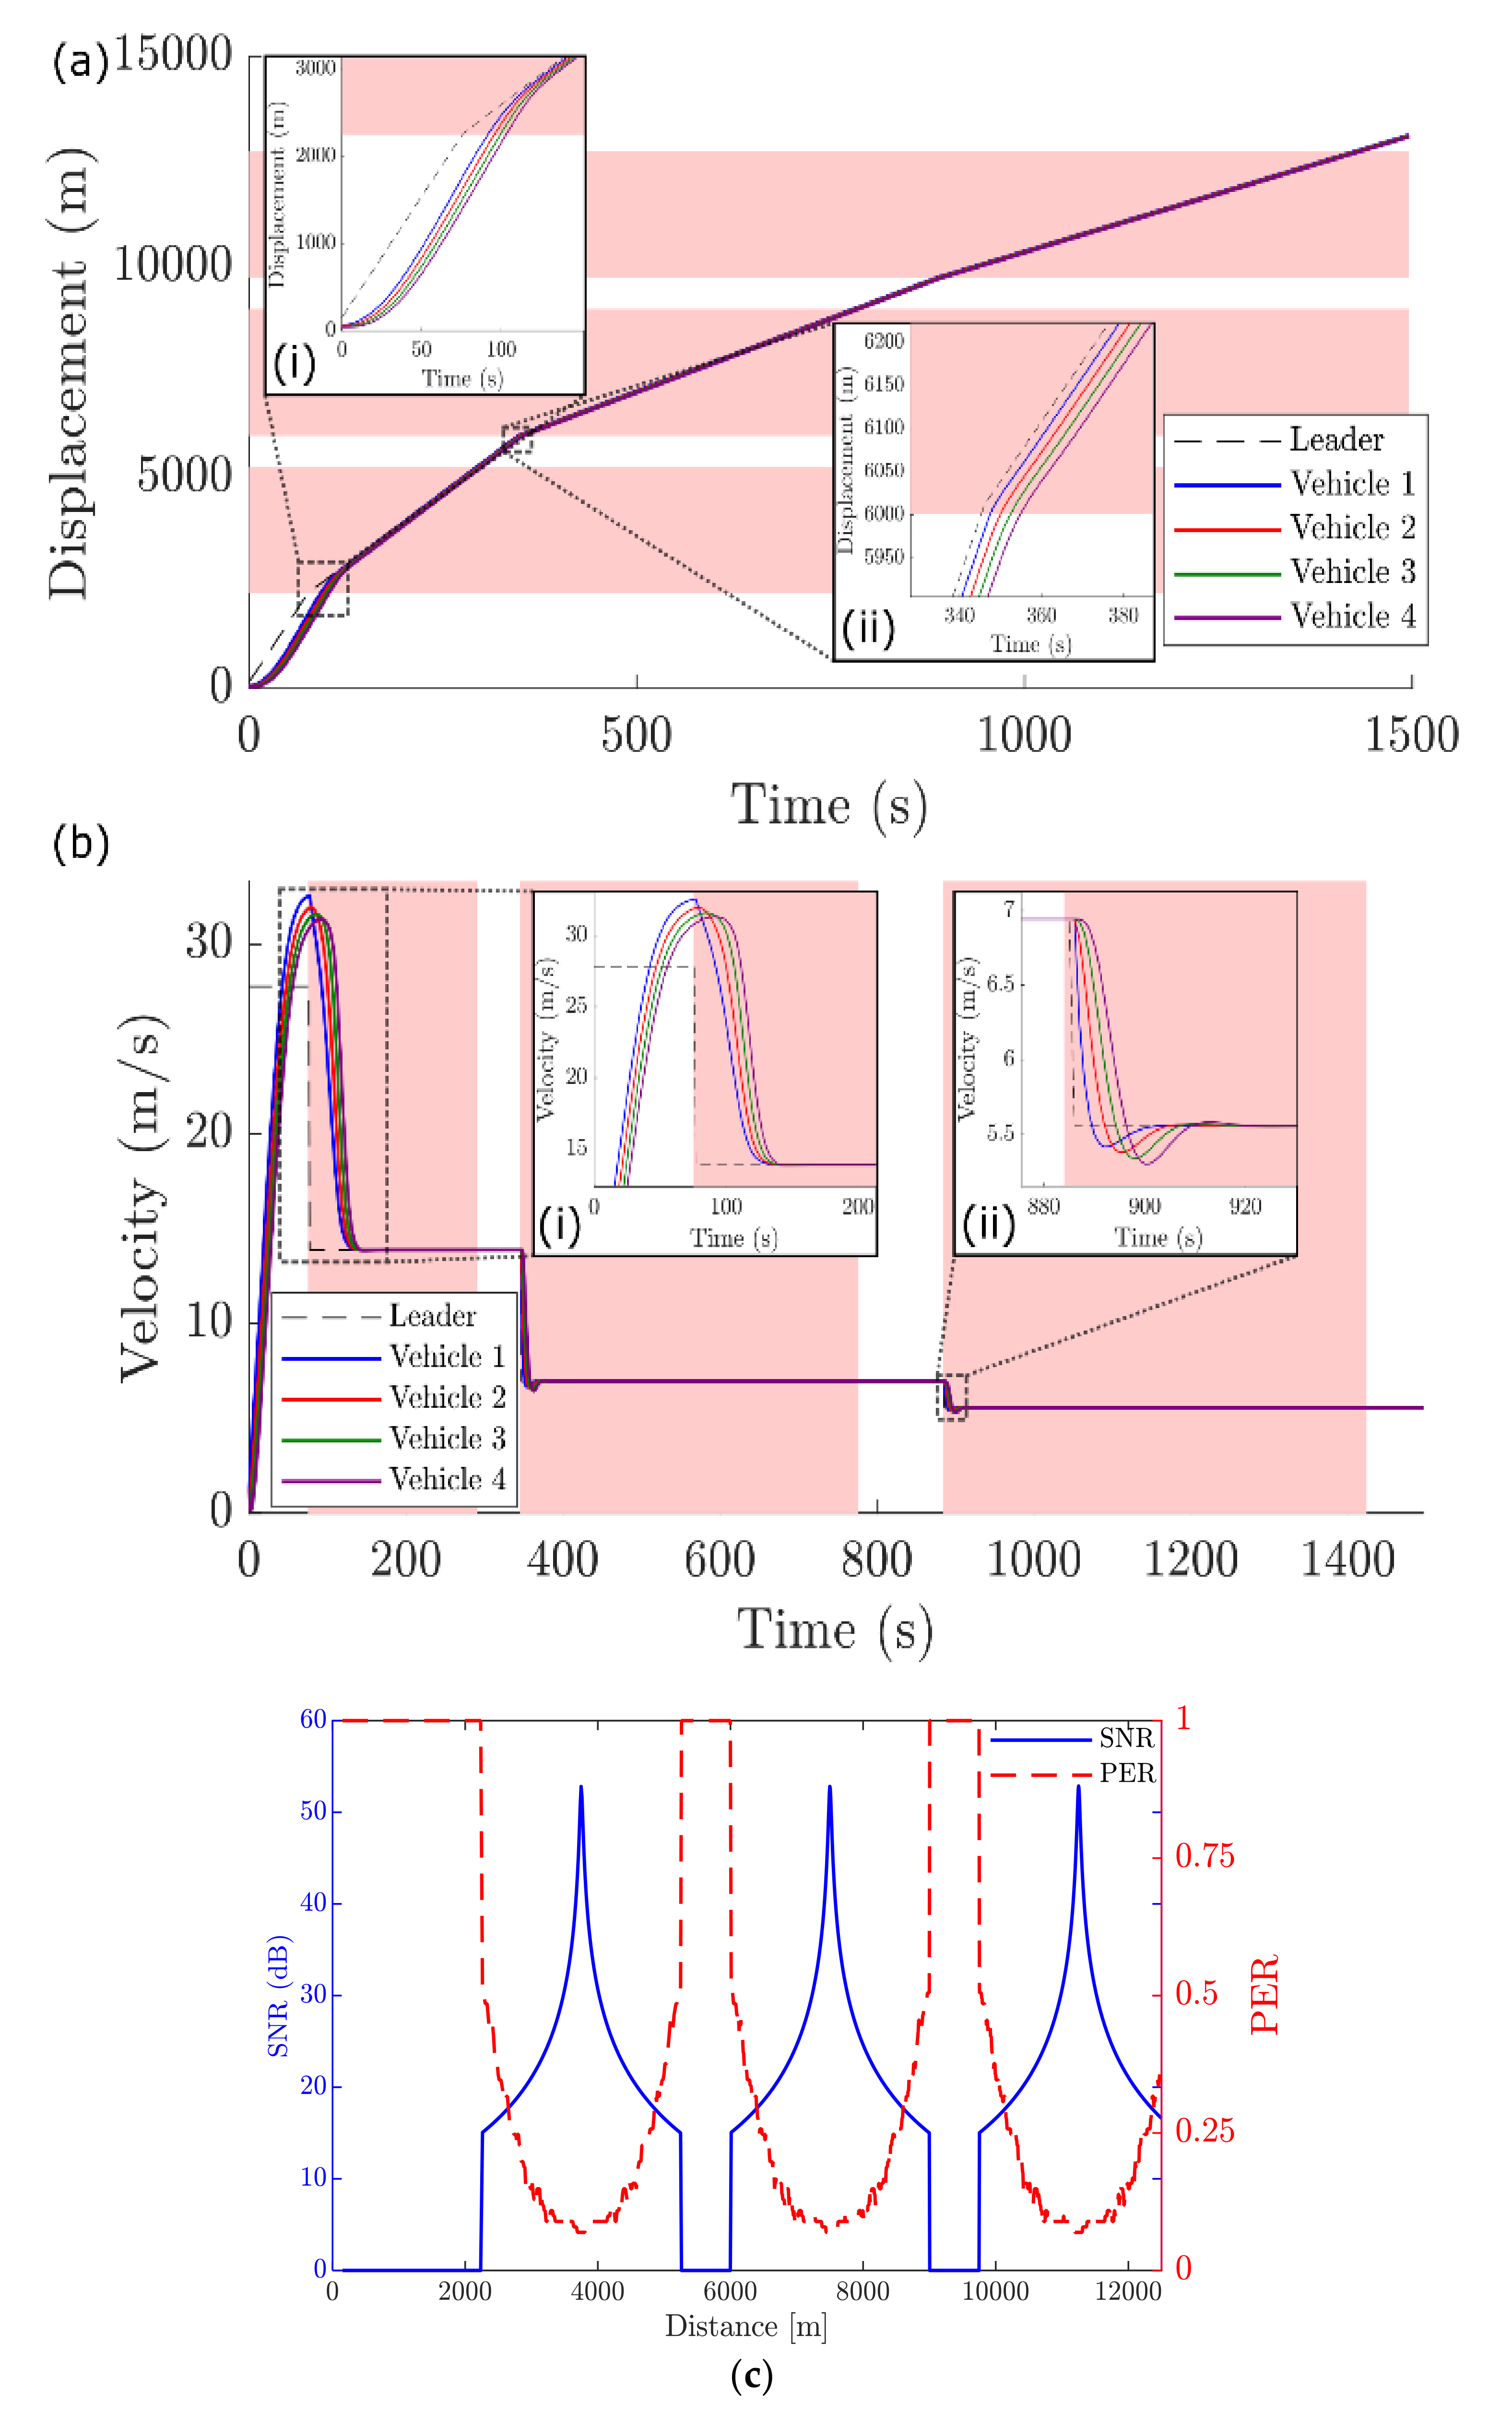
Case II—sensitivity to an emergency: This case simulates how a platoon reacts to a dynamic change in instruction from RSU’s, such as in an emergency of an accident. At the 400 s, the RSU broadcast an emergency safety message reporting about an accident ahead on the road and instructs all platoon leaders to reduce their velocities. Additionally, the RSU’s broadcast another message at 450 s, relaying that the road is cleared and instructs the platoon leader to increase the speed again.
Case III—performance under the loss of communication: In this case, we show the effect of a change in LOS condition between RSU and the platoon leader due to an obstacle’s appearance. At the 800 s, we consider that a truck blocks the direct view between the platoon leader and RSU, affecting communication. The change in this condition from Highway LOS to Highway NLOS changes the path loss exponent, which would alter the transmission range (as discussed in
Section 3.2).
Case IV—performance under changing environmental conditions: In this case, we simulate a change in the platoon’s driving environment, considering the scenario where the platoon enters into a city from a highway. The RSU 1, as shown in
Figure 5, is considered to be in a Highway LOS environment while handling only a single platoon. The RSU 2 is also considered to be in Highway LOS environment and is placed between RSU 1 and 3 to mimic slip road leaving the highway and entering urban (city) environment. Moreover, we wanted to demonstrate the slip road that would create bottleneck traffic conditions due to physical differences in the road infrastructure and considered 10 platoons in the RSU 2 region. The RSU 3 is deemed to be in a city environment with high traffic density, where the RSU operates
platoons. Other communication parameters such as path loss exponent, average path gains, channel delay profile, and Doppler spread also change in this Urban LOS environment, and their values are adopted from [
48].
Case V—sensitivity to single large perturbation: In this case, we demonstrated stable traffic flow wherein all vehicles drive at the same constant speed of . The single large perturbation occurs where the leading vehicle first experiences a deceleration phase with and reduce the velocity from to , after that the vehicle maintains the lower speed of for a time of 160 s, and finally accelerates with increasing its velocity from to .
Case VI—sensitivity to inter-vehicular gap: In this case, a platoon leader starts with a velocity of . The platoon’s leader’s speed is changed to and at the time 200 and 400 s, respectively. Moreover, after 60 s, an instruction to increase the inter-vehicular gap is sent to all the vehicles in the platoon. The default time headway is set to 0.5 s. After receiving the ‘increase gap’ command, our controller modifies the gap parameter to 20 m and time headway to 1 s.
4. Empirical Results and Discussion
The results of the six test cases for the integrated model proposed in the previous section are discussed in this section. The list of test cases was initially compiled, projecting onto the future technologies; however, they are adapted from existing transportation requirements and functionalities.
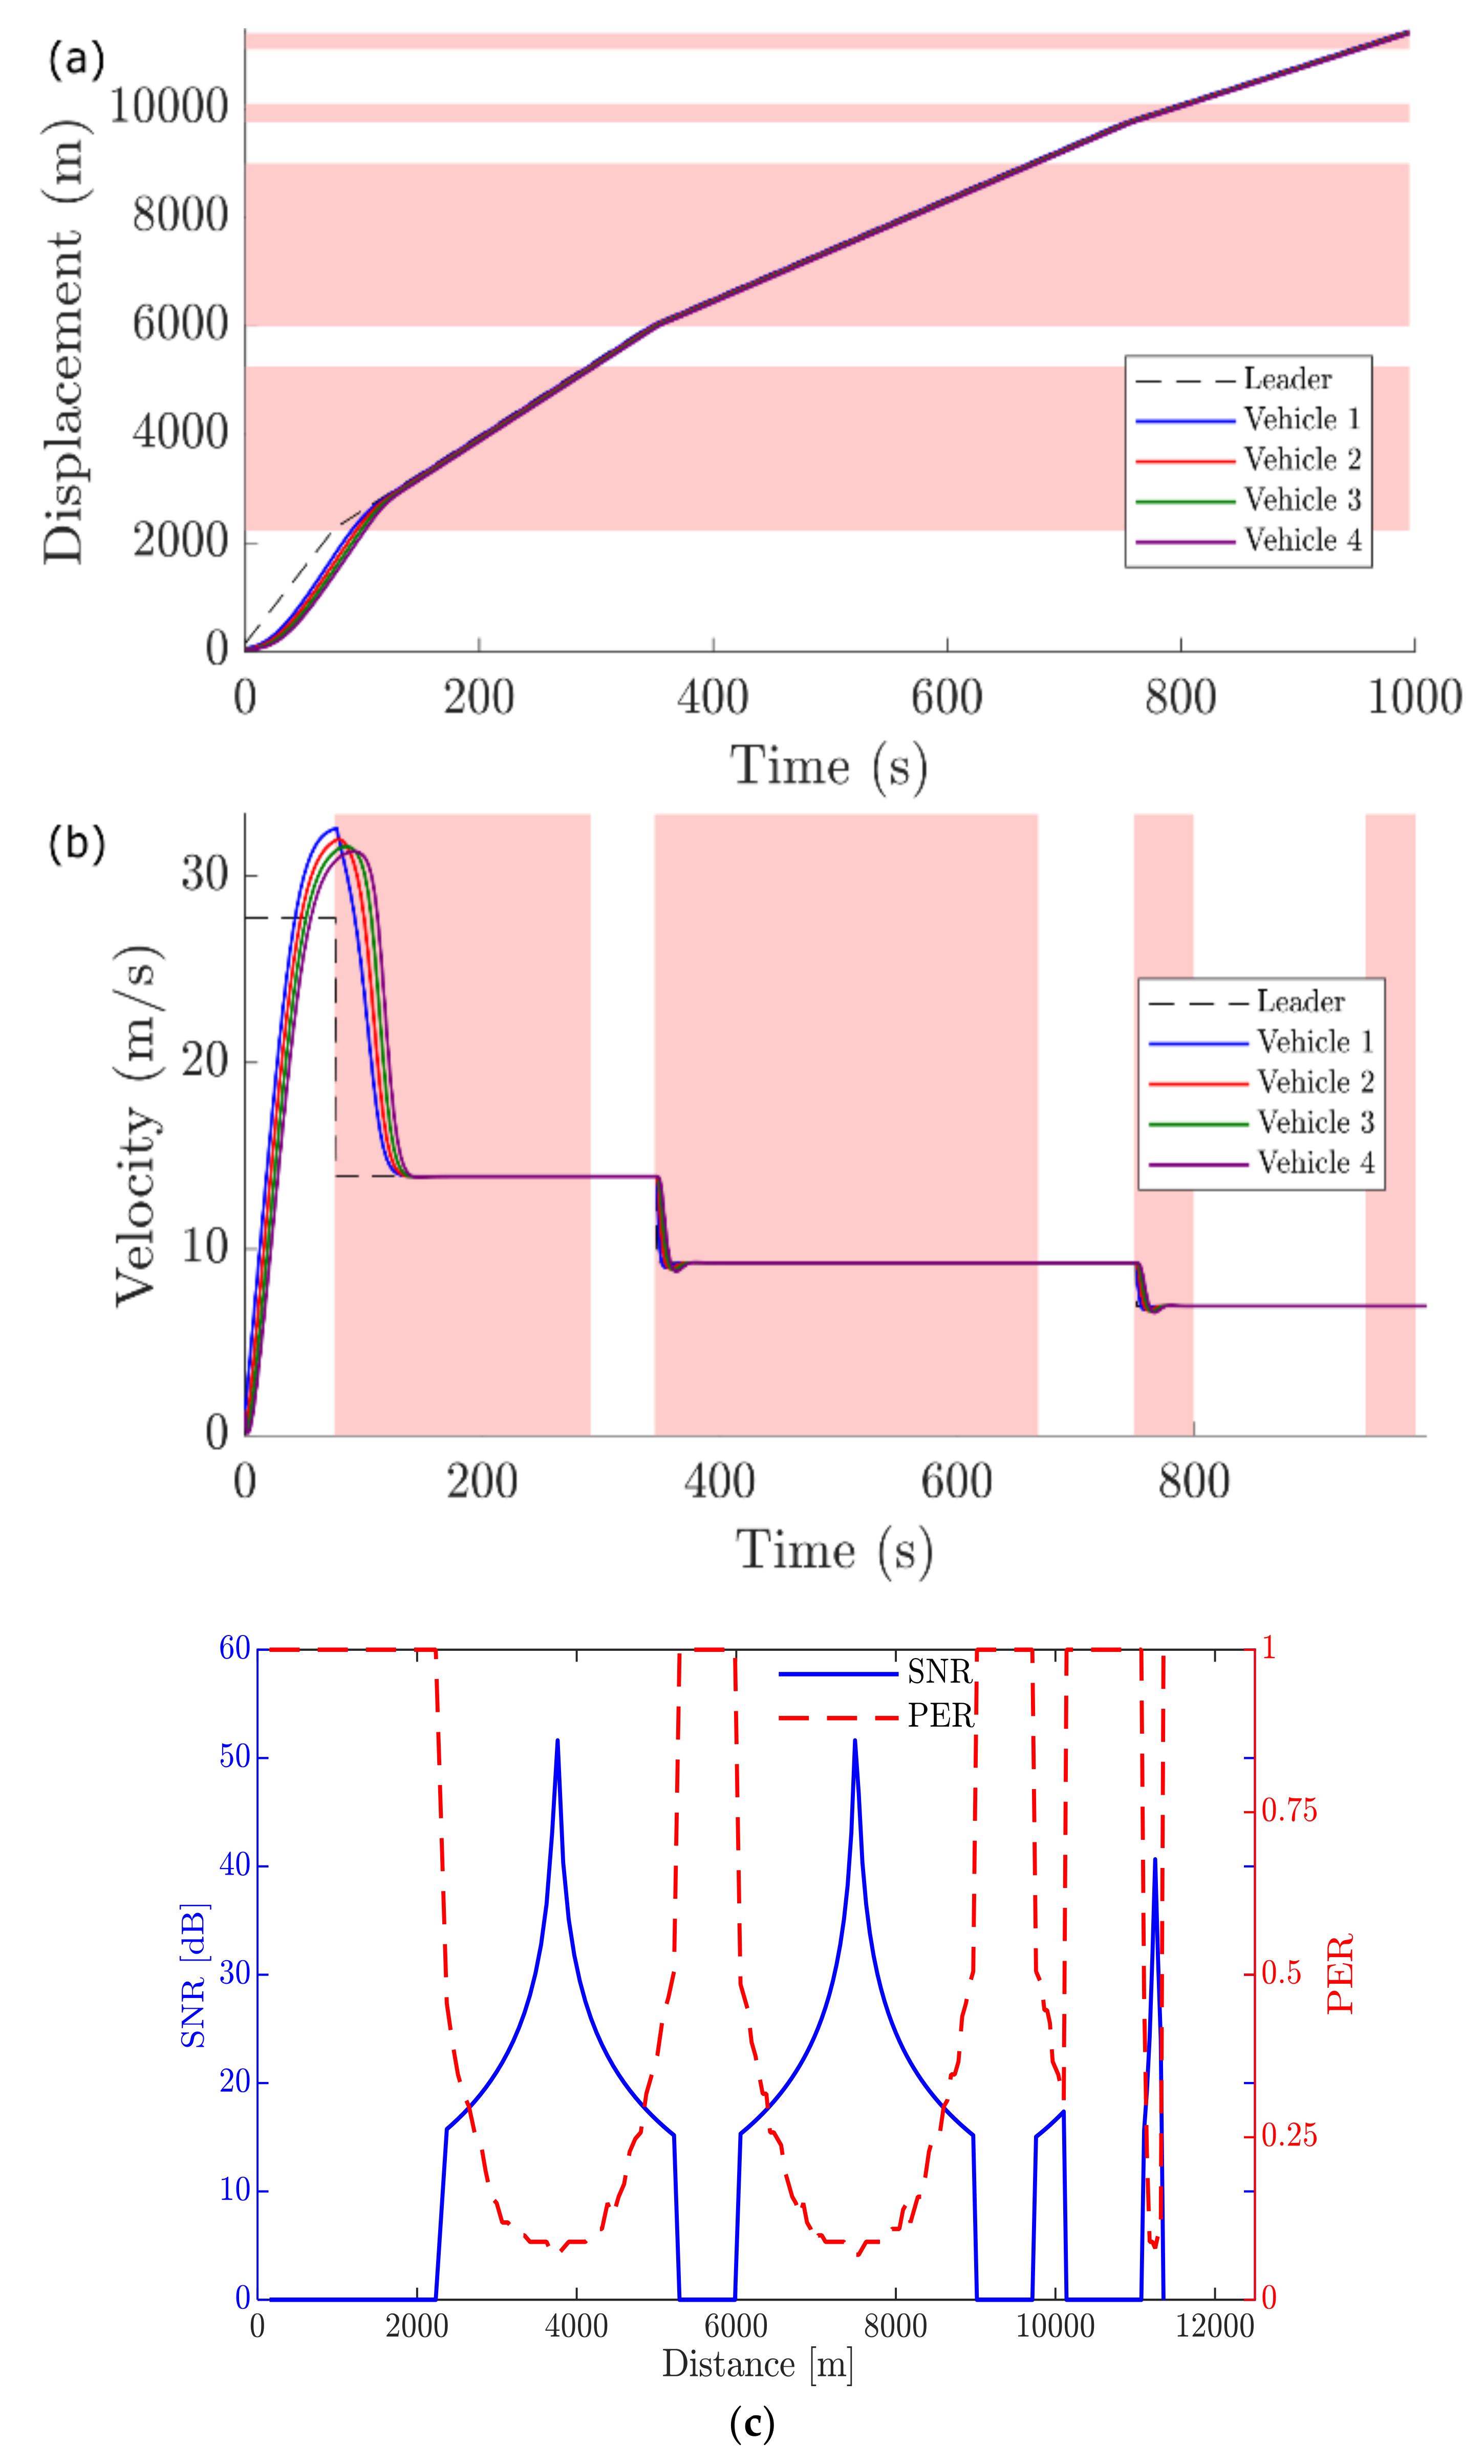
Case I—
Figure 7 illustrates a basic control test conducted to show the effect of an RSU control over a vehicle platoon’s position and velocity, adhering to a CF model. As detailed in the previous section, as the platoon leader starts communicating with an RSU, the RSU relays a message that changes the platoon leader’s speed.
This velocity change forces the follower vehicles to adjust their motion under the influence of the ever-present IDM model, as shown in
Figure 7a,b. It can be seen from
Figure 7(ai), the follower vehicles adopt the behaviour of the platoon leader while maintaining a safe gap determined by the IDM.
Furthermore, each RSU imposes a different speed condition on the platoon leader (values are given in
Table 4). The lightly shaded red regions represent instances when the leader vehicle is in an RSU’s coverage. Similarly,
Figure 7(bi,bii) shows the velocity profile of the vehicles in the platoon with respect to time, reflecting their CF behaviour. It is also visible that the platoon retains the driving conditions imposed by the respective RSU as it leaves their coverage area. The communication lag obtained at each RSU is about 0.0135 s, which is relatively insignificant in this case’s driving conditions. This pilot case shows the basic functionality of the V2I communication while controlling the movement of platoon vehicles as they move in and out of the coverage range of RSUs. The following cases in this section will demonstrate some simple exemplary scenarios of how and where such an integrated V2I communication and CF model can be used.
Case II—
Figure 8 illustrates the vehicle platoon’s functioning with V2I communication in an emergency situation, such as an accident. We imitate an accident scenario by simulating that a message is relayed by all the RSU’s to the platoon leaders in their coverage range to reduce their velocities. In our model, this instruction is provided at the 400 s. As shown in
Figure 8, at this time, the platoon is in the range of RSU 3, when the platoon leader suddenly decreases the velocity, and the follower vehicles adapt accordingly. To further demonstrate the dynamic functioning of the V2I communication with car behaviour, we relay another message at 450 s, simulating that the road is clear, to instruct the leader vehicle to increase its velocity. The follower vehicles again adapt and increase their velocities while adhering to the IDM. Due to this dynamic message relay, the platoon leader and following vehicles have a displacement of only 29 m during this emergency. Therefore, this case shows the platoon motion can react and adopt different driving conditions by responding to dynamic instructions from the RSUs.
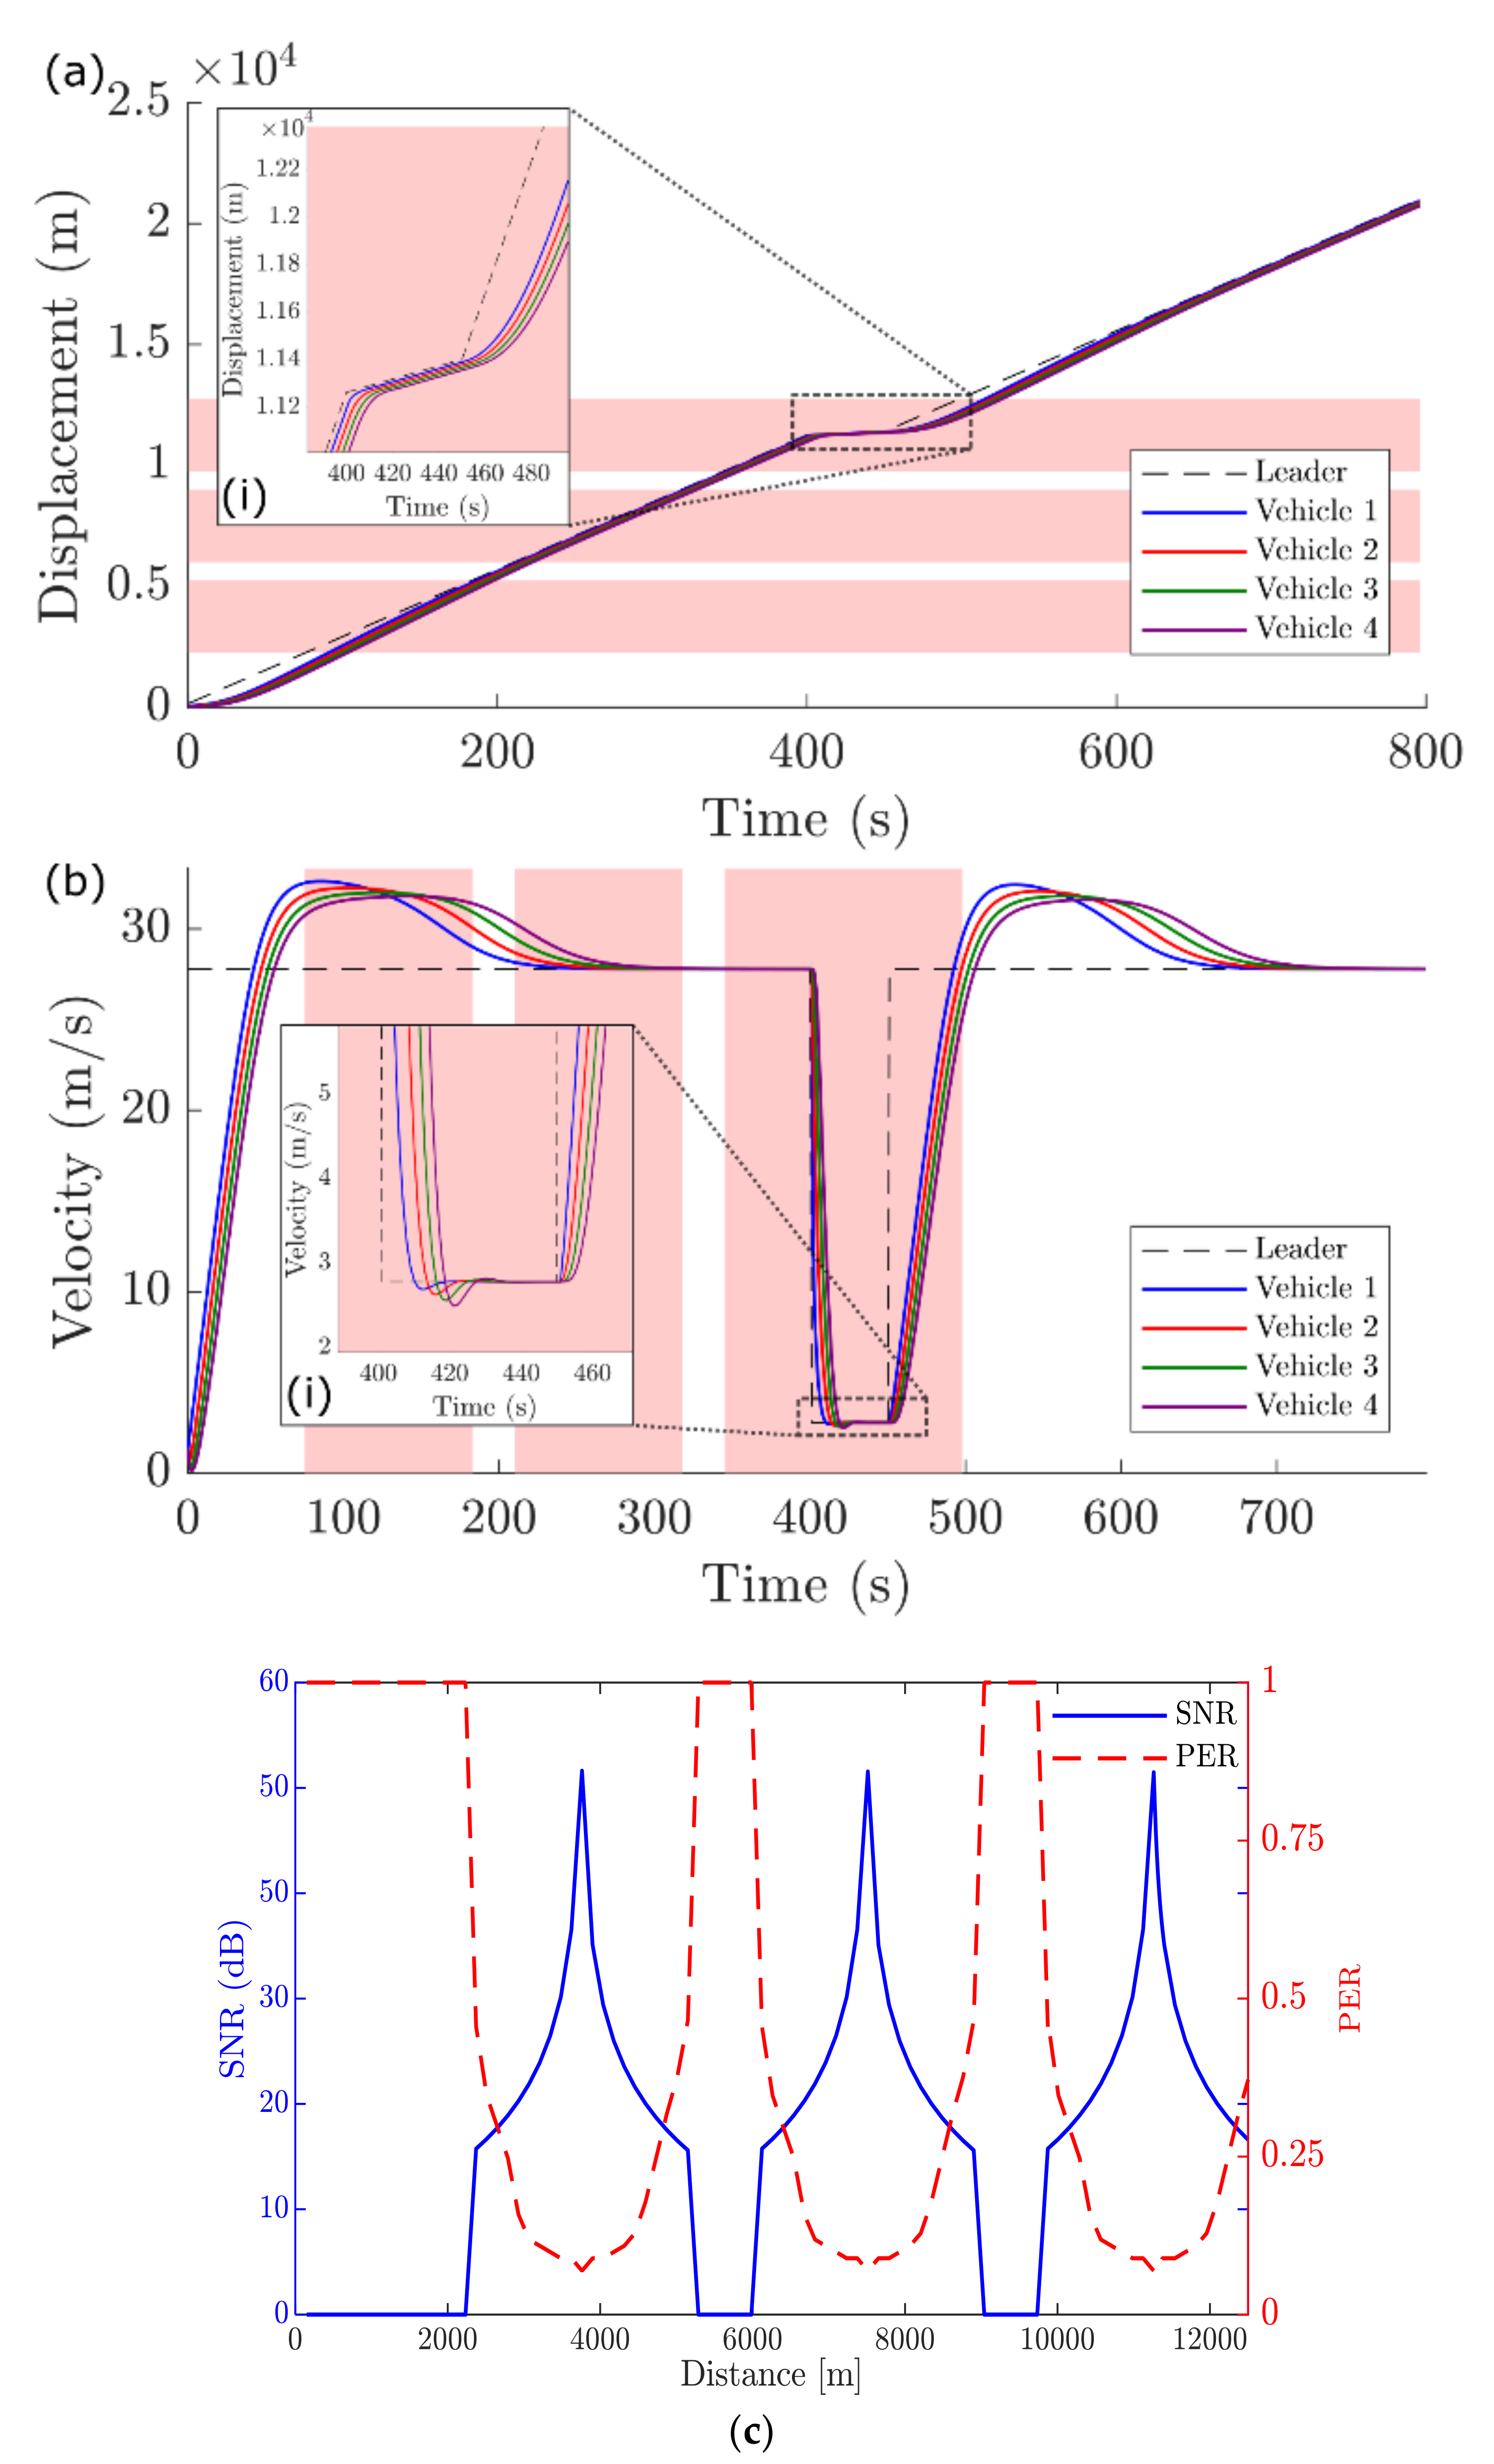
Case III—
Figure 9 illustrates the vehicle platoon’s functioning with V2I communication when an obstacle such as a truck or trailer blocks the direct LOS path between the platoon leader and the RSUs. We imitate the scenario by considering a barrier that blocks the direct LOS path between RSU 3 and platoon leader at 800 s of simulation time. As seen from
Figure 9a,b, the platoon enters the coverage range of the RSU 3 at 750 s, till which point the platoon was traversing under LOS conditions. Under these conditions, the communication range of the RSU’s was about 3000 m.
As the obstacle blocks the line of sight between the RSU and the platoon leader (at 800 s), there is an increase in the transmitted signal’s path loss. This path loss is observed as a decrease in the RSU’s communication range, which depletes its range to 1500 m. In this NLOS condition, the platoon leader falls out of range of RSU and has to travel some more distance to re-connect with the RSU; at around 1000 s, as can be seen in
Figure 9a.
Although, in this case, we assumed the line of sight between the platoon leader and the RSU 3 to be consistently blocked after 800 s, the example shows the ability of this model to predict how a platoon would react to dynamic changes in signal attenuation due to the environment and surrounding obstacles. This simple example can also be expanded to a more complex scenario of intermittent changes in the line-of-sight due to multiple trucks overtaking the platoon.
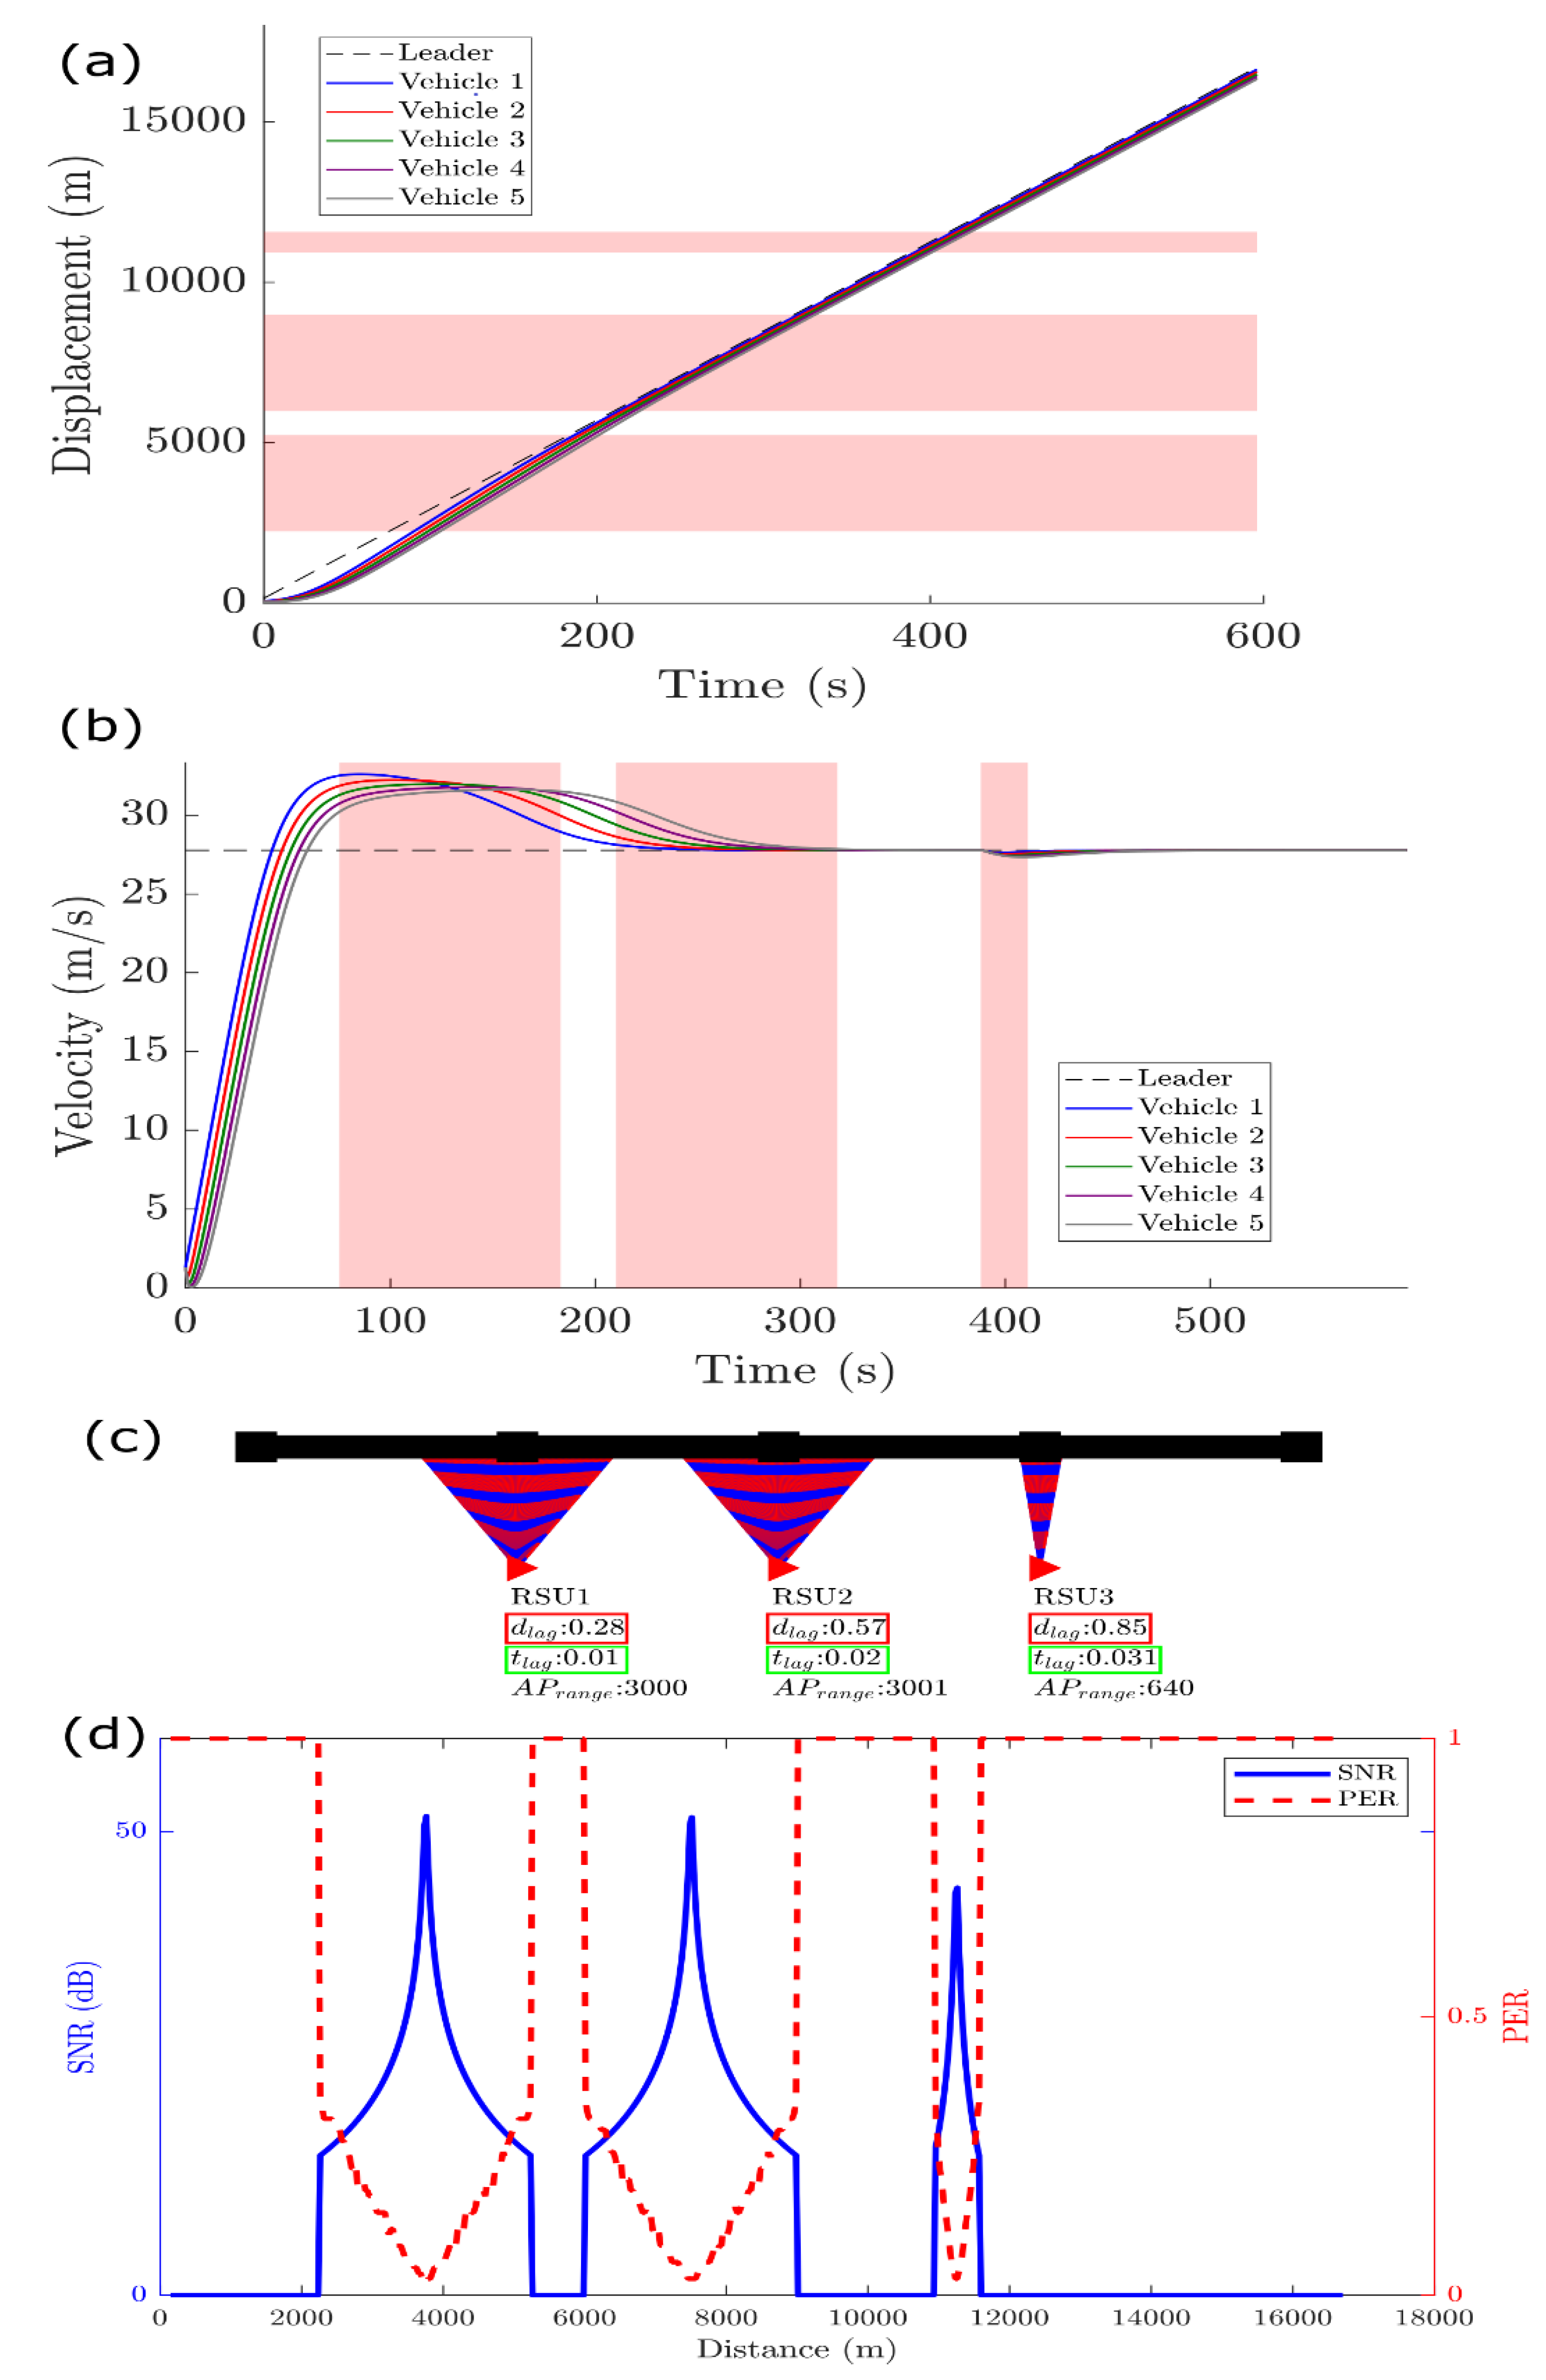
Case IV—In
Figure 10, we simulate our integrated model’s working in a scenario where a vehicle platoon enters an urban environment from a highway environment. Here, we show the effect of multiple isolated vehicle platoons communicating with the RSU’s in driving environments changing from a Highway LOS to Urban LOS. As mentioned in
Section 3.4, RSU 1 and RSU 2 are considered to be in a highway environment, and RSU 3 is regarded as an urban environment.
All the RSU’s are assumed to handle a different number of platoons, as mentioned in
Table 4; we simulate only one platoon’s motion assuming all platoons are isolated. We imitate the scenario where the platoon crosses the RSU 2’s coverage (Highway LOS condition) and follows the slip road into the city (Urban LOS condition). The RSU 3 is in an Urban LOS condition and due to multiple scatters in this environment, path loss exponent changes, that reduces the RSU range (3000 m) as opposed to that on the highway (640 m), shown in
Figure 10a–c.
Additionally, we assume that due to a high vehicle density in the urban environment, the number of platoons in communication with the RSU increases, decreasing the data throughput received by each platoon leader. This decreasing throughput increases the communication lag as a platoon enters the RSU range; the communication or time lag
of 0.01, 0.02, and 0.031 s is observed at RSU 1, RSU2, and RSU 3, respectively. This communication lag implies that, for any instance, even though the platoon leader is in the coverage range of an RSU 3, there is no effective communication established, and it moved 0.85 m, termed as the distance lag
in
Figure 10c.
This distance lag may become necessary for relaying safety messages in conditions when the coverage range of an RSU changes dynamically and is of a similar order of magnitude to the distance lag. Therefore, this parameter is essential in designing an appropriate RSU or V2I infrastructure layout, given any environmental and traffic conditions. This case shows that the coupled system works dynamically and shows the platoon vehicles can adapt to changes in range and communication ability of RSUs in a LOS and NLOS condition on the highway and urban environment. This shows the effect of traffic density on communication lag, and it can help RSUs implementation design in a transition from a highway to an urban environment.
Another aspect that can be included in communication is the change in path loss due to weather change. We found no concrete evidence of weather change significantly affecting path loss exponent, which varies at frequencies below 10 GHz. However, this integrated scheme can be used to simulate path loss changes due to weather alterations at other frequency schemes as well.
Corresponding changes in vehicular movement such as velocity decrement, safety gap increment, change in maximum acceleration, and deceleration exponents can be adapted and included as shown above accordingly.
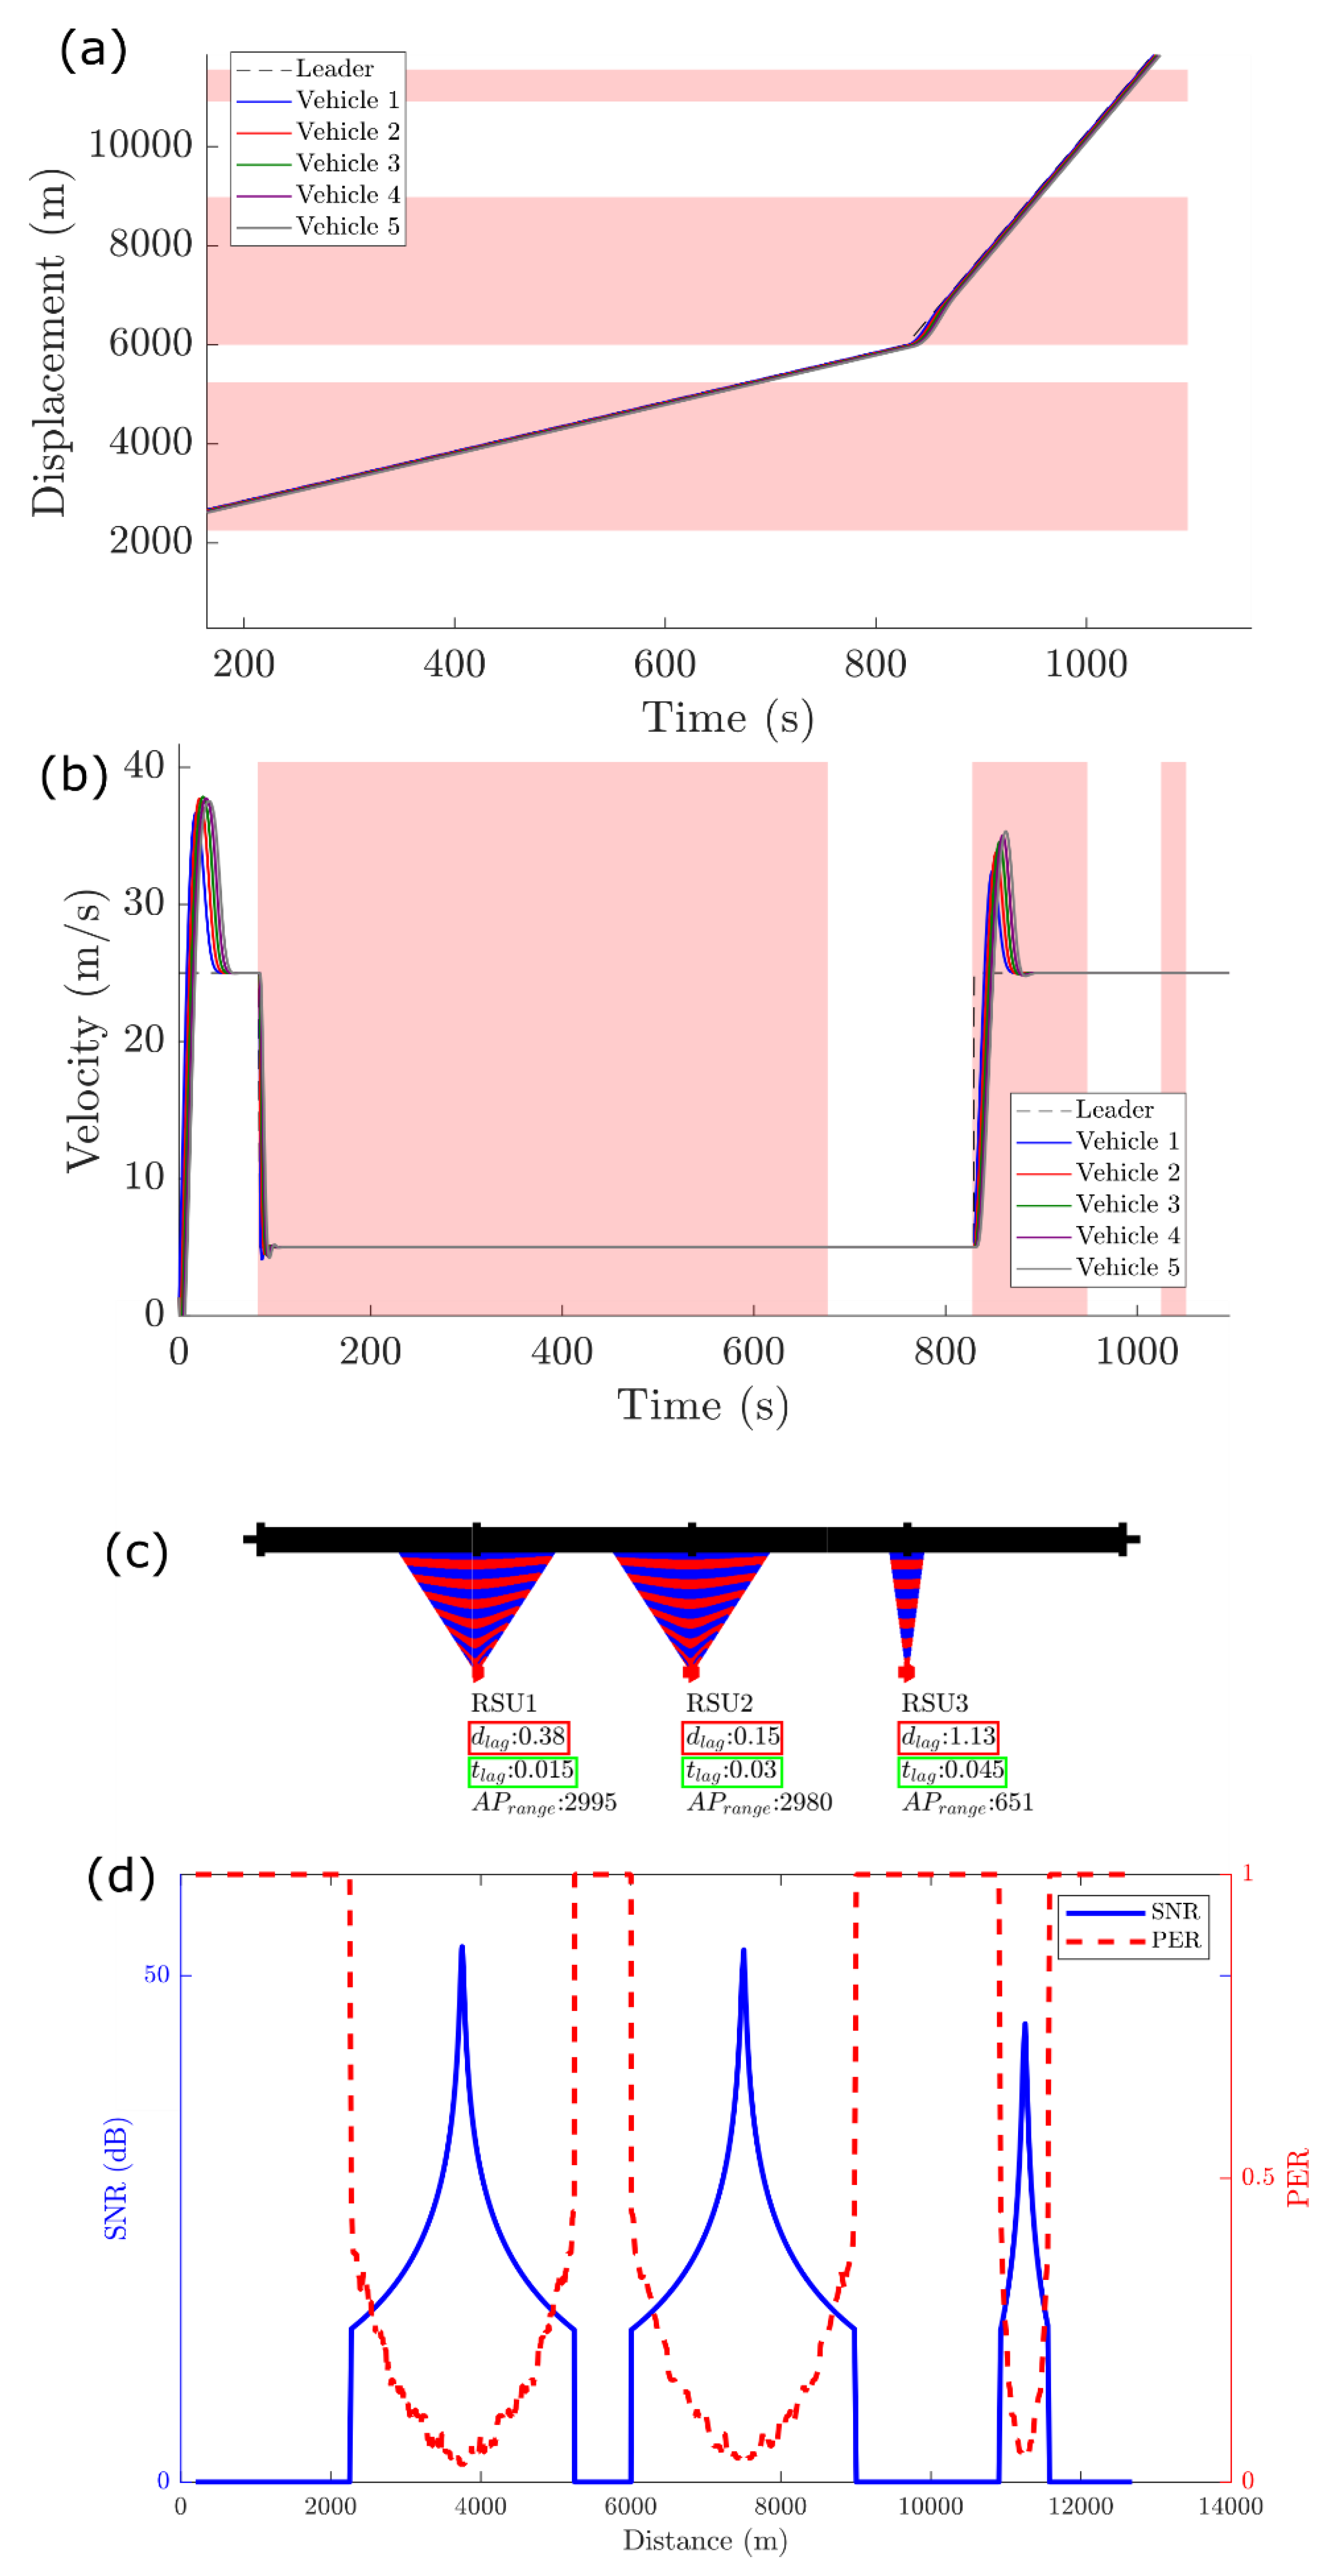
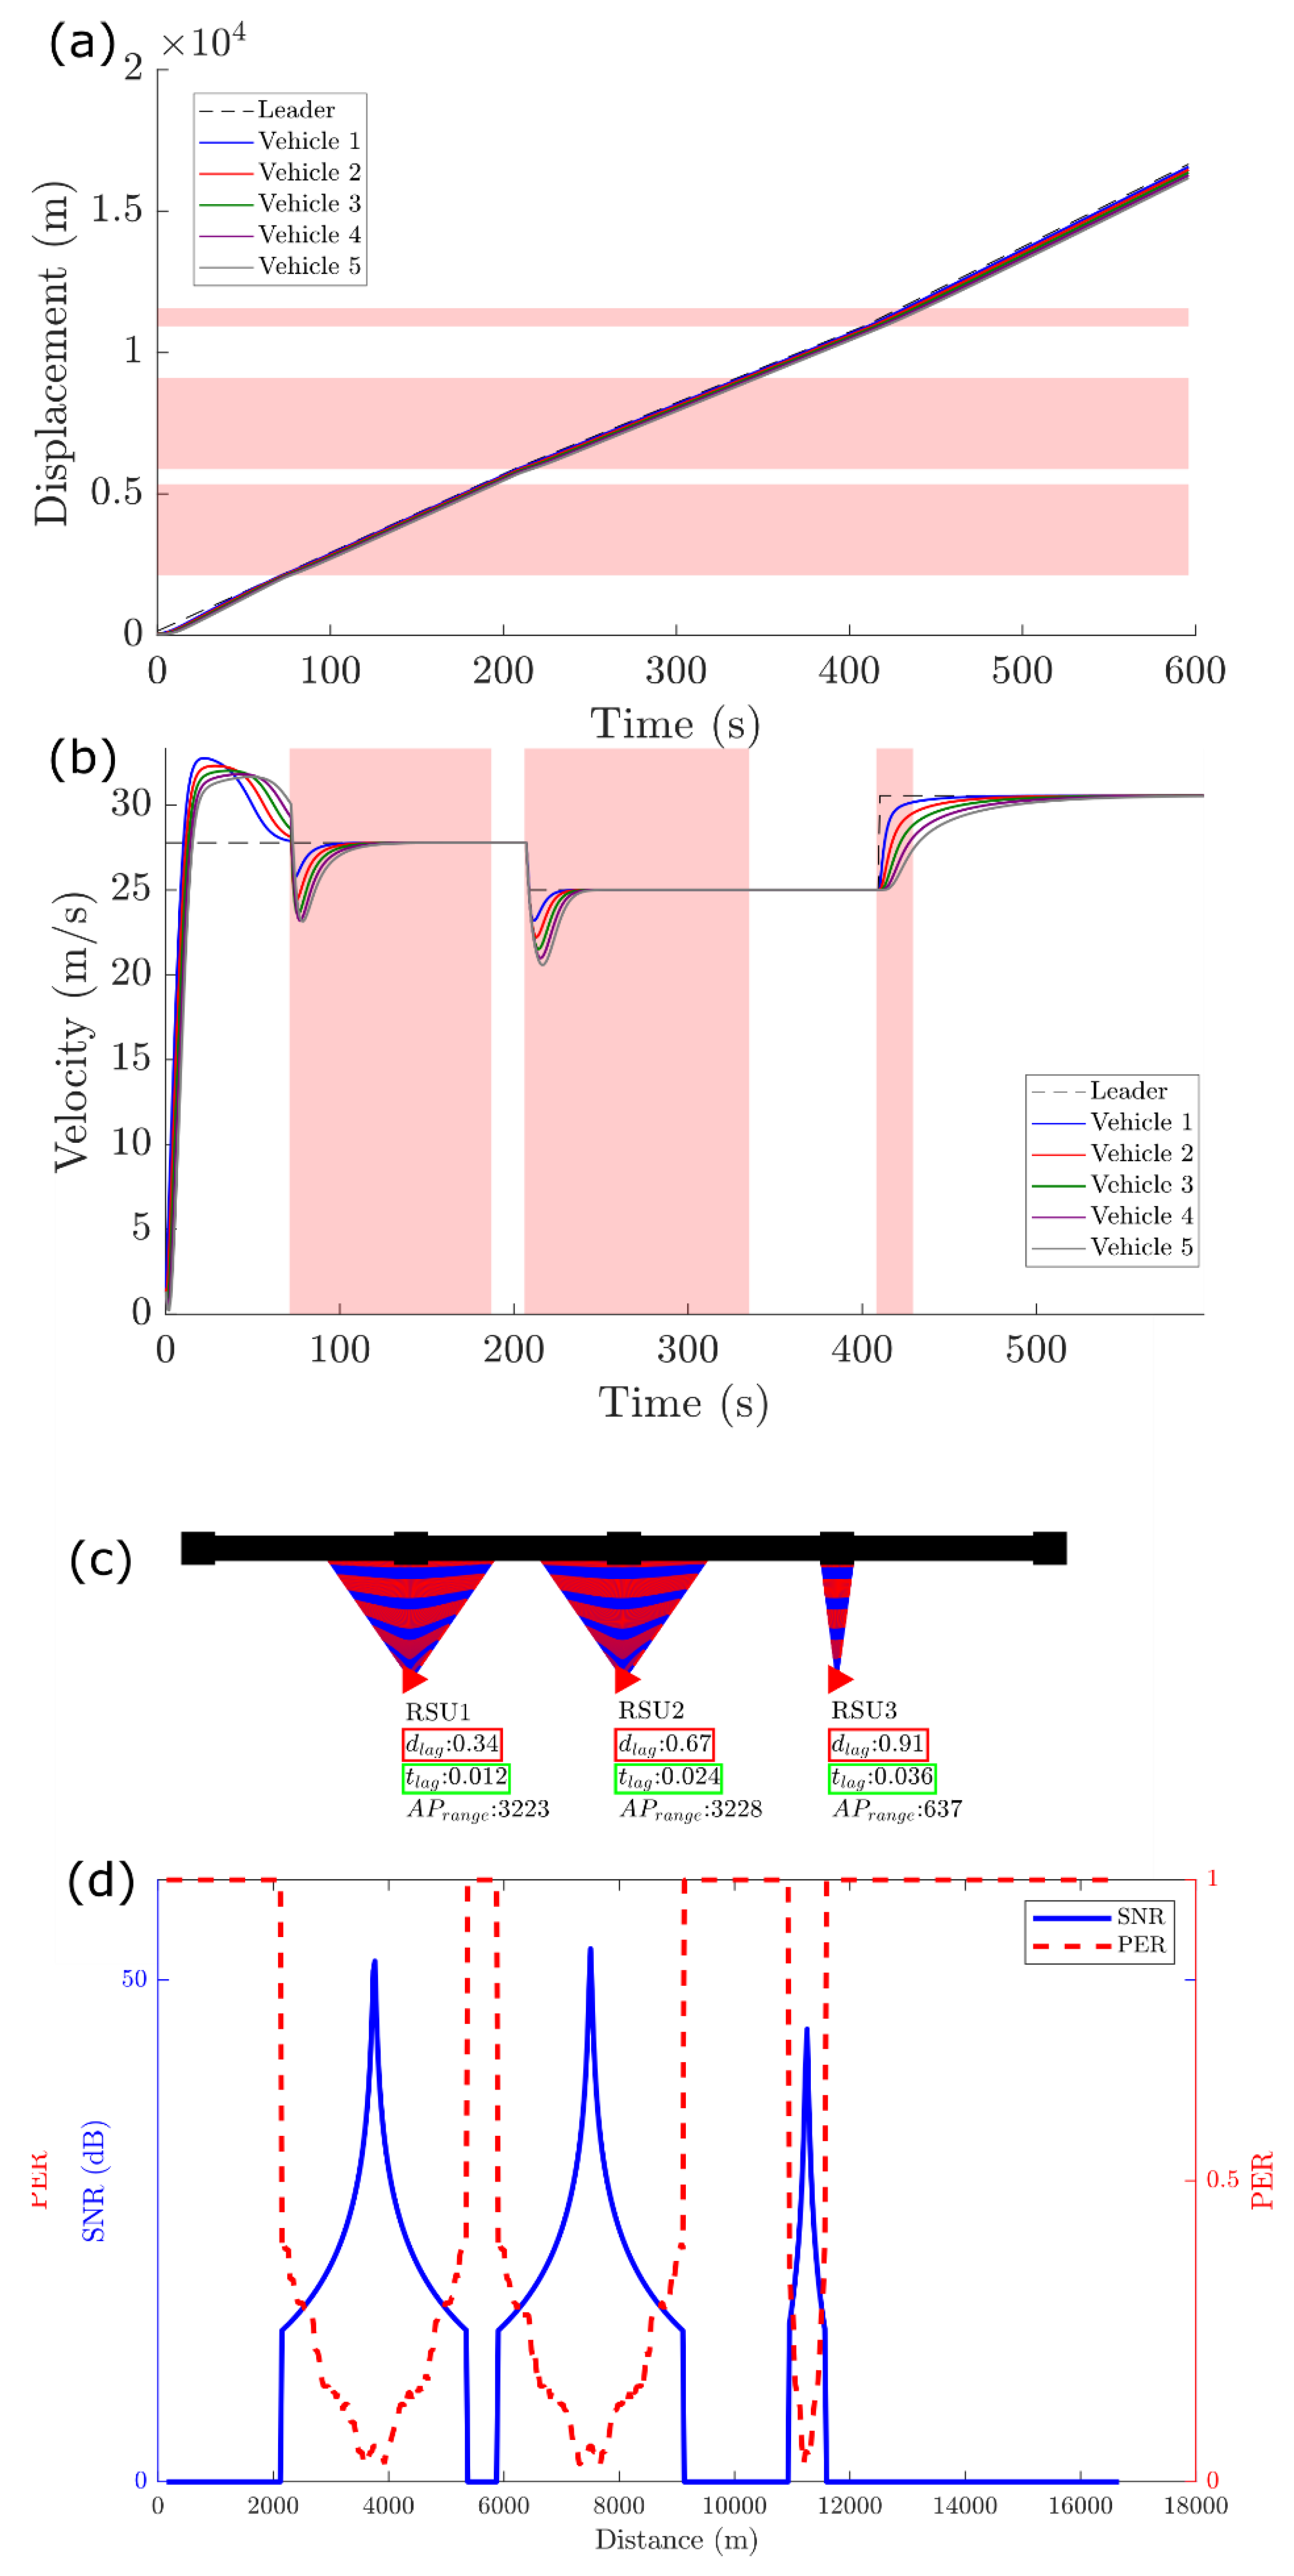
Case V and VI—These two cases are discussed separately in the following subsection, as they are mainly employed for comparison purposes with existing methods.
Comparison with the State-of-the-Art Models
We implemented two state-of-the-art models for cooperative intelligent transport systems, such as [
40,
41] shown in
Figure 11 and
Figure 12 as Case V and Case VI, respectively, and compared with our VX-IDM model described as Case IV in
Figure 10. The test cases from [
40,
41] are used to compare with our model test cases for simulation defined in
Table 4. The relevant results are compared in terms of dynamic change in velocity and gap between the platoons.
Figure 10 shows the VX-IDM model where a platoon’s behaviour is captured in terms of their displacement and velocity in urban and highway driving conditions. Moreover, the distance lag (
), time lag (
) and AP range are also calculated from RSU to Vehicle Platoon communication.
In comparison to the state-of-the-art models in [
40,
41], the
in
Figure 10c, at RSU 1, 2, and 3 are 0.28, 0.57, and 0.85 m, respectively. While in
Figure 11c, the
at RSU 1, 2, and 3 are 0.38, 0.15 and 1.13 m, respectively. In
Figure 12, the
at RSU 1, 2, and 3 are 0.34, 0.67, and 0.91 m, respectively. The distance lag
in all the three cases are compared, and it can be seen that overall, our model performs better than the compared models, where the distance lag (longitudinal spacing) is more compared to our model except in one case of RSU 2 in
Figure 11c. The
signifies that the platoon leader travels a certain distance in the communication range without connecting or establishing two-way communication with the RSUs. Therefore, the lower value of
is very important during a real-world driving scenario. Suppose the platoon leader’s communication is not established with RSU even when it is in the communication range. In that case, the platoon leader will fail to receive important updates or information. For example, safety messages about an accident on the road ahead are not communicated to the platoon leader and failing to act on the information relayed by the RSU, the platoon vehicles will collide with the vehicles in the front. Moreover, the stopping distance of these platoon vehicles at a velocity of
to
is about 58.77 to 67.8 m, respectively [
49]. Therefore, the lower
is very crucial for the safety of platoon vehicles.
Moreover, the time lag (
) calculates the time delay between instances where the platoon leader enters the RSUs range and establishes data communication.
Figure 10c shows that the time lag at RSU 1, 2, and 3 are 0.01, 0.02, and 0.031 s, respectively. While in
Figure 11c for RSU 1, 2, and 3 is, 0.015, 0.03, and 0.045 s respectively. In addition,
Figure 12c depicts the
of 0.012, 0.024, and 0.036 s for RSU 1, 2 and 3, respectively. The proposed VX-IDM model shows that the time lag required to establish communication with the RSUs is substantially lower than the compared model. Such low latency and seamless communication capabilities of the proposed model would help reduce the number of casualties and fatalities in road accidents. They would also improve traffic flow by tracking the vehicular network and mapping the least congested routes. Therefore, the
is an important aspect of vehicular communication for their safety, where platoon vehicles can communicate seamlessly with the RSUs and establish communication links even during a high-density traffic scenario such as an urban (city) traffic environment. The result attests that our model performed well compared to the referenced models.
Overall, the results clearly illustrate that incorporating IDM with V2I communication improves the fidelity of our proposed model. Moreover, our model shows consistent improvement in terms of distance and time lag compared with the referenced frameworks. These results are heavily focused on the value of spacing between the platoon vehicles, distance lag, and time delay for establishing reliable communication. Moreover, these mentioned variable values are considered very important for several applications, such as safety considerations, wireless network connectivity, and various traffic systems. Accurate simulation of the spacing and time lag is essential for all other physical attributes for platoon vehicles’ position, velocity, and acceleration. The results attested that the compared models’ longitudinal spacing between the platoon vehicles in motion is higher than our model, restricting relaying safety-related messages in a dynamically changing communication topology in real-time. Moreover, the communication delay (time lag), essential for vehicles to establish communication with the infrastructures and starts relaying safety-related messages, was substantially lower than compared state-of-the-art models in [
40,
41]. This makes the VX-IDM model collision-free for a platoon of vehicles on a single road for highway and urban driving environments.


 ,
, 


