Article

Interrelationship among CE Adoption Obstacles of Supply Chain in the Textile Sector: Based on the DEMATEL-ISM Approach

1
Department of Marketing and Logistics Management, Chaoyang University of Technology, Taichung 413310, Taiwan
2
Department of Information Management, Da-Yeh University, Changhua 51591, Taiwan
*
Author to whom correspondence should be addressed.
Mathematics 2021, 9(12), 1425; https://doi.org/10.3390/math9121425
Submission received: 13 May 2021 / Revised: 12 June 2021 / Accepted: 15 June 2021 / Published: 19 June 2021
(This article belongs to the Special Issue Advances in Multiple Criteria Decision Analysis)

Abstract

:
Globally, in the innovative and distributional circular textiles, the textile sector of Taiwan has a prominent place. Within the textile industry, the circular economy (CE) obstacles adopted have been studied by several scholars. However, the interrelationships among these obstacles are easily ignored. The present study aimed to identify CE adoption obstacles from the supply chain (SC) perspective in Taiwan’s textile sector by analyzing the interrelationships among the CE adoption obstacles and establishing a hierarchical network and the causal inter relationships of the identified obstacles. Furthermore, the CE adoption obstacles and interrelationships were analyzed using interpretative structural modeling and the decision-making trial and evaluation laboratory (ISM-DEMATEL). The common results of the two methods demonstrated that two obstacles, consumers not having sufficient knowledge and awareness of reuse/recycling (B1) and a lack of successful business models and frameworks for CE implementation (B3), were the significant obstacles influencing adopting CE in the textile supply chain, while the obstacle making the most efficient way (B12) of the right decision to implement CE was minor. Thus, the government should formulate friendly laws and regulations that encourage CE adoption, while textile firms should monitor and control recycling and efficiency approaches handling the CE adoption problems. Our results could offer first-hand knowledge to textile firms or managers to effetely achieve CE implementation objectives.

1. Introduction

For manufacturing firms, due to the increasing importance of sustainability and environmentally-friendly activities in today’s world, the circular economy (CE) is becoming more important. Transiting the economy from linear to circular is inevitable for manufacturing firms to be part of a sustainable and fair global economy [1]. Sustainable development concerns such as unstable climate and increasing carbon emissions have forced companies to modify their supply chains from a linear economy to the CE [2,3,4,5]. The CE and its adoption have been mostly accepted in the textile sector, which is the largest manufacturing sector to pollute the climate because of its complex processes. The textile sector, being the world-second-largest polluting sector, has a supply chain (SC) in which poisonous substances, causing pollution of air, soil, and water, are used largely [6]. Globally, the amount of textile waste is increasing. However, textile recycling and reuse can reduce the amount of additional waste created from virgin materials [7]. The textile sector also uses uncontrolled water amounts in their manufacturing processes, as this sector’s production processes are all very water-intensive [8,9]. Therefore, CE principles play an essential role in decreasing pollution in the sector of textile via material and energy density, reusable materials, reducing materials, increasing recycling ability, using low toxic materials, eliminating waste, and focusing on resource efficiency [10,11,12,13]. In this way, the final product cost and fiber demand can be greatly reduced [14].
Among literature review, researchers show increasing interest in the adoption of CE and sustainable management. Adopting CE within the textile SC has been studied by several scholars. Amid them, the transition to a more circular textile sector is also facing various challenges [15]. Identified via researchers, various sorts of obstacles, including economic, social, financial, and cultural, governmental and regulatory, supply chain and infrastructural, organizational, and technological ones, can usually obstruct CE [16]. In the textile sector context, present research has provided information on issues related to the CE [13]. Furthermore, recent studies have used a multi-criteria decision-making approach to measure the priority of CE obstacles in the textile industry [17]. These studies shed light on the relative role of the CE obstacles in the development of more effective facilitating strategies. Indeed, knowing the priority of obstacles is insufficient, as a series of factors may cause multiple sequences of disruptions to have a domino effect. Moreover, those methodologies for providing CE adoption obstacles are not clear in the existing studies [18], governments and textile firms must learn more about the interrelationships between obstacles to identify the critical obstacles; otherwise, they cannot develop more cost-efficient CE solutions in their supply chains.
Although the expanding literature of the overall or CE obstacles in the textile SC has improved the quality of knowledge, there is little information about the interactions between the aspects of obstacles preventing textile SCs from launching new items with a short product life cycle, and this leads to less durable quality and high costs [19]. The consumption of textile items and the waste of textile products have been rising dramatically. The waste produced during the manufacturing process can be used as a significant input in other manufacturing processes such as harvesting, raw material, yarn manufacturing, designing, weaving, cutting, and spinning [20,21]. It is self-evident that today’s linear economy is incapable of achieving a sustainable manufacturing process. As a result, the CE is an alternative to the textile sector [22]. However, although textile firms have been recommended to transport their capabilities from a linear economy to the CE, numerous obstacles are encountered during this process. Therefore, the present study focused on the obstacles that prevent companies from adapting to the CE. There is currently no study on assessing the obstacles of CE adoption in the context of textile SC in the literature; therefore, the research questions (RQ) were addressed below:
  • RQ1: What are the obstacles opposing to CE adoption in the textile supply chains?
  • RQ2: How can the interrelationships among identified obstacles be obtained?
  • RQ3: What is the intensity of these interconnections?
The existing studies on CE adoption have emphasized different methodologies, such as ISM [12], DEMATEL [19], and ANP. As a result, there is confusion among the findings. Consequently, a systematic model for assessing and clustering CE adoption obstacles is essential. Therefore, the present study aims to determine the obstacles affecting CE adoption in textile SC through literature review and interviewing specialists to help prepare CE strategies by studying the sequences and interrelationships among the finalized obstacles. In addition, this study adopted an interpretative structural modeling (ISM)–decision-making trial and evaluation laboratory technique (DEMATEL) approach. ISM and DEMATEL are also useful for analyzing complex problems with hierarchical and communicative systems [23]. ISM measures the interrelationships among factors, and DEMATEL determines the cause–effect relationships. ISM is used to analyze sophisticated processes and takes a holistic view, while the utilization of DEMATEL is defining direct and indirect relationships. The common results of the two methods demonstrated that two obstacles, consumers lacking reuse/recycling knowledge and awareness (B1), and triumphant business models and frameworks exploiting CE (B3) were the central obstacles influencing adopting CE within the textile SC. Meanwhile, making the right decision with the most efficient way to implement CE (B12) was a minor obstacle. According to these findings, textile firms should monitor their customers’ needs and provide the proper information to effectively understand the reuse/recycle benefits as well as control the recycling approaches used for CE adoption. The government should also formulate friendly laws and regulations that encourage companies to address these CE adoption issues. Given that this study aims to contribute the determination of relationships about hierarchical and causal among the obstacles, the present study exploits the combined ISM-DEMATEL approach. This paper provided a realization of both the interrelationships among the CE adoption obstacles and a greater realization of the CE adoption context in the textile firms SC. The outcomes of this study could provide further guidelines accordingly for the determination of critical obstacles that improve CE adoption in textile SCs. Additionally, the perspectives of the hierarchical network and cause–effect interactions could improve the managers of supply chain and textile sector experts to determine the critical obstacles on which they should place more control or focus, as well as manage the trade-offs among obstacles, thereby improving the firms’ overall efficiency and customer satisfaction.
The paper organization of the remainder is as follows: the literature review and the research methodology are presented in the next section. As for Section 3, it establishes the integrated model. Thereafter, the fourth section discusses the results. Section 5 offers suggestions and managerial implications.

2. Literature Review

2.1. Role of CE in the Textile Sector

With a systematic perspective, as per Zhu et al. [24], CE adoption plays an essential role for improving the overall productivity of a firm. In addition, recent studies on the obstacles of CE adoption in various circumstances have given insight and practical strategies for CE adoption. Recent research has concentrated on particular contexts, including the manufacturing sector [25], the automobile sector in developing countries [26], and the renovation and demolition waste disposal sector [27]. However, there have been few studies on what obstacles the textile sector faces in converting to CE and how to overcome them.
The textile supply chain, including housing, transportation, and food, has a huge impact on the environment [28]. These issues of the sector comprise the reduction of its cost of material and energy use, maximization of renewable-resources use, toxic material scatter reduction, an extension of product durability, enhancement of recycling, and service improvements based on the sustainability perspective [29]. Reformation of the current stage, the common linear movement of resources, is required. Such reform is necessary from a circular perspective, as change can be accomplished by carefully designing products and manufacturing processes so that resources are handled in closed loops, as if they were perpetually flowing nutrients [30]. Recently, problems connected to textile product recycling and reuse have acquired more coverage within the literature [15]. Zhu et al. [24] proposed four groups’ barriers and suggested strategies for circular waste management: advertise the CE’s economic benefits, promote share waste-related data, enhance collaborations between industrial players, and harmonize regulations. Therefore, the recycling and reuse of textile products are well accepted as preferred methods for mitigating environmental effects compared to incineration and landfilling [31]. Furthermore, an adopted environmental management system by a company is required to monitor waste and pollution levels, and the system should implement both corrective and preventive actions when needed. Accordingly, the effective implementation of an environmental management system in textile plants will enhance the usage of the end product, water, and energy. The environmental management system should help in re-designing the products or processes in order to optimize the used materials. In other words, the application of an environmental management system leads to cost reduction, quality improvement, waste reduction due to re-design, proper equipment selection, in addition to time savings [9,10]. On the other hand, textile recycling is limited due to the sector’s numerous socio-economic problems. Since only a few different methods for textile recycling exist today, the majority of the flow is down cycled into wipes, rags, or is used as insulation in different industries. The remainder of the collected used textiles is either landfilled or incinerated. In some cases, clothing that is no longer in use is accumulated in closets or exchanged informally between friends or family members. Dahooie et al. [17] investigated the potential of reusing textile wastes. They illustrated that textile wastes are an enormous source of secondary raw material that is not used but can be re-injected into the market. To convert a linear production/business model into a circular one, the CE is a technique, which utilized waste resources. As for a means of inventory repossession and negative impacts reduction, based on using recycling, reutilizing, rebuilding, producing again, and renovating, parts of the CE are resurrected into the supply chain within a system of closed-loop [32]. By using CE adoption strategies, a significant amount of waste generated from manufacturing can be decreased. In addition, the development of sustainable business models with identification of key obstacles for CE adoption in the textile SC. Those models are evaluated waste materials exploited in the textile sector, including the impotence to reconsider the designing aspects for maintainable product growth, low market standards regarding recycling, inadequate consumer knowledge, and alignment shortage of principles along the textile SC.
Overall, moving the sector of textile towards CE necessitates novel system-level reforms and extraordinary levels of commitment, innovation, and collaboration [33]. Furthermore, the size and speed of the transfer are dependent on all supply chain participants’ knowledge, understanding, and commitment. Mangla et al. [32] determined different entrepreneurial issues that are potential obstacles to a paradigm transfer towards the adoption of CE. Despite the fact that previous research studies have uncovered CE adoption obstacles, scholars have offered few recommendations for changing the textile supply chain process [34]. Thereby, this study aimed to target this research gap by offering solutions for CE intervention techniques implementation within the textile sector.

2.2. CE Adoption Obstacles Identification

According to the literature review, CE adoption has numbers of practical facets that vertically include different levels of the supply chain, such as the macro-level, micro-level, and meso-level. These three stages are interdependent [18]. The research of obstacles to circular business model adoption, such as the study of Ranta et al. [35], has concentrated on initiatives of the micro-level. The challenges of moving toward a circular business model for focal firms are deciding on “the logic of how a firm produces, value delivery and capture for, and inside loops of closed material” [36]. Various market models, as an example of product referring to service, reusing resource and circular supply models, and product life extension models, thoroughly find ways to move towards CE adoption [37]. Ghisetti and Montresor [38] identified different kinds of obstacles that deter small and medium-sized business adopting business models of CE, such as shortage in capital, technical expertise, administrative burdens, network support in supply and demand, information, and government support. Another study reported that the most influencing obstacles to CE adoption are considerable initial funding costs, misunderstandings, and urgent feelings [39]. According to another report, the most influential obstacles to CE adoption are considerable initial financing costs, confusion, and lack of urgency.
Oghazi and Mostaghel [40] categorized obstacles into internal and external of the focal firms, and proposed circular business models that would necessitate tailor-made CE solutions. The development of a closed-loop supply chain at the meso level is critical for several circular recycling or remanufacturing business models [41]. Franco [42] analyzed the struggles and challenges of CE adoption within the textile SC and found that the most prevalent obstacles are the shortage of customer understanding of remanufactured goods, business technology limitations in making products that can be quickly remanufactured, and the lack of of public awareness of CE. Additionally, Shi et al. [43] examined the relationships of causal between obstacles in a closed-loop SC, finding that remanufacturing has the most important obstacles live in remanufacturing. Similarly, governmental bodies are the main factors driving the progress of CE adoption at the macro level, according to a large-N study on CE adoption issues in Europe. Filho et al. [22] determined that cultural obstacles, especially the shortage of customer involvement, awareness, and indecisive firm culture, are the most significant obstacles for policymakers and textile sector experts adopting CE. Abdullah et al. [44] analyzed results from the literary work and created a framework of CE based on soft factors and hard ones. The outcomes confirmed soft factors (e.g., institutional, regulatory, or social factors) inhibit the adoption of CE, whereas hard factors (e.g., those connected to the availability of financing, and technical solutions) drive CE adoption in the textile SC.
As Table 1 shows, the obstacles adopting CE in the supply chains of textile firms were determined through conducting literature review systematically and collecting opinions from the experts from the textile sector in Taiwan. Various obstacles at the micro and meso levels comprise the enormous problems which the textile sector deals with. However, obstacles also exist at the macro level. The fuzzy Delphi method (FDM) was exploited in order to identify twelve obstacles after the review of the literature, which included coordinated interactions among expert groups on the identified obstacles. There were two rounds of revisions and modifications before arriving at the finalized critical obstacles. The expert group consisted of representatives from fabric mills, wearing apparel, textile product manufacturing, and clothing accessory manufacturing, and spinning mills, as displayed in Table 2.

2.3. Existing Models Using ISM and DEMATEL

ISM, a mathematically derived approach, is for recognizing and analyzing the interrelationships among obstacles which are used to describe an issue. In the ISM approach, the expert chooses to measure the interdependence among factors, so it is interpretive of nature [54]. The process of ISM converts the numbers of different indirectly and directly connected factors into a hierarchical model. The network represents the interrelationships among the factors or obstacles and analyzes the potential influences they may have on one another. This technique is designed to be used in groups, but it can also be used independently [55]. Regarding multiple-criteria decision-making (MCDM) techniques, the ISM and DEMATEL combination is a well-established approach for determining the interrelationships among different elements or obstacles. It offers a cause–effect map that effectively demonstrates the interrelationships among such factors or obstacles. For MCDM issues, DEMATEL assists in determining the direct and indirect relationships among the standard exploiting the group inputs [56]. ISM and DEMATEL are powerful network modeling tools that are regarded as superior to other interpretive and decision modeling tools [57]. In the present literature, the integration of ISM and DEMATEL succeeded at being used in different contexts and in different fields, handling decision-making issues [58,59,60]. However, studies on the combining of ISM and DEMATEL are limited in the textile sector [61]. A summary of the literature using these approaches is in Table 3.

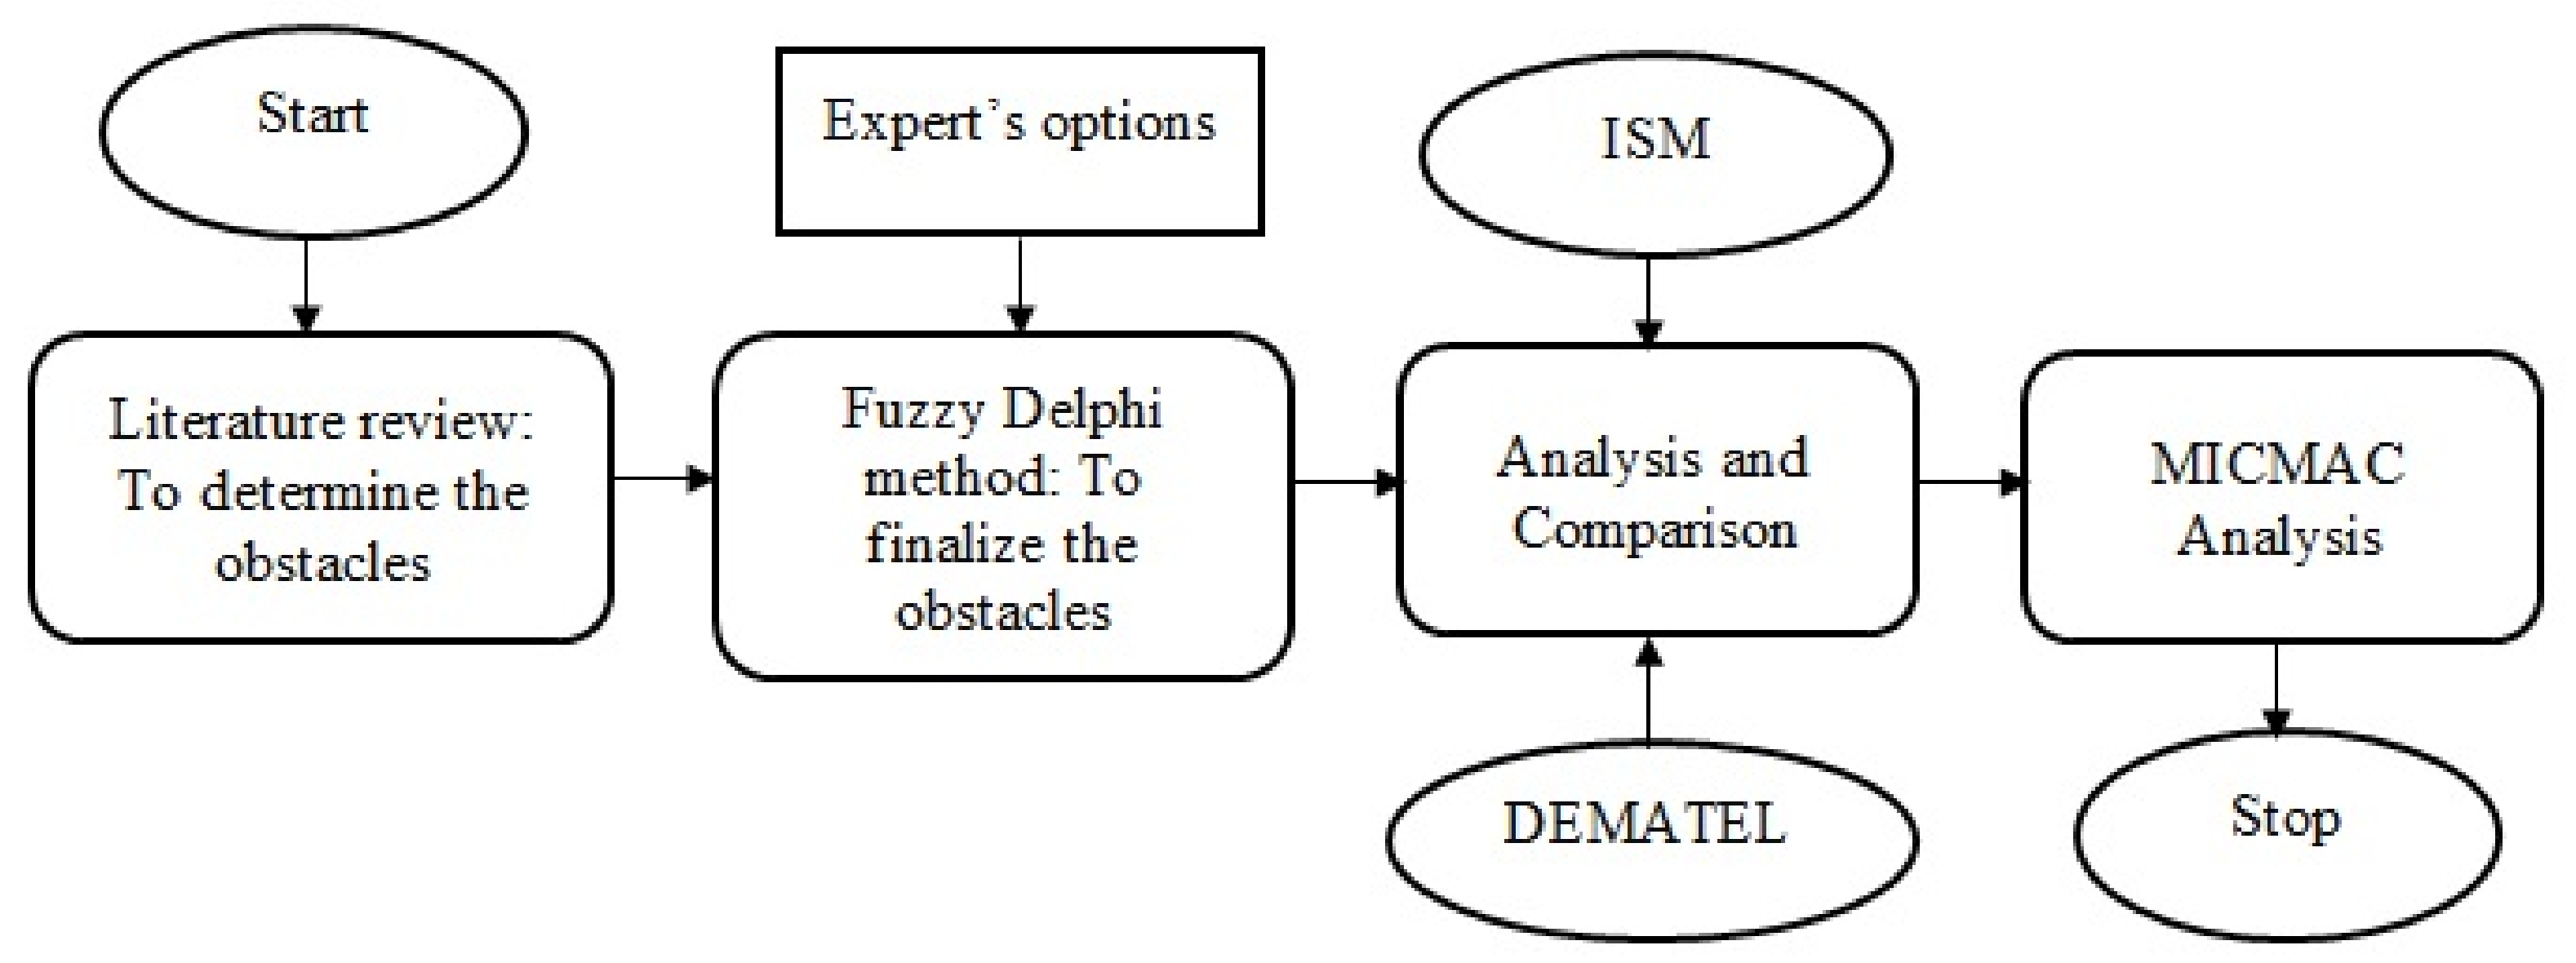
3. Research Methodology

The present research aimed to build on our previous research for further development of a hierarchical model and cause–effect map of the CE adoption obstacles in the textile SC. To achieve these objectives, the authors utilized an assemblage of the ISM-DEMATEL approach. This study combines the ISM and DEMATEL approaches since they have similarities, and they can analyze complex interrelationships among the obstacles of CE adoption in textile SCs. The cause–effect relationships can also be disclosed via this approach by utilizing the driving and dependence power in ISM as well as DEMATEL’s prominence values. In addition, although ISM is a macro-oriented method, DEMATEL balances this with a micro-oriented emphasis that aids in understanding and visualizing the level of significance of considered elements through well-described network or maps (a hierarchical network in ISM and a causal map in DEMATEL) [64]. Moreover, few researchers have combined ISM and DEMATEL classifying and analyzing the qualitative input at each point of the research. Figure 1 depicts the research flow.
Furthermore, those methods use expert options as a base for analyzing the interrelationships between the obstacles of CE adoption in textile SCs. Therefore, the present study sought options from different experts in the textile sector. A group of experts were questioned at the primary stage as input for the ISM approach, in order to confirm and determine the interrelationships among the identified obstacles. In addition, the suggestions of another group of experts were used to validate and identify the causal relationships among the obstacles adopting CE. The expert’s profiles can be seen in Table 2. The experts considered for the present study all had more than ten years of experience in their current company, and the majority of the experts had worked in the textile sector for more than ten years. In addition, the education of the experts was also considered, in order to improve the reliability and validity of the research findings. All experts were graduated from well-known universities in Taiwan. Then, using questionnaires, we have taken inputs from the textile experts. Respondents were inquired to answer items on a scale of five points, with answers including strongly agree, agree, neutral, disagree, and strongly disagree (scored as 1, 2, 3, 4 and 5, respectively). In total, 68.7% valid responses among all the participants were received. In the future, the FDM was used to identify the major obstacles based on the expert assessments from Taiwanese textile firms [65].

3.1. Interpretive Structural Modeling (ISM)

Using the ISM approach, the present study aimed to develop a hierarchical network of CE adoption obstacles to provide a greater understanding of their dynamics and help practitioners of the textile supply chain to focus on potential obstacles and implement CE in their SC. To achieve one of the present study objectives, we performed ISM to analyze the interrelationships among the identified key obstacles. The main objective of ISM refers to utilizing the practical experience of experts to convert a complex system into different subsystems (i.e., factors) and build a multilevel structural network [66]. The different steps involved in the ISM approach are described below [57]:
  • Determine 12 key obstacles to CE adoption in textile SC.
  • Analyze the contextual interrelationship of each barrier by examining the pairs of obstacles.
  • Develop a structural self-interaction matrix (SSIM) for the determined obstacles. The SSIM examines the pairwise interrelationships among the obstacles.
  • A reachability matrix is framed and verified for transitivity from the SSIM. The contextual relation transitivity, a basic assumption, is considered in ISM (i.e., if variable A is related to B and B is related to C, then A is necessarily related to C).
  • The reachability matrix is partitioned into dissimilar levels.
  • Draw a directed network according to interrelationships identified in the reachability matrix.
  • In this step, the ISM network is examined to ensure conceptual consistency, and the necessary modifications are implemented.
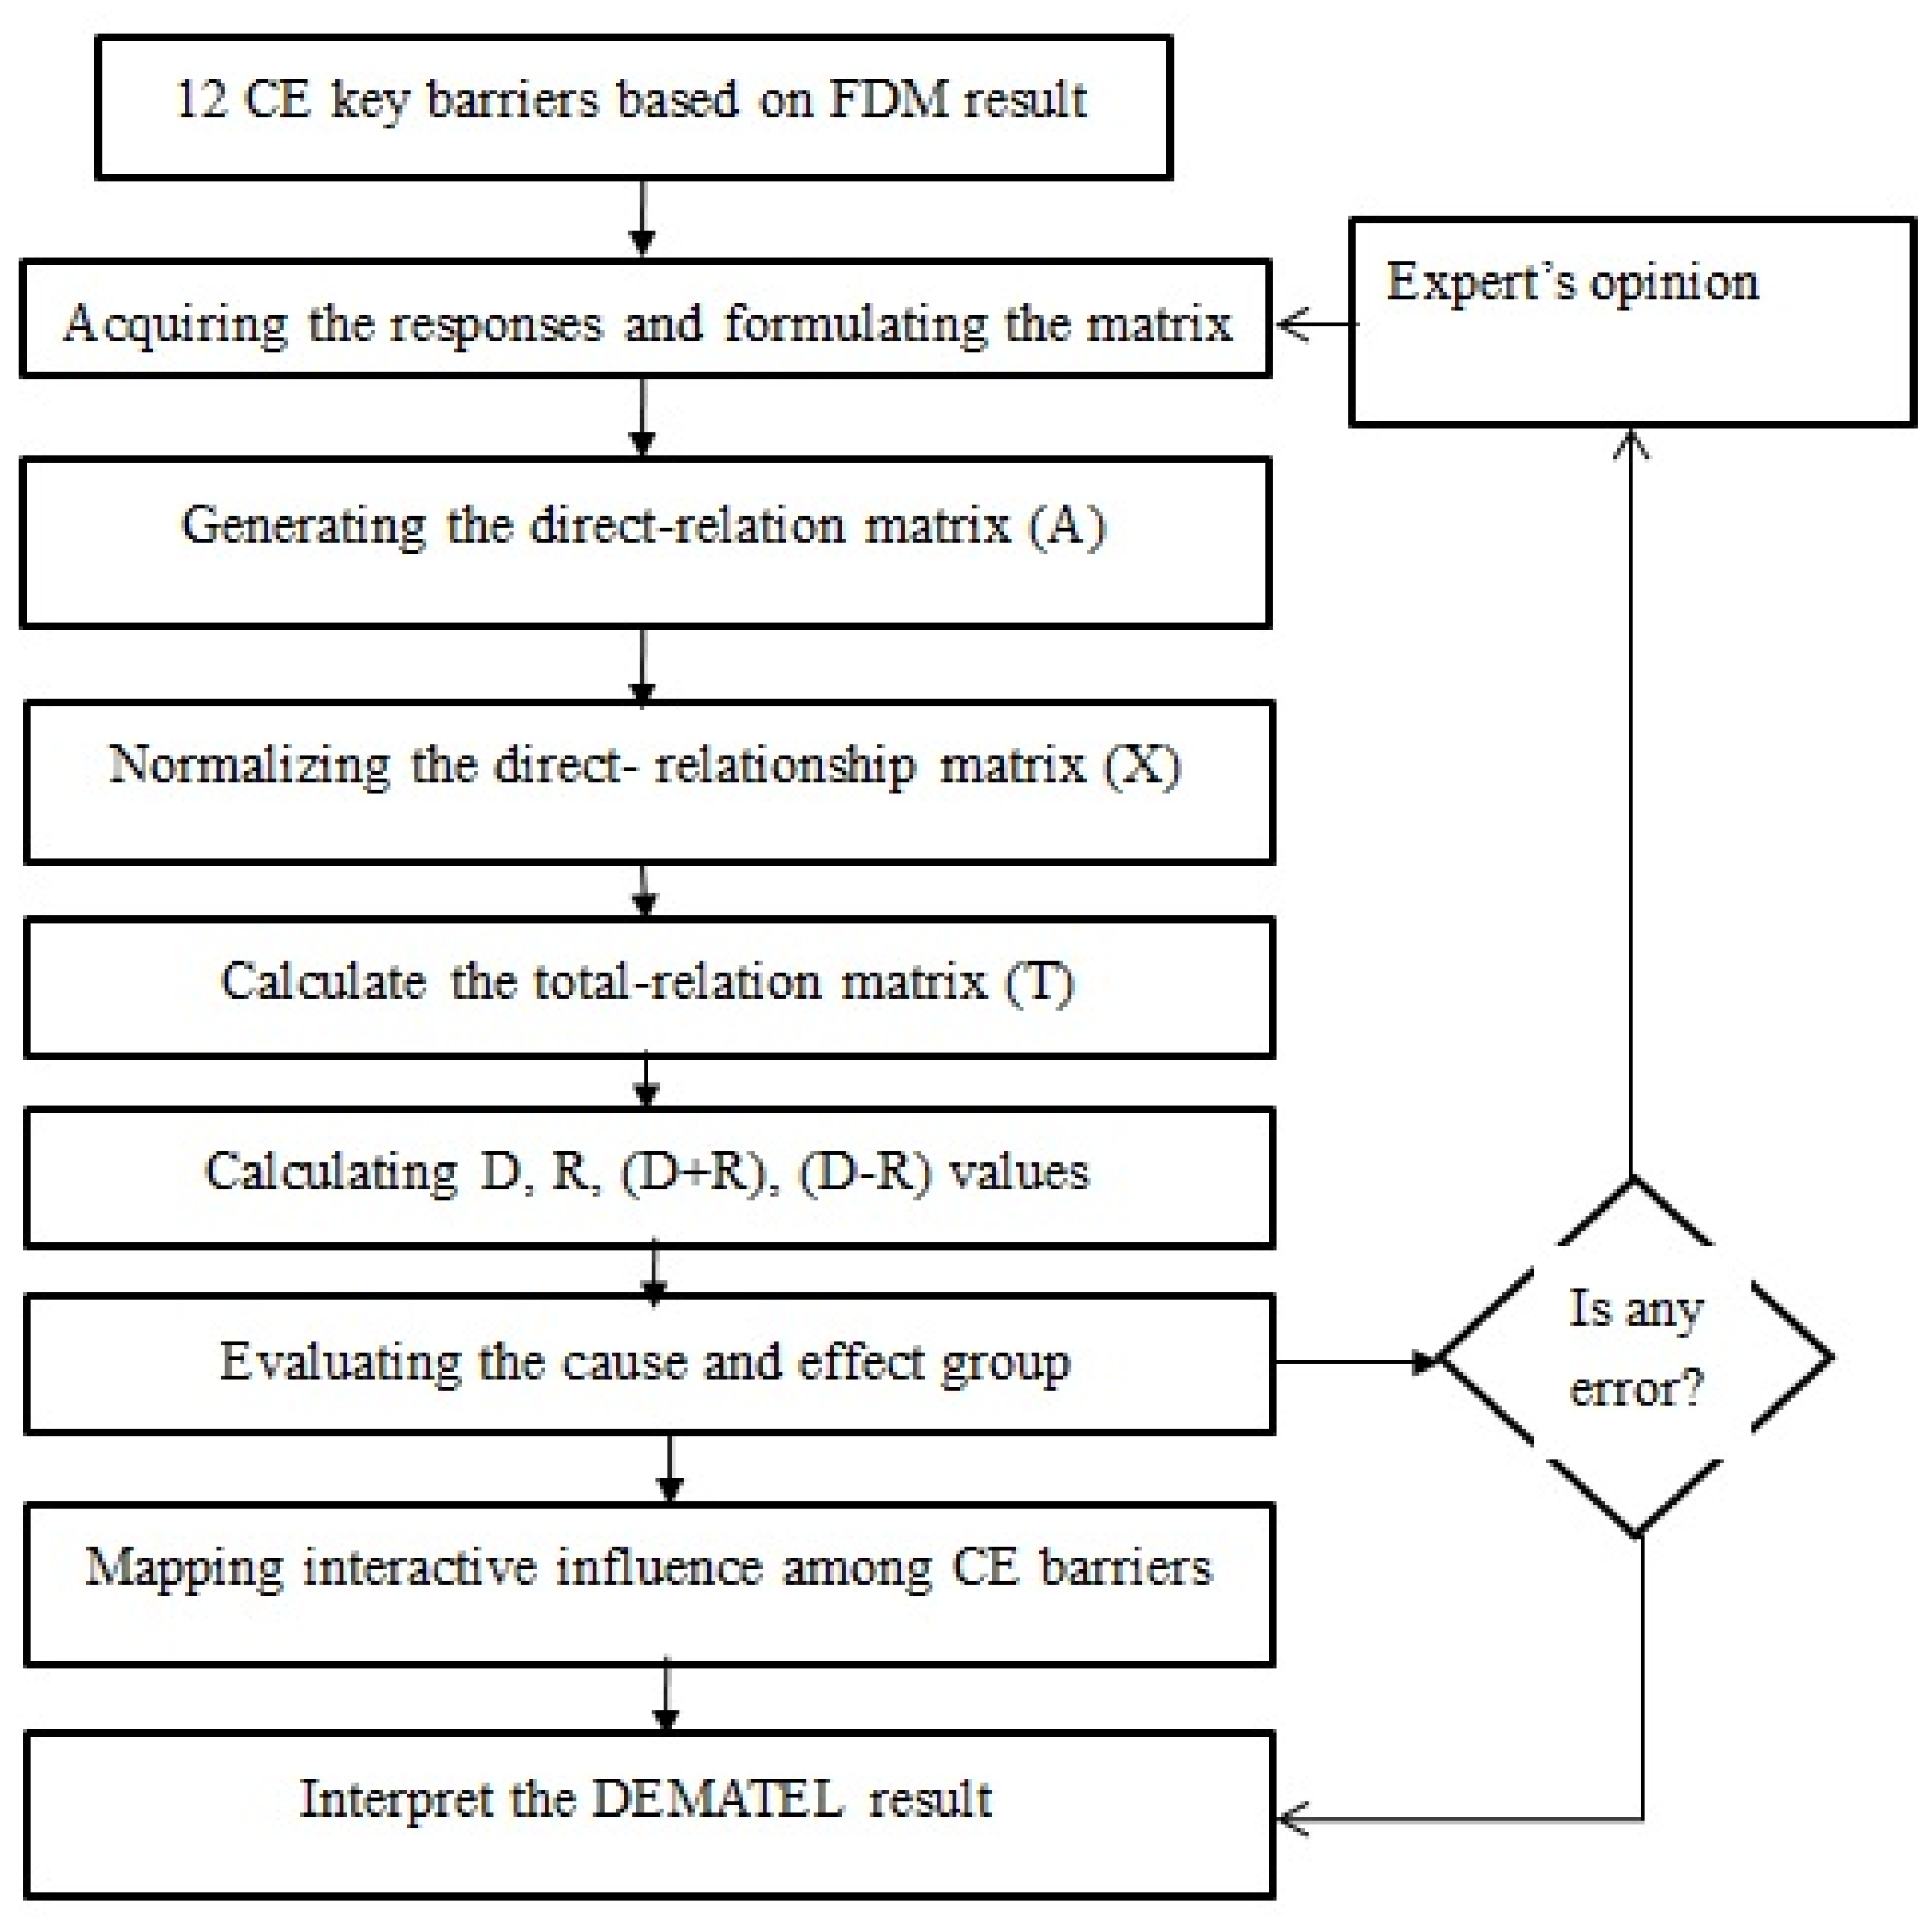
3.2. DEMATEL

The DEMATEL method was used to analyze and develop a structural approach of causal relationships from among the determined CE adoption obstacles. The Science and Human Affairs Program of the Battelle Memorial Institute of Geneva (1976) introduced the DEMATEL method to overcome and learn complex criteria and intertwined problems [54]. DEMATEL, a well-known technique, is often used to analyze judgement problems in Japan [67]. DEMATEL depicts the causal relationships among numerous variables and serves as a structural framework map. Comparing with other models, DEMATEL has a major advantage in that it can generate possible conclusions using minimum data [68]. Other methods can also be implemented for the analysis of obstacles, such as interpretive structural modeling (ISM) and the analytical network process (ANP). In opposition to ISM, the DEMATEL approach helps with the determination of contextual relationships from among the obstacles and stress the impact of their interrelationships. In addition, the proportion of obstacles, having cause–effect relationships, is determined as well [69]. Furthermore, DEMATEL appears to be more useful in the evaluation of complex systems than ISM when analyzing cause–effect interrelationships among subsystems [62]. The DEMATEL approach not only converts interdependency associations into a cause–effect cluster using equations but also discovers the critical obstacles of an intricate system of obstacles with the help of an impact association map [64]. Scholars can better use the DEMATEL approach determining the causal interrelationships among the obstacles from within the framework of an issue and explain their conceptual interrelationships, compared with other modeling methods such as ANP, TISM, and GTMA [70]. The steps of the DEMATEL analysis process are presented in Figure 2.
Step 1: Generating the direct-relation matrix (A)
Following the preparation of a list of specific obstacles or issues, the DEMATEL scale should be applied, and all textile sector experts should make pairwise comparisons among the obstacles. Any specific options and assessments regarding the causality between all obstacles are obtained for each expert’s initial-relation matrix utilizing Equation (1). Table 4 illustrates the interrelationships among the determined obstacles using a scale ranging from 1 to 5, indicating no influence, very low influence, low influence, high influence, and very high influence. The same approach is used to determine each expert’s opinion as shown in Equation (1). Indeed, there are p experts, where p = {1, 2, 3, …, n}. The equation [71] is as follows:
A p = 0 a 12 a 13 .... a 1 ( n 1 ) a 1 n a 21 0 a 23 .... a 2 ( n 1 ) a 2 n .... .... .... .... .... .... .... .... .... .... .... .... a ( n 1 ) 1 a ( n 1 ) 2 a ( n 1 ) 3 .... 0 a ( n 1 ) n a n 1 a n 2 a n 3 .... a n ( n 1 ) 0
Here, Ap determines each expert interaction option between obstacles.
Step 2: Normalizing the direct-relation matrix (X)
This procedure computes the normalized direct-relation matrix (X) using the formula in the equation below:
X = k × A
Here   k = 1 m a x 1 i n j = 1 n a i j ,   i ,   j = 1 ,   2 ,   . ,   n
Here, ‘A’ as per Equation (1) denotes the initial-relation matrix; the average of aij for all experts is denoted by ‘k’, and ‘X’ denotes the normalized direct-relation matrix. It should be noted that each column in the normalized direct-relation matrix must be less than one for the DEMATEL solution to be feasible [72].
Step 3: Develop the total-relation matrix (T)
The total-relation matrix (T) is calculated in Step 3 using the following equation:
T = X(I − X)−1
Here, the identity matrix is denoted by ‘I’; ‘T’ indicates the total-relation matrix, and ‘X’ means normalizing matrix, as per Equation (2).
Stage 4: Producing a causal diagram
The sum of the number of rows (D) and the sum of the number of columns (R) is computed using the total-relation matrix ‘T’. The following equations are used to measure D and R in the ‘T’ matrix [73]:
( D ) = [ d ij ] n × 1   = [ j = 1 n d i j ] n × 1
( R ) = [ r ij ] 1 × n   = [ i = 1 n r i j ] 1 × n
In matrix ‘T’, all elements of the averages are applied and separated via the number of elements presented in the matrix to determine the threshold value (α). The following equation is used to do this calculation:
α = j = 1 n i = 1 n r i j n 2
Here, n2 represents the total number of elements in the total relation matrix ‘T’. Since the number of obstacles equals n, the total number of elements in matrix T = n × n = n2 [74].
The linking network is generated through plotting the values of (D + R) and (R − C). The y-axis of this network represents the values of (D − R), while the x-axis represents the values of (D + R). The interactions of the major obstacles are described using a driven network. The ‘T’ matrix values meeting or exceeding α are considered to have a strong degree of influence. The influential strength matrix is used to create the directed network.

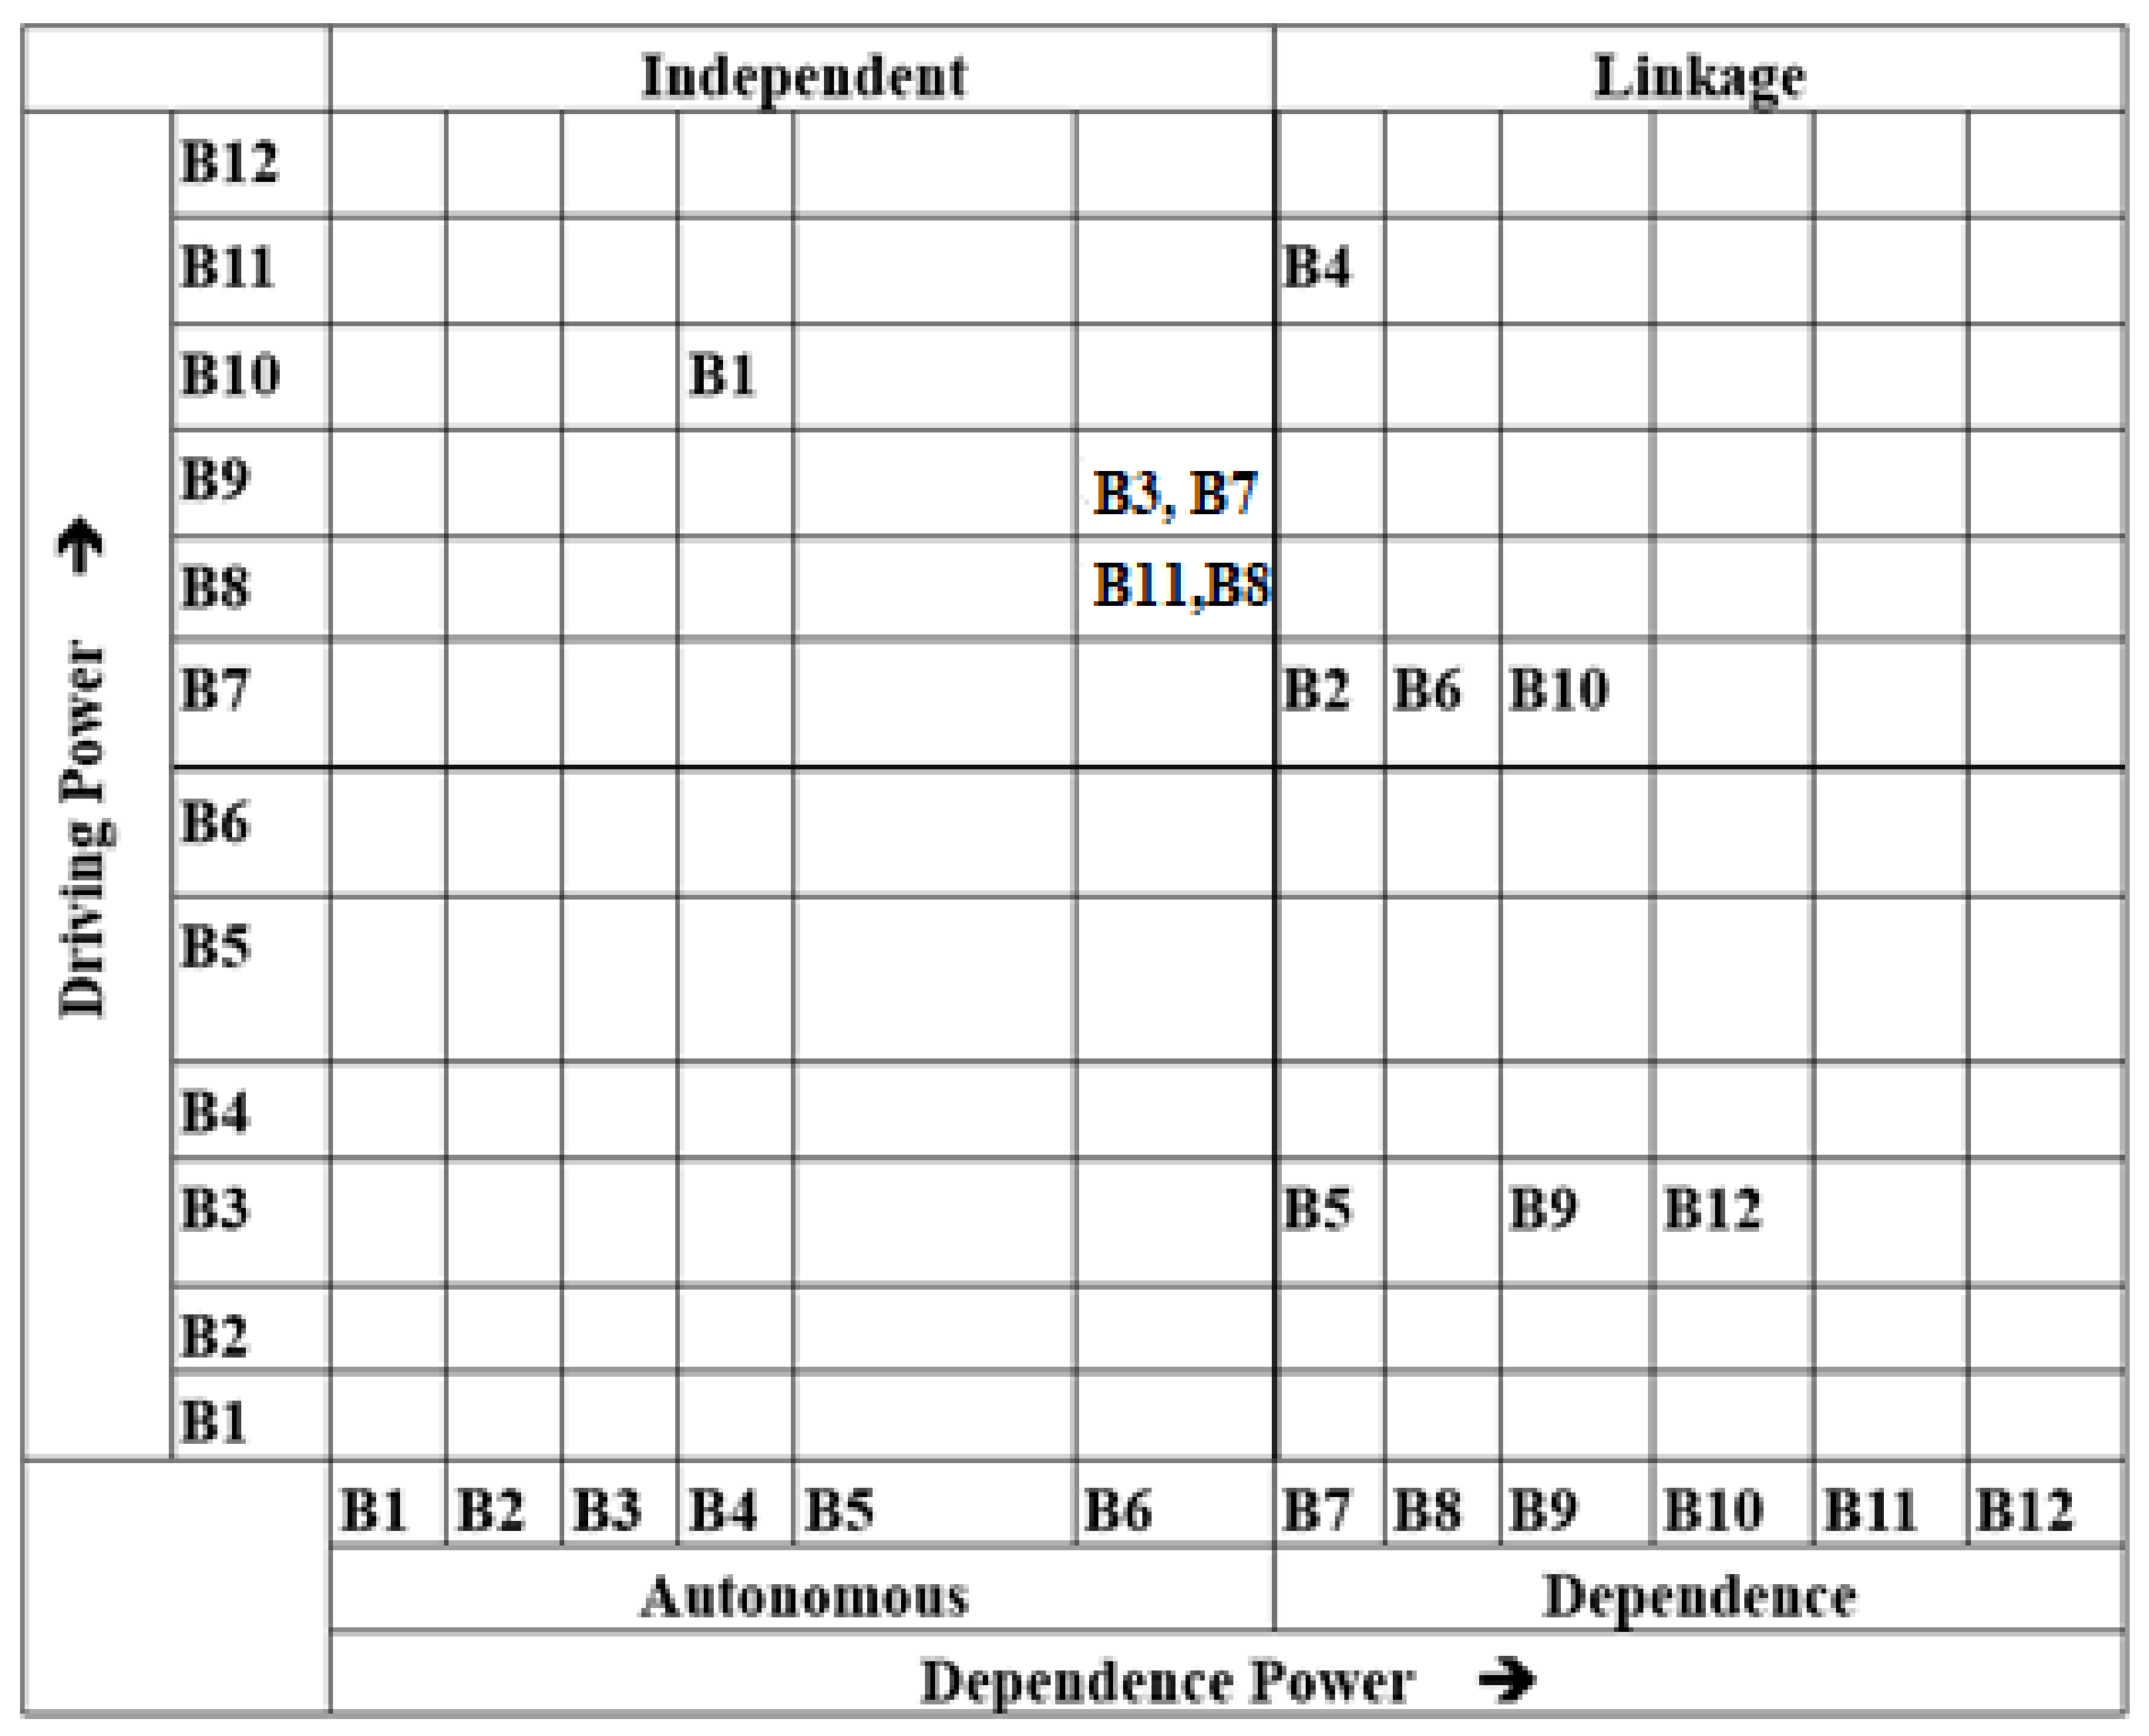
3.3. MICMAC Analysis

The ISM results were further generalized using cross-impact matrix multiplication applied to classification (MICMAC) analysis to calculate the driving and dependence power, which were then converted into a MICMAC matrix. MICMAC analysis investigates hidden and indirect relationships and determines how much one aspect influences another in the classification of obstacles [75]. Chen et al. [76] noted that the primary aim of the MICMAC approach is to determine the driving power and dependence power of all obstacles. Dependence power refers to the degree to which others influence one obstacle, while driving power is defined as the degree of influence that one obstacle exerts on another. A MICMAC matrix was developed according to the driving and dependence powers of the CE adoption obstacles. In the matrix, the vertical axis stands for the extent of the driving power, and the horizontal axis symbolizes the extent of the dependence power. The following four clusters were classification of the CE adoption obstacles:
  • An autonomous cluster consisting of obstacles with low driving power and low dependence power.
  • A dependent cluster consisting of obstacles with low driving power and high dependence power.
  • A linkage cluster consisting of obstacles with high driving power and high dependence power.
  • An independent cluster consisting of obstacles with high driving power and low dependence power.

4. Interpretations of Results and Discussion

4.1. FDM Result

After the extensive review of the CE adoption obstacles in textile company SCs, the authors performed the FDM to identify critical obstacles. Dong and Huo used FDM [77] to gather studies and compile facts on different obstacles using the in-depth queries of expert practitioners [78]. This method requires only a few samples, and a pool of between 10 to 30 experts is considered to be of an acceptable size [68]. In addition, the results of this method are likely to be objective and reasonable because every opinion of experts is regarded and integrated to achieve general agreement for in-group decisions [79]. We received 68.7% valid responses among all the participants. Twelve key obstacles were determined based on the FDM threshold value (0.65) result, as shown in Table 5.

4.2. ISM Result

In addition, after finalizing the critical obstacles based on the FDM result, ISM was adopted to analyze the interrelationships between CE adoption obstacles in the textile SC. The results from the ISM approach were as follows:

4.2.1. SSIM

Questionnaire data collection is a major technique in current research. To formulate an SSIM for the critical obstacles, the set questionnaire used four symbols to indicate the direction of the relationships among the obstacles (i and j). The symbols were as follows:
  • V: barrier i leads to barrier j;
  • A: barrier j leads to barrier i;
  • X: barrier i leads to barrier j and vice versa; and
  • O: barrier i and j are not related.
This study prepared a set of questionnaires and sent them to experts in the textile sector. Subsequently, snowball sampling was used to collect the experts’ opinions about the relevance of the obstacles. Of the samples received, 86% were valid samples. A profile of the experts is shown in Table 3, and the SSIM in terms of the obstacles is shown in Table 3.
The SSIM matrix (Table 6) provided the interactions among the CE adoption obstacles. For instance, Table 6 demonstrates that the relationship between B1 and B2 was represented by ‘O’ in the SSIM, indicating there was no relationship between both obstacles. The ‘V’ in the SSIM indicated that B10 influenced B12. Finally, the ‘X’ association in the SSIM indicated that B9 and B12 influenced each other in the matrix.

4.2.2. Reachability Matrix

Next, the SSIM was transformed into a reachability matrix by substituting 1 and 0 for the symbols V, A, X and O. The substitution rules for 1 and 0 are shown in Table 7.
Table 8 shows the initial reachability matrix as a result of this conversion rule as shown in Table 7. For example, the relationship between the obstacles B6 and B10 is ‘X’ in the SSIM. That relationship in the converted cell (B6, B10) is ‘1′ and ‘1′ is noted in cell (B10, B6). In addition, the relationship of obstacles B4 and B12 is ‘V’; this is converted in reachability matrix as ‘1′ in cell (B4, B12), and cell (B12, B4) is ‘0′. Furthermore, the final reachability matrix, in which the dependence and driving power of all obstacles were disclosed, was displayed in Table 9. Afterwards, the transitivity rule could be used to convert the initial reachability matrix to the final reachability matrix [80]. The rule of transitivity was exploited to describe the contextual relationship among obstacles as follows: if obstacle A can influence obstacle B, and obstacle B can influence obstacle C, then obstacle A will inevitably influence obstacle C, as presented in Table 9.

4.2.3. Level Partitions

Next, we performed level partitioning based on the final reachability matrix. The reachability set for a selected obstacle comprised the obstacle itself and the other obstacles that could influence it, while the antecedent set comprised the obstacle itself and other obstacles that could help to achieve it [81]. Afterwards, the crossing of these two sets was computed for the entire group of obstacles. This process continued until all obstacles were settled. In the present analysis, three iterations were performed to determine the degree of each obstacle. The process results are shown in Table 10.
According to in Table 10, B5 (obstructive laws and regulations), B9 (unclear vision with regard to CE), and B12 (making the right decision to implement CE in the most efficient way) were ranked at Level 1. Level 2 contained B2 (Environmentally-friendly materials’ high cost for purchasing), B6 (Reuse and recovery products challenge design), and B10 (insufficient internalization of external costs). Finally, B1 (Consumer lacking knowledge and awareness of reuse/recycling), B3 (Lack of successful business models and frameworks for CE implementation), B4 (Lack of support for a supply and demand network), B7 (limited availability and quality of recycling material), B8 (Lack of an information exchange system between different stakeholders), and B11 (high short-term costs and low short-term economic benefits) were ranked at Level III. The recognized levels aided in constructing the directed graph and the final ISM model.

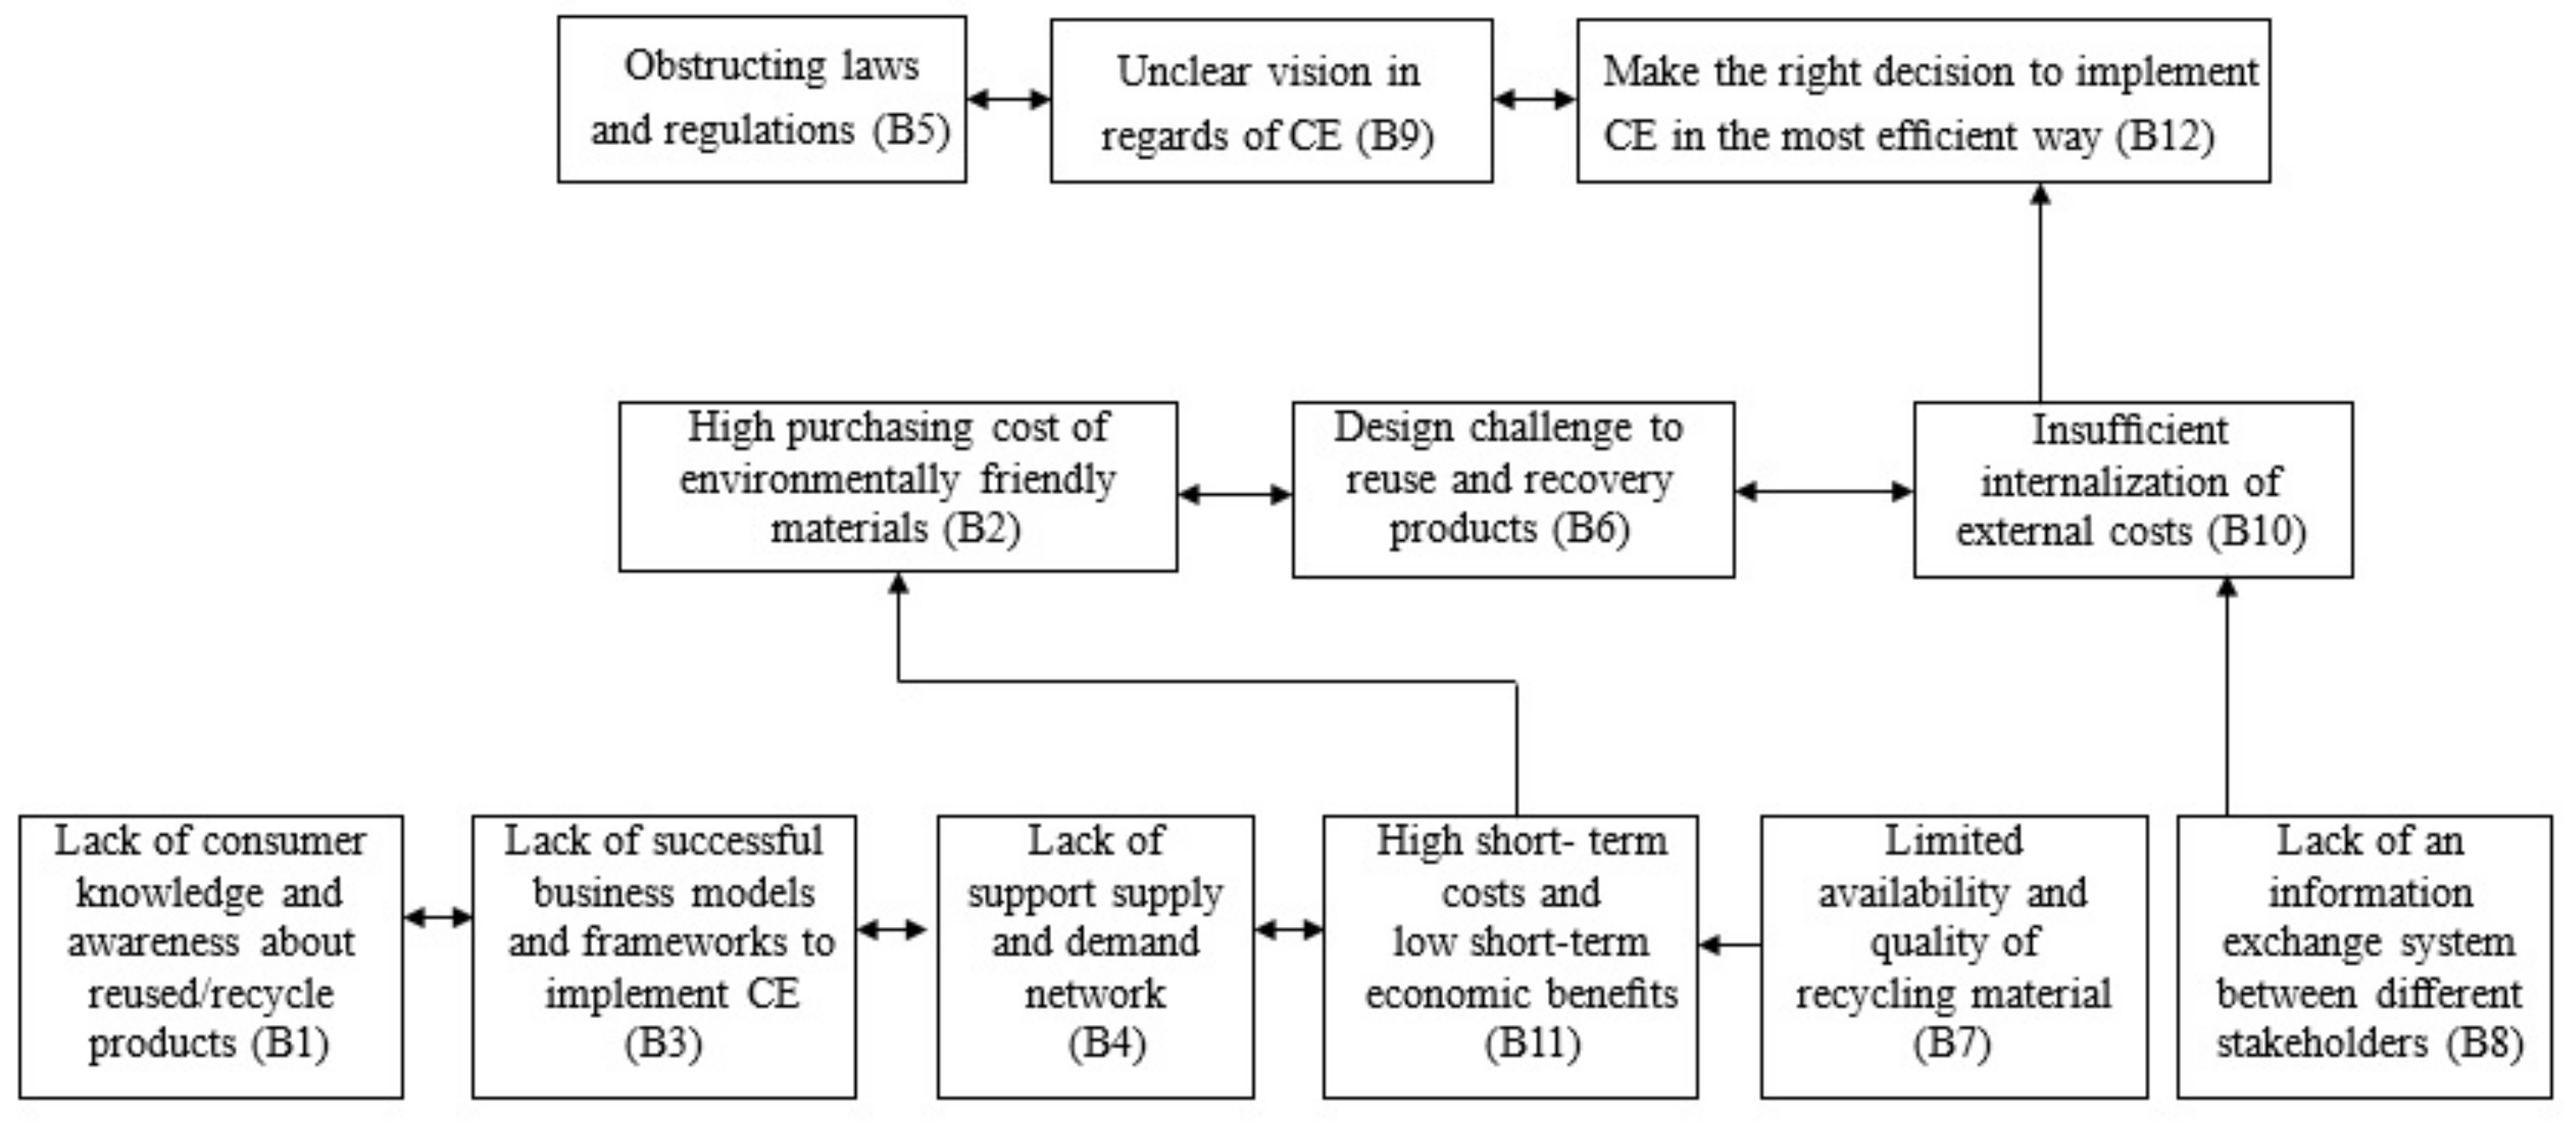
4.2.4. Construction of ISM

The ISM network of the interrelationships among the CE adoption obstacles in the textile SC is shown in Figure 3. In addition, a hierarchical network was developed based on the three derived levels. B8, B11, B7, B4, B3 and B1 were found to be the most critical obstacles for adopting CE in the textile SC based on the ISM network. These obstacles were determined at the ISM network’s bottom level and were considered high or critical enablers among all CE adoption obstacles. Consequently, the bottom level obstacles led to the next level obstacles, which were B10, B6 and B2. The middle-level obstacles influencing the next level obstacles were B12, B9 and B5.

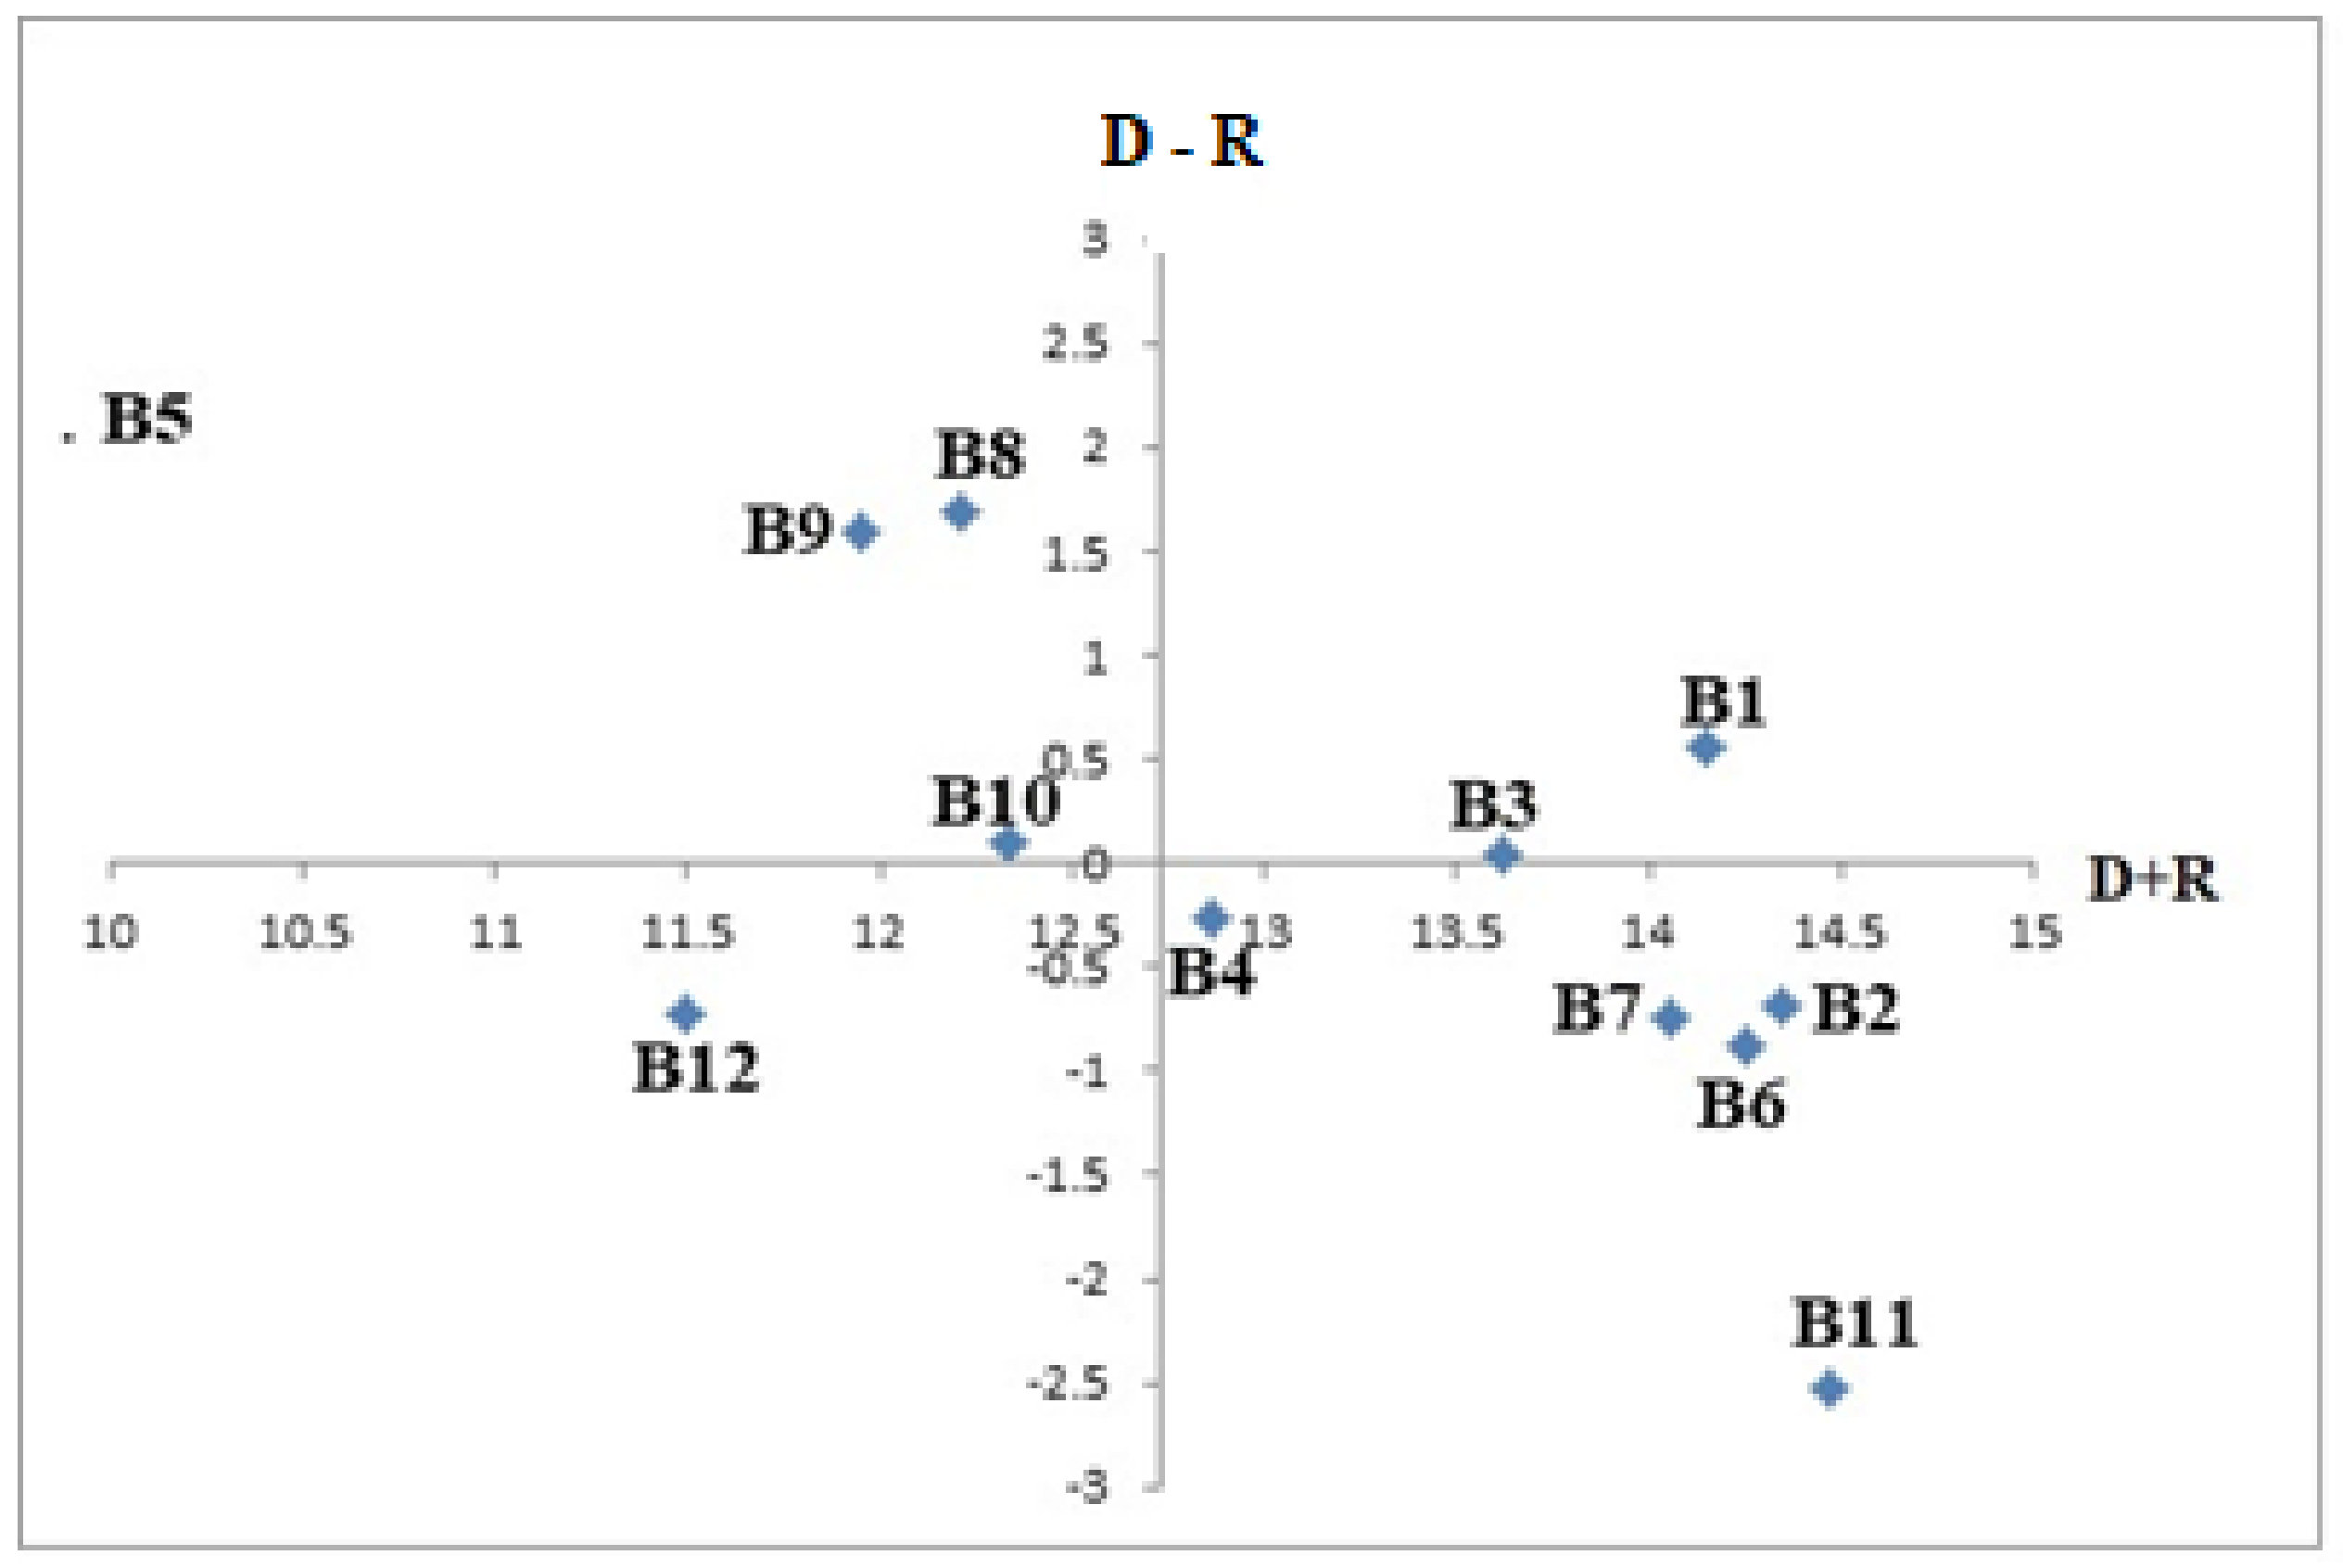
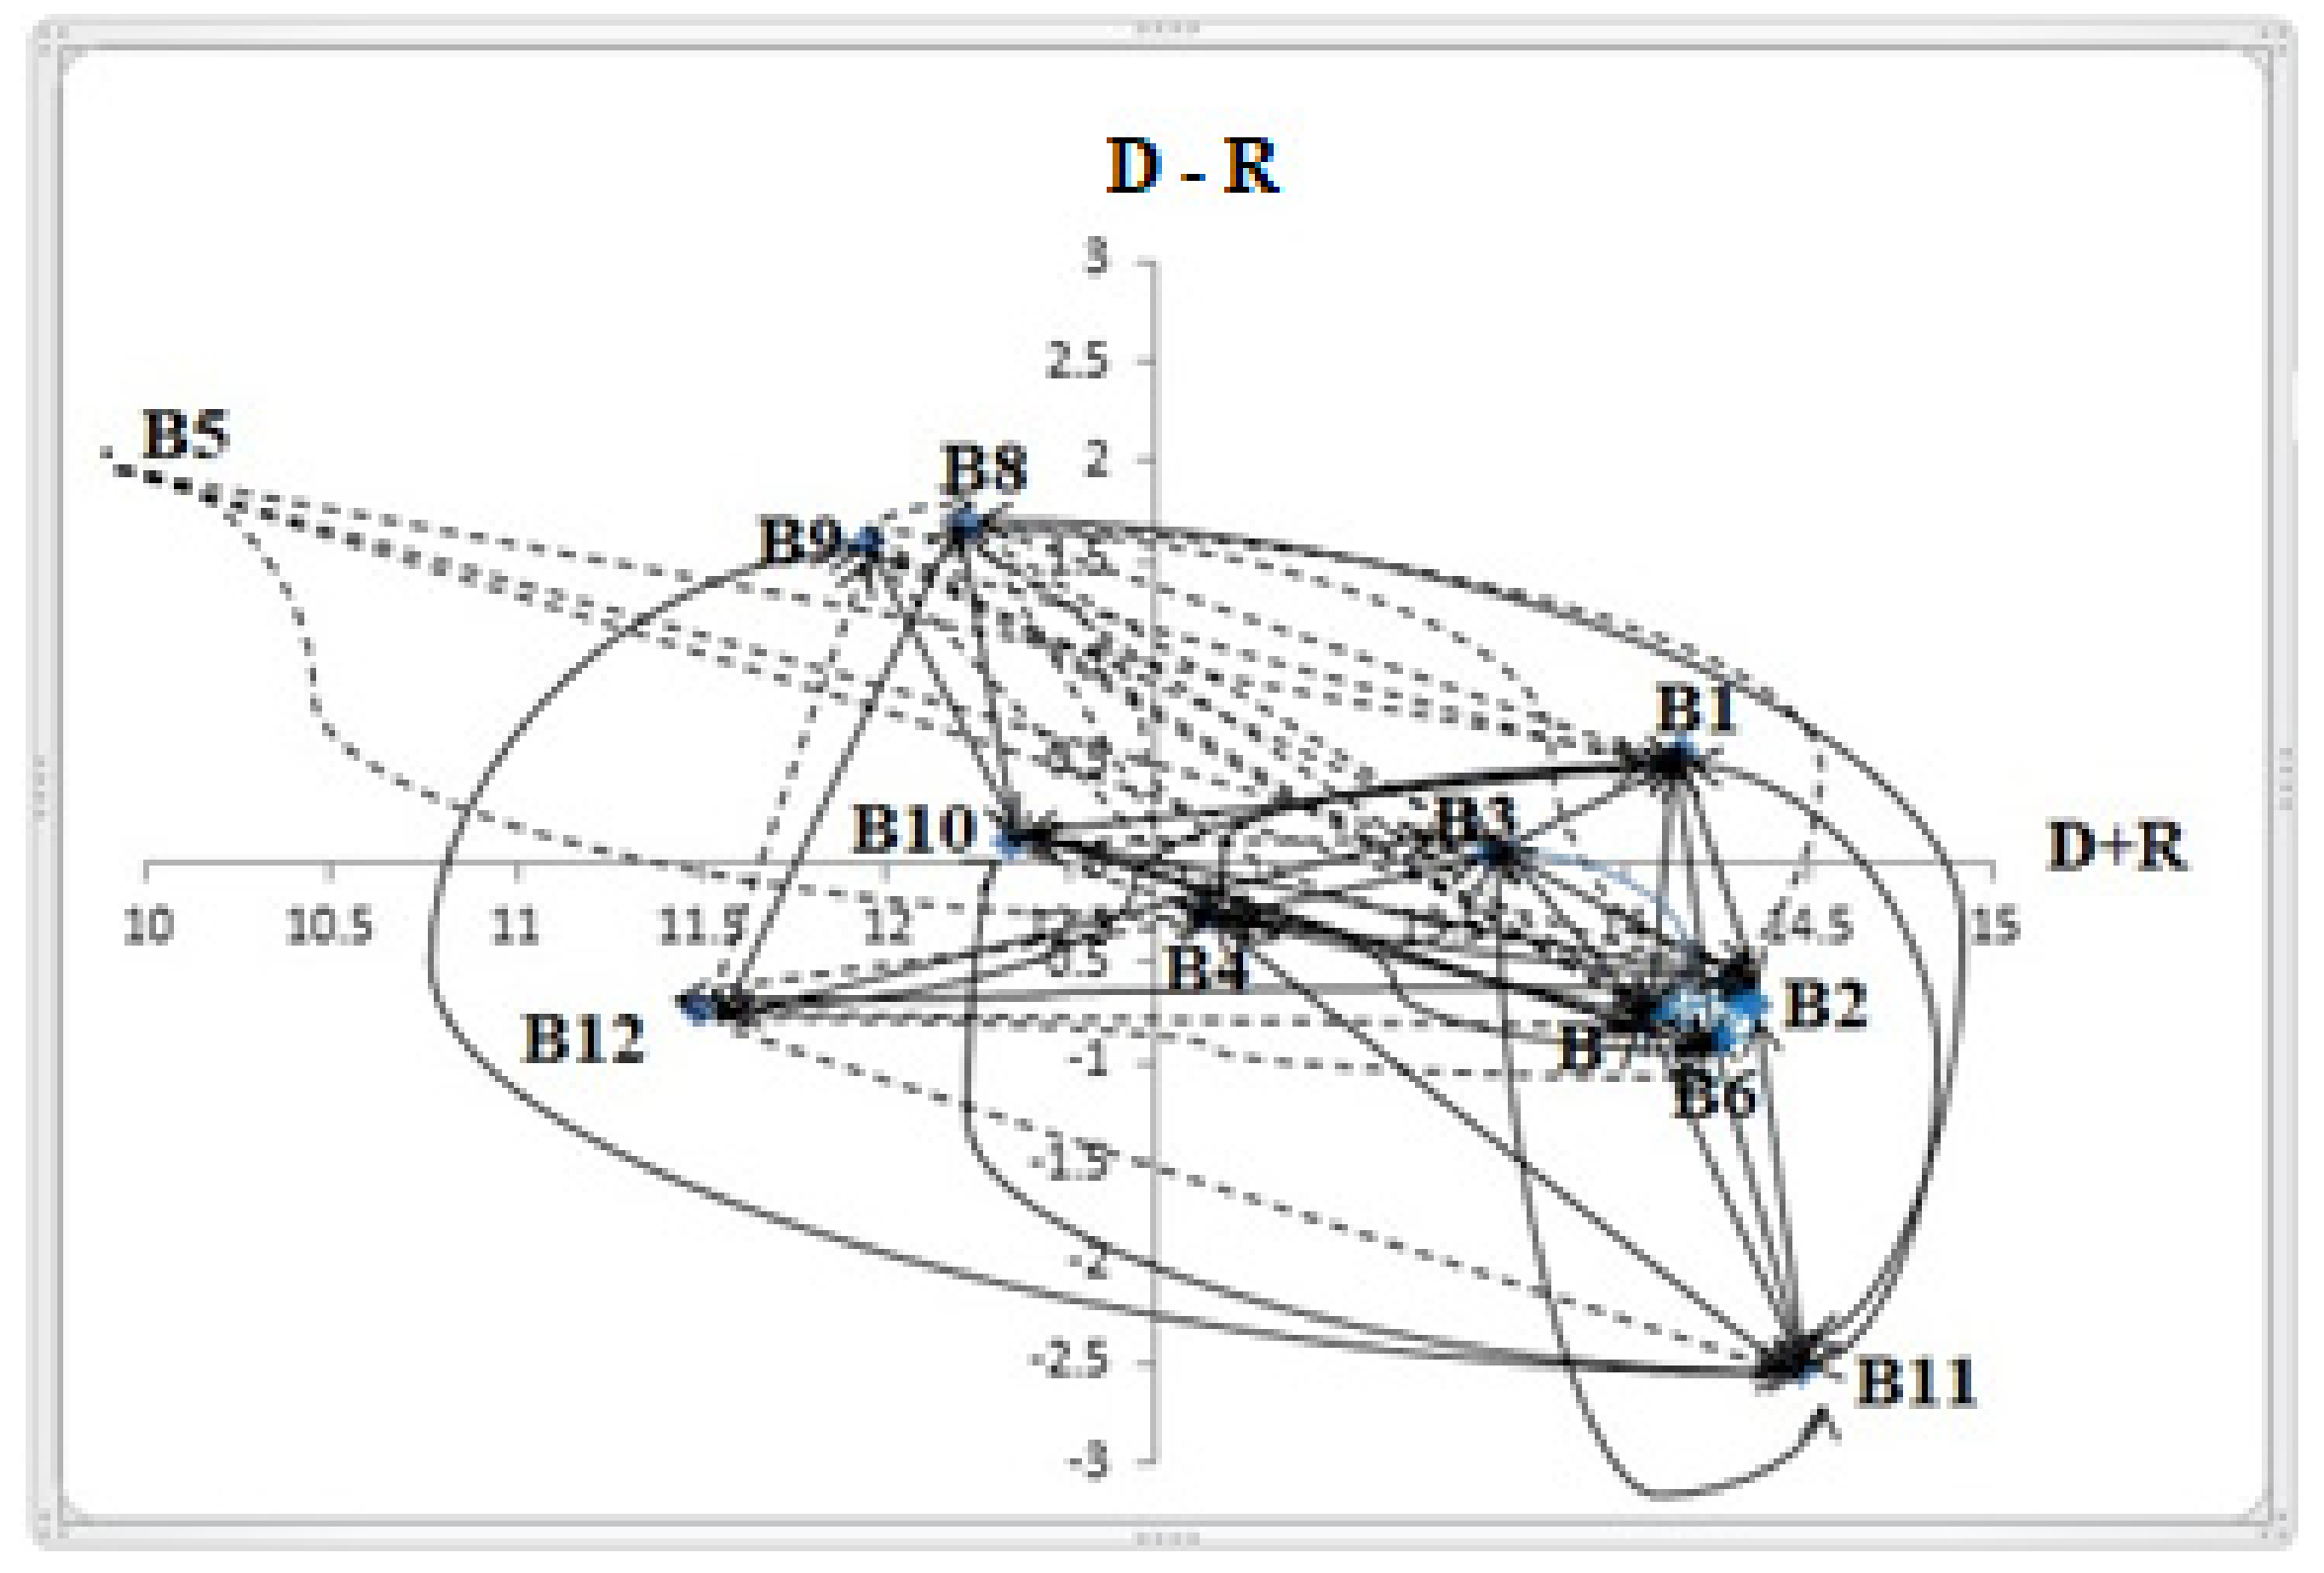
4.3. DEMATEL Results

In addition, DEMATEL was performed to analyze the causal relationship among the identified obstacles to the adoption of CE in the textile sector SC. The results of the DEMATEL analysis were as follows:
Step 1: Generating the direct-relation matrix (A).
Equation (1) was used to compute the direct-relation matrix (A) using the experts’ choices. The experts were asked to give their opinions on a scale ranging from 0 to 5 (representing no influence, very low influence, low influence, high influence, and very high influence). For example, there was no influence between B2 and B5; therefore, the value ‘0′ was placed in cell (9, 3); however, there was a very high influence between B4 and B11 so the value ‘4′ was placed in cell (3, 5). The direct-relation matrix (A) result is shown in Table 11.
Step 2: Normalizing the direct-relation matrix (X)
Equation (2) was used to measure the normalization of the direct-relation matrix (X) in Step 2. The average of the expert’s inputs was represented by Equation (2). Table 12 shows the direct-relationship matrix result.
Step 3: Calculate the total-relation matrix (T)
The utilization of Equation 6 was to calculate the total-relation matrix, as presented in Table 13. The “T” matrix was generated by discarding the early significant relationships in order to attain the noteworthy connections. Therefore, Equation (7) was used to calculate the threshold value (α). The significant and insignificant obstacles were determined accordingly on the threshold value [82]. The α value was determined as 0.54; therefore, the values of the obstacles in the T matrix that were less than the α value (0.54) were ignored for further processing. In Table 13, the obstacle values equal to or greater than the threshold value are noted with an asterisk.
In addition, the calculated sum of Column (D), sum of row (R) values by using Equations (5) and (6) are displayed in Table 14. The degree of relational influence between each critical obstacle, respectively, is the confirmation of results of D and R. Then, the authors formulated (D + R) and (D − R) values as presented in Table 8. For instance, B2 consists of the calculations of (D + R) and (D − R), which are 7.52 and −0.69 separately.
Step 4: Produce a causal diagram
As seen in Table 8, any obstacle with a D-R value less than zero was classified into the efficient group, while one with a D-R value greater than zero was classified into the cause group. Six critical obstacles were found as the result of the D-R obtained in Table 14, namely, B1, B3, B5, B8, B9, and B10 were found to be causal factors. Obstacle B8 was recognized as having a very significantly high positive impact among all obstacles, attesting to the fact that the exchange of information among stakeholders plays an essential role in CE adoption in the textile supply chain. In addition, obstacle B9 came out as one of the key obstacles to the adoption of CE. Furthermore, obstacles B2, B4, B6, B7, B11, and B12 were determined to belong in the effect group. These were influenced by cause group obstacles and affected the CE adoption in the textile supply chain. A lack of support for a supply and demand network (B4) was closer to the center among the effect group, showing that the determined causal group obstacles and obstacles influence it less. A lack of successful business models and frameworks for CE implementation (B3) was established as having a lower significance weight. In addition, Table 14 shows the calculated averages of D, R, (D + R), and (D − R). The diagram of the causal net is shown in Figure 4. Finally, a directed graph for the obstacles was generated to illustrate the relationship, shown in Figure 4, after comparison with the benchmark value, displayed in Table 13.
As shown in Table 13, we also established a causal interaction map of the CE adoption obstacles in the textile SC based on the ‘T’ matrix result. In addition, the interrelationships among the obstacles to the adoption of CE are shown in Figure 4. The double arrow-headed lines indicate the causal interrelationships between each pair of obstacles, while the single dotted-arrow lines stand for less influence among each obstacle, as shown in Figure 5. It has been found that ‘Consumer lacking the knowledge and awareness of reuse/recycling’ (B1)’ is having robust interactions with all remaining obstacles. Additionally, a lack of successful business models and frameworks for CE implementation (B3), and a lack of support for a supply and demand network (B4) were further related to having a high influence or more interactions with other obstacles adopting CE in the textile SC. Therefore, textile firms need to control these critical obstacles to CE adoption in their textile SC.

4.4. MICMAC Result

This study developed a MICMAC matrix, in which the vertical axis represented the extent of the driving power and the horizontal axis represented the extent of the dependence power. This matrix divided the obstacles into four clusters: an autonomous cluster, a dependent cluster, a driver cluster, and a linkage cluster [83]. The MICMAC matrix diagram is illustrated in Figure 6. As shown, there were no obstacles identified in the autonomous cluster; B5, B12 and B9 were determined to belong in the dependent cluster; B2, B6 and B10 were located in the linkage cluster, and B4 acted as a transient obstacle between the linkage and independent clusters. Moreover, B1, B3, B7, B8 and B11 were located in the independent cluster. Obstacles with extremely high driving power were noted as critical obstacles and fell into the independence cluster and linkage cluster. As per the present study’s MICMAC matrix results, B1, B3, B7, B11, B8 and B4 were identified as critical CE adoption obstacles in the textile supply chain.

5. Conclusions

The current research investigated the interrelationships between the critical obstacles to CE adoption in textile supply chains, which were analyzed utilizing the ISM and DEMATEL approach. Existing research has emphasized different methodologies and have resulted in confusion. ISM and DEMATEL share several similar characteristics since they both analyze the interrelationships among multiple criteria. Therefore, the present study determined the interrelationships of the CE adoption obstacles through the ISM and DEMATEL methods. In addition, MICMAC analysis was adopted to classify the clusters of the CE adoption obstacles in the textile SC. Per the ISM analysis results, obstacles B1, B3, B4, B7, B8 and B11 were identified as critical obstacles to the adoption of CE in the textile sector. In addition, obstacles B1 and B3 were found to be key factors in the DEMATEL analysis. The MICMAC matrix (Figure 6) confirmed that there were autonomous obstacles which could also be considered important, but they possessed low interaction in terms of their driving and dependence power, meaning these obstacles did not influence other obstacles. Therefore, we concluded that these obstacles, such as B1, B3 and B7, were the most influential obstacles to CE adoption in the supply chain of textile firms.
Moreover, those obstacles are that they have strong driving power as per the ISM method, and that they have been identified as the key influence obstacles to the CE adoption in the textile sector [84]. In addition, these obstacles can also be found in recent research studies [15,44,85,86]. Khan et al. [87] found that B12 and B4 are low value and come under the effect group in the DEMATEL analysis. The present research extended these findings and compared the different outcomes to provide effective critical obstacles to the textile firms. This study result could offer first-hand knowledge to textile firms or managers to effectively achieve CE implementation objectives. Furthermore, the interdependency of these obstacles suggested that textile firm managers and CE strategy developers need to concentrate on high driving power and cause group CE adoption obstacles when implementing CE strategies in their supply chain. As per the current literature, B1 and B3 have been cited as the key barriers to adopt CE in the textile SC [56,71,88]. In addition, B2, B6, and B10 were found to be linkage factors that are influenced by high driving power obstacles while linked to high dependence power obstacles. Moreover, B2, B6, and B8 are the effect group obstacles as per the DEMATEL results. In addition, this obstacle illustrates the highest levels of driving and dependence power in MICMAC analysis, and the ISM network emphasizes its effect on other obstacles.

5.1. Managerial Implications

Textile firm managers and experts must extract sufficient measures to subdue CE adoption obstacles, which should bring about CE adoption strategies in the textile supply chains. Obstacles B1 and B3 were the common critical factors among all in the ISM and DEMATEL analysis results. In addition, B12 was found to be a minor obstacle for adopting CE in the textile SC. The autonomous obstacles did not influence the CE adoption in textile firms. The present study did not categorize any obstacles as autonomous, meaning all the obstacles affected CE adoption in the textile SC. According to our findings, Taiwan’s textile firms must handle the independent obstacles, namely, consumer lack of knowledge and awareness about reuse/recycling (B1), and lack of successful business models and frameworks to implement CE (B3), which are the major obstacles requiring targeted, prompt, and focused attention according to the customers’ needs and operations within the supply chain. In addition, government subsidies to sustainable textile producers will not only ameliorate but also act as a panacea to obstacles that have been brought out in previous studies [89]. Moreover, if the middle-level obstacles in ISM, the effect group in DEMATEL, and the joining obstacles are handled appropriately, the dependent and cause group obstacles in the respective analyses can be controlled automatically by their nature. There will be a positive change in the implementation of CE strategies in the textile SC.
The textile sector’s recent success stories have occurred in well-developed counties, which have implemented innovative strategies to overcome obstacles, and which have government policies for recycling methods and the reuse of resources that could be duplicated in the textile sector too. This will assist both promoting sustainable products and building trust among the customers [90]. Due to the contemporary need for the ecosystem conservation, raising awareness and creating sustainable products will almost absolutely bring about an increasing demand for such products. This will bring about a more stable CE adoption in the textile SC as well as a reduced fear of financial loss. Thus, customers will be effectively informed and encouraged adopting sustainable textile production. Several policies for bringing about CE adoption in the textile SC and its customers should also be motivated. Since textile production generates hazardous wastes, suitable waste management strategies must be developed to ensure efficient and cost-effective waste disposal. The implementation of an environmental management system (EMS) in textile firms can also aid in determining the trade-offs among environmental issues, business models, and frameworks for the adoption of CE [91]. Concerns over employee health and safety, as well as the adoption of adequate economic welfare policies, will create the foundation for CE adoption in the textile SC [92].
Customer participation should be incorporated from the start of the SC, and all supply chain partners and stakeholders should be responsible for CE adoption in their SC. The adoption of CE practices by manufacturers has been vital to the achievement of CE practices. Textile firms can improve their CE adoption campaigns by working closely with consumers and SC stakeholders [93]. CE adoption requires customer support, government commitment, and support for upgrading business frameworks to develop the infrastructure of the textile sector [94,95], and encouragement to implement CE, friendly information-sharing strategies, and novel business models are essential [96]. Product features must be shared with the customers as well all levels of staff, so as to not only meet customer demands but also achieve effective implementation of CE. Customers and employees must be properly trained and educated [97]. These recommendations support the present study’s findings regarding the lack of customer awareness and the advantages associated with CE adoption in the textile sector. Furthermore, it is necessary to design effective performance assessment systems to measure the CE policies adopted by customers and textile firms [98]. Finally, based on the above findings and recommendations, this study concluded that textile firms must effectively inform and motivate customers to adopt sustainable textile production. Various policies causing CE adoption in the textile SC and its customers must be encouraged as well.

5.2. Limitations and Future Scope of the Study

The present study has a number of limitations, including the lack of expert inputs in calculating the dependence power and driving power of adopting CE obstacles in the ISM analysis, and developing the cause–effect map. As a result, the established hierarchical network was dependent on these inputs. Furthermore, the number of experts in the group was limited. The findings of this study could also differ depending on the expert’s specific knowledge and experience in the textile sector. Thus, it is suggested that the number of experts in the group be increased in future research. Moreover, the computation of such model is still complicated and can not be easily understood or implemented by non-mathematical managers or the research sector. In the future, this calculation can be computerized to increase accuracy while reducing both time and possibility of errors. Another limitation of the present study was that CE implementation could lead to successful CE adoption in textile firms. Adopting CE in the textile SC should be subjected to critical obstacles and their interactions. Since no significant weights for the CE adoption obstacles were obtained in the current study, it is recommended that a combination of these approaches, such as decision-making trials, an evaluation laboratory-based analytical network process (DANP), and the analytic network process (ANP), be exploited to prioritize the weights. Future research may look at the systematic relationships among obstacles through the structural equation modeling (SEM) tool. It should be noted that CE adoption obstacles or essential analyses in other sectors and countries were not included in this study because it primarily focused on the textile sector in Taiwan.

Author Contributions

Conceptualization: W.-K.C. methodology: W.-K.C. and C.-T.L.; data curation: W.-K.C.; data collection and analysis: W.-K.C.; writing—original draft preparation: W.-K.C. and C.-T.L.; review and editing: W.-K.C. and C.-T.L.; validation: C.-T.L. Both authors have read and agreed to the published version of the manuscript.

Funding

This research was funded by the Ministry of Science and Technology of Taiwan grant number MOST 108-2221-E-212-001-MY2.

Institutional Review Board Statement

Not applicable.

Informed Consent Statement

Informed consent was obtained from all subjects involved in the study.

Data Availability Statement

Not applicable.

Conflicts of Interest

The authors declare no conflict of interest.

References

  1. Rovanto, I.K.; Bask, A. Systemic circular business model application at the company, supply chain and society levels—A view into circular economy native and adopter companies. Bus. Strategy Environ. 2021, 30, 1153–1173. [Google Scholar] [CrossRef]
  2. Ucal, M.; Xydis, G. Multidirectional relationship between energy resources, climate changes and sustainable development: Technoeconomic analysis. Sustain. Cities Soc. 2020, 60, 102210. [Google Scholar] [CrossRef]
  3. Kartadjumena, E.; Rodgers, W. Executive compensation, sustainability, climate, environmental concerns, and company financial performance: Evidence from Indonesian commercial banks. Sustainability 2019, 11, 1673. [Google Scholar] [CrossRef] [Green Version]
  4. Kazancoglu, I.; Sagnak, M.; Kumar Mangla, S.; Kazancoglu, Y. Circular economy and the policy: A framework for improving the corporate environmental management in supply chains. Bus. Strategy Environ. 2021, 30, 590–608. [Google Scholar] [CrossRef]
  5. Sehnem, S.; Jabbour, C.J.C.; Pereira, S.C.F.; de Sousa Jabbour, A.B.L. Improving sustainable supply chains performance through operational excellence: Circular economy approach. Resour. Conserv. Recycl. 2019, 149, 236–248. [Google Scholar] [CrossRef]
  6. Atkar, A.; Pabba, M.; Sekhar, S.C.; Sridhar, S. Current limitations and challenges in the global textile sector. In Fundamentals of Natural Fibres and Textiles; Woodhead Publishing: Sawston, UK, 2021. [Google Scholar] [CrossRef]
  7. Dahlbo, H.; Aalto, K.; Eskelinen, H.; Salmenperä, H. Increasing textile circulation—consequences and requirements. Sustain. Prod. Consum. 2017, 9, 44–57. [Google Scholar] [CrossRef]
  8. Makvandi, P.; Iftekhar, S.; Pizzetti, F.; Zarepour, A.; Zare, E.N.; Ashrafizadeh, M.; Rossi, F. Functionalization of polymers and nanomaterials for water treatment, food packaging, textile and biomedical applications: A review. Environ. Chem. Lett. 2020, 1–29. [Google Scholar] [CrossRef]
  9. Chen, L.; Caro, F.; Corbett, C.J.; Ding, X. Estimating the environmental and economic impacts of widespread adoption of potential technology solutions to reduce water use and pollution: Application to China’s textile industry. Environ. Impact Assess. Rev. 2019, 79, 106293. [Google Scholar] [CrossRef] [Green Version]
  10. Patwa, N.; Sivarajah, U.; Seetharaman, A.; Sarkar, S.; Maiti, K.; Hingorani, K. Towards a circular economy: An emerging economies context. J. Bus. Res. 2021, 122, 725–735. [Google Scholar] [CrossRef]
  11. Colucci, M.; Vecchi, A. Close the loop: Evidence on the implementation of the circular economy from the Italian fashion industry. Bus. Strategy Environ. 2021, 30, 856–873. [Google Scholar] [CrossRef]
  12. Chen, T.L.; Kim, H.; Pan, S.Y.; Tseng, P.C.; Lin, Y.P.; Chiang, P.C. Implementation of green chemistry principles in circular economy system towards sustainable development goals: Challenges and perspectives. Sci. Total Environ. 2020, 716, 136998. [Google Scholar] [CrossRef]
  13. Balaji, A.B.; Rudd, C.; Liu, X. Recycled Carbon Fibers (rCF) in Automobiles: Towards Circular Economy. Mater. Circ. Econ. 2020, 2, 1–8. [Google Scholar] [CrossRef]
  14. Saha, K.; Dey, P.K.; Papagiannaki, E. Implementing circular economy in the textile and clothing industry. Bus. Strategy Environ. 2020. [Google Scholar] [CrossRef]
  15. Bressanelli, G.; Perona, M.; Saccani, N. Challenges in supply chain redesign for the Circular Economy: A literature review and a multiple case study. Int. J. Prod. Res. 2019, 57, 7395–7422. [Google Scholar] [CrossRef] [Green Version]
  16. Kazancoglu, I.; Kazancoglu, Y.; Yarimoglu, E.; Kahraman, A. A conceptual framework for barriers of circular supply chains for sustainability in the textile industry. Sustain. Dev. 2020, 28, 1477–1492. [Google Scholar] [CrossRef]
  17. Dahooie, J.H.; Dehshiri, S.J.H.; Banaitis, A.; Binkytė-Vėlienė, A. Identifying and prioritizing cost reduction solutions in the supply chain by integrating value engineering and gray multi-criteria decision-making. Technol. Econ. Dev. Econ. 2020, 26, 1311–1338. [Google Scholar] [CrossRef]
  18. Nika, C.E.; Vasilaki, V.; Expósito, A.; Katsou, E. Water Cycle and Circular Economy: Developing a Circularity Assessment Framework for Complex Water Systems. Water Res. 2020, 187, 116423. [Google Scholar] [CrossRef]
  19. Roca, J.B.; O’Sullivan, E. Seeking coherence between barriers to manufacturing technology adoption and innovation policy. Int. J. Prod. Econ. 2020, 230, 107818. [Google Scholar] [CrossRef]
  20. Baydar, G.; Ciliz, N.; Mammadov, A. Life cycle assessment of cotton textile products in Turkey. Resour. Conserv. Recycl. 2015, 104, 213–223. [Google Scholar] [CrossRef]
  21. Leal Filho, W.; Ellams, D.; Han, S.; Tyler, D.; Boiten, V.J.; Paço, A.; Balogun, A.L. A review of the socio-economic advantages of textile recycling. J. Clean. Prod. 2019, 218, 10–20. [Google Scholar] [CrossRef]
  22. Anastasiades, K.; Blom, J.; Buyle, M.; Audenaert, A. Translating the circular economy to bridge construction: Lessons learnt from a critical literature review. Renew. Sustain. Energy Rev. 2020, 117, 109522. [Google Scholar] [CrossRef]
  23. Kumar, A.; Dixit, G. An analysis of barriers affecting the implementation of e-waste management practices in India: A novel ISM-DEMATEL approach. Sustain. Prod. Consum. 2018, 14, 36–52. [Google Scholar] [CrossRef]
  24. Zhu, J.; Fan, C.; Shi, H.; Shi, L. Efforts for a circular economy in China: A comprehensive review of policies. J. Ind. Ecol. 2019, 23, 110–118. [Google Scholar] [CrossRef] [Green Version]
  25. Gusmerotti, N.M.; Testa, F.; Corsini, F.; Pretner, G.; Iraldo, F. Drivers and approaches to the circular economy in manufacturing firms. J. Clean. Prod. 2019, 230, 314–327. [Google Scholar] [CrossRef]
  26. Agrawal, R.; Wankhede, V.A.; Kumar, A.; Luthra, S. Analysing the roadblocks of circular economy adoption in the automobile sector: Reducing waste and environmental perspectives. Bus. Strategy Environ. 2021, 30, 1051–1066. [Google Scholar] [CrossRef]
  27. Mahpour, A. Prioritizing barriers to adopt circular economy in construction and demolition waste management. Resour. Conserv. Recycl. 2018, 134, 216–227. [Google Scholar] [CrossRef]
  28. Govindan, K. Sustainable consumption and production in the food supply chain: A conceptual framework. Int. J. Prod. Econ. 2018, 195, 419–431. [Google Scholar] [CrossRef]
  29. Pal, R. Sustainable design and business models in textile and fashion industry. In Sustainability in the Textile Industry; Springer: Singapore, 2017; pp. 109–138. [Google Scholar] [CrossRef] [Green Version]
  30. Donner, M.; Verniquet, A.; Broeze, J.; Kayser, K.; De Vries, H. Critical success and risk factors for circular business models valorising agricultural waste and by-products. Resour. Conserv. Recycl. 2021, 165, 105236. [Google Scholar] [CrossRef]
  31. Fortuna, L.M.; Diyamandoglu, V. Optimization of greenhouse gas emissions in second-hand consumer product recovery through reuse platforms. Waste Manag. 2017, 66, 178–189. [Google Scholar] [CrossRef] [PubMed]
  32. Mangla, S.K.; Luthra, S.; Mishra, N.; Singh, A.; Rana, N.P.; Dora, M.; Dwivedi, Y. Barriers to effective circular supply chain management in a developing country context. Prod. Plan. Control 2018, 29, 551–569. [Google Scholar] [CrossRef] [Green Version]
  33. Jain, S. Doodlage: Reinventing Fashion Via Sustainable Design. In Sustainability in the Textile and Apparel Industries; Springer: Cham, Switzerland, 2020; pp. 241–261. [Google Scholar] [CrossRef]
  34. Oelze, N. Sustainable supply chain management implementation–enablers and barriers in the textile industry. Sustainability 2017, 9, 1435. [Google Scholar] [CrossRef] [Green Version]
  35. Ranta, V.; Aarikka-Stenroos, L.; Mäkinen, S.J. Creating value in the circular economy: A structured multiple-case analysis of business models. J. Clean. Prod. 2018, 201, 988–1000. [Google Scholar] [CrossRef]
  36. Donner, M.; Gohier, R.; de Vries, H. A new circular business model typology for creating value from agro-waste. Sci. Total Environ. 2020, 716, 137065. [Google Scholar] [CrossRef] [PubMed]
  37. Ferasso, M.; Beliaeva, T.; Kraus, S.; Clauss, T.; Ribeiro-Soriano, D. Circular economy business models: The state of research and avenues ahead. Bus. Strategy Environ. 2020, 29, 3006–3024. [Google Scholar] [CrossRef]
  38. Ghisetti, C.; Montresor, S. On the adoption of circular economy practices by small and medium-size enterprises (SMEs): Does “financing-as-usual” still matter? J. Evol. Econ. 2020, 30, 559–586. [Google Scholar] [CrossRef]
  39. Tanco, M.; Kalemkerian, F.; Santos, J. Main challenges involved in the adoption of sustainable manufacturing in Uruguayan small and medium sized companies. J. Clean. Prod. 2021, 293, 126139. [Google Scholar] [CrossRef]
  40. Oghazi, P.; Mostaghel, R. Circular business model challenges and lessons learned—An industrial perspective. Sustainability 2018, 10, 739. [Google Scholar] [CrossRef] [Green Version]
  41. Vermunt, D.A.; Negro, S.O.; Verweij, P.A.; Kuppens, D.V.; Hekkert, M.P. Exploring barriers to implementing different circular business models. J. Clean. Prod. 2019, 222, 891–902. [Google Scholar] [CrossRef] [Green Version]
  42. Franco, M.A. Circular economy at the micro level: A dynamic view of incumbents’ struggles and challenges in the textile industry. J. Clean. Prod. 2017, 168, 833–845. [Google Scholar] [CrossRef]
  43. Shi, J.; Zhou, J.; Zhu, Q. Barriers of a closed-loop cartridge remanufacturing supply chain for urban waste recovery governance in China. J. Clean. Prod. 2019, 212, 1544–1553. [Google Scholar] [CrossRef]
  44. Abdullah, M.M.B.; Uli, J.; Tari, J.J. The importance of soft factors for quality improvement and organisational performance. Int. J. Product. Qual. Manag. 2009, 4, 366–382. [Google Scholar] [CrossRef]
  45. Fonseca, L.M.; Domingues, J.P.; Pereira, M.T.; Martins, F.F.; Zimon, D. Assessment of circular economy within Portuguese organizations. Sustainability 2018, 10, 2521. [Google Scholar] [CrossRef] [Green Version]
  46. Lian, J.W.; Yen, D.C. To buy or not to buy experience goods online: Perspective of innovation adoption barriers. Comput. Hum. Behav. 2013, 29, 665–672. [Google Scholar] [CrossRef]
  47. Mura, M.; Longo, M.; Zanni, S. Circular economy in Italian SMEs: A multi-method study. J. Clean. Prod. 2020, 245, 118821. [Google Scholar] [CrossRef]
  48. Camacho-Otero, J.; Boks, C.; Pettersen, I.N. Consumption in the circular economy: A literature review. Sustainability 2018, 10, 2758. [Google Scholar] [CrossRef] [Green Version]
  49. Tura, N.; Hanski, J.; Ahola, T.; Ståhle, M.; Piiparinen, S.; Valkokari, P. Unlocking circular business: A framework of barriers and drivers. J. Clean. Prod. 2019, 212, 90–98. [Google Scholar] [CrossRef]
  50. Ozkan-Ozen, Y.D.; Kazancoglu, Y.; Mangla, S.K. Synchronized barriers for circular supply chains in industry 3.5/industry 4.0 transition for sustainable resource management. Resour. Conserv. Recycl. 2020, 161, 104986. [Google Scholar] [CrossRef]
  51. Gupta, H.; Kusi-Sarpong, S.; Rezaei, J. Barriers and overcoming strategies to supply chain sustainability innovation. Resour. Conserv. Recycl. 2020, 161, 104819. [Google Scholar] [CrossRef]
  52. Ranta, V.; Aarikka-Stenroos, L.; Ritala, P.; Mäkinen, S.J. Exploring institutional drivers and barriers of the circular economy: A cross-regional comparison of China, the US, and Europe. Resour. Conserv. Recycl. 2018, 135, 70–82. [Google Scholar] [CrossRef]
  53. Chen, W.K.; Nalluri, V.; Hung, H.C.; Chang, M.C.; Lin, C.T. Apply DEMATEL to Analyzing Key Barriers to Implementing the Circular Economy: An Application for the Textile Sector. Appl. Sci. 2021, 11, 3335. [Google Scholar] [CrossRef]
  54. Chen, W.K.; Nalluri, V.; Ma, S.; Lin, M.M.; Lin, C.T. An Exploration of the Critical Risk Factors in Sustainable Telecom Services: An Analysis of Indian Telecom Industries. Sustainability 2021, 13, 445. [Google Scholar] [CrossRef]
  55. Gardas, B.B.; Raut, R.D.; Narkhede, B. Determinants of sustainable supply chain management: A case study from the oil and gas supply chain. Sustain. Prod. Consum. 2019, 17, 241–253. [Google Scholar] [CrossRef]
  56. Chakraborty, S.; Chatterjee, P.; Prasad, K. An integrated DEMATEL–VIKOR method-based approach for cotton fibre selection and evaluation. J. Inst. Eng. (India) Ser. E 2018, 99, 63–73. [Google Scholar] [CrossRef]
  57. Dwivedi, A.; Madaan, J. A hybrid approach for modeling the key performance indicators of information facilitated product recovery system. J. Model. Manag. 2020. [Google Scholar] [CrossRef]
  58. Yin, S.H.; Wang, C.C.; Teng, L.Y.; Hsing, Y.M. Application of DEMATEL, ISM, and ANP for key success factor (KSF) complexity analysis in RD alliance. Sci. Res. Essays 2012, 7, 1872–1890. [Google Scholar] [CrossRef]
  59. Chauhan, A.; Singh, A.; Jharkharia, S. An interpretive structural modeling (ISM) and decision-making trail and evaluation laboratory (DEMATEL) method approach for the analysis of barriers of waste recycling in India. J. Air Waste Manag. Assoc. 2018, 68, 100–110. [Google Scholar] [CrossRef]
  60. Zhou, D.Q.; Zhang, L.; Li, H.W. A study of the system’s hierarchical structure through integration of DEMATEL and ISM. In Proceedings of the 2006 International Conference on Machine Learning and Cybernetics, Dalian, China, 13–16 August 2006; pp. 1449–1453. [Google Scholar] [CrossRef]
  61. Li, Y.; Diabat, A.; Lu, C.C. Leagile supplier selection in Chinese textile industries: A DEMATEL approach. Ann. Oper. Res. 2020, 287, 303–322. [Google Scholar] [CrossRef]
  62. Jain, V.; Raj, T. A hybrid approach using ISM and modified TOPSIS for the evaluation of flexibility in FMS. Int. J. Ind. Syst. Eng. 2015, 19, 389–406. [Google Scholar] [CrossRef]
  63. Digalwar, A.; Raut, R.D.; Yadav, V.S.; Narkhede, B.; Gardas, B.B.; Gotmare, A. Evaluation of critical constructs for measurement of sustainable supply chain practices in lean-agile firms of Indian origin: A hybrid ISM-ANP approach. Bus. Strategy Environ. 2020, 29, 1575–1596. [Google Scholar] [CrossRef]
  64. Li, F.; Wang, W.; Dubljevic, S.; Khan, F.; Xu, J.; Yi, J. Analysis on accident-causing factors of urban buried gas pipeline network by combining DEMATEL, ISM and BN methods. J. Loss Prev. Process Ind. 2019, 61, 49–57. [Google Scholar] [CrossRef]
  65. Padilla-Rivera, A.; do Carmo, B.B.T.; Arcese, G.; Merveille, N. Social circular economy indicators: Selection through fuzzy delphi method. Sustain. Prod. Consum. 2021, 26, 101–110. [Google Scholar] [CrossRef]
  66. Kannan, G.; Pokharel, S.; Kumar, P.S. A hybrid approach using ISM and fuzzy TOPSIS for the selection of reverse logistics provider. Resour. Conserv. Recycl. 2009, 54, 28–36. [Google Scholar] [CrossRef]
  67. Yazdi, M.; Khan, F.; Abbassi, R.; Rusli, R. Improved DEMATEL methodology for effective safety management decision-making. Saf. Sci. 2020, 127, 104705. [Google Scholar] [CrossRef]
  68. Yadegaridehkordi, E.; Hourmand, M.; Nilashi, M.; Shuib, L.; Ahani, A.; Ibrahim, O. Influence of big data adoption on manufacturing companies' performance: An integrated DEMATEL-ANFIS approach. Technol. Forecast. Soc. Chang. 2018, 137, 199–210. [Google Scholar] [CrossRef]
  69. Kamble, S.S.; Gunasekaran, A.; Sharma, R. Analysis of the driving and dependence power of barriers to adopt industry 4.0 in Indian manufacturing industry. Comput. Ind. 2018, 101, 107–119. [Google Scholar] [CrossRef]
  70. Jain, V.; Iqbal, M.; Madan, A.K. Preference Selection Index Approach as MADM Method for Ranking of FMS Flexibility. In Advances in Manufacturing and Industrial Engineering; Springer: Singapore, 2021; pp. 529–542. [Google Scholar] [CrossRef]
  71. Roy, J.; Adhikary, K.; Kar, S.; Pamucar, D. A rough strength relational DEMATEL model for analysing the key success factors of hospital service quality. Decis. Mak. Appl. Manag. Eng. 2018, 1, 121–142. [Google Scholar] [CrossRef]
  72. Liu, H.; Long, H.; Li, X. Identification of critical factors in construction and demolition waste recycling by the grey-DEMATEL approach: A Chinese perspective. Environ. Sci. Pollut. Res. 2020, 27, 8507–8525. [Google Scholar] [CrossRef]
  73. Nilashi, M.; Samad, S.; Manaf, A.A.; Ahmadi, H.; Rashid, T.A.; Munshi, A.; Ahmed, O.H. Factors influencing medical tourism adoption in Malaysia: A DEMATEL-Fuzzy TOPSIS approach. Comput. Ind. Eng. 2019, 137, 106005. [Google Scholar] [CrossRef]
  74. Pamučar, D.; Mihajlović, M.; Obradović, R.; Atanasković, P. Novel approach to group multi-criteria decision making based on interval rough numbers: Hybrid DEMATEL-ANP-MAIRCA model. Expert Syst. Appl. 2017, 88, 58–80. [Google Scholar] [CrossRef] [Green Version]
  75. Agarwal, R.; Shirke, A.; Panackal, N. Enablers of the Collective Bargaining in Industrial Relations: A Study of India’s Industrial Policies Through ISM and MICMAC Analysis. Indian J. Labour Econ. 2020, 63, 781–798. [Google Scholar] [CrossRef]
  76. Chen, W.K.; Nalluri, V.; Lin, M.L.; Lin, C.T. Identifying Decisive Socio-Political Sustainability Barriers in the Supply Chain of Banking Sector in India: Causality Analysis Using ISM and MICMAC. Mathematics 2021, 9, 240. [Google Scholar] [CrossRef]
  77. Dong, J.; Huo, H. Identification of financing barriers to energy efficiency in small and medium-sized enterprises by integrating the fuzzy delphi and fuzzy DEMATEL Approaches. Energies 2017, 10, 1172. [Google Scholar] [CrossRef] [Green Version]
  78. Regmi, K.; Jones, L. A systematic review of the factors–enablers and barriers–affecting e-learning in health sciences education. BMC Med. Educ. 2020, 20, 1–18. [Google Scholar] [CrossRef] [Green Version]
  79. Du, Z.J.; Yu, S.M.; Xu, X.H. Managing noncooperative behaviors in large-scale group decision-making: Integration of independent and supervised consensus-reaching models. Inf. Sci. 2020, 531, 119–138. [Google Scholar] [CrossRef]
  80. Scarpato, N.; Cilia, N.D.; Romano, M. Reachability matrix ontology: A cybersecurity ontology. Appl. Artif. Intell. 2019, 33, 643–655. [Google Scholar] [CrossRef]
  81. Abbas, H. Barriers to reverse logistics practices in pharmaceutical supply chains: An ISM approach. Int. J. Bus. Excell. 2018, 16, 47–60. [Google Scholar] [CrossRef]
  82. Raghuvanshi, J.; Agrawal, R.; Ghosh, P.K. Analysis of barriers to women entrepreneurship: The DEMATEL approach. J. Entrep. 2017, 26, 220–238. [Google Scholar] [CrossRef]
  83. Bamel, N.; Dhir, S.; Sushil, S. Inter-partner dynamics and joint venture competitiveness: A fuzzy TISM approach. Benchmarking Int. J. 2019. [Google Scholar] [CrossRef]
  84. Kumar, S.; Raut, R.D.; Nayal, K.; Kraus, S.; Yadav, V.S.; Narkhede, B.E. To identify industry 4.0 and circular economy adoption barriers in the agriculture supply chain by using ISM-ANP. J. Clean. Prod. 2021, 293, 126023. [Google Scholar] [CrossRef]
  85. Panigrahi, S.S.; Rao, N.S. A stakeholders’ perspective on barriers to adopt sustainable practices in MSME supply chain: Issues and challenges in the textile sector. Res. J. Text. Appar. 2018. [Google Scholar] [CrossRef]
  86. Rahman, M.; Billah, M.M.; Hack-Polay, D. What is hindering change? Anticipating the barriers to the adoption of enzyme-based textile processing in a developing country. Bus. Strategy Dev. 2019, 2, 137–147. [Google Scholar] [CrossRef]
  87. Khan, S.A.R.; Zkik, K.; Belhadi, A.; Kamble, S.S. Evaluating barriers and solutions for social sustainability adoption in multi-tier supply chains. Int. J. Prod. Res. 2021, 1–20. [Google Scholar] [CrossRef]
  88. da Silva, P.C.; de Oliveira Neto, G.C.; Correia, J.M.F.; Tucci, H.N.P. Evaluation of economic, environmental and operational performance of the adoption of cleaner production: Survey in large textile industries. J. Clean. Prod. 2021, 278, 123855. [Google Scholar] [CrossRef]
  89. Vafadarnikjoo, A.; Ahmadi, H.B.; Liou, J.J.; Botelho, T.; Chalvatzis, K. Analyzing blockchain adoption barriers in manufacturing supply chains by the neutrosophic analytic hierarchy process. Ann. Oper. Res. 2021, 1–28. [Google Scholar] [CrossRef]
  90. Itani, O.S.; Kassar, A.N.; Loureiro, S.M.C. Value get, value give: The relationships among perceived value, relationship quality, customer engagement, and value consciousness. Int. J. Hosp. Manag. 2019, 80, 78–90. [Google Scholar] [CrossRef]
  91. Collins, B.; Kumral, M. Environmental sustainability, decision-making, and management for mineral development in the Canadian Arctic. Int. J. Sustain. Dev. World Ecol. 2020, 27, 297–309. [Google Scholar] [CrossRef]
  92. Gallardo-Vázquez, D.; Lizcano-Álvarez, J.L. CSR-related competitiveness and legitimacy in MSMEs. Econ. Sociol. 2020, 13, 52–73. [Google Scholar] [CrossRef] [PubMed]
  93. Nathaniel, S.P. Environmental degradation in ASEAN: Assessing the criticality of natural resources abundance, economic growth and human capital. Environ. Sci. Pollut. Res. 2021, 1–13. [Google Scholar] [CrossRef]
  94. Foo, M.Y.; Kanapathy, K.; Zailani, S.; Shaharudin, M.R. Green purchasing capabilities, practices and institutional pressure. Manag. Environ. Qual. Int. J. 2019. [Google Scholar] [CrossRef]
  95. AlBar, A.M.; Hoque, M.R. Factors affecting the adoption of information and communication technology in small and medium enterprises: A perspective from rural Saudi Arabia. Inf. Technol. Dev. 2019, 25, 715–738. [Google Scholar] [CrossRef]
  96. Guo, Y.; Xia, X.; Zhang, S.; Zhang, D. Environmental regulation, government R&D funding and green technology innovation: Evidence from China provincial data. Sustainability 2018, 10, 940. [Google Scholar] [CrossRef] [Green Version]
  97. Niaki, M.K.; Torabi, S.A.; Nonino, F. Why manufacturers adopt additive manufacturing technologies: The role of sustainability. J. Clean. Prod. 2019, 222, 381–392. [Google Scholar] [CrossRef]
  98. Opoku, D.G.J.; Ayarkwa, J.; Agyekum, K. Barriers to environmental sustainability of construction projects. Smart Sustain. Built Environ. 2019, 8. [Google Scholar] [CrossRef]
Figure 1. Research flow of the present study.
Mathematics 09 01425 g001
Figure 2. DEMATEL analysis process.
Mathematics 09 01425 g002
Figure 3. ISM network for CE adoption obstacles.
Mathematics 09 01425 g003
Figure 4. Cause–effect diagram.
Mathematics 09 01425 g004
Figure 5. Causal inter relationships of CE obstacles.
Mathematics 09 01425 g005
Figure 6. Results of the MICMAC matric.
Mathematics 09 01425 g006
Table 1. The adoption of CE obstacles with sources.
Serial NumberObstacle NameBrief DescriptionReference
B1Consumer lacking sufficient knowledge and awareness of reuse/recyclingThis barrier indicates attitudes and knowledge of customer to recycling methods of fashion.[45,46,47,48,49]
B2Environmentally friendly materials cost high in purchasingThis barrier suggests the general public would approve, oblige, and take part in purchasing eco-friendly clothing.[44,46,50]
B3Lack of successful business models and frameworks for CE implementationThis barrier refers performance assessment of recycling and refurbishing is absence of guidelines and models.[45,49,50]
B4Lack of support for a supply and demand networkThis barrier indicates the measurement of the complexity throughout the SC (specifically in its logistical, financial, and legal aspects), which in turn affects the value chain of a product, process, or service. Thus, significant dynamic complexity and deep uncertainty would result because of the need of closing traditional SC loop.[43,44,45,51]
B5Obstructing laws and regulations This barrier suggests the authorities performs impeding and unsupportive laws and regulations of waste management.[45,46,47,48,49,50,51]
B6Reuse and recovery products challenge designThis barrier refers to problems about product quality containing recycled materials in circulation or refurbished products being dealt by the firms.[42,44,45,46,47,48,49,50]
B7Limited availability and quality of recycling materialThis barrier contains technological limitations, such as tracking recycled materials, maintaining the product quality made from recovered materials, designing reused and recovered products, and ensuring a safe return to the biosphere.[42,45,48,52]
B8Lack of an information exchange system between different stakeholdersThis barrier indicates the part of information in exploiting CE at optimal efficiently, and lacking an information exchange system between different stakeholders.[44,49,50,51]
B9Unclear vision in regards of CEThis barrier suggests insufficient in standardization, recycling policies, and managing wastes which break down leading in recycling of a high-quality, unclear vision regarding CE.[48]
B10Insufficient internalization of external costsThis barrier is defined as limited funding for circular business models, insufficient internalization of external costs, difficulties in establishing correct product prices, high upfront investment costs, high short-term costs but low short-term economic benefits, limited availability and quality of recycled materials, high cost of environmentally friendly materials, and increasing production costs.[50,51,52]
B11High short-term costs and low short-term economic benefitsThis barrier refers to the circular products affordability being undermined when the virgin materials price is much less than that of eco-friendly materials and when the manufacturing circular products costs are increasing. Textile recycling is restricted to applications of low-value since the substantial variation in the composition of different types of fibers, dyestuffs, and chemicals used in finishing.[46,48,51]
B12Make the right decision to implement CE in the most efficient wayThis barrier indicates decisions requiring new maintainable production and close partnerships are vital in developing the process of technical solutions, considering the requirement to communicate with industry stakeholders regarding these strategies.[42,47,53]
Table 2. Profile of experts.
Industry CategoryFirm Employee SizeWork Experience in Textile Sector (Years)Work Experience in Current Company (Years)
Fabric Mills3<1014<106<106
Yarn Spinning Mills3101–300411–15011–151
Finishing of Textiles3301–500116–20616–207
Non-woven Fabrics Mills4501–10006>2010>208
Textile products Manufacturing5>10007----
Wearing Apparel and Clothing Accessories Manufacturing4------
Table 3. ISM and DEMATEL applications in the supply chain and textile sector.
Serial NumberMethodPurpose of StudySourceApplication, Country
1ISMTo identify determinants and analyze the interrelationships among those for the sustainable supply chain management.[55]Oil and gas sector, Denmark
2DEMATELTo identify and model critical success factors for SCs’ sustainability initiatives.[52]Cotton industry, China
3DEMATELAnalyze essential barriers to implement CE.[53]Textile sector, Taiwan
4ISM and DE-MATELTo identify and analyze the elements of supply chain management (SCM) and their significant barriers.[60]Manufacturing industries, India
5DEMATEL an ANPTo identify and risk assessment model of supplier selection. [61]Textile sector, China
6ISM-TOPSISTo identify factors and circular economy adoption factors’ supply chain management.[62]Manufacturing sector, India
7ISM an ANPTo evaluate critical constructs for the measurement of sustainable supply chain practices.[63]Lean-agile firms, India
Table 4. The correspondence of DEMATEL Scale.
Linguistic TermsNo InfluenceVery Low InfluenceLow InfluenceHigh InfluenceVery High Influence
Numerical value01234
Table 5. The finalized critical obstacles based on FDM result.
ObstaclesFDM Threshold Value at 0.65
B10.66
B20.68
B30.65
B40.65
B50.69
B60.66
B70.68
B80.65
B90.67
B100.69
B110.68
B120.66
Table 6. Structural self-interaction matrix (SSIM).
ObstaclesB1B2B3B4B5B6B7B8B9B10B11B12
B1-OOOOOXOOOOO
B2--OOOXOOOOAO
B3---XOOOOOOOO
B4----OOXOOOXV
B5-----OOOOOOX
B6------OOOXOO
B7-------OOOVO
B8--------OVOO
B9---------OOX
B10----------OV
B11-----------O
B12------------
Table 7. Conversation rule for transferring SSIM to reachability matrix.
(i, j) Values in SSIMTransfer Values in Reachability Matrix
(i, j)(j, i)
V10
A01
X11
O00
Table 8. Initial reachability matrix.
ObstaclesB1B2B3B4B5B6B7B8B9B10B11B12
B1100000100000
B2010001000000
B3001100000000
B4001100100011
B5000010000001
B6010001000100
B7100100100010
B8000000010100
B9000000001001
B10000001000101
B11010100000010
B12000010001001
Table 9. Final reachability matrix.
ObstaclesB1B2B3B4B5B6B7B8B9B10B11B12Driving Power
B111 *1 *1 *1 *1 *101 *1 *01 *10
B201001 *11 *01 *1 *1 *07
B31 *1 *1101 *001 *1 *1 *1 *9
B41 *1 *1101 *11 *1 *1 *1111
B50000100100013
B6011 *1 *1 *11 *001007
B7100101 *11 *1 *1 *11 *9
B8001 *01 *01 *11 *11 *1 *8
B900001 *00010013
B1001 *1 *1 *0101 *01017
B11010101 *01 *1 *1 *11 *8
B120000100010013
Dependence Power476778669961085
* indicating the relationship of transitivity.
Table 10. Level partition for obstacles.
ObstaclesReachability SetAntecedent SetIntersection SetLevel
11,3,4,7,111,3,4,7,111,3,4,7,11III
22,6,101–4,6–8,10,112,6,10II
31,3,4,7,111,3,4,7,111,3,4,7,11III
41,3,4,7,111,3,4,7,111,3,4,7,11III
55,9,123–125,9,12I
62,6,102,4,6–8,10,112,6,10II
71,3,4,7,111,3,4,7,111,3,4,7,11III
8888III
95,9,123–125,9,12I
102,6,102,6,8,10,112,6,10II
111,3,4,7,111,3,4,7,111,3,4,7,11III
125,9,121–125,9,12I
Table 11. Generating the direct-relation matrix (A).
ObstaclesB12B11B10B9B8B7B6B5B4B3B2B1
B1244234423330
B2343224403303
B3340334313034
B4243124320332
B5320102302223
B6242423003334
B7243120433342
B8333303323324
B9234033322324
B10240223303342
B11403222302342
B12032222203242
Table 12. Normalizing the direct-relation matrix (X).
ObstaclesB1B2B3B4B5B6B7B8B9B10B11B12 j = 1 n a i j
B100.080.080.080.050.110.110.080.050.110.110.0534
B20.0800.080.0800.110.110.050.050.080.110.0831
B30.110.0800.080.020.080.110.080.0800.110.0831
B40.050.080.0800.050.080.110.050.020.080.110.0529
B50.080.050.050.0500.080.0500.0200.050.0820
B60.110.080.080.08000.080.050.110.050.110.0530
B70.050.110.080.080.080.1100.050.020.080.110.0531
B80.110.050.080.080.050.080.0800.080.080.080.0832
B90.110.050.080.050.050.080.080.0800.110.080.0531
B100.050.110.080.0800.080.080.050.0500.110.0528
B110.050.110.080.0500.080.050.050.050.0800.1127
B120.050.110.050.0800.050.050.050.050.050.08024
Table 13. Calculate the total-relation matrix (T).
ObstaclesB1B2B3B4B5B6B7B8B9B10B11B12D
B10.57 *0.71 *0.65 *0.63 *0.270.74 *0.72 *0.520.490.62 *0.82 *0.57 *7.35
B20.60 *0.59 *0.61 *0.59 *0.200.69 *0.68 *0.470.460.56 *0.77 *0.55 *6.82
B30.63 *0.66 *0.53 *0.59 *0.230.67 *0.68 *0.490.480.480.77 *0.55 *6.82
B40.54 *0.62 *0.57 *0.470.240.62 *0.63 *0.430.400.520.72 *0.496.30
B50.420.430.390.380.130.460.420.260.290.310.480.394.41
B60.62 *0.65 *0.60 *0.58 *0.200.58 *0.65 *0.460.500.53 *0.75 *0.526.68
B70.57 *0.68 *0.59 *0.58 *0.270.68 *0.56 *0.450.420.54 *0.75 *0.526.65
B80.64 *0.65 *0.62 *0.60 *0.260.68 *0.67 *0.420.490.57 *0.75 *0.56 *6.95
B90.63 *0.64 *0.60 *0.56 *0.250.66 *0.65 *0.490.400.58 *0.74 *0.526.77
B100.53 *0.64 *0.56 *0.54 *0.180.62 *0.61 *0.430.420.430.71 *0.496.22
B110.510.62 *0.54 *0.500.170.59 *0.56 *0.410.410.500.58 *0.525.97
B120.470.57 *0.470.480.160.520.510.380.370.430.60 *0.375.38
R6.797.526.796.562.607.567.395.255.176.118.496.10-
Note: Threshold = * ≥ 0.54.
Table 14. Prominence and relation results obtained by using the DEMATEL method.
ObstaclesB1B2B3B4B5B6B7B8B9B10B11B12Average
D7.356.826.826.304.416.686.656.956.776.225.975.38-
R6.797.526.796.562.607.567.395.255.176.118.496.10-
D − R0.56−0.690.03−0.261.81−0.87−0.731.691.600.10−2.52−0.720
D + R14.1414.3413.6212.867.0214.2514.2512.2111.9512.3314.4711.4912.74
Publisher’s Note: MDPI stays neutral with regard to jurisdictional claims in published maps and institutional affiliations.

