Assessment of Students’ Achievements and Competencies in Mathematics Using CART and CART Ensembles and Bagging with Combined Model Improvement by MARS


Abstract
:1. Introduction
2. Materials and Methods
2.1. Methodology
- Construction of the integrated competency-based test for the final exam in mathematics;
- Construction, analysis and improvement of predictive models for evaluation of students’ achievements using ML techniques;
- Application of the models for determining the importance of the preparatory activities and individual components of the exam to its assessment and, in particular, the importance of the project.
2.2. Machine Learning Methods Used for Statistical Analyses
2.2.1. Classification and Regression Tree (CART)
2.2.2. CART Ensembles and Bagging (CART-EB)
2.2.3. Multivariate Adaptive Regression Splines (MARS)
2.2.4. Model Evaluation Metrics
3. Results
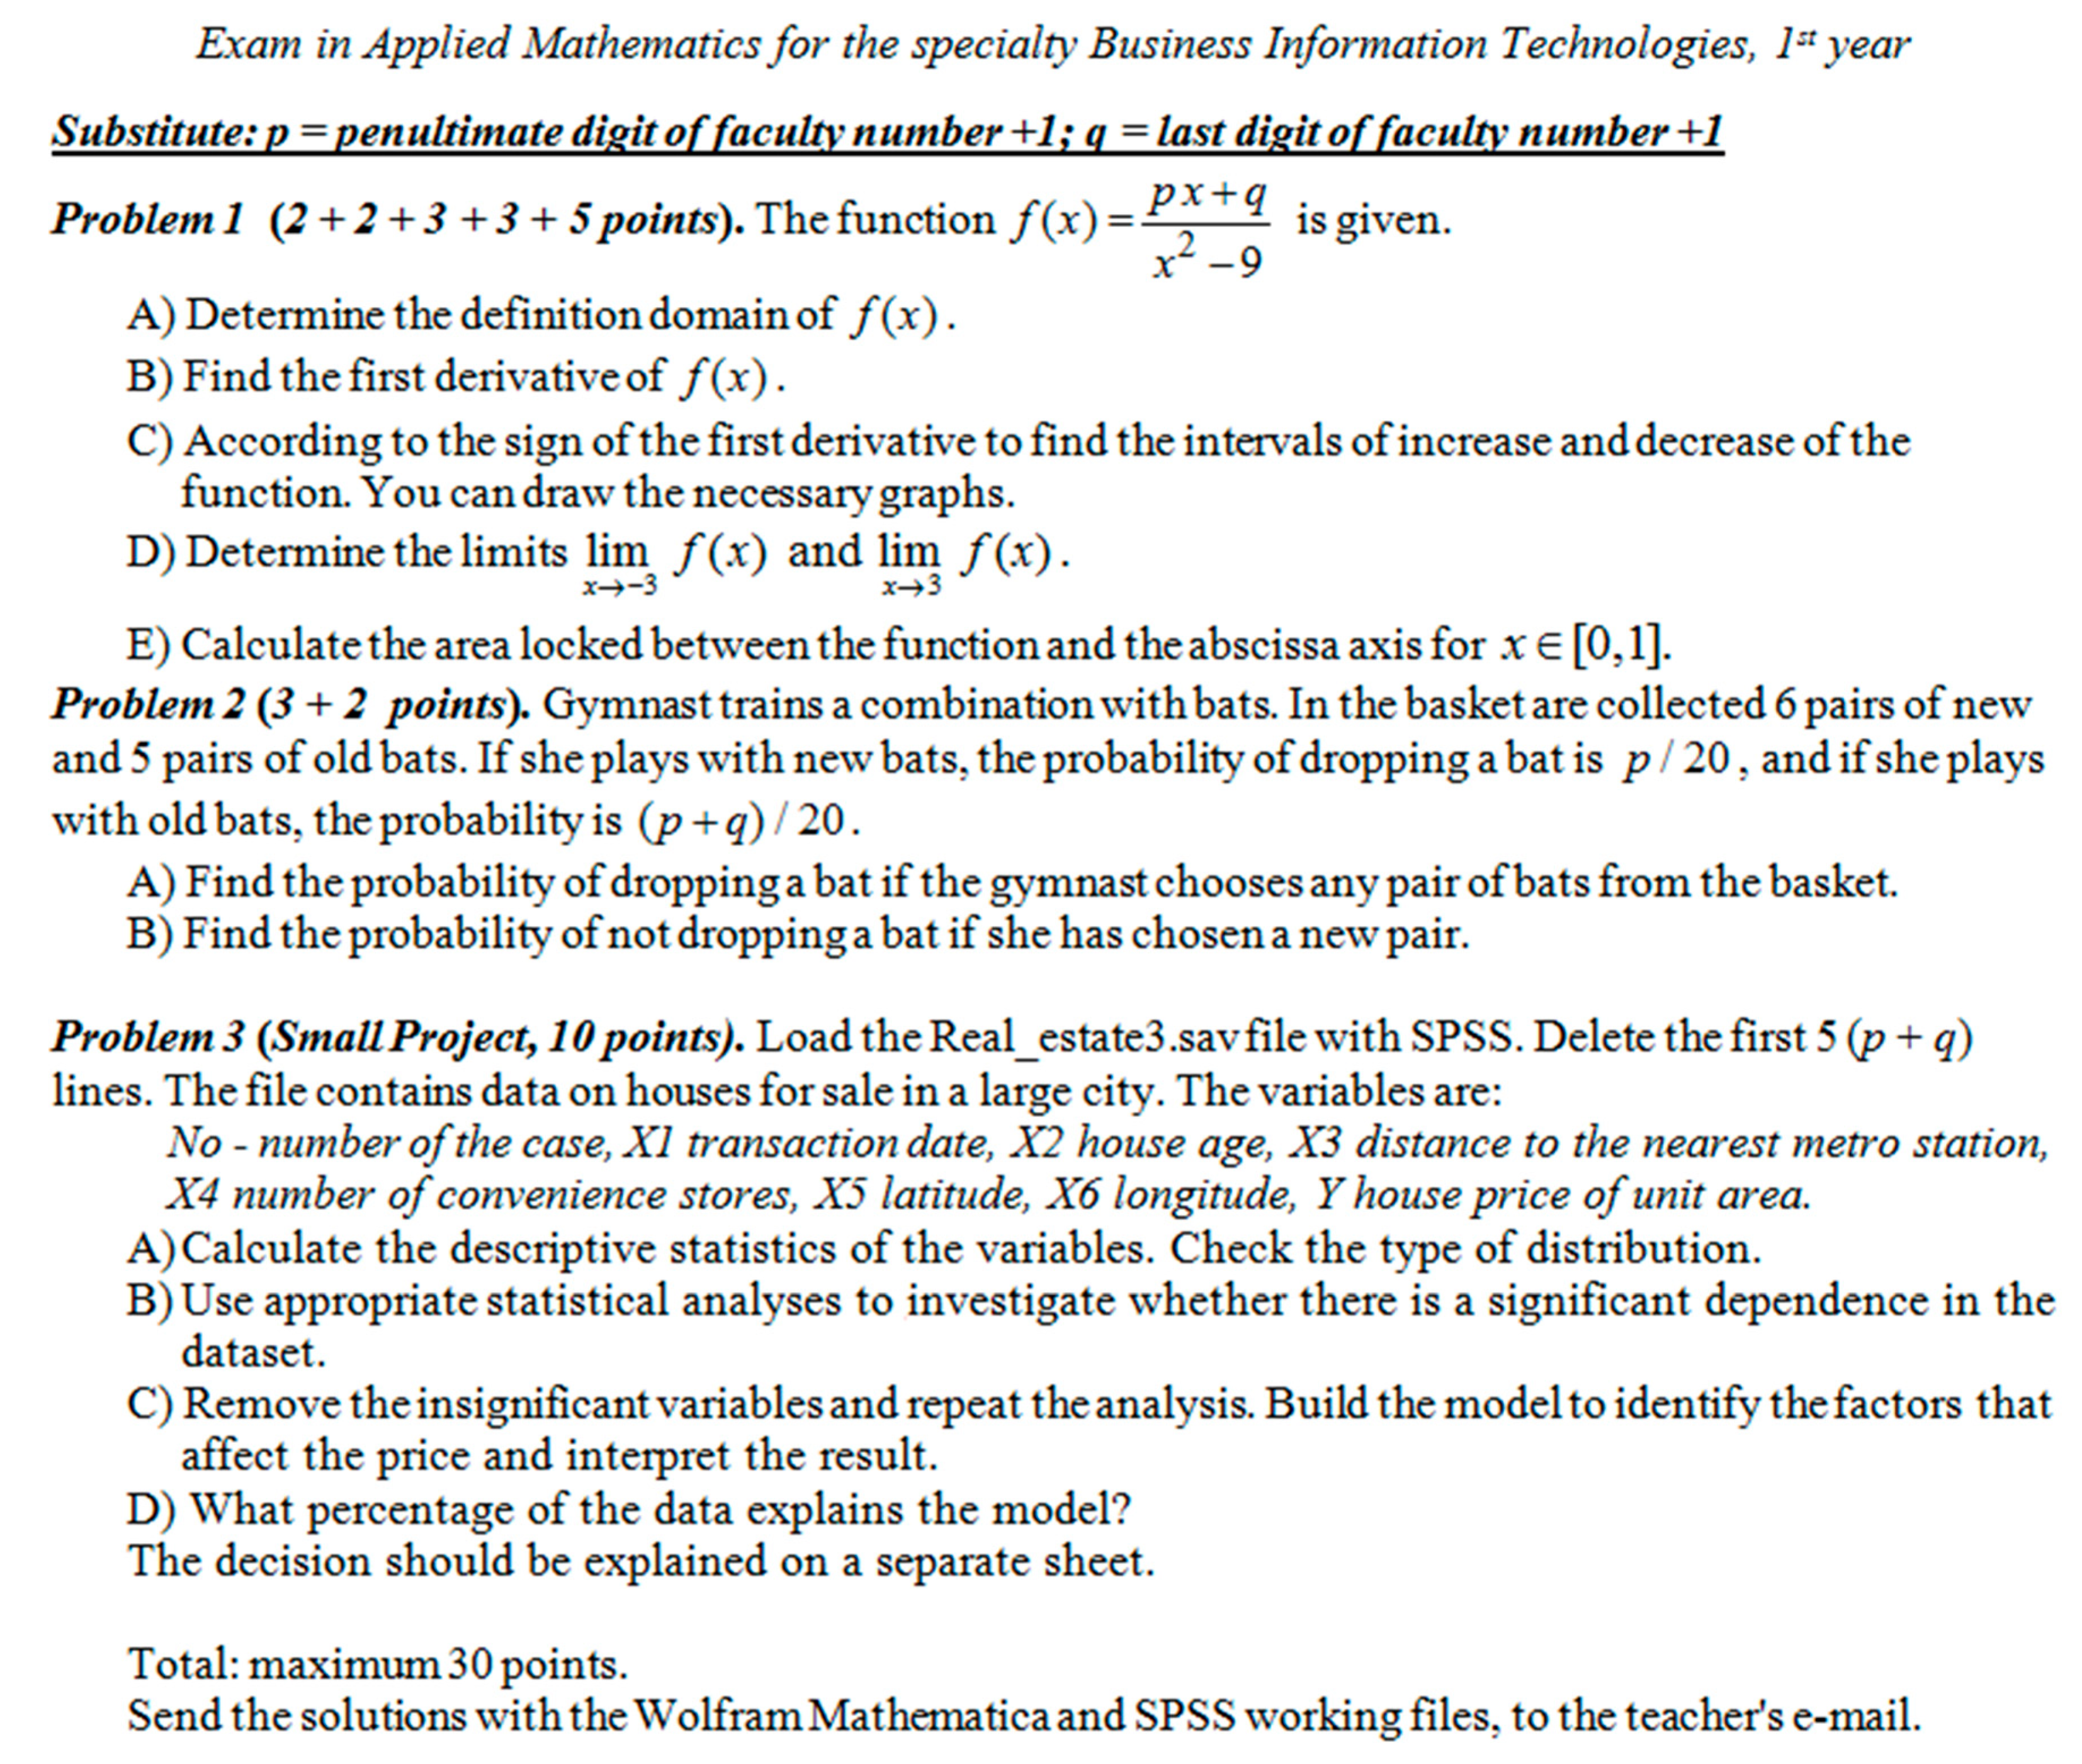
3.1. Test Design
- Problems in math analysis (5 problems), 15 points, 50%;
- Problems in probability (2 problems), 5 points, 17%;
- A small practical project in applied statistics, 10 points, 33%.
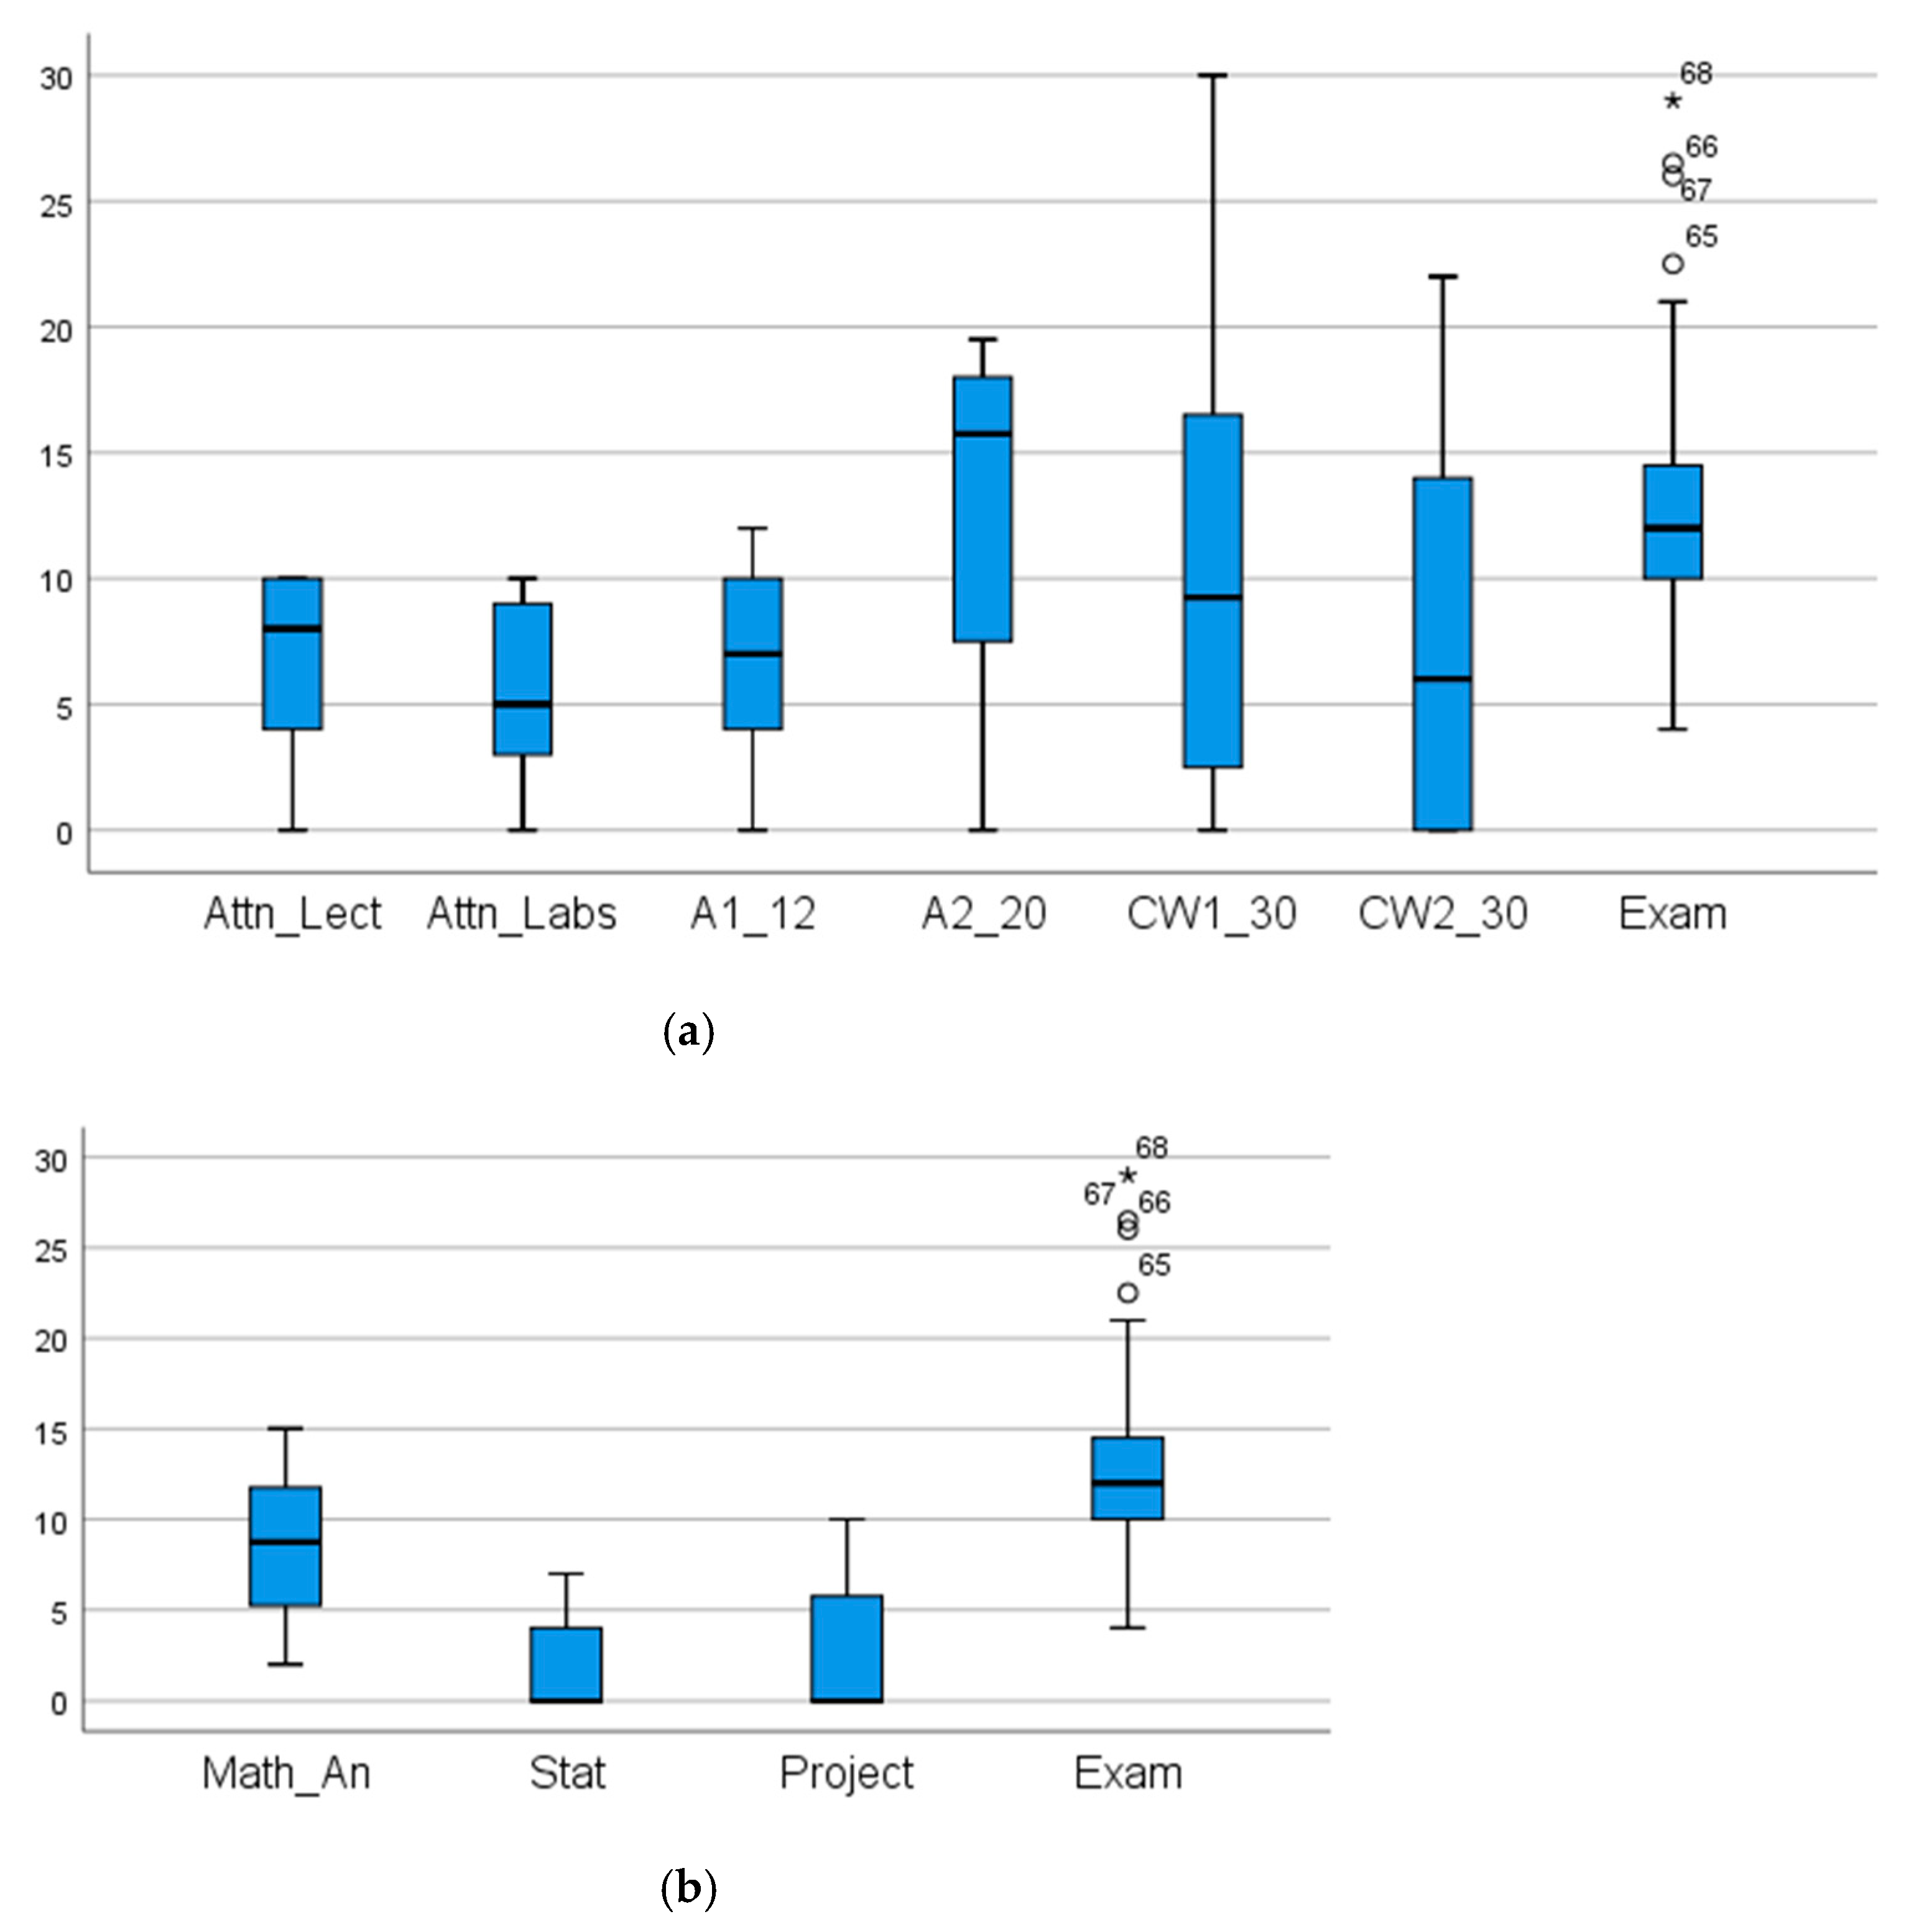
3.2. Measurement of Competencies by the Exam Test
3.3. Initial Processing and Analysis of the Data
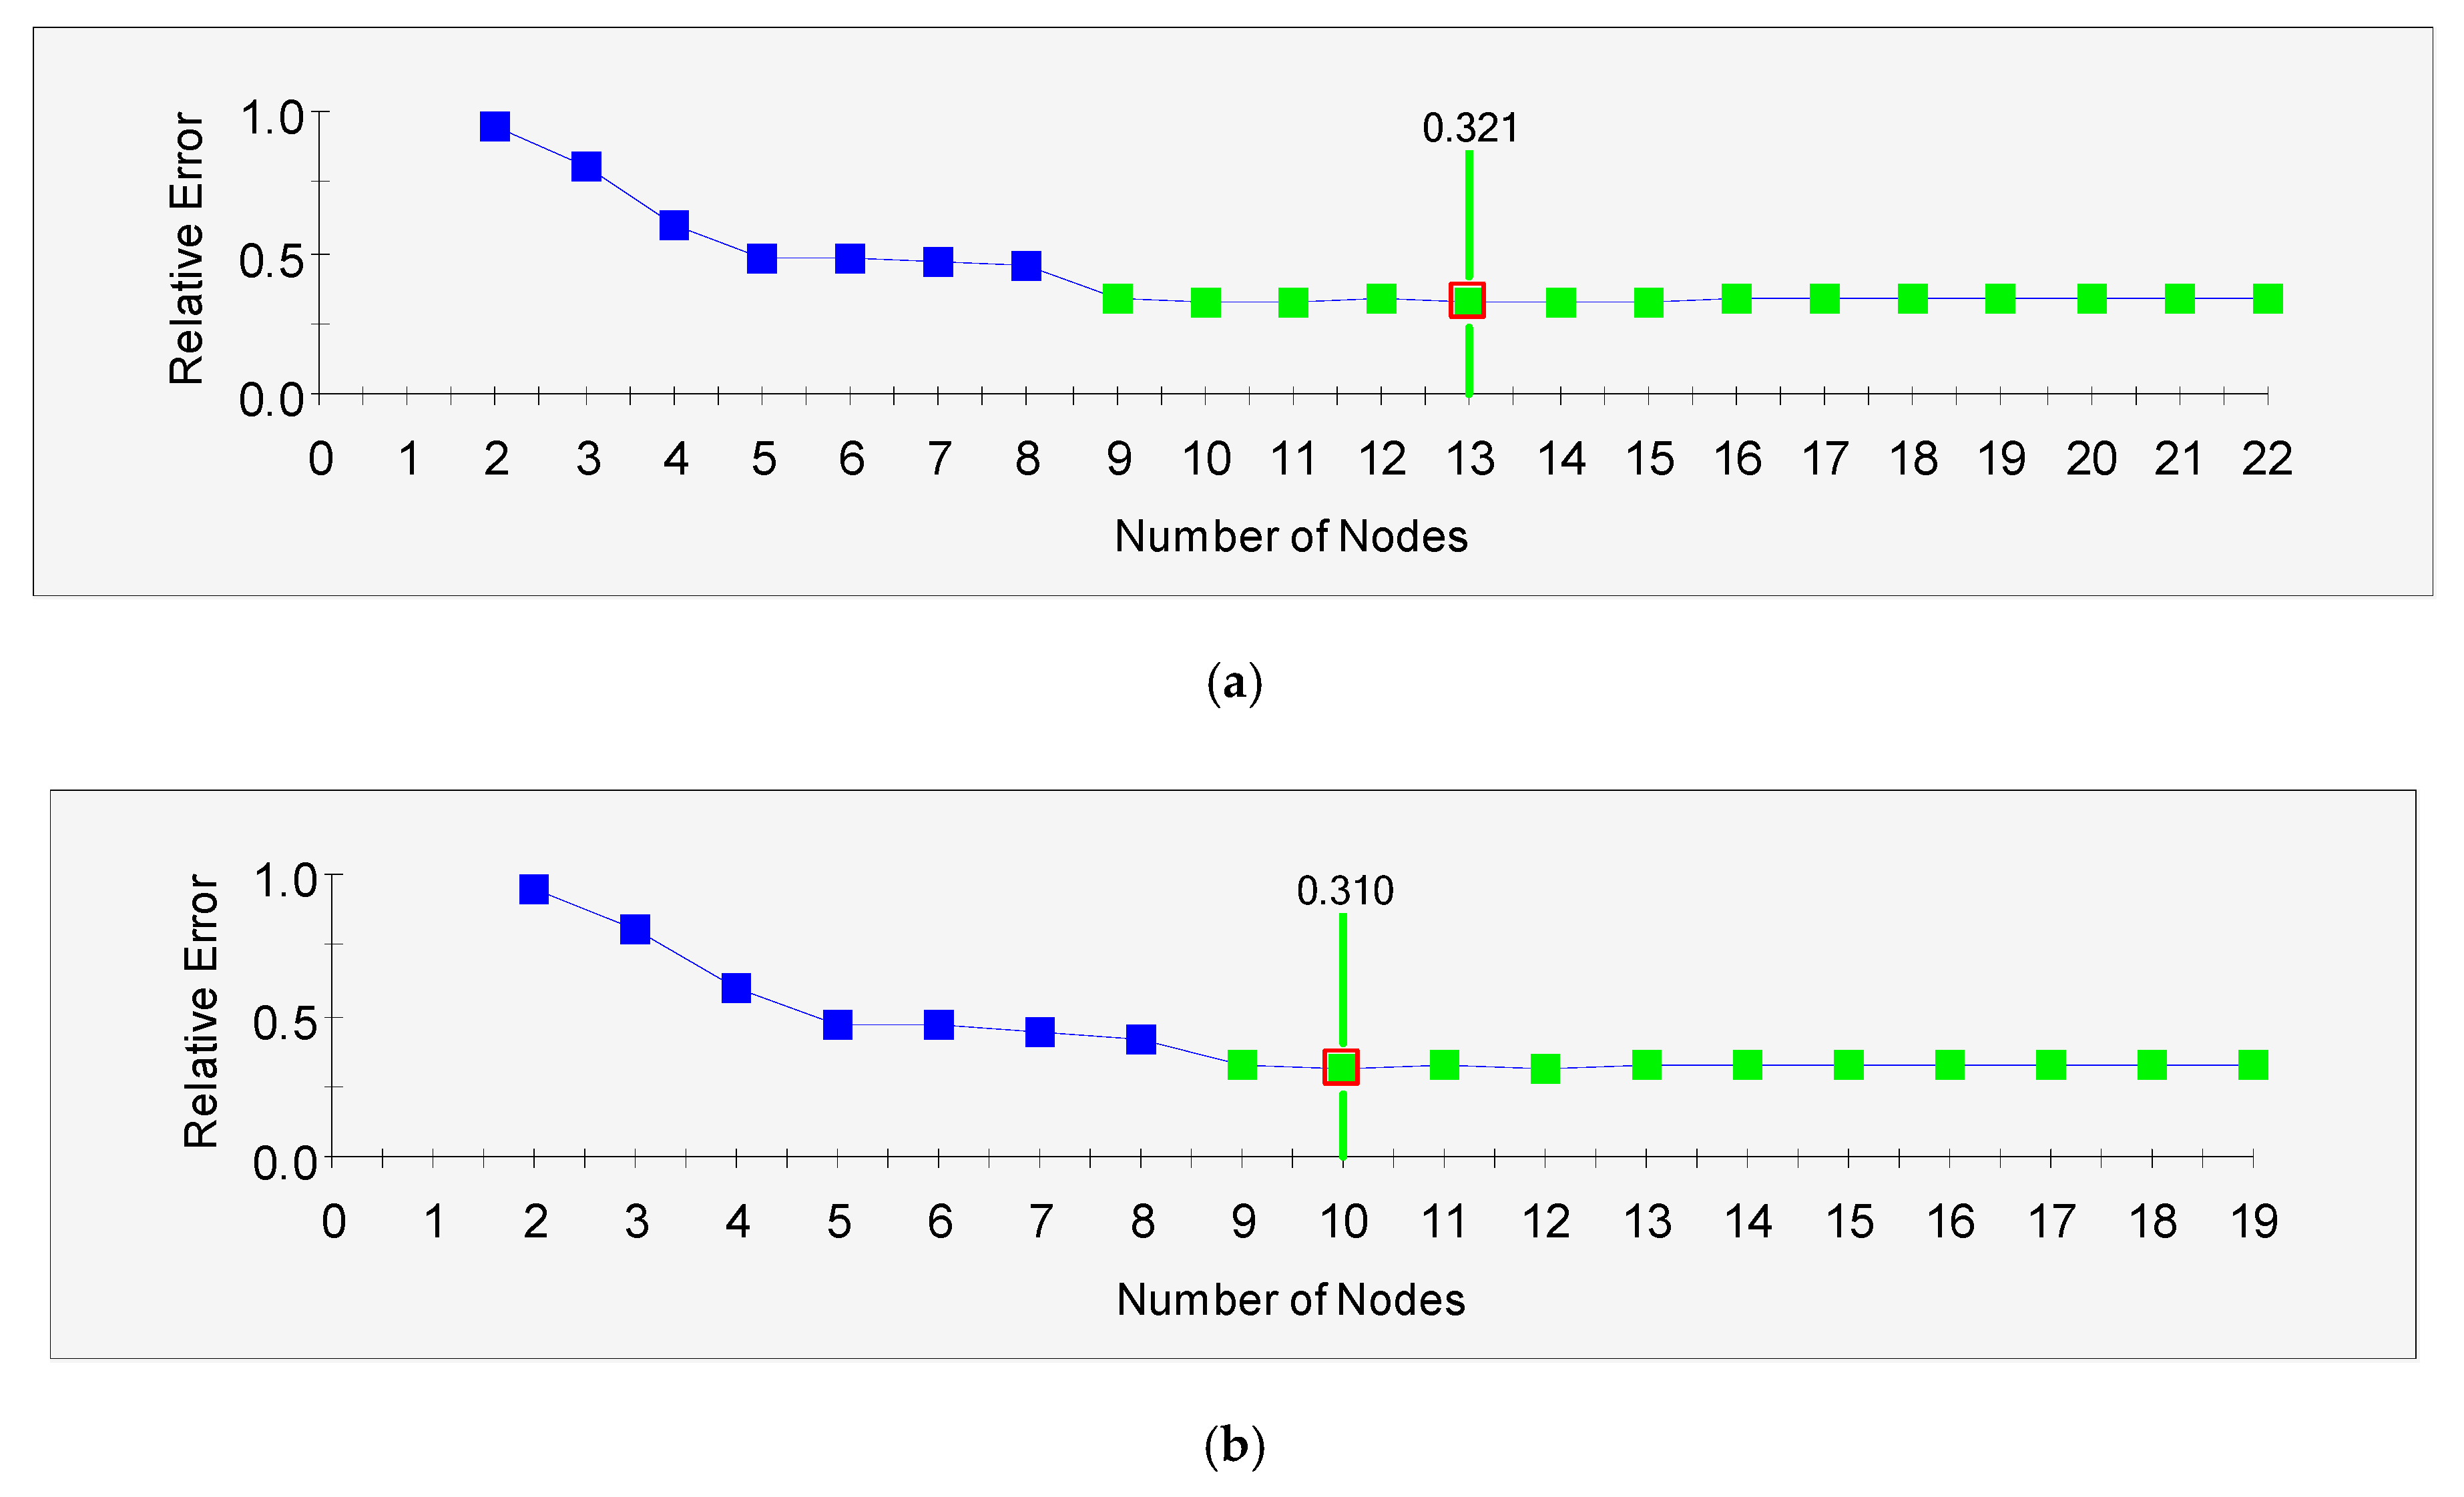
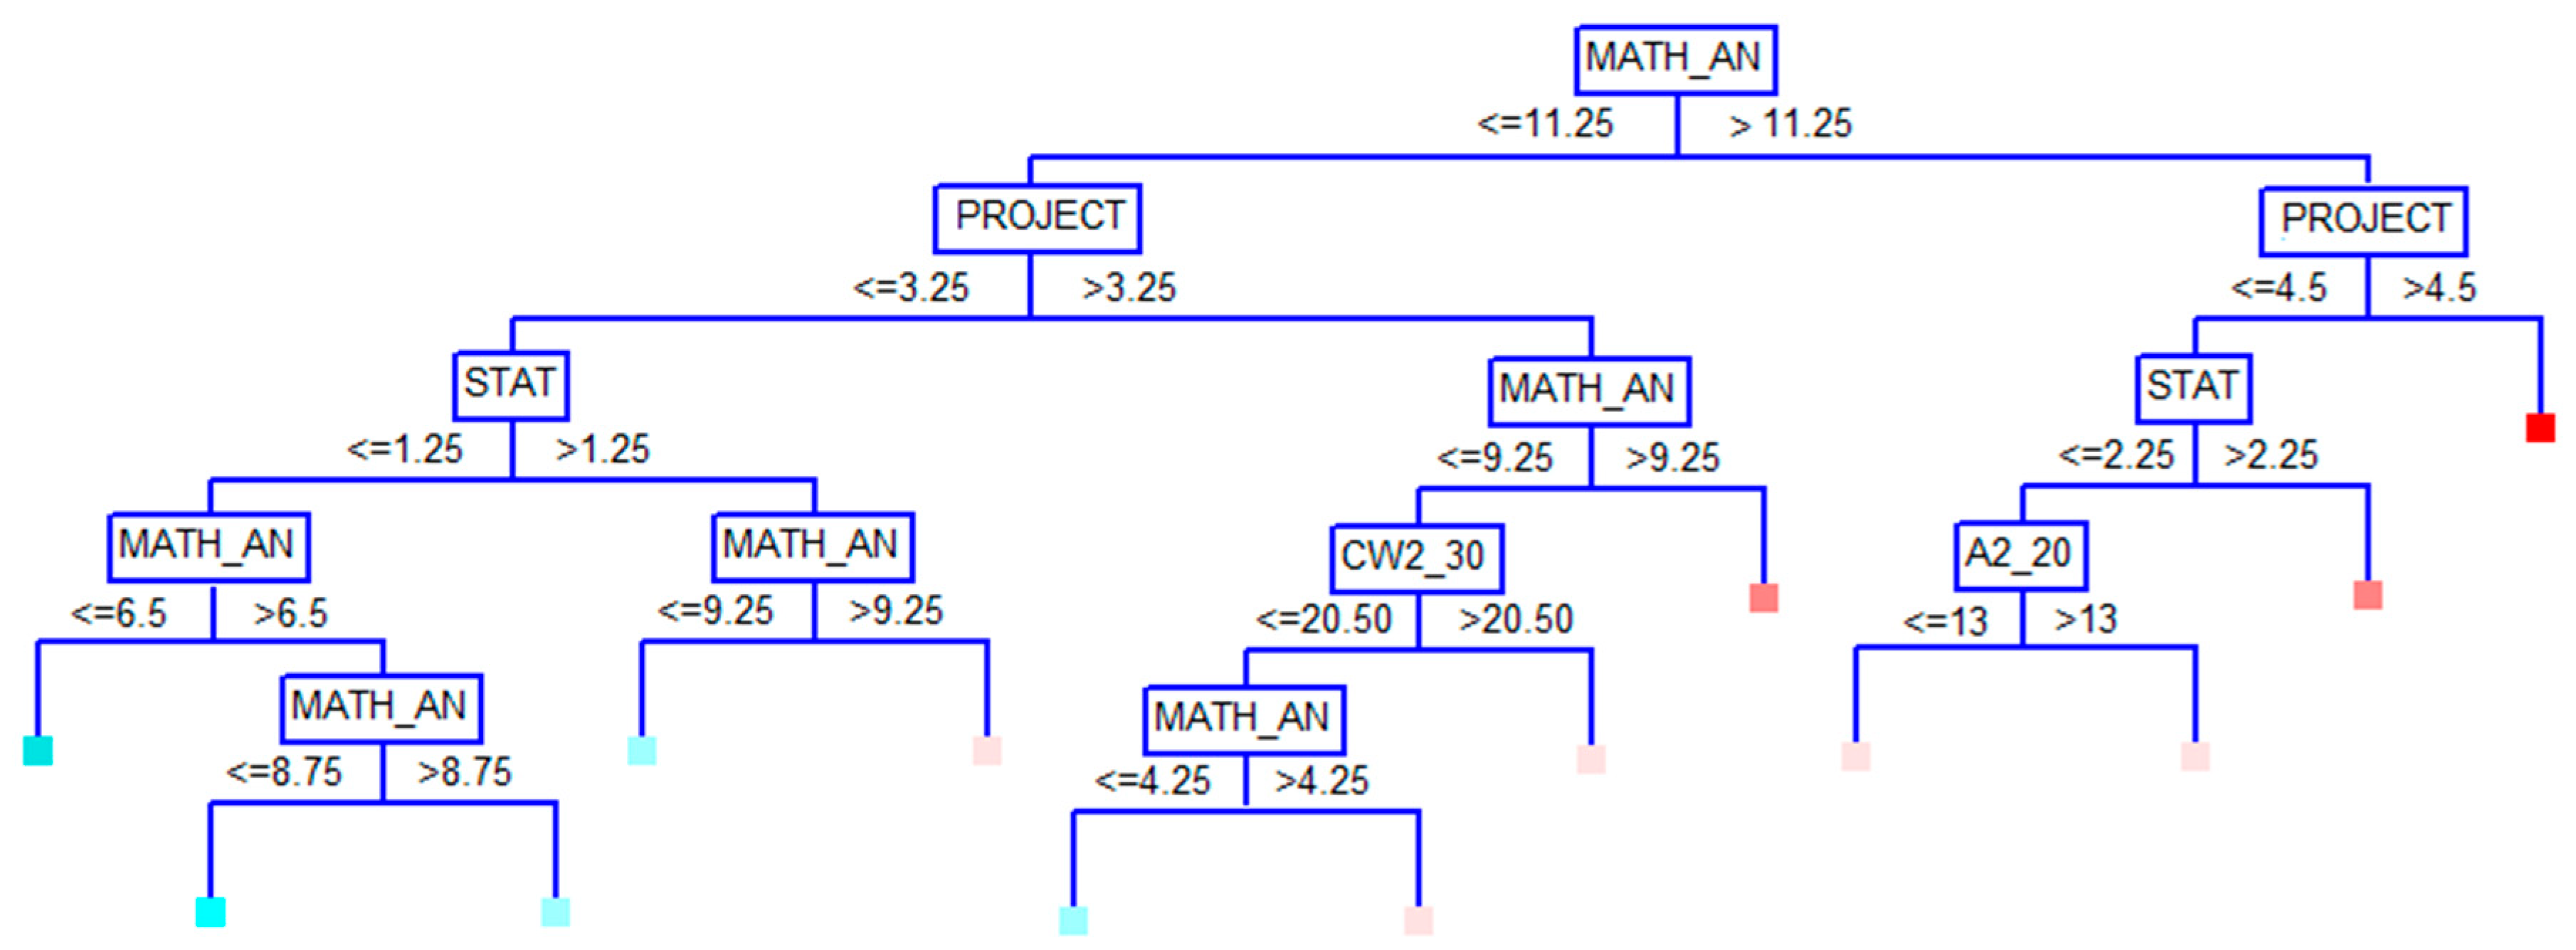
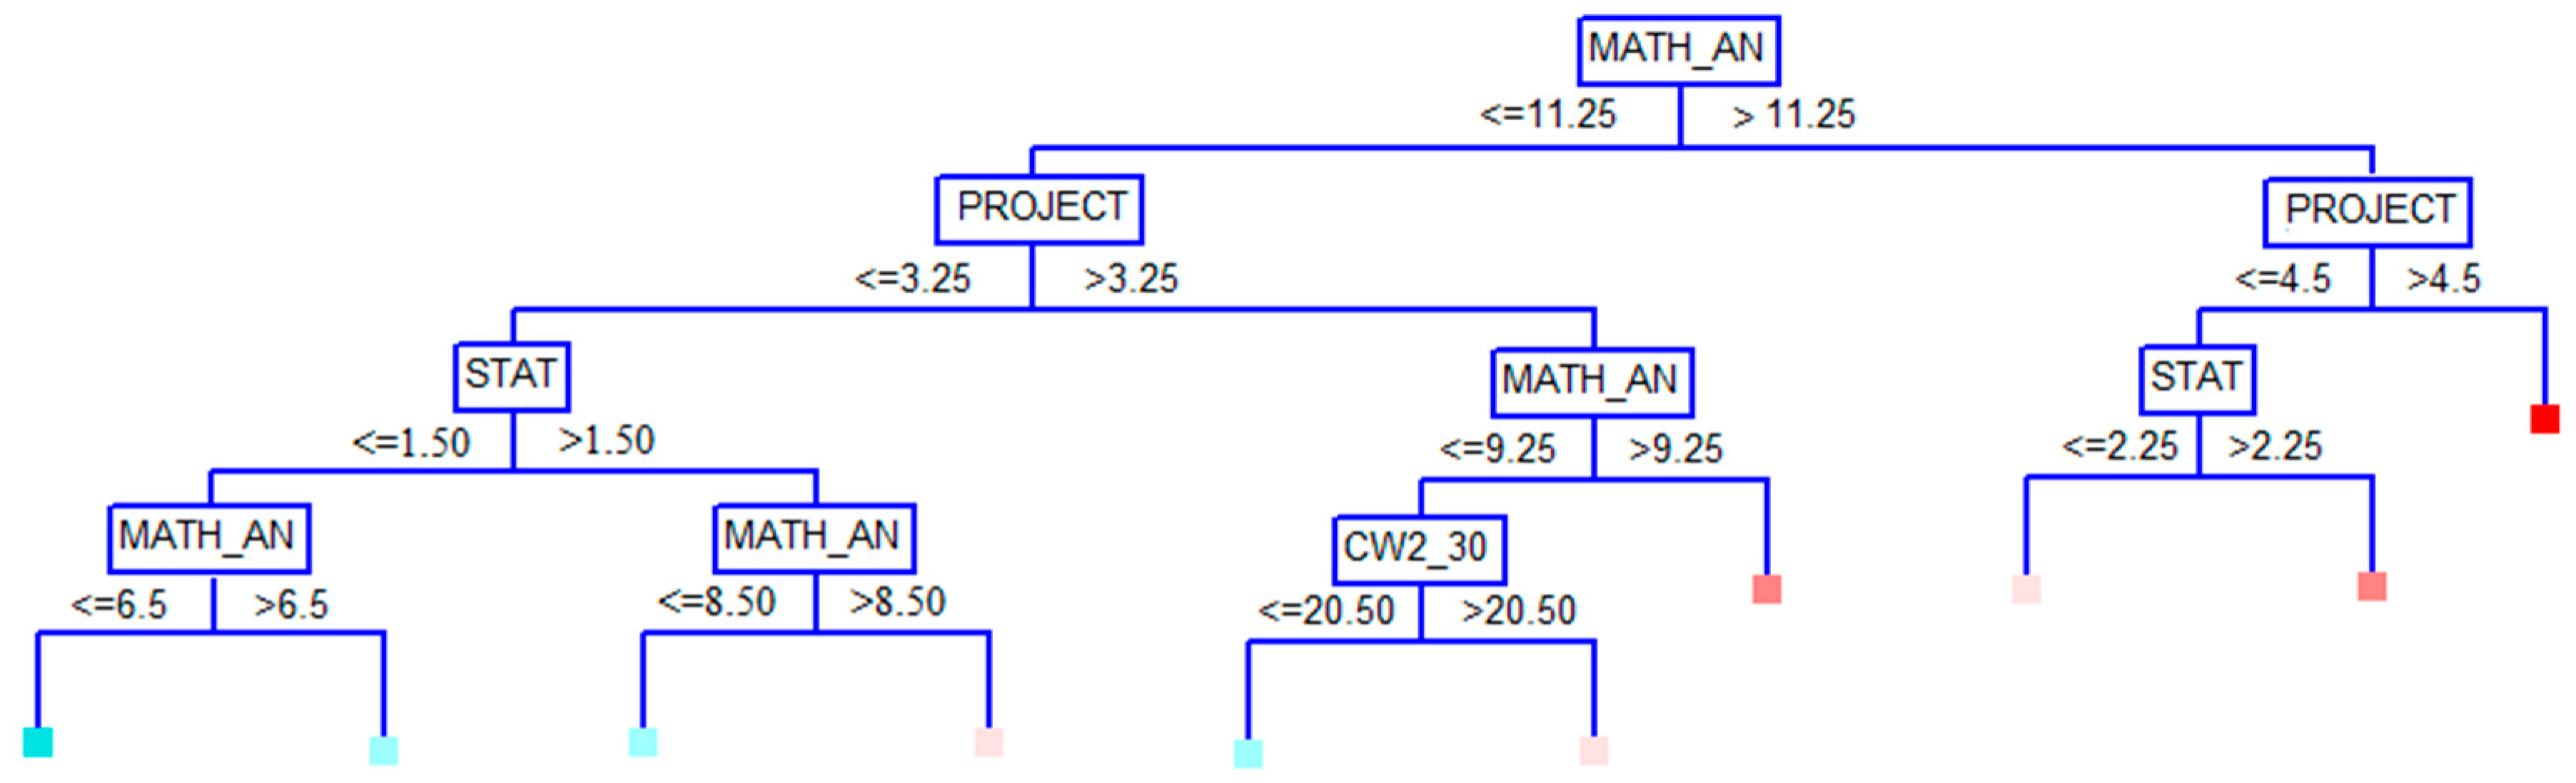
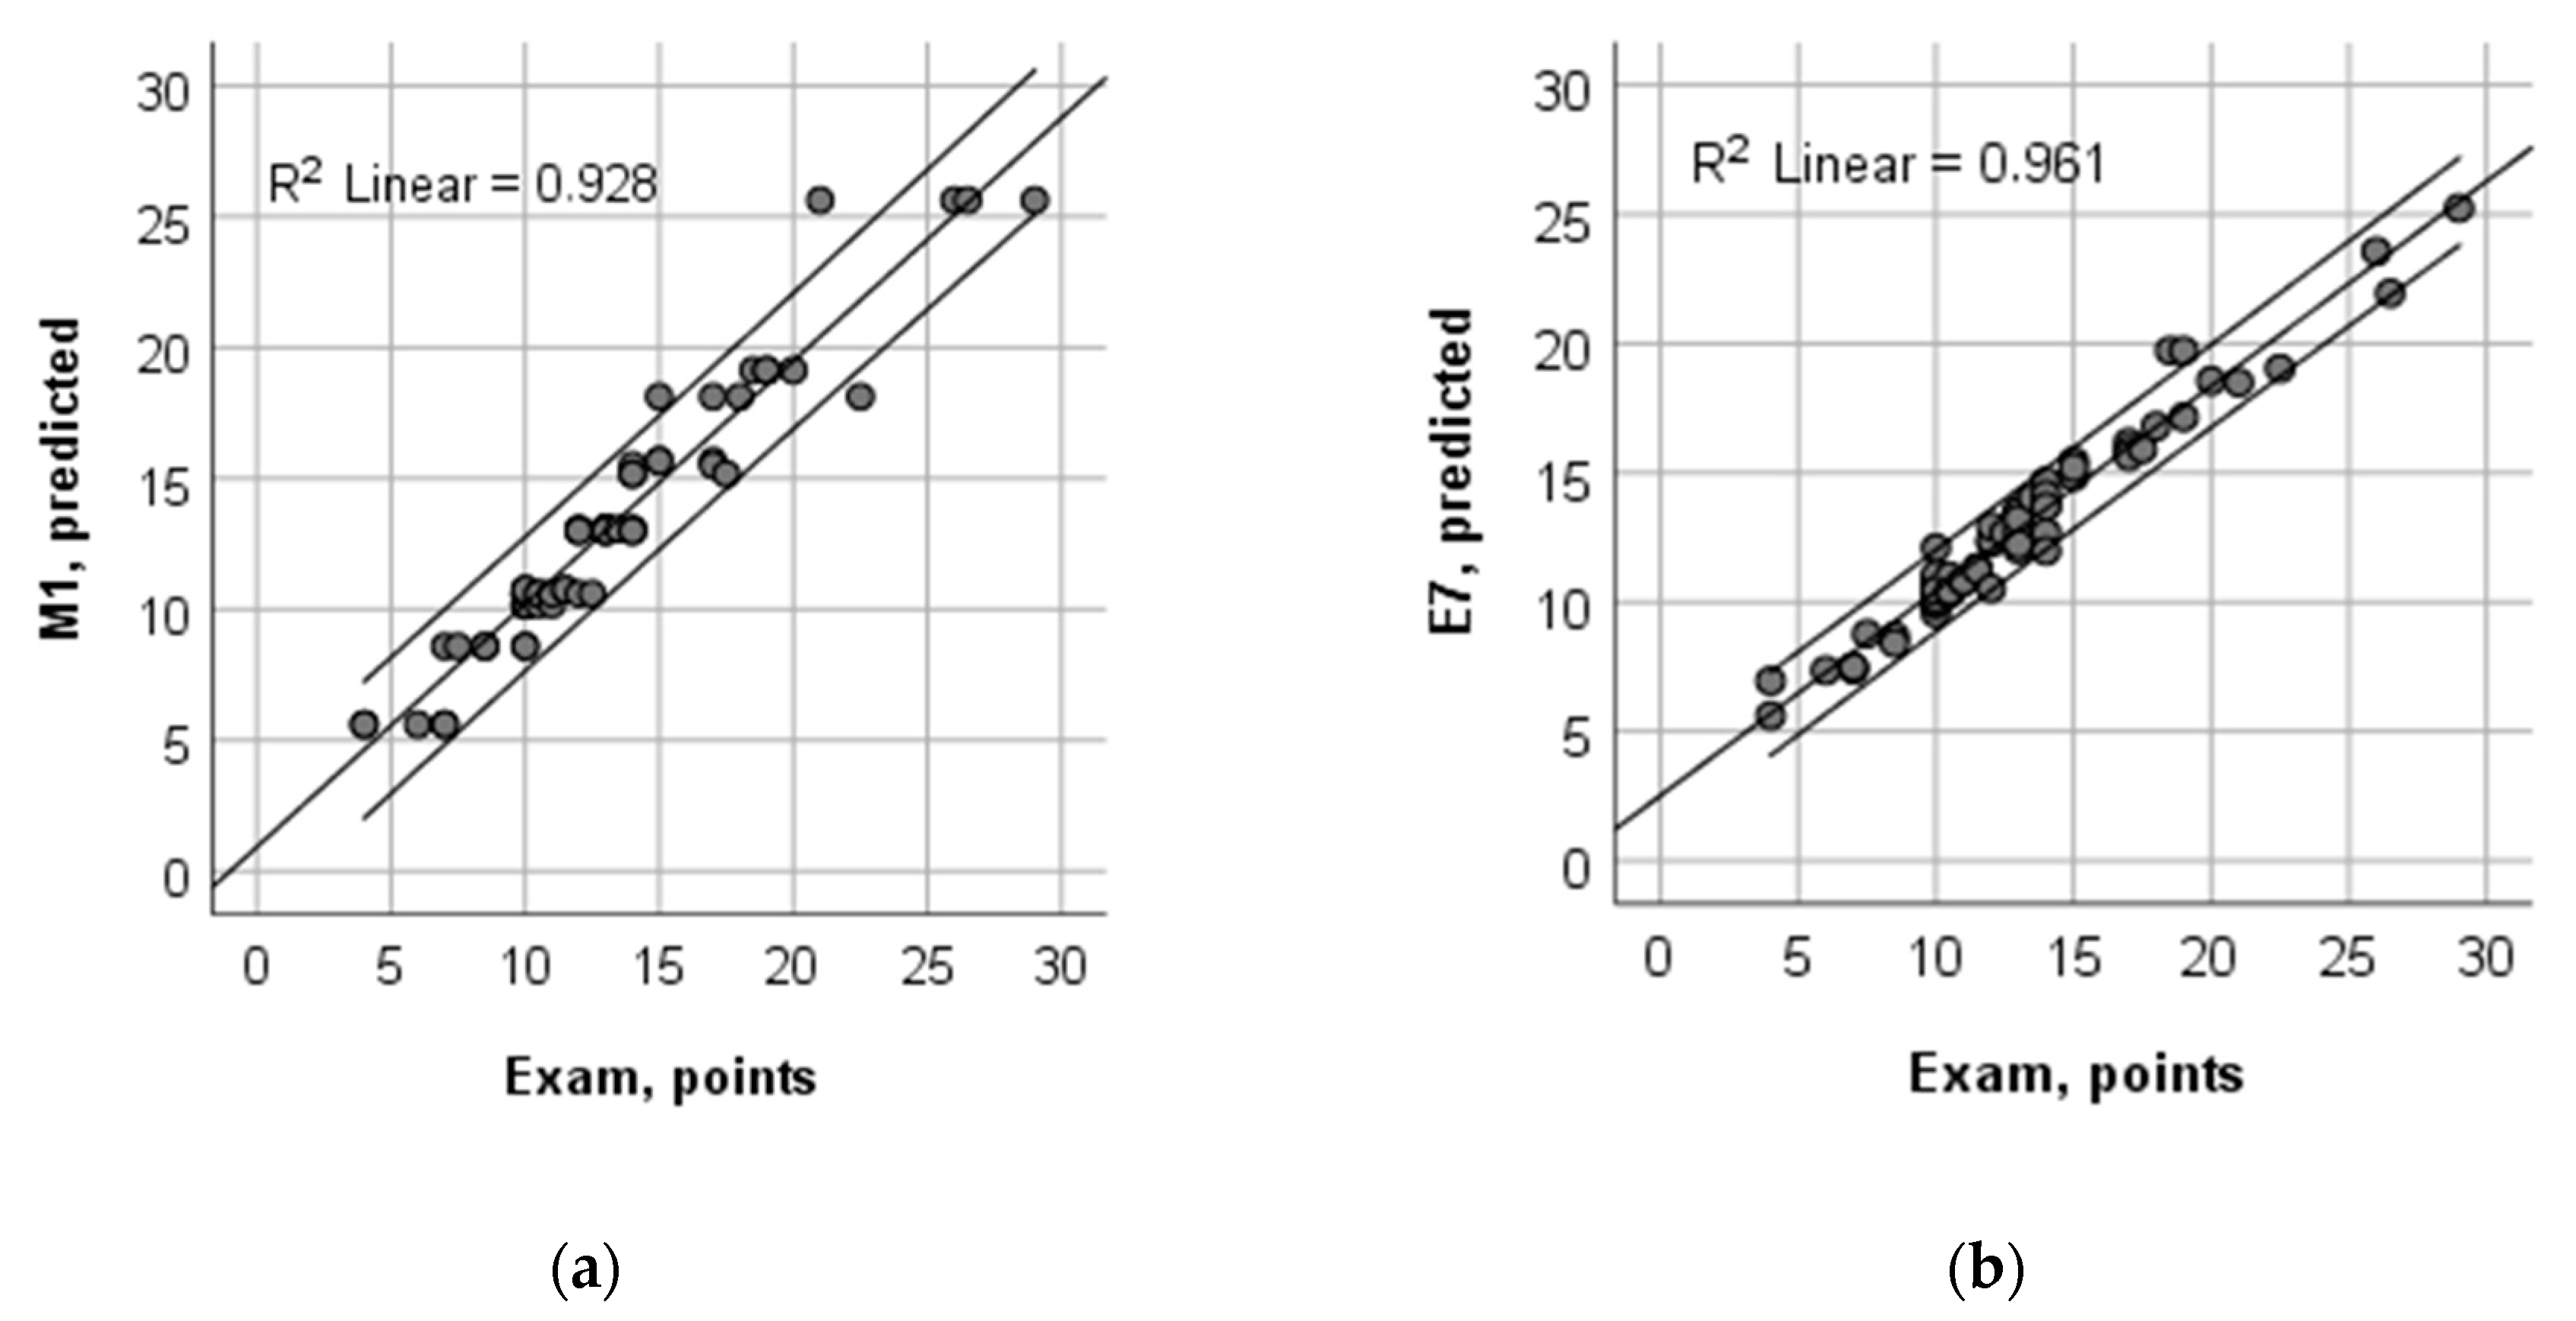
3.4. Results from the CART Models
3.5. Results from the CART Ensembles and Bagged Models
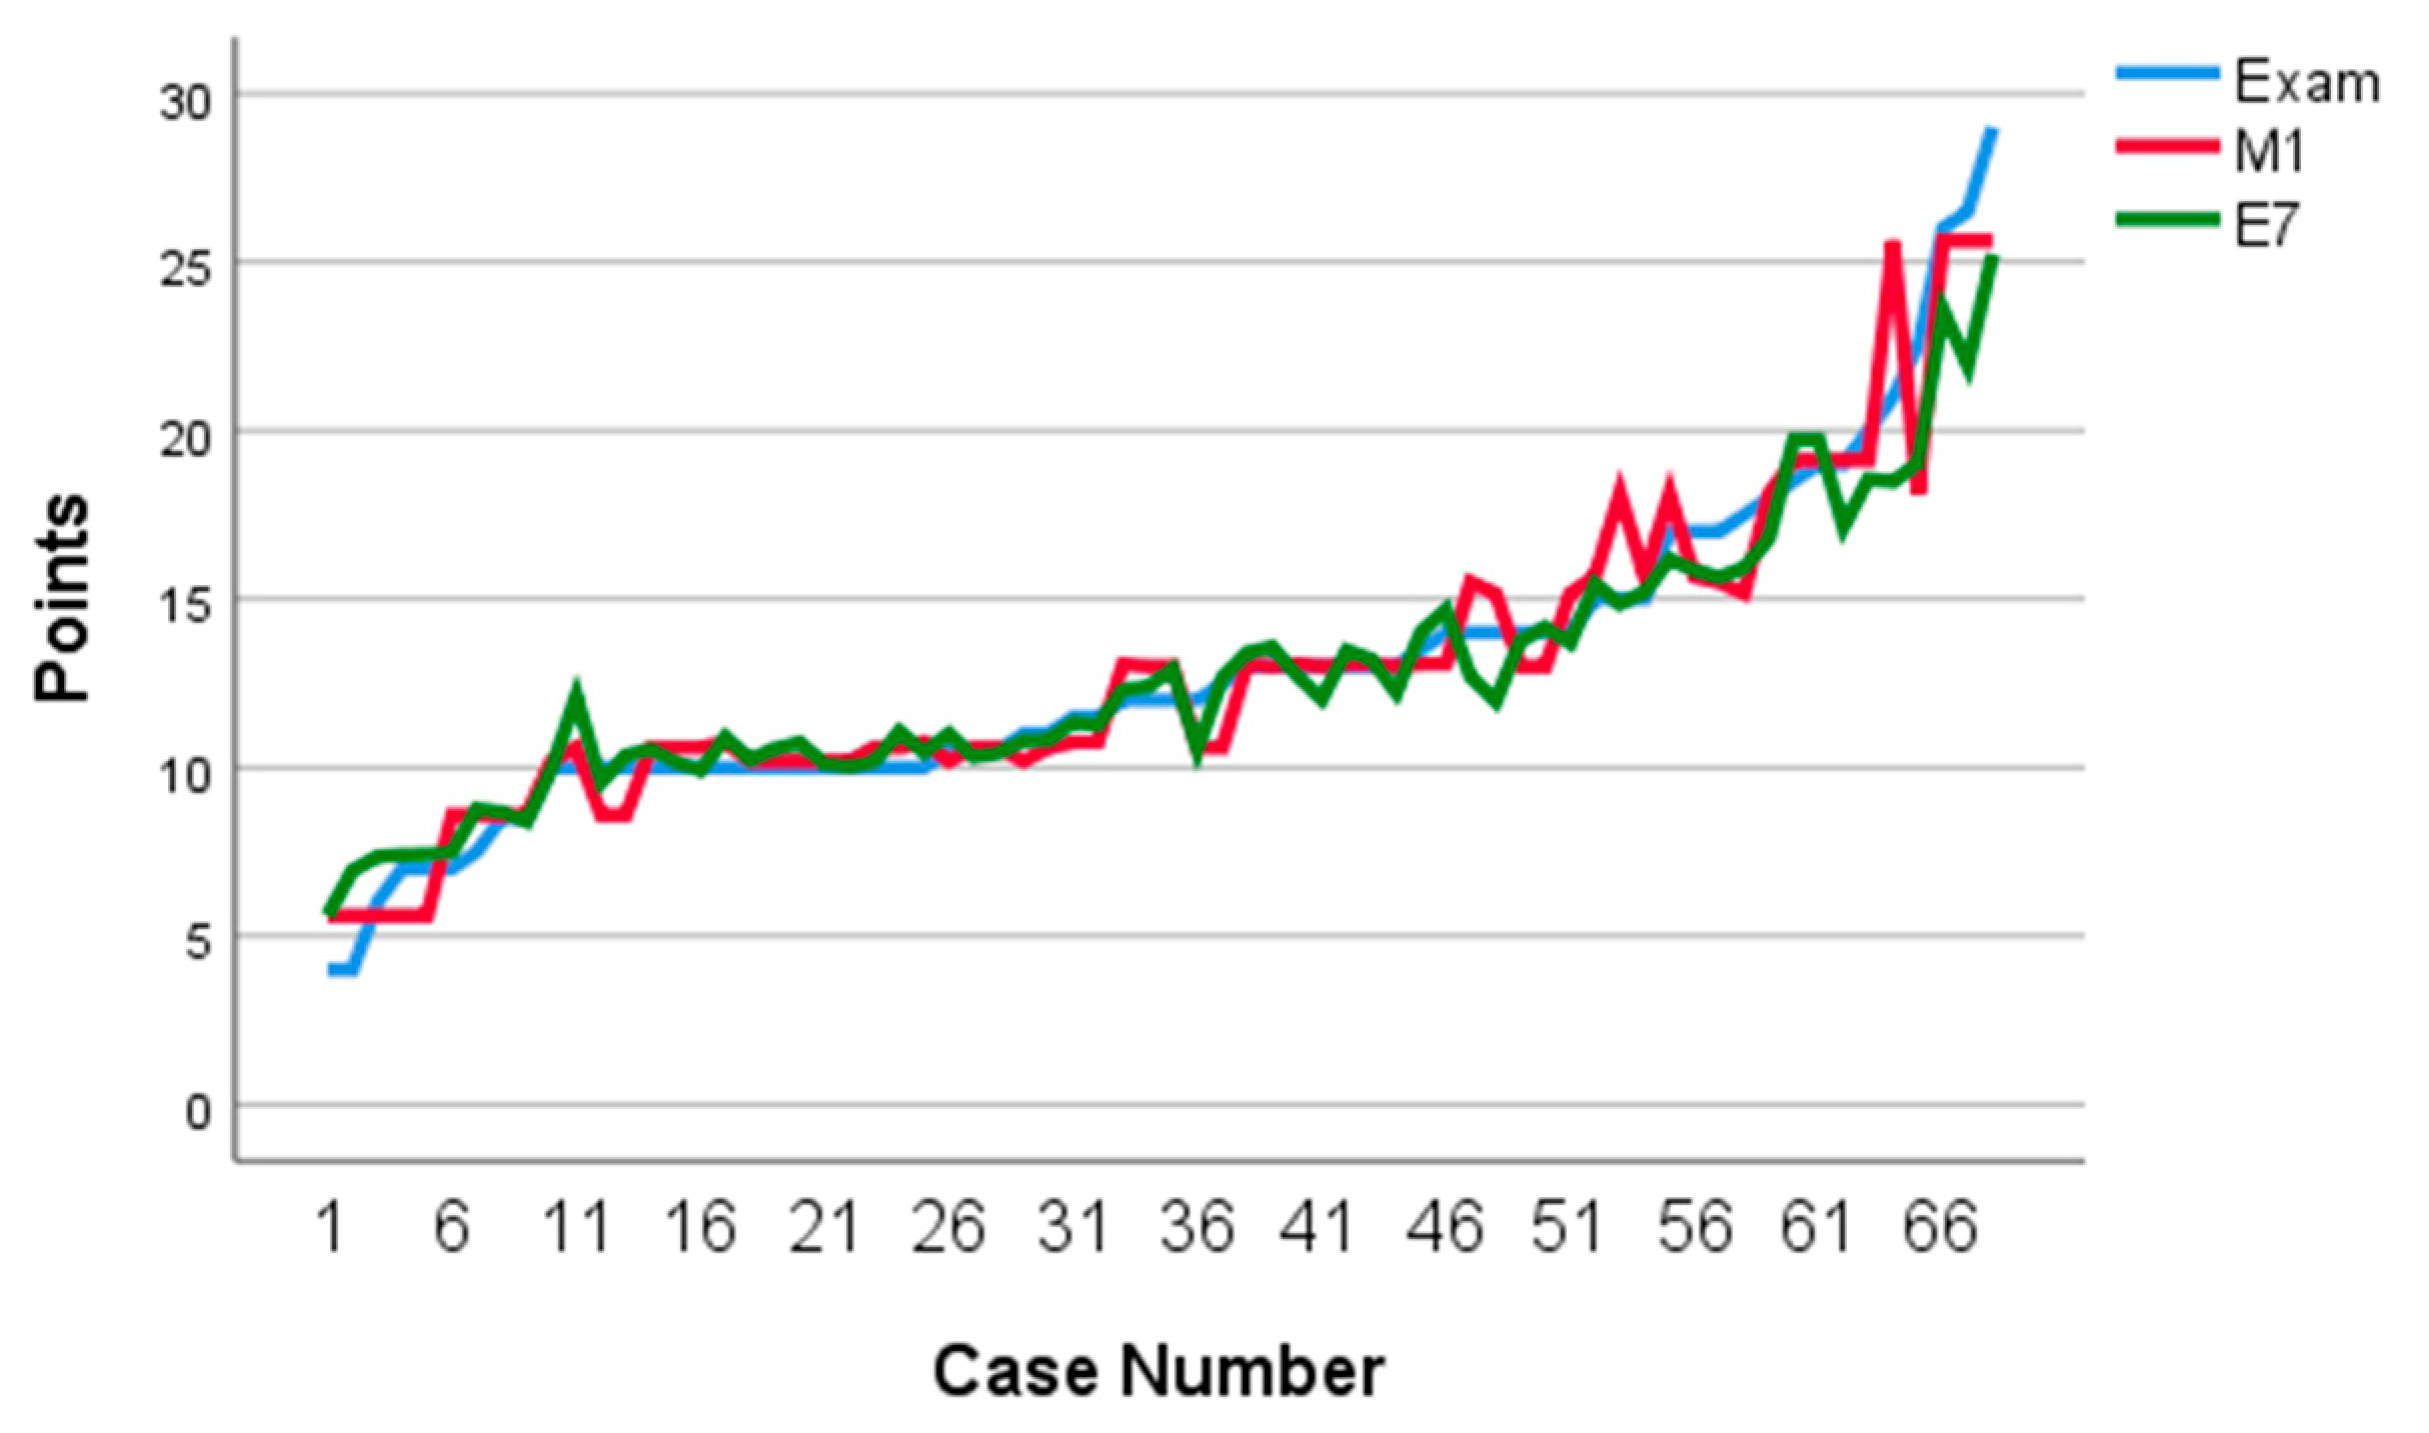
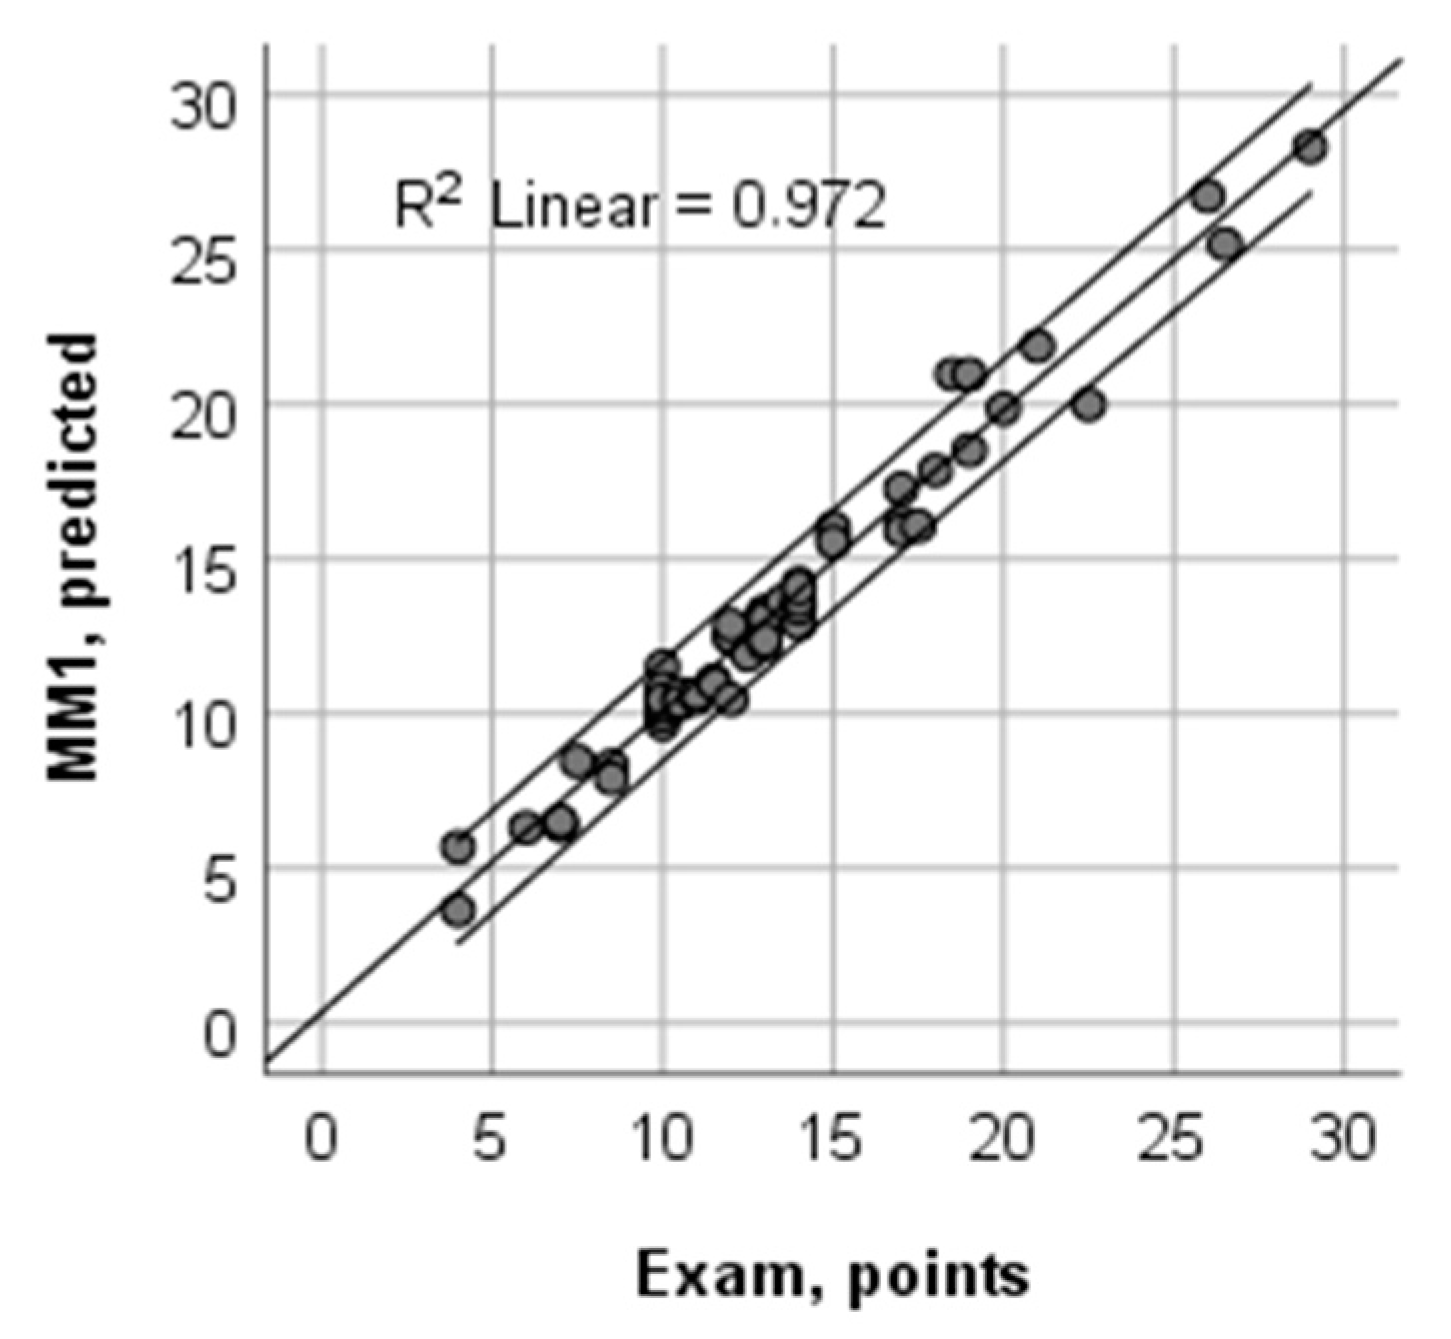
3.6. Combination of CART and CART Ensembles and Bagged Models Using MARS
4. Discussion with Conclusions
- As part of the family of regression trees, the CART and CART-EB methods we use can successfully deal with uncertainty, qualitatively stated problems and incomplete, imprecise or even contradictory data sets, as stated in [10]. These can process both nominal and numerical data, handle multidimensional and multivariety data, easily identify patterns and nonlinear complex relationships between the predictors, thus facilitating the interpretation of models.
- At step (1), the variable importance of initial predictors in models is assessed directly, which allows us to ignore/screen unsignificant predictors. This would be especially useful in the case of a large number of predictors for reducing the dimensionality of the problem.
- At step (2), numerical-type data are used, enabling the implementation of the MARS method, whereby it is combined with the predictions from (1). In particular, the results of our study showed that MARS models improve the predictions of the smallest and largest values of the target variable, including its outliers. In this manner, it is possible to eliminate or reduce the effect of this type of flaw, typical for all ensemble methods.
- The importance of the models from step (1), used as predictors, is determined with the help of MARS in step (2). In this manner, the best regression trees model is identified. Indirectly, if it determines the influence of the initial predictors, additional useful information may be obtained to interpret the overall statistical analysis.
Author Contributions
Funding
Conflicts of Interest
References
- Abdulwahed, M.; Jaworski, B.; Crawford, A. Innovative approaches to teaching mathematics in higher education: A review and critique. Nord. Stud. Math. Educ. 2012, 17, 49–68. Available online: https://repository.lboro.ac.uk/articles/Innovative_approaches_to_teaching_mathematics_in_higher_education_a_review_and_critique/9370940/files/16981556.pdf (accessed on 17 November 2020).
- Hassan, O.A.B. Learning theories and assessment methodologies—An engineering educational perspective. Eur. J. Eng. Educ. 2011, 36, 327–339. [Google Scholar] [CrossRef]
- Niss, M. Mathematical Competencies and the Learning of Mathematics: The Danish KOM Project. In Proceedings of the 3rd Mediterranean Conference on Mathematical Education, Athens, Greece, 3–5 January 2003; The Hellenic Mathematical Society: Athens, Greece, 2003; pp. 115–124. Available online: http://www.math.chalmers.se/Math/Grundutb/CTH/mve375/1112/docs/KOMkompetenser.pdf (accessed on 17 November 2020).
- Alpers, B.A.; Demlova, M.; Fant, C.-H.; Gustafsson, T.; Lawson, D.; Leslie Mustoe, L.; Olsen-Lehtonen, B.; Robinson, C.; Velichova, D. A Framework for Mathematics Curricula in Engineering Education: A Report of the Mathematics Working Group; European Society for Engineering Education (SEFI): Brussels, Belgium, 2013; Available online: http://sefi.htw-aalen.de/Curriculum/Competency%20based%20curriculum%20incl%20ads.pdf (accessed on 17 November 2020).
- Queiruga-Dios, A.; Hernández Encinas, A.; Demlova, M.; Dias Rasteiro, D.; Rodríguez Sánchez, G.; Sánchez Santos, M.J. Rules_Math: Establishing Assessment Standards. In Advances in Intelligent Systems and Computing; Martínez Álvarez, F., Troncoso, L.A., Sáez Muñoz, J., Quintián, H., Corchado, E., Eds.; Springer: Cham, Switzerland, 2020; Volume 951, pp. 235–244. [Google Scholar] [CrossRef]
- Gocheva-Ilieva, S.; Teofilova, M.; Iliev, A.; Kulina, H.; Voynikova, D.; Ivanov, A.; Atanasova, P. Data Mining for Statistical Evaluation of Summative and Competency-Based Assessments in Mathematics. In Advances in Intelligent Systems and Computing; Martínez Álvarez, F., Troncoso, L.A., Sáez Muñoz, J., Quintián, H., Corchado, E., Eds.; Springer: Cham, Switzerland, 2020; Volume 951, pp. 207–216. [Google Scholar] [CrossRef]
- Ivanov, A. Decision trees for evaluation of mathematical competencies in the higher education: A case study. Mathematics 2020, 8, 748. [Google Scholar] [CrossRef]
- Neumann, I.; Rosken-Winter, B.; Lehmann, M. Measuring mathematical competences of engineering students at the beginning of their studies. Peabody J. Educ. 2015, 90, 465–476. [Google Scholar] [CrossRef]
- Georgieva, P.V.; Nikolova, E.P. Enhancing communication competences through mathematics in engineering curriculum. In Proceedings of the 42nd International Convention on Information and Communication Technology, Electronics and Microelectronics, MIPRO 2019, Opatija, Croatia, 20–24 May 2019; Volume 8757207, pp. 1451–1456. [Google Scholar] [CrossRef]
- Charitopoulos, A.; Rangoussi, M.; Koulouriotis, D. On the use of soft computing methods in educational data mining and learning analytics research: A review of years 2010–2018. Int. J. Artif. Intell. Educ. 2020, 30. [Google Scholar] [CrossRef]
- Mesarić, J.; Šebalj, D. Decision trees for predicting the academic success of students. Croat. Oper. Res. Rev. 2016, 7, 367–388. [Google Scholar] [CrossRef] [Green Version]
- Kotsiantis, S.; Pierrakeas, C.; Pintelas, P. Predicting students’ performance in distance learning using machine learning techniques. Appl. Artif. Intell. 2004, 18, 411–426. [Google Scholar] [CrossRef]
- Mueen, A.; Zafar, B.; Manzoor, U. Modeling and predicting students’ academic performance using data mining techniques. Int. J. Mod. Educ. Comp. Sci. 2016, 8, 36–42. [Google Scholar] [CrossRef]
- Behr, A.; Giese, M.; Teguim, K.; Theune, K. Early prediction of university dropouts—A random forest approach. J. Econ. Stat. 2020, 240, 743–789. [Google Scholar] [CrossRef]
- Sokkhey, P.; Okazaki, T. Comparative study of prediction models for high school student performance in mathematics. IEIE Trans. Smart Process. Comput. 2019, 8, 394–404. [Google Scholar] [CrossRef]
- Sokkhey, P.; Okazaki, T. Hybrid machine learning algorithms for predicting academic performance. Int. J. Adv. Comput. Sci. Appl. 2020, 11, 32–41. [Google Scholar] [CrossRef] [Green Version]
- Qiang, T. Data mining algorithm and the effectiveness of mathematics classroom teaching based on support vector machine. Int. J. Database Theory Appl. 2016, 9, 163–174. [Google Scholar] [CrossRef]
- Siri, A. Predicting students’ dropout at university using artificial neural networks. Ital. J. Soc. Educ. 2015, 7, 225–247. [Google Scholar] [CrossRef]
- Mat, U.B.; Buniyamin, N. Using neuro-fuzzy technique to classify and predict electrical engineering students’ achievement upon graduation based on mathematics competency. Indones. J. Electr. Eng. Comput. Sci. 2017, 5, 684–690. [Google Scholar]
- Ivanova, V.; Zlatanov, B. Implementation of fuzzy functions aimed at fairer grading of students’ tests. Educ. Sci. 2019, 9, 214. [Google Scholar] [CrossRef] [Green Version]
- Depren, S.K. Prediction of students’ science achievement: An application of multivariate adaptive regression splines and regression trees. J. Balt. Sci. Educ. 2018, 17, 887–903. [Google Scholar] [CrossRef]
- Shahiri, A.M.; Husain, W.; Rashid, N.A. A review on predicting student’s performance using data mining techniques. Proced. Comp. Sci. 2015, 72, 414–422. [Google Scholar] [CrossRef] [Green Version]
- Dutt, A.; Ismail, M.A.; Herawan, T. A systematic review on educational data mining. IEEE Access 2017, 5, 15991–16005. [Google Scholar] [CrossRef]
- Alyahyan, E.; Düştegör, D. Predicting academic success in higher education: Literature review and best practices. Int. J. Educ. Technol. High. Educ. 2020, 17, 3. [Google Scholar] [CrossRef] [Green Version]
- Pintelas, P.; Livieris, I.E. Special issue on ensemble learning and applications. Algorithms 2020, 13, 140. [Google Scholar] [CrossRef]
- Breiman, L.; Friedman, J.H.; Olshen, R.A.; Stone, C.J. Classification and Regression Trees; Chapman and Hall/CRC: Boca Raton, FL, USA, 1984. [Google Scholar]
- Steinberg, D. CART: Classification and regression trees. In The Top Ten Algorithms in Data Mining; Wu, X., Kumar, V., Eds.; Chapman and Hall/CRC: Boca Raton, FL, USA, 2009; pp. 179–202. [Google Scholar]
- Izenman, A.J. Modern Multivariate Statistical Techniques. Regression, Classification, and Manifold Learning; Springer: New York, NY, USA, 2008. [Google Scholar]
- Apté, C.; Weiss, S. Data mining with decision trees and decision rules. Future Gener. Comput. Syst. 1997, 13, 197–210. [Google Scholar] [CrossRef]
- Salford Predictive Modeler. Available online: https://www.minitab.com/en-us/products/spm/ (accessed on 17 November 2020).
- Wen, S.; Buyukada, M.; Evrendilek, F.; Liu, J. Uncertainty and sensitivity analyses of co-combustion/pyrolysis of textile dyeing sludge and incense sticks: Regression and machine-learning models. Renew. Energy 2019, 151, 463–474. [Google Scholar] [CrossRef]
- Pradeepkumar, D.; Ravi, V. Forex rate prediction: A hybrid approach using chaos theory and multivariate adaptive regression splines. In Proceedings of the 5th International Conference on Frontiers in Intelligent Computing: Theory and Applications; Springer: Berlin/Heidelberg, Germany, 2017; Volume 515, pp. 219–227. [Google Scholar] [CrossRef]
- Friedman, J.H. Multivariate adaptive regression splines (with discussion). Ann. Stat. 1991, 19, 1–141. [Google Scholar] [CrossRef]
- Bliemel, F. Theil’s forecast accuracy coefficient: A clarification. J. Mark. Res. 1973, 10, 444–446. [Google Scholar] [CrossRef]
- Vandekerckhove, J.; Matzke, D.; Wagenmakers, E.J. Model comparison and the principle of parsimony. In The Oxford Handbook of Computational and Mathematical Psychology; Busemeyer, J.R., Wang, Z., Townsend, J.T., Eidelsm, A., Eds.; Oxford University Press: Oxford, UK, 2015; pp. 300–318. [Google Scholar]
- Queiruga-Dios, A.; Sanchez, M.J.S.; Perez, J.J.B.; Martin-Vaquero, J.; Encinas, A.H.; Gocheva-Ilieva, S.; Demlova, M.; Rasteiro, D.D.; Caridade, C.; Gayoso-Martinez, V. Evaluating Engineering Competencies: A New Paradigm. In Proceedings of the Global Engineering Education Conference (EDUCON), Tenerife, Spain, 17–20 April 2018; IEEE: New York, NY, USA, 2018; pp. 2052–2055. [Google Scholar] [CrossRef]


| Competency | Exam Elements | |||||||||||
|---|---|---|---|---|---|---|---|---|---|---|---|---|
| T1 | T2 | T3 | T4 | T5 | S1 | S2 | P1 | P2 | P3 | P4 | ||
| C1 | Thinking mathematically | − | − | − | − | 0 | + | + | 0 | 0 | 0 | 0 |
| C2 | Reasoning mathematically | − | − | 0 | − | 0 | 0 | 0 | − | 0 | 0 | − |
| C3 | Problem solving | 0 | 0 | 0 | 0 | + | + | + | 0 | 0 | 0 | − |
| C4 | Modeling mathematically | − | − | − | − | − | − | − | + | + | + | 0 |
| C5 | Representation | 0 | 0 | + | + | 0 | + | − | − | − | − | − |
| C6 | Symbols and formalism | 0 | 0 | 0 | 0 | 0 | − | − | 0 | 0 | 0 | − |
| C7 | Communication | − | − | − | − | − | − | − | − | − | − | − |
| C8 | Aids and tools | − | 0 | − | + | + | − | − | + | + | + | − |
| Statistics | Attn_ Lect | Attn_ Labs | A1_ 12 | A2_ 20 | CW1_ 30 | CW2_ 30 | Math_ An | Stat | Project | Exam |
|---|---|---|---|---|---|---|---|---|---|---|
| Mean | 6.87 | 5.63 | 6.65 | 12.46 | 10.07 | 7.88 | 8.67 | 1.76 | 2.48 | 12.91 |
| Median | 8.00 | 5.00 | 7.00 | 15.75 | 9.25 | 6.00 | 8.75 | 0.00 | 0.00 | 12.00 |
| Std. Deviation | 3.44 | 3.11 | 3.71 | 6.94 | 8.35 | 7.24 | 3.64 | 2.234 | 3.18 | 4.88 |
| Variance | 11.82 | 9.67 | 13.75 | 48.13 | 69.73 | 52.46 | 13.25 | 4.99 | 10.12 | 23.78 |
| Skewness | −0.81 | 0.19 | −0.32 | −0.90 | 0.51 | 0.44 | 0.12 | 0.81 | 0.86 | 1.14 |
| Std. Error of Skewness | 0.29 | 0.29 | 0.29 | 0.29 | 0.29 | 0.29 | 0.29 | 0.29 | 0.29 | 0.29 |
| Kurtosis | −0.72 | −1.38 | −0.85 | −0.79 | −0.68 | −1.12 | −1.018 | −0.91 | −0.79 | 1.85 |
| Std. Error of Kurtosis | 0.57 | 0.57 | 0.57 | 0.57 | 0.57 | 0.57 | 0.57 | 0.57 | 0.57 | 0.57 |
| Range | 10 | 10 | 12 | 19.5 | 30.0 | 22 | 2.0 | 0.00 | 10.0 | 25.0 |
| Minimum | 0 | 0 | 0 | 0.0 | 0.0 | 0 | 15.0 | 7.00 | 0.0 | 4.0 |
| Maximum | 10 | 10 | 12 | 19.5 | 30 | 22 | 8.7 | 1.76 | 10.0 | 29.0 |
| Statistic | Model | |||||
|---|---|---|---|---|---|---|
| M1 | M2 | M3 | M4 | M5 | M6 | |
| Terminal nodes | 13 | 9 | 22 | 10 | 9 | 19 |
| m1-m2 | 5-2 | 5-2 | 5-2 | 6-3 | 6-3 | 6-3 |
| Relative error | 0.321 | 0.333 | 0.335 | 0.310 | 0.319 | 0.325 |
| R2, Test | 0.621 | 0.683 | 0.678 | 0.698 | 0.690 | 0.685 |
| R2, Learn | 0.928 | 0.892 | 0.940 | 0.902 | 0.899 | 0.929 |
| RMSE, Test | 2.743 | - | - | 2.694 | - | - |
| RMSE, Learn | 1.298 | 1.588 | 1.188 | 1.517 | 1.616 | 1.291 |
| Theil’s UII | 0.0089 | 0.0133 | 0.0074 | 0.0121 | 0.0137 | 0.0088 |
| Predictors | CART Models | |||||
|---|---|---|---|---|---|---|
| M1 | M2 | M3 | M4 | M5 | M6 | |
| Project | 100 | 100 | 100 | 100 | 100 | 100 |
| Math_An | 95.25 | 93.76 | 95.27 | 93.25 | 93.08 | 94.15 |
| A2_20 | 54.34 | 50.52 | 54.59 | 52.80 | 50.52 | 54.17 |
| CW1_30 | 37.79 | 35.99 | 38.63 | 36.36 | 35.99 | 37.97 |
| A1_12 | 36.02 | 35.10 | 36.29 | 35.29 | 35.29 | 36.68 |
| Attn_Labs | 34.15 | 34.27 | 34.45 | 34.27 | 34.27 | 33.90 |
| CW2_30 | 22.66 | 19.72 | 23.31 | 22.12 | 19.72 | 22.84 |
| Stat | 21.74 | 20.28 | 21.57 | 22.04 | 20.28 | 21.58 |
| Attn_Lect | 6.23 | 5.03 | 6.90 | 6.26 | 5.03 | 6.39 |
| Statistic | CART Ensembles and Bagged Model | |||||||
|---|---|---|---|---|---|---|---|---|
| E1 Initial Tree | E2 | E3 | E4 Initial Tree | E5 | E6 | E7 | E8 | |
| Number of trees | - | 10 | 15 | - | 10 | 15 | 20 | 25 |
| m1-m2 | 6-3 | 6-3 | 6-3 | 5-2 | 5-2 | 5-2 | 5-2 | 5-2 |
| R2, Test | 0.845 | 0.886 | 0.897 | 0.845 | 0.916 | 0.922 | 0.883 | 0.807 |
| R2, Learn | - | 0.923 | 0.942 | - | 0.936 | 0.953 | 0.961 | 0.945 |
| RMSE, Test | 2.400 | 2.222 | 2.055 | 2.368 | 2.092 | 1.838 | 1.908 | 2.302 |
| RMSE, Learn | - | 1.724 | 1.583 | - | 1.610 | 1.370 | 1.278 | 1.368 |
| Theil’s UII | - | 0.0121 | 0.0132 | - | 0.0177 | 0.0104 | 0.0086 | 0.0098 |
| Statistic | MARS Model | ||
|---|---|---|---|
| MM1 | MM2 | MM3 | |
| Predictors | M1, E7 | M1, E6, E7 | M1, M4, E6, E7 |
| Number of BFs | 4 | 5 | 6 |
| Variable importance 2 | 23, 100 | 42, 29, 100 | 97, 0, 55, 100 |
| R2 Test | 0.960 | 0.956 | 0.954 |
| R2 Learn | 0.972 | 0.974 | 0.978 |
| GCV R2 | 0.958 | 0.960 | 0.960 |
| RMSE Test | 0.966 | 1.021 | 1.035 |
| RMSE Learn | 0.804 | 0.749 | 0.726 |
| Theil’s UII | 0.0034 | 0.0029 | 0.0028 |
Publisher’s Note: MDPI stays neutral with regard to jurisdictional claims in published maps and institutional affiliations. |
© 2020 by the authors. Licensee MDPI, Basel, Switzerland. This article is an open access article distributed under the terms and conditions of the Creative Commons Attribution (CC BY) license (http://creativecommons.org/licenses/by/4.0/).
Share and Cite
Gocheva-Ilieva, S.; Kulina, H.; Ivanov, A. Assessment of Students’ Achievements and Competencies in Mathematics Using CART and CART Ensembles and Bagging with Combined Model Improvement by MARS. Mathematics 2021, 9, 62. https://doi.org/10.3390/math9010062
Gocheva-Ilieva S, Kulina H, Ivanov A. Assessment of Students’ Achievements and Competencies in Mathematics Using CART and CART Ensembles and Bagging with Combined Model Improvement by MARS. Mathematics. 2021; 9(1):62. https://doi.org/10.3390/math9010062
Chicago/Turabian StyleGocheva-Ilieva, Snezhana, Hristina Kulina, and Atanas Ivanov. 2021. "Assessment of Students’ Achievements and Competencies in Mathematics Using CART and CART Ensembles and Bagging with Combined Model Improvement by MARS" Mathematics 9, no. 1: 62. https://doi.org/10.3390/math9010062