1. Introduction
Since the 1990s, the notion of a circular economy has been developing globally. It requires the utilization of natural resources on the basis of environmental protection, and the gradual transformation of economic activities towards ecologicalization. Its core idea emerged during the industrial revolution, and it has fundamentally changed the development mode of the traditional industrial economy [
1,
2,
3]. The industrial revolution has accelerated the development of human society and the economy at an unprecedented rate, continuously expanded the scale of production, dramatically promoted the use of new and effective technologies, and greatly improved people’s standard of living. However, with the acceleration of the industrialization process, some adverse impacts have also begun to appear, seriously threatening the human race’s survival and development [
4,
5]. Accordingly, people have started to reflect on the development mode of the traditional industrial economy, and pay attention to the relationship between the economy, environment, and natural resources. The circular economy can effectively alleviate the pressure caused by resource consumption and environmental pollution on social and economic development, in order to achieve a win–win situation between economic development and environmental protection [
6,
7,
8,
9]. Since the concept of sustainable development was put forward and developed, countries all over the world have been considering the development of a circular economy and the establishment of a circular society as an important means of achieving sustainable development [
10,
11].
When discussing how to enthusiastically promote the construction of an ecological civilization, the report of the 18th National Congress of the Communist Party of China pointed out that it is necessary to “develop a circular economy and promote the reduction, reuse, and utilization of resources during the processes of production, circulation, and consumption” [
12]. The 19th National Congress of the Communist Party of China regarded environmental and high-quality development as the main way of progressing in the new era, and the development of a circular economy was the inevitable choice for achieving this [
13]. As the core content of the development of an entire circular economy, an industrial circular economy requires a change in the traditional manufacturing method of “pollute first and clean up later”, or “high energy consumption but poor productivity output”. Instead, industrial waste generated during the process of industrial production should be put into use after the appropriate recycling treatment. As the development of an industrial circular economy can help promote the efficient recycling of resources, it is an important starting point for industrial transformation and upgrading, and represents a key factor that will lead to the development of a circular economy [
14,
15]. China has a large population, but a low per capita resources availability and utilization level. Furthermore, resource and environmental problems in China are complicated, with resource consumption and environmental pollution issues emanating mainly from industrial production. However, industrial production depends heavily on resource consumption. Therefore, only by promoting and implementing an industrial circular economy can these problems be fundamentally solved, and the goal of realizing an environmental and high-quality expansion of industry can be achieved [
16,
17]. China’s varying provinces (municipalities and autonomous regions) have successively implemented circular economy practices in the industrial field. However, because of the influence of factors such as the industrial scale, production technology, and economic level, the degree of the industrial circular economy development varies. Therefore, a feasible method is needed to measure the efficiency of the industrial circular economy, so as to guide its practice and promote its development.
The research object of the present study is 30 provinces, autonomous regions, and municipalities directly under the control of central government (Hong Kong, Macao, Taiwan, and Tibet were not included owing to lack of data). Quantitative analysis methods, such as data envelopment analysis (DEA), spatial autocorrelation analysis, and a Tobit regression, were applied to establish a measurement model and index system. We performed an integrated measurement and analysis of the tempo-spatial efficiency of China’s industrial circular economy, and further analyzed the relevant influencing factors. On the one hand, the present study can supplement and improve research on the topic of a circular economy, both theoretically and empirically, and enrich the theoretical content of human geography and sustainable development. Therefore, the present study has a certain theoretical significance. On the other hand, it can provide a scientific basis for China to further improve and upgrade the level of its industrial circular economy, narrow down regional gaps, and provide theoretical support and a decision-making basis for promoting the construction of an ecological civilization and the implementation of sustainable development strategies. Therefore, the present study also has an important practical significance.
The rest of the paper is structured as follows. The second part is a literature review, mainly from the two aspects of circular economy efficiency and influencing factors. The third part is the data and method; the index systems of industrial circular economy efficiency evaluation and influencing factors are constructed, and the calculation models used in this study are introduced. The fourth part is the results and analysis, mainly including the overall evaluation, spatial analysis, and influencing factors. The fifth part is the conclusion of this study.
2. Literature Review
2.1. The Efficiency of the Circular Economy
The evaluation of the efficiency of the circular economy abroad mainly focuses on two aspects; namely, a material flow analysis and ecological efficiency evaluation. In the early 1990s, Germany, Japan, the United States (USA), and many other countries conducted a material flow analysis in their respective economic systems. Subsequently, Eurostat promoted the material flow analysis method, which enabled the continuous expansion of research on this subject. For example, Sevigne-Itoiz et al. [
18] used a material flow analysis to quantitatively analyze the paper recycling efficiency in Spain. Moreover, Cordova-Pizarro et al. [
19] applied the material flow analysis method to quantitatively analyze a mobile phone electronic waste disposal program. Using the material flow analysis method, Van Eygen et al. [
20] conducted a quantitative study on the waste management system of Austrian plastic packaging. Angouria-Tsorochidou et al. [
21] used the material flow analysis method to analyze and map the life cycle stages of Danish electronic products, and performed a preliminary assessment. Putri et al. [
22] used the material flow analysis method to analyze the amount of plastic waste recycled in Jakarta, Indonesia. Methods commonly used to assess eco-efficiency mainly include ecological footprint analysis, life cycle analysis, the Delphi method, and DEA. For instance, Mikulčić et al. [
23] used the ecological footprint method to measure the ecological efficiency of manufacturing different cements in a specific cement plant. Onat et al. [
24] applied a life cycle analysis to quantify the eco-efficiency of the electric vehicle industry across all 50 states in the USA. Koskela [
25] used the Delphi method to measure the ecological efficiency in the Finnish forest industry. Deilmann et al. [
26], Pais-Magalhães et al. [
27], and Moutinho et al. [
28] applied the DEA model to evaluate the ecological efficiency in different countries or regions.
The domestic assessment of the efficiency of the circular economy mainly focuses on macro levels (e.g., social aspects), meso levels (e.g., industrial aspects), and micro levels (e.g., industrial park or enterprise aspects). At macro levels (e.g., social aspects), Li et al. [
29], Chen [
30], and Li et al. [
31] applied the DEA model to assess the efficiency of the circular economy across 30 provinces in China. At meso levels (e.g., industrial aspects), Wang et al. [
32], Wan et al. [
33], and Shao et al. [
34] used DEA models to evaluate the efficiency of the circular economy of China’s steel, agricultural, and thermal power industries. At micro levels (e.g., industrial park or enterprise aspects), Liu [
35], Du et al. [
36], and Zhu et al. [
37] selected different steel or cement companies as the research objects, and applied DEA models to assess their respective efficiency regarding the circular economy.
2.2. The Influencing Factors of a Circular Economy
Foreign studies on the influencing factors of a circular economy mostly focus on the aspect of resource recycling and utilization at the individual, family, community, and regional levels. At the individual and family levels, Akil et al. [
38] analyzed the influencing factors of waste recycling in 600 households in Malaysia. Mahmud [
39] analyzed the impacts of three influencing factors, namely, specific attitudes, subjective norms, and perceived behavior control, on the recycling behavior of middle school students in Malaysia. Khan et al. [
40] selected 243 residents of a Pakistani metropolis as the research objects, and analyzed the influencing factors that affected their plastic waste recycling behavior. At the community and regional levels, Starr et al. [
41] analyzed the influencing factors of municipal recycling in Massachusetts, USA. Lakhan [
42] analyzed the influencing factors that affected solid waste recycling in Ontario, Canada. Tausova et al. [
43] analyzed the influencing factors that affected waste recycling in 36 European countries. Besides, some machine methods and big data analysis [
44,
45,
46] are also gradually applied to the influencing factors of a circular economy. Kannangara et al. [
47], through two machine learning algorithms, predict the generation and transfer of municipal solid waste in Canada to reduce the impact on the urban environment. Straka et al. [
48], through the big data analysis to carry out the appraisal of the complete recycling of waste goods, has analyzed the most important part of waste production, in order to reduce the impact on the environment.
Domestic research on the influencing factors of a circular economy is generally grouped into qualitative and quantitative aspects. In the early years, relevant research was predominantly quantitatively oriented. In recent years, however, the focus has switched to a quantitative analysis. In terms of a qualitative analysis, Cao et al. [
49] analyzed obstacles to the development of the circular economy in some of China’s underdeveloped areas. Xiang et al. [
50] analyzed the main influencing factors that affected the development level of the circular economy of the urban agglomeration on the Yangtze River Delta. Chen et al. [
51] analyzed the restrictive factors that affected the development of the industrial circular economy in the Fujian province from the aspects of endogenous power and external guarantee. In recent years, a large number of studies that have quantitatively analyzed the influencing factors that affect the circular economy have emerged in China. Liu [
52] analyzed the influencing factors that affected the efficiency of China’s circular economy, while Huang et al. [
53] analyzed the influencing factors that affected the efficiency of western China’s circular economy. Zhi et al. [
54] analyzed the influencing factors that affected the efficiency of the recycling economy of Zhejiang’s manufacturing industry. Chu [
55] analyzed the influencing factors that affected the efficiency of China’s manufacturing circular economy. At present, some new methods have also made great progress in the influencing factors of a circular economy. Li et al. [
56] apply big data to the integration of renewable resources industry and analyze the main influencing factors of the development of the existing recycling system. Zheng et al. [
57], through the big data and cloud computing to realize the big data application wisdom of the cloth grass washing industry, reduce the emission to the environment.
Overall, the extant studies have yielded fruitful results, but there are some deficiencies. First of all, with the help of geographic information systems (GIS) technology and the application of the spatial analysis model and DEA method, spatio-temporal integrated measurement research that tests the evolution patterns and characteristics of the efficiency of the industrial circular economy from both spatial and temporal dimensions is still lacking. Secondly, with the help of mathematical models, comprehensive analytic research that tests the efficiency of the industrial circular economy from different perspectives is still in its preliminary exploration stage. Therefore, the present study can close this knowledge gap. In this study, through the integration of GIS technology and the spatial analysis model, DEA model, and Tobit regression model, a measure model and index system are constructed, in order to carry out a multi-angle comprehensive study integrating the efficiency evaluation, spatial analysis, and influencing factors analysis of China’s industrial circular economy. It is an important innovation, as well as an important contribution to the existing research system.
3. Data and Method
Three methods are used in this study: DEA model, spatial autocorrelation analysis, and Tobit regression model. The DEA model is an effective non-parametric efficiency evaluation method that can deal with multiple inputs and outputs at the same time. It has become the main tool of efficiency evaluation. The non-radial and non-angle slack-based model with undesirable outputs (SBM-Undesirable) model based on the traditional DEA model can fully consider the slackness of inputs and outputs, and can deal with undesirable outputs. The index system of industrial circular economy efficiency evaluation in this study includes undesirable outputs, so it is reasonable to use the SBM-Undesirable model to carry out China’s industrial circular economy efficiency evaluation, which is in accordance with the application scope of this method. Spatial autocorrelation analysis refers to the potential interdependence between the observed data of some variables in the same distribution area, which can be divided into global spatial autocorrelation and local autocorrelation. Spatial autocorrelation is used to analyze the distribution of industrial circular economic efficiency from the whole and the local, which is reasonable and in line with the application scope of the method. Tobit regression model is an econometric model. It requires that the explained variables are truncated and discontinuous, so it is also called the truncated regression model. The industrial circular economy efficiency measured by the SBM-Undesirable model is between 0 and 1, which is truncated data. Therefore, it is reasonable to select the Tobit regression model to study the influencing factors, which is in accordance with the application scope of this method.
The flow chart of this study is given (
Figure 1). First, the object and content, the methods, and the purpose and significance of the research are determined. Then, the index system is determined and the data are collected and processed to measure the efficiency of China’s industrial circular economy from both spatial and temporal dimensions. The SBM-Undesirable model is used to calculate the efficiency value of China’s industrial circular economy from 2005 to 2018, and the time series analysis of industrial circular economy efficiency is carried out. On the basis of the efficiency values measured by the SBM-Undesirable model, spatial autocorrelation analysis is employed to measure the global and local Moran index, in order to perform spatial analysis of industrial circular economy efficiency. Finally, the influencing factors of the industrial circular economy efficiency are taken as the explanatory variables, and the efficiency of the industrial circular economy is taken as the explained variables, so the regression results are measured by the Tobit regression model. Then, the influencing factors of industrial circular economy efficiency are analyzed.
In 64-bit WINDOWS system and Intel(R)Core(TM) I7-8565U CPU: 1.8 ghz and 8 G memory. The analysis work of the SBM-Undesirable model was performed by DEA SLOVER PRO 5.0. The analysis work of spatial autocorrelation was performed by GeoDa 1.12. The analysis work of the Tobit regression model was performed by State MP 14.
3.1. The Index System and Data Sources
On the basis of the existing research results [
58,
59,
60], and by considering the 3R principle in any recycling economy, namely, reduction, reuse, and recycle, as well as considering China’s industrial development features, input indicators were selected from the aspects of energy, resources, capital, and labor. In terms of energy input, the typical index of comprehensive energy consumption of industrial added value per ten thousand yuan is selected, which is the amount of consumed energy for per ten thousand yuan of industrial added value. In terms of resource input, the typical index of comprehensive water consumption of industrial added value per ten thousand yuan is selected, which is the amount of consumed water for per ten thousand yuan of industrial added value. In terms of capital input, the typical index of input in industrial fixed assets is selected, which is the workload to build and purchase fixed assets and the related cost changes. In terms of labor input, the number of industrial employees is selected, which is the total amount of employees engaged in industrial work. Output indicators were selected from the aspects of economic output, recycling output, and undesired output. In terms of economic output, the typical index of industrial added value is selected. This index refers to the final results of industrial production activities expressed in monetary form during the reporting period. In terms of recycling output, the rate of industrial water reuse and comprehensive utilization rate of industrial solid waste are selected. The rate of industrial water reuse is the ratio of the reused water used in the industrial production process to the total water consumption, and the comprehensive utilization rate of industrial solid waste is the ratio of the comprehensive utilization of industrial solid waste to the production of industrial solid waste. In terms of undesired output, the amount of industrial wastewater discharge, the amount of industrial exhaust emission, and the amount of industrial solid waste discharge are selected. The amount of industrial wastewater discharge is the total amount of discharged industrial wastewater during the industrial production process. The amount of industrial exhaust emission is the total amount of pollutant containing gases discharged into the air during the industrial production process. The amount of industrial solid waste discharge is the total amount of solid waste discharged outside the prevention and control facilities of solid waste pollution during the industrial production process. In the end, accordingly, the efficiency evaluation index system of China’s industrial circular economy was established (
Table 1).
Furthermore, based on existing research results [
61,
62], and by considering the characteristics of China’s industrial development, the index system of influencing factors that affect the efficiency of China’s industrial circular economy was established, and relevant indicators were selected based on the aspects of the economic level, scientific and technological innovation, openness to the outside, government regulation, industrialization level, and industrial aggregation (
Table 2).
The present study is based on data collected between 2005 and 2018, all of which were obtained from the China Statistical Yearbook, China Environmental Statistics Yearbook, China Industrial Statistical Yearbook, statistical yearbooks of various provinces (autonomous regions and municipalities directly under the central government), the National Economic and Social Development Statistical Bulletin, environmental bulletins, and other relevant statistical materials and documents. The original data are provided in the
Supplementary Materials (Tables S1 and S2). The data between 2005 and 2018 are selected to carry out the research. This is because, in view of the current situation, part of the statistical data in 2019 has not been published, so it cannot be fully obtained. The data in 2020 have not been formed. Therefore, we used the latest data available at present, which is sufficient to reveal the evolution rule and characteristics of the latest industrial circular economy efficiency. On the basis of this data set, the results and conclusions obtained are up to date and reliable. In addition, the research results and conclusions are based on the analysis of a large number of data for many years, which reflects a general long-term evolution rule and trend. Therefore, the lack of statistical data in individual years, such as the current year, cannot have a significant and substantive impact on the research results and conclusions.
3.2. Research Method
3.2.1. The DEA Model
In the present study, a slack-based model with undesirable outputs (SBM-Undesirable) is selected to measure the efficiency of China’s industrial circular economy, with specific principles as follows [
63,
64]. Assuming that there are n decision making units in the industrialization system, m input indicators within each decision making unit, s
1 expected outputs, and s
2 unexpected outputs. These three element vectors are
, with corresponding vector matrices defined as follows:
The production set of all possible decision making units is as follows:
The mathematical form of the model is as follows:
In which represent the slack variable of input, expected output, and undesirable output, respectively; represent the corresponding vectors; λ is the weighted vector; and is the objective function of the model, with . When , , suggesting that the decision-making unit is valid. When , one of is not zero, suggesting that the decision-making unit is invalid, and there is room for input or output improvement. is the constraints of the objective function and are the vectors of input, expected output, and non-expected output indicators.
3.2.2. The Spatial Autocorrelation Analysis
A spatial autocorrelation model was applied to analyze the spatial pattern of efficiency with regard to China’s industrial circular economy. Furthermore, the global Moran’s I was used to determine whether a statistical aggregation or dispersion exists in the entire region, with the formula as follows [
65]:
where
,
;
is the number of evaluation objects;
are the attribute values of evaluation objects
and
, respectively; and
is the spatial weight matrix.
The local Moran’s I index is used to reflect the dependence and heterogeneity of the efficiency of the industrial circular economy at the local level, and to explore the characteristics and patterns of the local spatial autocorrelation. The formula is as follows [
66]:
where
,
;
is the number of evaluation objects;
are the attribute values of evaluation objects
and
, respectively; and
is the spatial weight matrix.
According to the calculation results, four types of spatial autocorrelation can be classified, namely, high-high (H-H), low-high (L-H), high-low (H-L), and low-low (L-L), among which H-H and L-L represent types of positive spatial autocorrelation, while L-H and H-L represent types of negative spatial autocorrelation.
3.2.3. The Tobit Regression Model
In this study, the Tobit regression model is applied to analyze the influencing factors that affect the efficiency of China’s industrial circular economy. The standard form is as follows [
67,
68]:
where
is the latent dependent variable,
is the final dependent variable,
is the independent variable vector,
β is the coefficient vector, and
is the error term.
4. Results and Analysis
4.1. An Efficiency Evaluation of China’s Industrial Circular Economy
4.1.1. The Efficiency of China’s Industrial Circular Economy
The integrated efficiency of China’s industrial circular economy generally shows a trend of increasing first and then decreasing, reaching a maximum of 0.727 in 2011 and a minimum of 0.595 in 2005 (
Table 3). On the whole, the development is relatively stable. The 14-year average of the integrated efficiency of China’s industrial circular economy is 0.654, which is far from the production frontiers, suggesting that the integrated efficiency of China’s industrial circular economy is not high, and there is still a lot of room for improvement. The trend of pure technical efficiency is similar as integrated efficiency, reaching a maximum of 0.759 in 2011 and a minimum of 0.655 in 2006, with a mean of 0.699 in 14 years. The scale efficiency is always higher than the pure technical efficiency and integrated efficiency, and always maintains about 0.9, close to the level of 1; the average value of 14 years is 0.931. Overall, the scale efficiency is the highest, followed by pure technical efficiency, whereas the level of integrated efficiency is the lowest. It can be seen that, with regard to the industrial circular economy, the level of technical investment is insufficient. Therefore, the increasing of technical investment and the improvement of technology and management could greatly promote the integrated efficiency of China’s industrial circular economy.
4.1.2. The Efficiency of the Industrial Circular Economy in Three Major Regions (the East, Middle, and West Regions)
The present study divides China’s 30 provincial administrative regions into three major regions, including the eastern, middle, and western regions [
69] (
Table 4).
Between 2005 and 2018, the integrated efficiency of the industrial circular economy in the eastern region was relatively high, the change was relatively stable, and the efficiency value was always greater than 0.8. The integrated efficiency of the industrial circular economy in the middle and western regions rose first and then decreased; the integrated efficiency value reached its maximum in 2011, and developed steadily after 2016. The integrated efficiency values from high to low are in the eastern, western, and middle regions. The integrated efficiency of the industrial circular economy in the eastern region is higher than the national average, whereas the integrated efficiency of the industrial circular economy in the middle and western region is lower than the national average (
Figure 2). According to the average efficiency of the three regions, for integrated efficiency, the national and eastern, middle, and western regions are 0.654, 0.896, 0.455, and 0.556, respectively. For pure technical efficiency, the national and eastern, middle, and western regions are 0.699, 0.915, 0.483, and 0.641, respectively. For scale efficiency, the national and eastern, middle, and western regions are 0.931, 0.974, 0.944, and 0.877, respectively (
Table 5). The pure technical efficiency and scale efficiency of the industrial circular economy in the eastern region is higher than that of the middle and western region, as well as the national average. By contrast, the pure technical efficiency of the middle and western region is lower than the national average. The eastern region has a high economic level, rapid level of industrial technology updates, and advanced development strategies. It has transformed from a traditional industrial development mode towards a new mode with low energy consumption, moderate pollution, and high output. Consequently, it has a relatively high level of industrial circular economy efficiency.
4.1.3. The Efficiency of the Industrial Circular Economy in Provincial Administrative Regions
In terms of temporal evolvement, it can be roughly divided into the following three categories. The first indicates that the integrated efficiency values from 2005 to 2018 are always 1, including Beijing, Tianjin, Shanghai, Zhejiang, Shandong, Guangdong, Hainan, and Ningxia. The second category indicates that the integrated efficiency values are valid for some years from 2005 to 2018, which are divided into three sub-types: fluctuat rise, fluctuat fall, and first rise and then fall. The integrated efficiency values in Shaanxi and Jiangsu show an upward trend of fluctuation. It was between 0.457 and 0.705 from 2005 to 2011 in Shaanxi, and integrated efficiency values have been effective since 2012. In Jiangsu, the integrated efficiency value rose from 0.748 to 1, then the integrated efficiency value remained effective. It shows a trend of fluctuat fall in Xinjiang. The integrated efficiency value rose sharply from 0.448 to 1 between 2005 and 2006, then fell gradually to 0.361; there is a downward trend overall. In Inner Mongolia, Liaoning, and Qinghai, the integrated efficiency values increased first and then decreased. In Inner Mongolia, the integrated efficiency value rose from 0.426 to 1 first, then the integrated efficiency value remained effective, and a gradual decline began in 2016. In Liaoning, the integrated efficiency value rose from 0.613 to 1 first, then the integrated efficiency value remained effective, and a gradual decline began in 2015. In Qinghai, it first rose from 0.351 to 1, and then fell down. The third category indicates that the integrated efficiency values are not effective between 2005 and 2018, and there is no obvious upward or downward trend, which show fluctuation. It includes 16 provinces of Hebei, Shanxi, Jilin, Heilongjiang, Anhui, Fujian, Jiangxi, Henan, Hubei, Hunan, Guangxi, Chongqing, Sichuan, Guizhou, Yunnan, and Gansu (
Table 6).
From the ranking of integrated efficiency average, the average integrated efficiency of the industrial circular economy in Beijing, Tianjin, Shanghai, Zhejiang, Shandong, Guangdong, Hainan, Ningxia, Jiangsu, and Inner Mongolia ranked in the country’s top 10, and their efficiency values were all greater than the national average. The integrated efficiency values of Beijing, Tianjin, Shanghai, Zhejiang, Shandong, Guangdong, Hainan, and Ningxia were always 1, suggesting that the integrated efficiency of the industrial circular economy in these provinces had reached the optimal level. Shaanxi, Liaoning, Fujian, Qinghai, Henan, Jilin, Hebei, Xinjiang, Hubei, and Chongqing ranked in the middle 10 in terms of the integrated efficiency of the industrial circular economy, among which the integrated efficiency of Shaanxi and Liaoning was greater than the national average, and the integrated efficiency in some years had reached the maximum level. By contrast, the average integrated efficiency of the remaining eight provinces was less than the national average. The average integrated efficiency in Fujian is 0.609 as the maximum, and the average integrated efficiency in Chongqing is 0.495 as the minimum. Shanxi, Heilongjiang, Guangxi, Sichuan, Gansu, Anhui, Hunan, Guizhou, Yunnan, and Jiangxi ranked in the bottom 10 with regard to the integrated efficiency of the industrial circular economy, and their average integrated efficiency was less than the national average. The average integrated efficiency in Shanxi was 0.472 as the maximum, and that in Anhui, Jiangxi, Hunan, Guizhou, Yunnan, and Gansu provinces was less than 0.4. It is suggested that these provinces’ industrial circular economies had a low level of efficiency, and should receive more attention. In general, the integrated efficiency of China’s industrial circular economy varies significantly across the provinces. Those provinces with a relatively high level of industrial circular economy efficiency are mostly located in the eastern coastal areas, while those with a relatively low level are mostly located in the middle and western inland regions.
4.2. A Spatial Analysis of the Industrial Circular Economy’s Efficiency
4.2.1. A Global Spatial Autocorrelation Analysis
The global Moran’s I index of the integrated efficiency of China’s industrial circular economy was calculated between 2005 and 2018 (
Table 7). The index values over these years were all positive, and the z-test values were all greater than the test critical value of 1.96, which were statistically significant at the 5% level. It can be seen that the efficiency of China’s industrial circular economy exhibits a positive spatial autocorrelation, and it shows certain aggregation characteristics on the provincial level. In other words, the efficiency of the industrial circular economy is not randomly distributed, but exhibits a high (low) regional spatial aggregation pattern. Provinces with a high level of industrial circular economy efficiency tend to be adjacent to similar ones, as do those with a low level. It can be seen from the changing trend of the global Moran’s I index that the index values showed a fluctuating pattern. The index reached a maximum of 0.72990 in 2007, and a minimum of 0.30843 in 2014. It can be roughly divided into three stages. The first phase was between 2005 and 2007—the index fell first and then rose, and it showed that the spatial agglomeration distribution of industrial circular economy efficiency in early years was unstable. During the second phase, the index showed a downward trend between 2007 and 2014, and it showed that the spatial agglomeration degree of industrial circular economy efficiency was weakened. During the third phase, the index showed an upward trend first and was then steady between 2014 and 2018, and it showed that the spatial agglomeration degree of industrial circular economy efficiency increased gradually and then developed smoothly. Overall, the spatial autocorrelation degree of China’s industrial circular economy efficiency is unstable. In other words, the degree of spatial aggregation and distribution of provinces with a high or low industrial circular economy efficiency displayed certain fluctuations.
4.2.2. A Local Spatial Autocorrelation Analysis
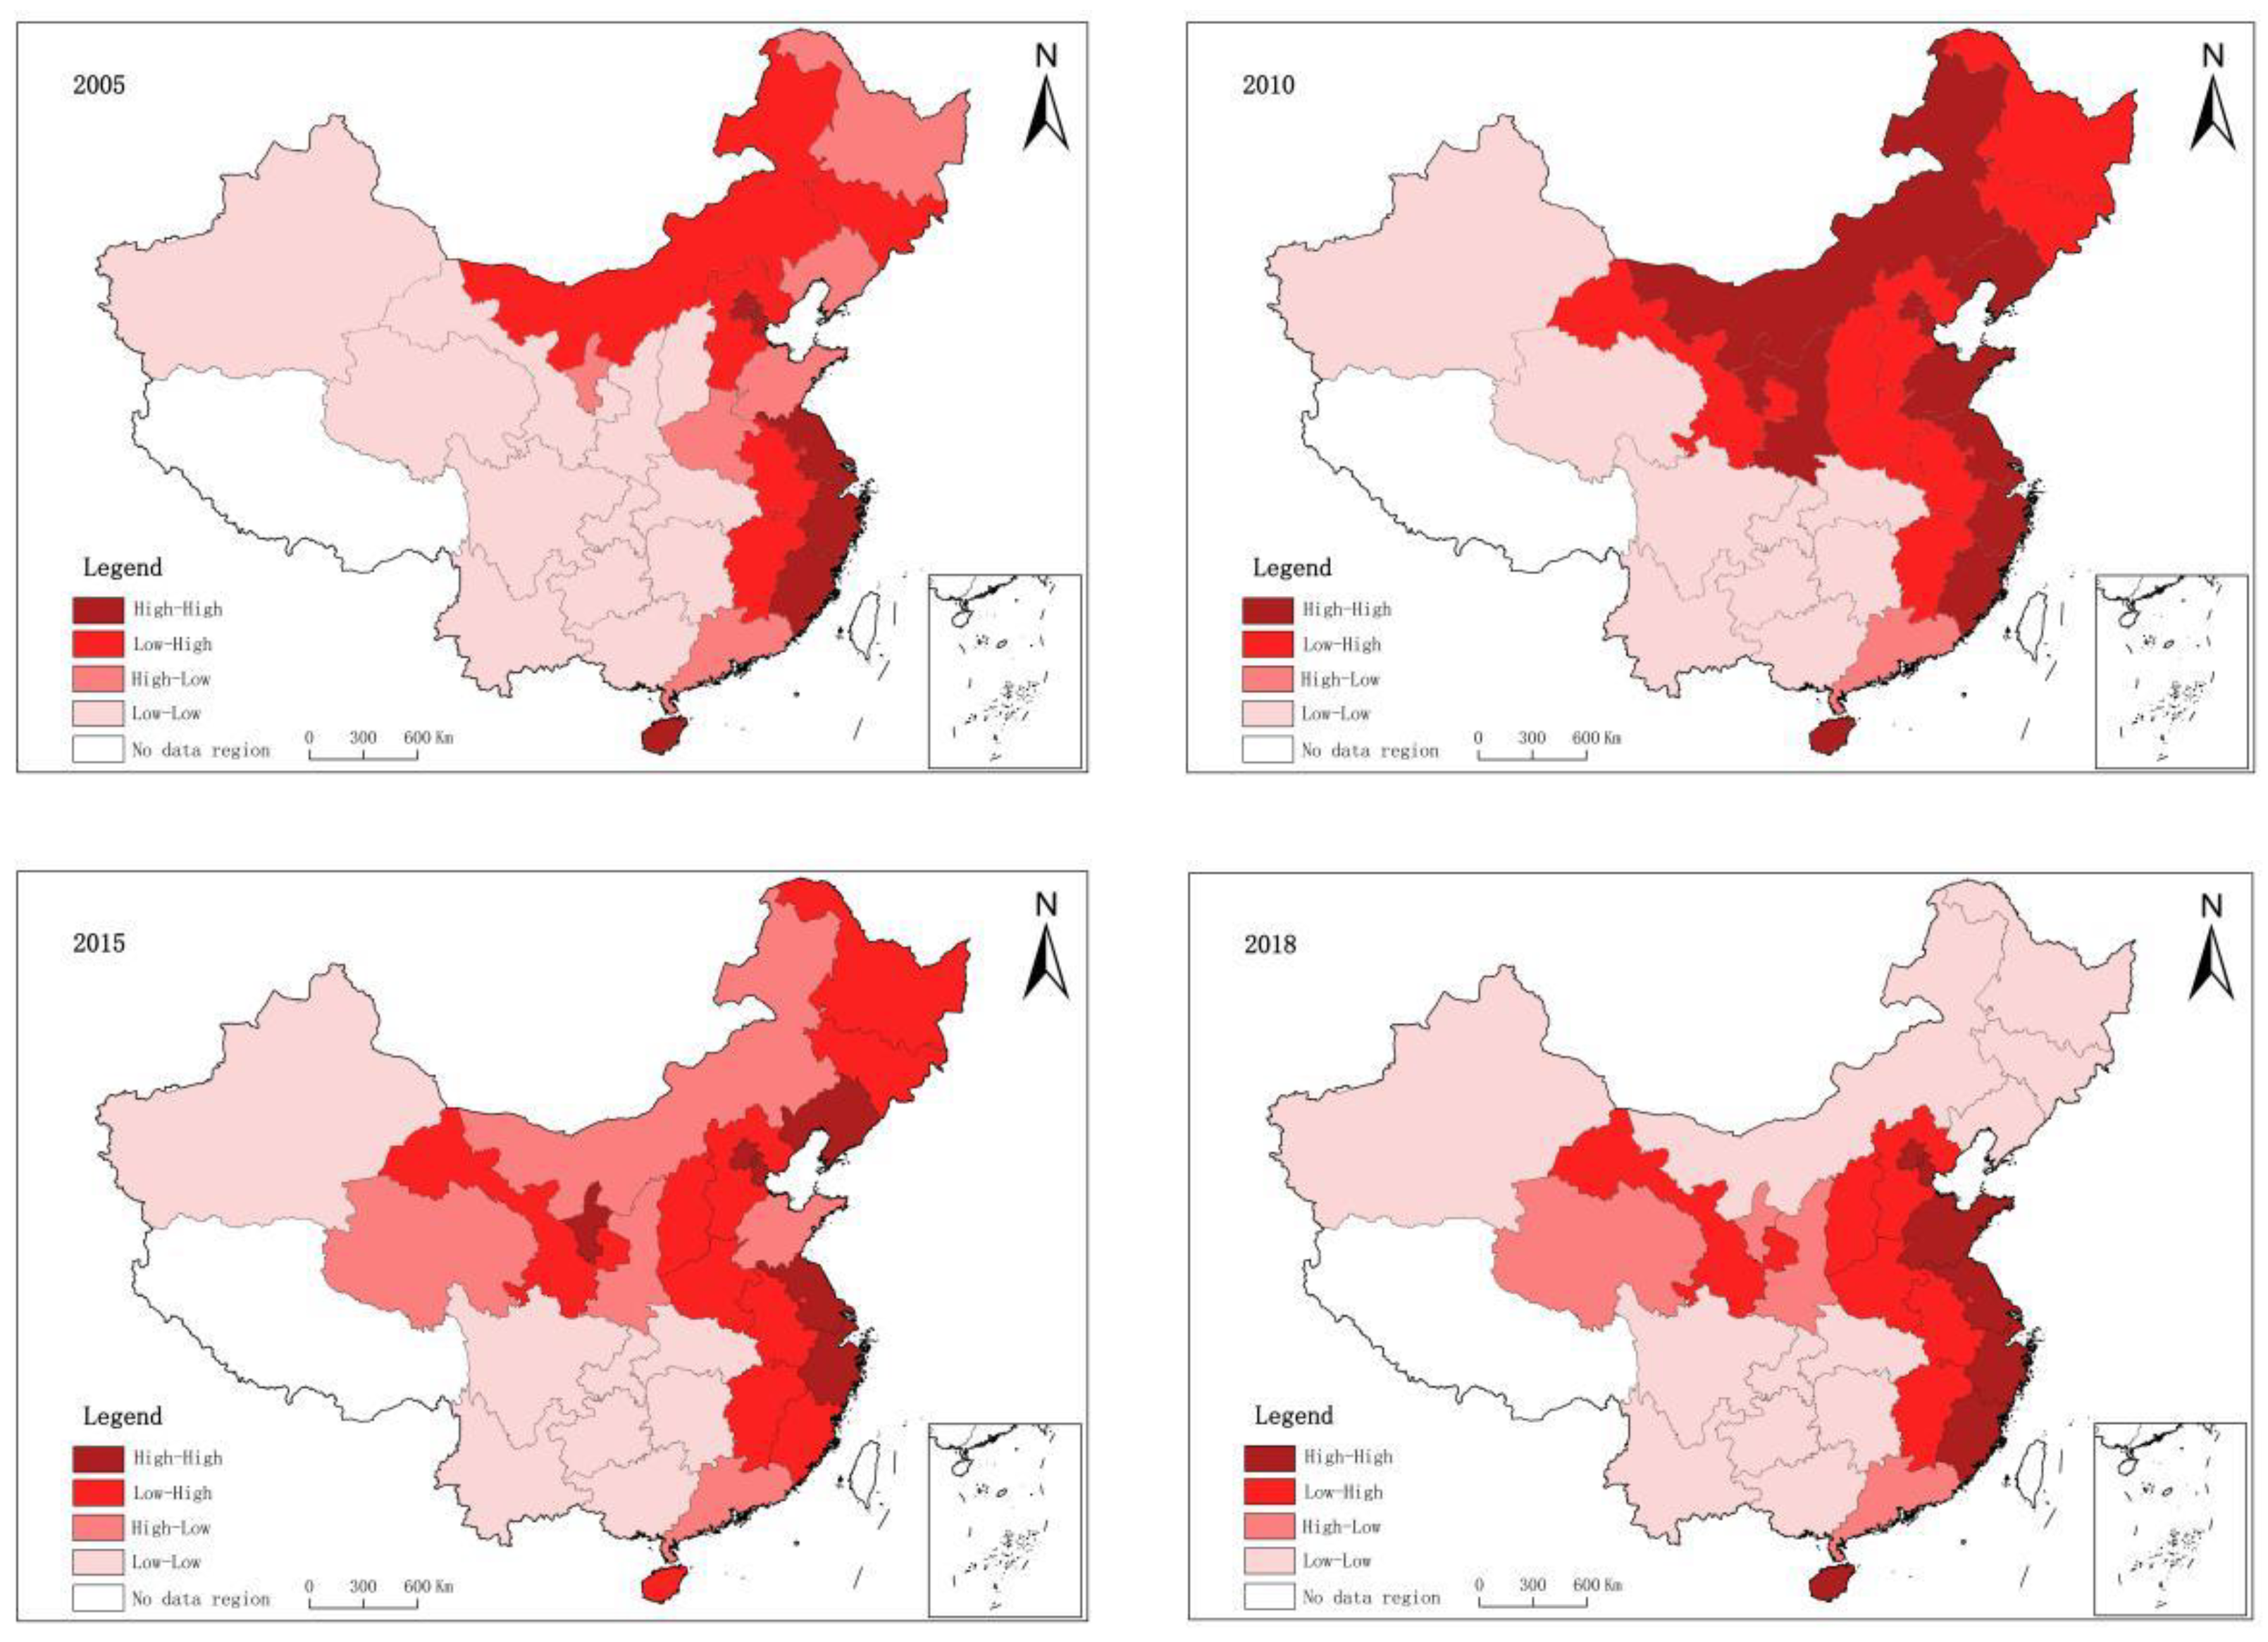
The present study selected the years of 2005, 2010, 2015, and 2018, and performed a local spatial autocorrelation analysis with regard to the efficiency of China’s industrial circular economy. We measured the degree of correlation between the attribute value of each spatial unit and the attribute value of its neighboring spatial units, so that local spatial relationships could be displayed and distribution characteristics could be revealed at the local scale (
Figure 3).
(1) In 2005, 19 provinces displayed a positive spatial correlation pattern, which accounted for 63.3% of the total, whereas 11 provinces displayed a negative spatial correlation pattern, which accounted for 36.7% of the total. The number of provinces that belonged to the “high-high”, “low-low”, “low-high”, and “high-low” types was 7, 12, 5, and 6, respectively. In general, the pattern of a positive spatial correlation was dominant, suggesting that the efficiency of China’s industrial circular economy displays obvious spatial aggregation patterns. (2) In 2010, 21 provinces displayed a positive spatial correlation pattern, which accounted for 70% of the total, whereas 9 provinces displayed negative spatial correlations, which accounted for 30% of the total. The number of provinces that belonged to the “high-high”, “low-low”, “low-high”, and “high-low” types was 12, 9, 8, and 1, respectively. In general, the pattern of a positive spatial correlation was dominant; the number of provinces that belonged to the “high-high” type kept increasing, and that belonging to the “low-low” type kept decreasing. This suggests that the high-value aggregation range of China’s industrial circular economy efficiency has expanded, whereas the low-value aggregation range has shrunk. (3) In 2015, 16 provinces displayed a positive spatial correlation pattern, which accounted for 53.3% of the total, whereas 14 provinces displayed a negative spatial correlation pattern, which accounted for 46.7% of the total. The number of provinces that belonged to the “high-high”, “low-low”, “low-high”, and “high-low” types was 8, 8, 9, and 5, respectively. In general, the number of provinces that belonged to the “high-high” and “low-low” types kept decreasing, suggesting that the degree of spatial aggregation of China’s industrial circular economy efficiency has weakened. (4) In 2018, 20 provinces displayed a positive spatial correlation, accounting for 66.7%, whereas there was a negative spatial correlation within 10 provinces, which accounted for 33.7% of the total. The number of provinces that belonged to the “high-high”, “low-low”, “low-high”, and “high-low” types was 8, 12, 6, and 4, respectively. Overall, the number of provinces belonging to the “high-high” type remained unchanged, while that belonging to the “low-low” type kept increasing, suggesting that China’s industrial circular economy has expanded its low-efficiency aggregation scope. Generally speaking, the spatial positive correlation type is dominant, and the efficiency of China’s industrial circular economy exhibits obvious characteristics of a spatial aggregation, including clear spatial dependence and spatial heterogeneity. High-value aggregation areas are mainly distributed in the eastern coastal areas, and low-value aggregation areas are concentrated and contiguously distributed in the middle and western inland areas, with transition zones in between. The efficiency of China’s industrial circular economy is generally high in the east and low in the west, and gradually decreases from the east coast towards the middle and western inlands, demonstrating an east-west spatial distribution pattern.
4.3. An Analysis of the Influencing Factors that Affect the Efficiency of the Industrial Circular Economy
In the present study, the integrated efficiency of the industrial circular economy was used as the explained variable, and all influencing factors were treated as the explanatory variables. The Tobit regression model was used to perform a regression analysis, with the results shown in
Table 8. Among them, the regression coefficient represents the influence degree of independent variable x on dependent variable y. The larger the regression coefficient, the greater the influence of x on y. The smaller the regression coefficient, the smaller the influence of x on y. The positive regression coefficient means that y increases as x increases, while the negative regression coefficient means that y decreases as x increases. The standard error is a measure of the dispersion degree of the data. The larger standard error indicates that the difference between the value and the average value is large, and the smaller standard error means that the value is closer to the average value. Z is the test statistic. P is the significance level. It can be seen that the regression coefficients of the economic level, openness to the outside, government regulation, and industrialization aggregation were positive and statistically significant at the 1% level, suggesting that they have a significantly positive impact on the efficiency of the industrial circular economy. The regression coefficient of openness to the outside is about 0.6674, and the regression coefficient of economic level is about 0.1826 (
Table 8). It can be seen that openness to the outside and economic level are the two factors that have the greatest positive impact on the efficiency of the industrial circular economy. The regression coefficient of the industrialization level was −0.0054, and it was statistically significant at the 1% level, suggesting that it has a significant negative impact on the efficiency of the industrial circular economy. The regression coefficient of scientific and technological innovation was not statistically significant, suggesting that such innovation did not have a significant impact on the improvement of the industrial circular economy’s efficiency.
The higher the economic level, the more financial support can be provided for the development of the industrial circular economy, the more outstanding talents can be attracted, and the more advanced technologies can be obtained in order to improve the efficiency of the industrial circular economy. Therefore, the economic level exerts a positive impact on the improvement of the industrial circular economy’s efficiency. The higher the degree of openness to the outside, the more new ideas, new products, and new technologies can be introduced to the field of the circular economy, thereby stimulating the development of the industrial circular economy and promoting its efficiency. Therefore, the factor of openness to the outside exerts a positive impact on the improvement of the industrial circular economy’s efficiency. The higher the level of government regulation (i.e., industrial pollution control investment as a percentage of regional gross domestic product (GDP)), the more government pays attention to industrial pollution issues (e.g., an increase in pollution control investment), which, undoubtedly, would help reduce pollution and promote resource recycling. Therefore, government regulations exert a positive impact on the improvement of the industrial circular economy’s efficiency. The higher the level of industrial aggregation, the more it helps to save production costs, promote waste recycling, and reduce resource consumption and pollutant emissions, and thus greatly improve the industrial circular economy’s efficiency. Therefore, industrial aggregation exerts a positive impact on the improvement of the industrial circular economy’s efficiency. The higher the level of industrialization, the greater the demand for resources, which results in a significant increase in resource consumption and pollutant emissions. Obviously, this hampers the improvement of the industrial circular economy’s efficiency. Therefore, the industrialization level exerts a negative impact on the industrial circular economy’s efficiency. The impact of scientific and technological innovations on the industrial circular economy’s efficiency is not significant, suggesting that such innovations do not play an important role in affecting the industrial circular economy’s efficiency, probably because they have not been fully utilized.
In recent years, other scholars have also conducted similar research and obtained corresponding results. For example, Tang et al. [
70] calculated the comprehensive efficiency of China’s industrial circular economy using the method of combining the global entropy and coefficient of variation, and achieved results similar to this paper. It is believed that the overall efficiency of China’s industrial circular economy develops fastest in the eastern region, followed by the middle and the western region. Xiao [
71] used the DEA model to measure the development efficiency of the circular economy in China, and achieved results similar to this paper. It is believed that the development efficiency of the circular economy in eastern China was significantly higher than in the middle and western regions. Liu et al. [
72] took Handan City as the research area, and used the DEA model to evaluate the development efficiency of the circular economy in the recent ten years. It is considered that the development status of the circular economy is relatively good. Li et al. [
73] used GeoDA software to analyze the spatial distribution characteristics of China’s industrial eco-efficiency, and achieved results similar to this paper. It can be seen that the efficiency exhibits a positive spatial autocorrelation. Rajput et al. [
74] used the principal component analysis method to analyze the main factors affecting the efficiency of industrial circular economy. It is believed that technology, services, and policies were important factors affecting the efficiency of the industrial circular economy. Robaina et al. [
75] took EU countries as the research area, and used cluster analysis to estimate the main determinants of the European circular economy. It is considered that resource productivity is an important indicator that affects the efficiency of the circular economy. Yang et al. [
76] took Hunan as the research area, and used the DEA model to evaluate the industrial ecological efficiency, as well as multiple linear regression to analyze the main influencing factors. It is believed that the economic development and total capital were the main factors to improve the efficiency. It can be seen that, in the existing research, there is still a lack of research on the spatio-temporal integrated measurement and influencing factors analysis for the efficiency of China’s industrial circular economy. This study can make up for this deficiency. This research uses the integration of a variety of technical methods, including GIS technology and the spatial analysis model, DEA model, and Tobit regression model, to carry out a multi-angle comprehensive study integrating the efficiency evaluation, spatial analysis, and influencing factors analysis of China’s industrial circular economy. It can supplement and improve the existing research system. This is the important value of this study, and it is also the important contribution to the research field of the circular economy. However, there are still some limitations in this study. Because this study is only carried out at the provincial level, it cannot reveal the differences within the provinces, which can be improved further in future research.
5. Conclusions
In general, between 2005 and 2018, the overall level of China’s industrial circular economy’s efficiency was not high, and there was still a lot of room for improvement. The integrated efficiency of the industrial circular economy in the eastern region was relatively high, followed by that in the western region, whereas the integrated efficiency remained at the lowest level in the middle region. Actually, the industrial circular economy’s efficiency in the eastern region was higher than the national average, whereas that in the western and middle regions was lower than the national average. The efficiency of China’s industrial circular economy varies significantly across provinces. Provinces with a higher industrial circular economy efficiency are mostly located in the eastern coastal areas, while those with a lower efficiency are mostly located in the middle and western inland areas.
The efficiency of China’s industrial circular economy displayed obvious spatial aggregation characteristics at the provincial level, including clear spatial dependence and spatial heterogeneity. The efficiency of the industrial circular economy exhibited patterns of high (low) regional spatial aggregation. Provinces with a high efficiency level of the industrial circular economy tend to be adjacent to similar ones, as do those with a low efficiency level. The degree of spatial aggregation was unstable with certain fluctuations, and the overall trend of fluctuating changes could be observed. High-value aggregation areas were mainly distributed in the eastern coastal areas, and low-value aggregation areas were concentrated and contiguously distributed in the middle and western inland areas, with transition zones in between. The efficiency of China’s industrial circular economy is generally high in the east and low in the west, and gradually decreases from the east coast towards the middle and western inland, forming a spatial distribution pattern of east–west facing each other, demonstrating an east-west spatial distribution pattern.
The four elements of economic level, openness to the outside, government regulation, and industrialization aggregation each impose a significant positive impact on the efficiency of China’s industrial circular economy, which can promote its efficiency. The level of industrialization exerts a significant negative impact on the efficiency of the industrial circular economy, which hampers its improvement and thus imposes some negative influences. The impact of technological innovation on the efficiency of the industrial circular economy is not statistically significant.
Through the integration of a variety of technical methods including GIS technology and the spatial analysis model, DEA model, and Tobit regression model, a multi-angle comprehensive study integrating the efficiency evaluation, spatial analysis, and influencing factors analysis of China’s industrial circular economy can be effectively realized. In this study, a relatively complete comprehensive research system is formed. On the one hand, it is an important supplement and improvement to the existing research system of circular economy, as well as an important contribution to the research field of the circular economy. This is the important theoretical value of the study. On the other hand, on the basis of this research, relevant policies can be improved by the Chinese government, in order to further upgrade the level of the industrial circular economy, and narrow down regional gaps. This is the important practical value of the study.


 ,
, 


