Article

A Node Embedding-Based Influential Spreaders Identification Approach

Software College, Northeastern University, Shenyang 110169, Liaoning, China
*
Author to whom correspondence should be addressed.
Mathematics 2020, 8(9), 1554; https://doi.org/10.3390/math8091554
Submission received: 11 August 2020 / Revised: 4 September 2020 / Accepted: 6 September 2020 / Published: 10 September 2020
(This article belongs to the Special Issue Computational Mathematics and Neural Systems)

Abstract

:
Node embedding is a representation learning technique that maps network nodes into lower-dimensional vector space. Embedding nodes into vector space can benefit network analysis tasks, such as community detection, link prediction, and influential node identification, in both calculation and richer application scope. In this paper, we propose a two-step node embedding-based solution for the social influence maximization problem (IMP). The solution employs a revised network-embedding algorithm to map input nodes into vector space in the first step. In the second step, the solution clusters the vector space nodes into subgroups and chooses the subgroups’ centers to be the influential spreaders. The proposed approach is a simple but effective IMP solution because it takes both the social reinforcement and homophily characteristics of the social network into consideration in node embedding and seed spreaders selection operation separately. The information propagation simulation experiment of single-point contact susceptible-infected-recovered (SIR) and full-contact SIR models on six different types of real network data sets proved that the proposed social influence maximization (SIM) solution exhibits significant propagation capability.

1. Introduction

Through years of research on how network structure affects information diffusion, researchers believe that social reinforcement and homophily are the two factors that play essential roles in the process of information going viral [1,2,3]. On the one hand, social reinforcement inside communities tends to trigger multiple exposures, and each additional exposure significantly increases the probabilities of individuals adopting social behaviors [1], which is the underlying assumption of classic information diffusion models like the LTM (linear threshold model). On the other hand, people sharing similar characteristics are more likely to form social relationships, which makes homophily factors inseparable from social contagion [3]. Let us posit that there is an underlying network over which information propagates, so the social reinforcement and homophily factors implying that both local and global structural information of the network should be taken into consideration. Except for the research on the role social reinforcement and homophily in information diffusion, researchers also discussed the role of centrality for the identification of influential spreaders in complex networks [4]. According to different types of network and different research perspectives, the evaluation criteria of node importance are also different. The research on critical node set recognition originated from the thinking of Domingos and Richardson in “viral marketing” [5,6]. Domingos and Richardson propose to make use of the customers’ ‘network value’, which means put more promotion effort to profit from customers who may be influenced to buy by current customers or who may influence other customers [5,7]. Under this circumstance, researchers simulate word-of-mouth effects by using information diffusion models, such as such as the Linear Threshold Model (LTM), Independent Cascade Model (ICM), the triggering (TR) model, time-aware diffusion models [8]. However, three aspects need to be taken into consideration: First, selected nodes should be able to cover the whole social graph more efficiently and the node influence must be taken into consideration; Second, Recognition of key node sets requires the foundation of research on node centrality. Different centrality indexes have different computational complexity and applicable scope, which will lead to differences in experimental results of the algorithm; Three, the explosive growth of network data brings severe challenges to the identification of key nodal sets [9]. In network marketing with a limited budget, the best strategy is to show the advertisements and provide discounts to a set of customers who are likely to buy the product and able to trigger many other people (including their friends, friends of friends) to buy the product to maximize the impact [10].
In this paper’s research, we propose a node-embedding algorithm and cluster nodes into subgroups base on the learned node embeddings. Giving priority to the dispersion between nodes and ensuring the relative importance of nodes, we extract the core nodes from the perspective of vector space distance. We call this strategy for identifying key node sets the CNE (cluster by network embedding) algorithm.

2. Related Concepts

In this section, we give and explain necessary definitions and concepts which will be used through this paper. We consider an undirected graph G = ( V ,   E ) , where V is the set of nodes in G and E is the set of edges among these nodes. Matrix A = ( a i j ) n × n is the adjacency matrix used to represent graph G , where n = | V | is the number of nodes in G .

2.1. Social Influence Maximization (SIM) Problem

Given an integer k   [ n ] and k < < n , the task of social influence maximization is to identify a k-sized node set such that when the information diffusion process is over maximum number of nodes become influenced. According to this description, the social influence maximization problem (SIM) task is closely associated with information diffusion models [11].

2.2. Node Embedding

The goal of node embedding is to encode nodes into lower dimension space and approximate the similarities between nodes in original space by similarities in embedding space. By doing so, network embedding avoids performing complex inference on the entire network which is a very practical and efficient solution for downstream tasks such as node classification, clustering, link prediction, and network visualization [12].
φ : v V R n d is a mapping function from node v of V to d dimension real embedding space R n d .
To our knowledge, DeepWalk was one of the very first popular network embedding approaches proposed in recent years [13]. DeepWalk provides a universal solution for feeding a network into neural nets to undertake node representation learning. It also bridges the gap between word embedding and network embedding through the use of the Word2Vec. Inspired by DeepWalk, research such as LINE, which uses first – order and second-order proximity to formally define the large-scale information network embedding problem [14], Node2vec which is similar to DeepWalk, but the main difference is that depth first and breadth first are taken into account when walking [15], and GraRep, which is a model that learns the node representation of a weighted graph and integrates the global structure information of the graph into the learning process [16] started to boom. LINE proposes to embed both local and global context information into node representation through a carefully designed objective function and edge-sampling strategy is used during learning process to prevent exploding gradients. Node2vec uses a biased random walk to generate nodes’ neighborhood information and employs the skip-gram architecture for learning node representation based on the generated neighbourhood contexts. GraRep emphases the importance of capturing k-steps relationship information between node pairs and considers various powers of the adjacency matrix in order to capture higher-order node similarity.
The intuition behind most node embedding algorithms is that more popular or connected samples should be selected more frequently during training since they are more informative [17]. Base on this intuition, we naturally extended the continuous bag of words (CBOW) algorithm of DeepWalk to a much faster and more accurate algorithm called centrality-weighted CBOW (IW-CBOW). The IW-CBOW algorithm uses nodes’ importance value as prior information to guide the gradient descent optimization of CBOW towards more meaningful directions and which will also accelerates the training at the same time.

3. Centrality Analysis

In this paper, we only consider the network with no direction. We let the network G = ( V ,   E ) , where V is the node set and E is the edge set. A = ( a i j ) n × n represents the adjacency matrix of the network, where n represents the number of nodes. If node i is connected to node j , ( a i j ) = 1 , otherwise ( a i j ) = 0 . Our goal is to select m nodes in the node set of the network to maximize the influence of their propagation in the network.
Next, some commonly used centrality measures and algorithms to identify key node groups based on point coloring theory are briefly introduced. Finally, the SIR propagation model is introduced.

3.1. Centrality Measure

Degree centrality, the number of neighbors connected to node i .
D C ( i ) = j A i j ,
Closeness centrality is used to measure the average distance from one node to other nodes, where d i j represents the shortest path length between node i and node j .
C C ( i ) = n 1 j ( ! = i ) d i j ,
Betweenness centrality, which describes the distribution of a node on the path between other nodes, where δ ( s ,   t ) represents the total number of shortest paths from node s to node j , and δ ( s , t | i ) represents the number of shortest paths from node s to node t through i .
B C ( i ) = s t δ ( s , t | i ) δ ( s , t ) ,
K-kernel, which describes the importance of nodes by their location in the network. Recursive stripping of nodes with degrees less than or equal to k in the network is performed as follows: First of all, delete the nodes with degree 1 and their connected edges in the network. At this time, new nodes with degree 1 may appear in the network, and continue to delete the new nodes with degree 1 and their connected edges. Repeat this operation until there are no more nodes with degree 1 in the network. At this time, all the deleted nodes go to constitute the first layer; next, the above deletion operation is repeated to obtain a second layer and so on, until all nodes in the network are given the value of K-kernel.

3.2. Point Coloring Theory

Bao et al. introduced the point coloring theory of graphs to solve the problem of finding key node groups. First of all, the nodes in Graph G are arranged in descending order of degrees. Next comes coloring the ordered nodes, coloring the first node with the first color, and coloring each node that is not adjacent to the preceding colored node with the same color in the order of arrangement. Then, the above coloring process is repeated with a second color and so on, until all nodes are colored. Nodes of the same color are placed in the point set of the same selected node, and the first m nodes in the node set with the largest number of nodes are taken as key node groups. It is also possible to sort the nodes according to the kernel number, closeness centrality or betweenness centrality, and select the key node group through the coloring process described above.

3.3. Susceptible-Infected-Recovered (SIR) Model

Classic propagation models are commonly used unsupervised.
Susceptible-infected-recovered (SIR) is a classic mathematical model of epidemics. SIR model divides the total population N into three categories: susceptible, infected and recovered. Users in the susceptible state are likely to be infected or influenced. Users are in infected state means that these users have already been infected or influenced. Users in the recovered state are no longer able to be infected or influenced. As is shown in Figure 1, at each time step, susceptible nodes.
We use the SIR propagation model to verify the influence of the selected node group on the network. The SIR model is the most classical model in infectious disease model, including three node states, where S represents susceptible state, i.e., it has no disease and lacks immunity, I represents the infected state, i.e., the diseased node, in the process of contacting with an S-state node; this type of node transmits the disease to the s-state node with a transmission probability β , and the S-state node is transformed into an I-state node at this time. R represents the removal state, i.e., a node that has immunity due to disease recovery or dies due to disease, and an I-state node becomes an R-state node with a removal rate μ . When the number of I-state nodes is 0, the propagation process ends and the network tends to be stable. The SIR model has two implementations: full-contact SIR, i.e., every round of I-state nodes try to infect all their neighbors, such as social networks; single-point contact SIR, i.e., each round of I-state nodes randomly select one of their neighbors to try to infect, such as a call network. In the paper, we set the key node group as the propagation source, i.e., I-state nodes. After SIR propagation model simulation, we compare the final number of R-state nodes in the network to determine the advantages and disadvantages of key node group selection. In this paper, in order to ensure the observability of experimental results, we set μ = 1 for full-contact SIR, and we set μ = 0.1 for single-point contact SIR.

4. The Overall Approach

We begin by explaining our strategy for effective multiple spreaders identification. Considering the definition of effective spreaders for the influence maximization problem (IMP), effective spreaders should be both influential nodes and widely dispersed nodes (lower the cost) at the same time. Taking these two essential requirements into consideration, the overall approach comprise 2 simple steps:
Step 1: Learn node representations and partition target network into clusters base on the similarity between nodes in the embedding space;
Step 2: Calculate the ‘cores’ of clusters and set them as effective spreaders.
In the first step, we propose a modified DeepWalk algorithm which makes sure influential nodes play a vital role in the embedding calculation, and k-means algorithm is applied to the embedding space to cluster the target network into non-overlapping subgroups in which the nodes share particular characteristics in common. The goal of the clustering step is to ensure that the selected spreaders naturally cover the whole target network. In the second step, we set the node which has the smallest mean distance to the rest of the nodes in the same cluster as the ‘core’ of the cluster, which is mainly the calculation of closeness centrality measurement. Employing closeness centrality as the measurement aims to select representative nodes to the clusters.

4.1. Proposed Node-Embedding Approach

The DeepWalk algorithm comprises two steps.
Step 1. Perform random walks on nodes (anchor nodes) in a graph to construct contextual node sequences of anchor nodes.
Step 2. Employ SkipGram algorithm to learn the embedding of anchor nodes based on the contextual node sequences generated in step 1.
We replace the Skipgram algorithm of DeepWalk with an extended CBOW algorithm called ’centrality-weighted-CBOW’ to obtain the the proposed node-embedding approach for the multiple spreaders identification (MSI) task. To lower the affect of uneven probabilistic distribution of node centrality values, we normalize centrality values using Formula (4). Line 1 of Algorithm 1 constructs a vector C of normalized centrality values of all nodes of G and line 6 feeds these centrality values as the weights for Centrality-weighted-CBOW algorithm.
To understand why a centrality weighted strategy is employed, we need to put the node-embedding approach back into the MSI task context. As we concluded, great influence should be one of the key features shared by effective spreaders, and in a social science, individuals’ characteristics can be decided or revealed by looking into its’ neighbors’ features. CBOW algorithm is one of the learns to predict the anchor by its context, from this kind of sociology perspective, employ CBOW algorithm to embed nodes is a reasonable choice.
Algorithm 1. Centrality-weighted DeepWalk (G, m, d, γ, t, λ)
Input: G = ( V ,   E )
  window size m
  embedding size d
  walks per vertex γ
  walk length t
  Number of iterations λ
Output: matrix of vertex representations Mn×h.
1. C = < N o r m a l i z e ( ? ( v ) )     f o r   v V //Vector of normalized node centrality values
2. for i = 0 to λ do
3. V = s h u f f l e ( V ) //Shuffle the node set of G
4.   for v V do
5.      W v = C o r p u s . a p p e n d ( R a n d o m _ w a l k ( G , v , t , γ ) / /Generate node sequences
6.     C e n t r a l i t y _ w e i g h t e d _ C B O W ( M n * k , W V , C ) //Train and gain node embeddings
7.   end for
8. end for
n o r m ( c v i ) = c v i c m a x c m a i n + c m a x 2 c m i n c m a x c m i n ,
n o r m ( d v i ) = d v i d m a x d m a i n + d m a x 2 d m i n d m a x d m i n ,
Let G = ( V , E ) be a simple network, v i V ( i = 1 , 2 , , n ) and n = | V | . As is shown in Figure 2, a normal CBOW algorithm works as a three-layer neural network, where input layer in the embedding space is h-dimension.
There are two matrices, where i t h column of W n × h is the h dimensional embedded vector for node v i .
Let’s break down CBOW algorithm into the steps and explain how our extended approach works.
  • Generate one hot node vectors ( x v i m , , x v i 1 , x v i + 1 , , x v i + m ) for anchor node v i ’s context nodes(inputs), where m is the window size.
  • Calculate the embedded node vectors of context nodes
  • x v i m = x v i m × W n × h , . , x v i 1 = x v i 1 × W n × h , x v i + 1 = x v i + 1 × W n × h , x v i + m = x v i + m × W n × h
  • where prime marks are used to distinguish the calculated embedded node vectors from the corresponding one hot node vectors.
  • Average the embedded node vectors to obtain v = x v i m + x v i m 1 + + x v i + m 2 m ;
  • Calculate a score vector s = v × W h × n ;
  • Turn the scores into probabilities y ^ = s o f t m a x ( s ) ;
  • Use gradient descent to optimize loss function H ( y ,   y ^ ) = j = 1 n y j l o g ( y ^ ) , where y is the real probability, which is actually the real one hot node vector of anchor node.
As we can see, compared to neural network models such as NLP (Natural Language Processing), the CBOW model uses linear activation functions instead of non-linear activation. In the 2nd step, it picks up the desired embeddings of input nodes by multiplying nodes’ one hot vector coding with matrix W n × h . In the following 3rd step, CBOW algorithm averages these h dimensional embedded vectors of context nodes which forms the output of the hidden layer. This averaging operation treats all nodes equally and does not consider the differences between nodes. It only considers whether or not a node appears as the context of the anchor node. Inspired by the works on improving the word2vec model carried out by NLP researchers [20,21], we use a weighted average (Formula (6)) to replace the average calculation of the 3rd step above, where the node importance calculation can be any node importance measurement. Since node importance is a critical measurement which reflects vital structural characteristics of the network, we employ node importance as the weights; by doing this, the role of important nodes will be strengthened in embedding calculation. We evaluated the performance of the algorithm using community detection as the downstream task on 2 well-known network datasets (Table 1). These 2 datasets are published with ground-truth communities, so normalized mutual information was chosen to measure the K-means clustering results in node embedding space. Node importance measures, including degree, PageRank, Betweennes and Coreness generated using k-shell decomposition analysis [22,23] were tested as the weight. To accelerate training, hierarchical softmax was used instead of softmax. In the experiment, we chose degree centrality (node importance measures) as the weights of models in CBOW algorithm, corresponding to Degree_CBOW algorithm.
To further improve the performance of node embedding, we can also use PCA(Principal Component Analysis) on proposed weighted CBOW, the use of PCA is a way to make up for the defect of CBOW as a shallow model. Throughout experiment (the experimental results are shown in Table 2), applying PCA on node embeddings generated by proposed algorithm will improve the community detection result NMI (Normalized Mutual Information) at an average of 0.20% for the email-EU-core network datasets.
V = Φ ( v i m ) x v i m + Φ ( v i m 1 ) x v i m + 1 + + Φ ( v i + m ) x v i + m 2 m ,

4.2. Key Node Selection

In this paper, we choose two types of clustering: hierarchical clustering and K-means clustering.
Hierarchical clustering is the “tree” that forms a hierarchy or cluster of data objects. Hierarchical clustering includes condensed hierarchical clustering and split hierarchical clustering. In this paper, we use the aggregation hierarchy clustering and use the bottom-up strategy. First, make each node a cluster, find the two most similar clusters and merge them to form a cluster, then iteratively merge the clusters into larger and larger clusters until m clusters are formed.
K-means clustering is to randomly select m nodes in vector space, and each node represents the initial mean or center of a cluster. Each remaining node is assigned to the most similar cluster according to its Euclidean distance from the center of each cluster. Then, according to the nodes assigned to the cluster, the average value of the nodes in each cluster is recalculated. The updated average value is used as the new cluster center to redistribute all objects. Continue to iterate the above process until the allocation is stable, i.e., the clusters formed in this round are the same as those formed in the previous round.
In order to make the nodes in the selected key node group sufficiently dispersed, we choose the clustering method to divide the network into m clusters, where the parameter m (the number of seed nodes/clusters) will be determined by the ‘budget’ of the IMP application, the clustering algorithm, and the data sets. Suppose the ‘budget’ of IMP application can support m1 seed nodes and the optimal number of clusters determined by the data from the angle of the algorithm is m2, then we choose m based on Formula (7). If m1 is greater than or equal to m2 which means the budget is enough, then the m2 clusters’ centers will be selected; otherwise, the first m important nodes of the m2 clusters’ centers will be selected.
m = { m 1 m 1 < m 2 m 2 m 1 m 2 ,
According to the above two different clustering strategies (CNE_HC (Cluster by Network Embedding_ Hierarchical Clustering), CNE_KM (Cluster by Network Embedding_ K-means Clustering)), the network is divided differently. We select the core nodes in the class cluster after the network is divided based on the similarity between nodes. We believe that a node in a cluster is most important if it has the greatest similarity with all other nodes. The similarity between nodes based on vector representation is the distance between nodes. The smaller the distance, the more similar the nodes are. Therefore, in the cluster, we want to find the node with the smallest distance from other nodes.
min ( j c l u | v e c ( i ) v e c ( j ) | ,

5. Experimental Analysis

5.1. Datasets

We have carried out experiments on several different types of real network datasets in order to verify the effectiveness of our method. The email network is the internal email network of a large European research institution. Nodes represent users in the institution and edges represent the fact that there is at least one mail exchange between users [24]. The political blogs network is a hyperlink-oriented network between US political blogs recorded by Adamic and Glance in 2005 [25]. The open flights network is extracted from Open flights.org. This network includes flights between airports in the world [26]. The Protein–Protein Interactions (PPI) network is a sub-network of human protein interaction network. Nodes represent proteins and edges represent interactions between proteins [8]. The Web-EPA (Environmental Protection Agency) network provides network data linked to www.epa.gov from a scientific network data warehouse called Network Repository, where nodes represent web pages and edges represent hyperlinks [27]. The Human Protein Vidal network is also a protein interaction network. Compared with the PPI network, the Vidal network is more sparse [28].
In order to simplify the operation, we carry out a series of preprocessing on the data set, including transforming the network into an undirected and weightless network, taking the maximum branch of the network, removing duplicate edges, self-edges and deleting isolated nodes in the network. The preprocessed network data structure information is shown in the following Table 3, in which the number of nodes, the number of edges and the average degree of the network are respectively listed.

5.2. Comparing Algorithms

We chose two kinds of benchmark algorithms for comparative analysis. The first type of benchmark algorithm is based on a centrality measure, directly selecting the first m most important key nodes as key node groups. In this paper, we have chosen four measures: Degree centrality (DC), K-kernel (KS), Betweenness centrality (BC) and Closeness centrality (CC) [29,30]. The second kind of benchmark algorithm is to select m key nodes that are not connected to each other as key node groups [31]. In this paper, a key node group identification algorithm based on point coloring theory is used. Firstly, the nodes are sorted by four measures: Degree, Kernel, Betweenness and Closeness. Then, the first m nodes in the largest independent set are selected as key node groups by using the point coloring theory, which correspond to the DCC, KSC, BCC and CCC algorithms, respectively.

5.3. The Experimental Results

In order to compare the performance of different methods in identifying key node groups, we first select m nodes as propagation sources according to a method, and then simulate the propagation process through single-point contact SIR and full-contact SIR models. When I-state nodes finally do not exist in the network, the propagation process ends, and the final number of R-state nodes is counted, which is the network range finally affected by the key node groups. The advantages and disadvantages of the key node group identification algorithm are determined by comparing the propagation range. At the same time, the experiment was repeated 500 times independently in order to ensure the reliability of the experimental results.
We introduce the relative proportion index of node group influence Δ to measure the effect of the algorithm, where Ri represents the final number of R-state nodes after the SIR propagation simulation for the key node group selected by a certain method; RDC represents the number of R-state nodes finally obtained after SIR propagation simulation using the key node group selected by DC (Degree Centricity) (i.e., selecting the top M nodes with the largest degree). When Δ > 0 , this method is better than DC. the larger Δ , the better the effect of this method.
Δ = R i R D C R D C ,
Finally, the influence range of the SIR simulation propagation is determined by a number of factors, including the implementation of the SIR model, the infection rate β , the number of nodes in the key node group, and the selection method of the key node group. In the network division of the CNE algorithm, in order to avoid the situation that the k-means clustering algorithm may fall into the local optimal situation, the aggregation hierarchy clustering algorithm is also adopted, and these two strategies are named CNE_KM and CNE_HC respectively. In order to undertake a comprehensive comparison, we carried out a series of cross experiments with fixed parameters.
First of all, we explored the change of the relative proportion index of node group influence Δ with the infection rate β on the basis of different key node group identification algorithms. In the single-point contact SIR model, we set the infection rate β from 0.1 to 0.5 while making the number of nodes in the key node group 1%, 3% and 5% of the total number of nodes in the network dataset. The experimental results are shown in Figure 3. From the experimental results, we can find that in the single-point contact SIR model:
(1)
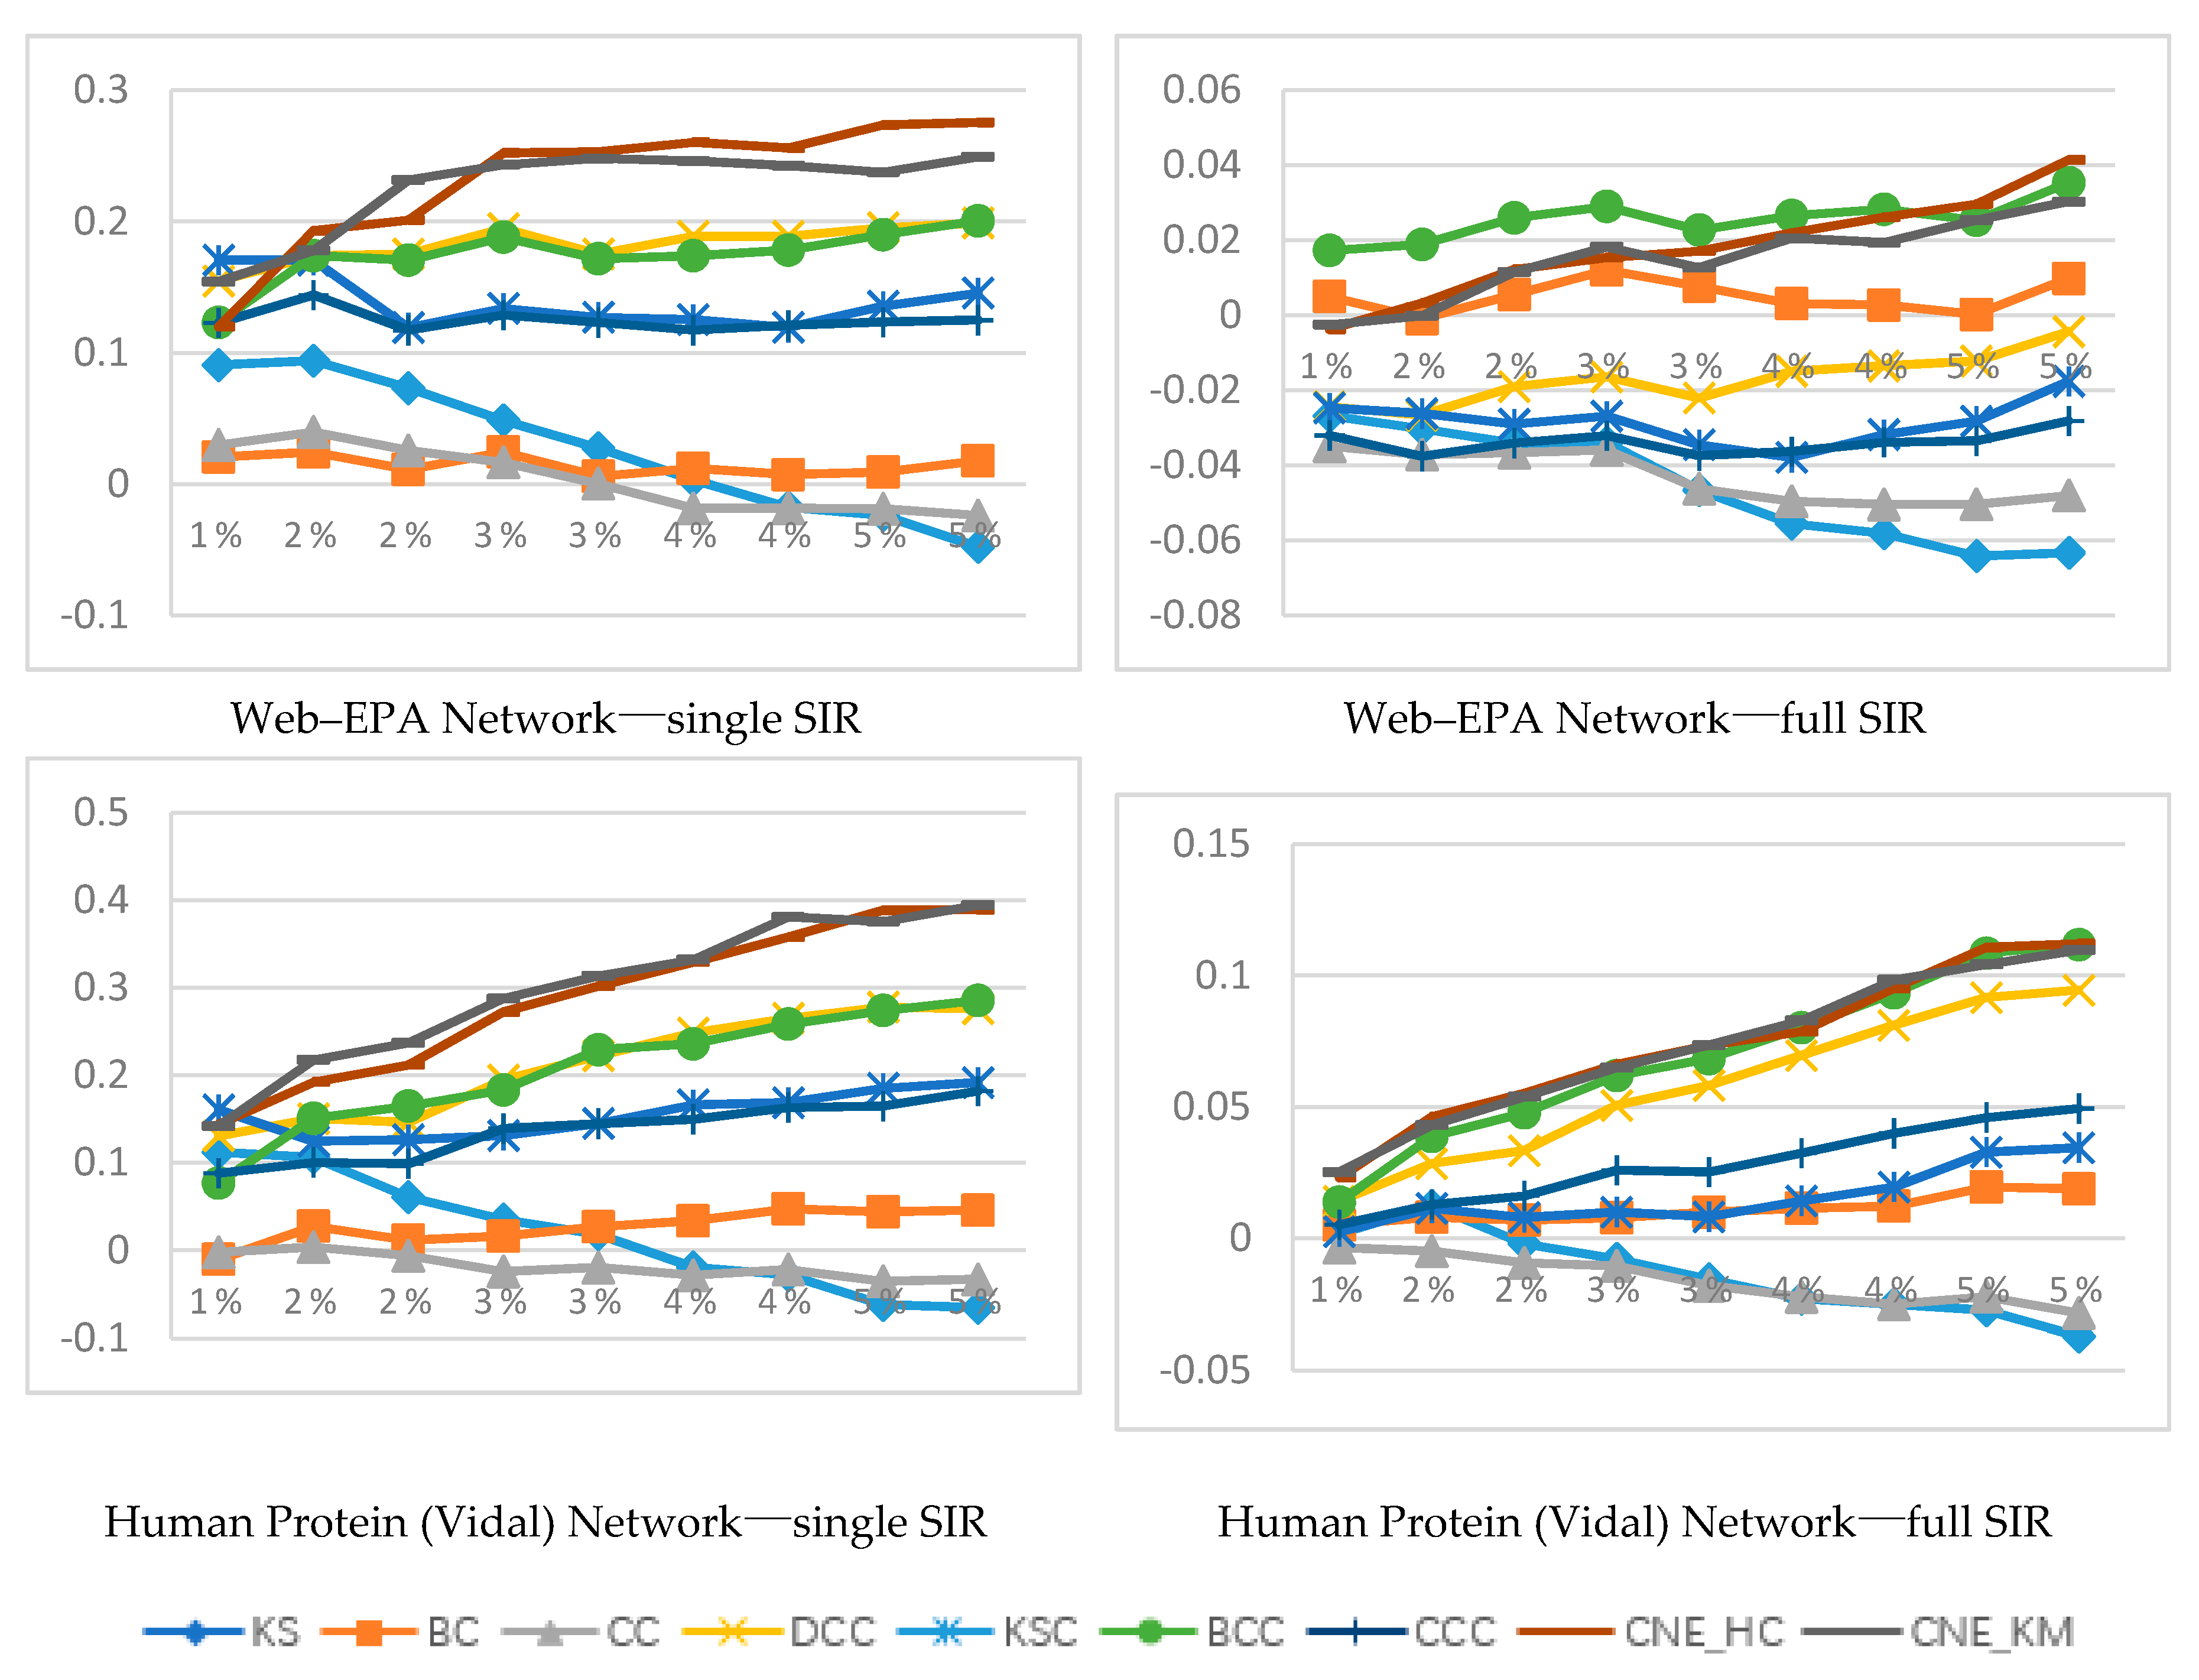
In the case of few key node groups (1%), when the infection rate β is very small, i.e., β = 0.1 as shown in the figure, the effects of CNE_HC and CNE_KM are not particularly ideal. With the increase of infection rate, the experimental results of CNE_HC and CNE_KM gradually improve and are better than other algorithms.
(2)
When the number of nodes in the key node group is 3% and 5%, the experimental results of CNE_HC and CNE_KM are better than other algorithms on the whole in terms of the impact on the whole network under the condition of different infection rates β .
(3)
With the increase of infection rate β , the difference in the impact of various key node group identification algorithms on the entire network will gradually decrease, and information such as disease information will be easily spread in the network. However, the experimental results of CNE_HC and CNE_KM still maintain good results and are superior to other methods.
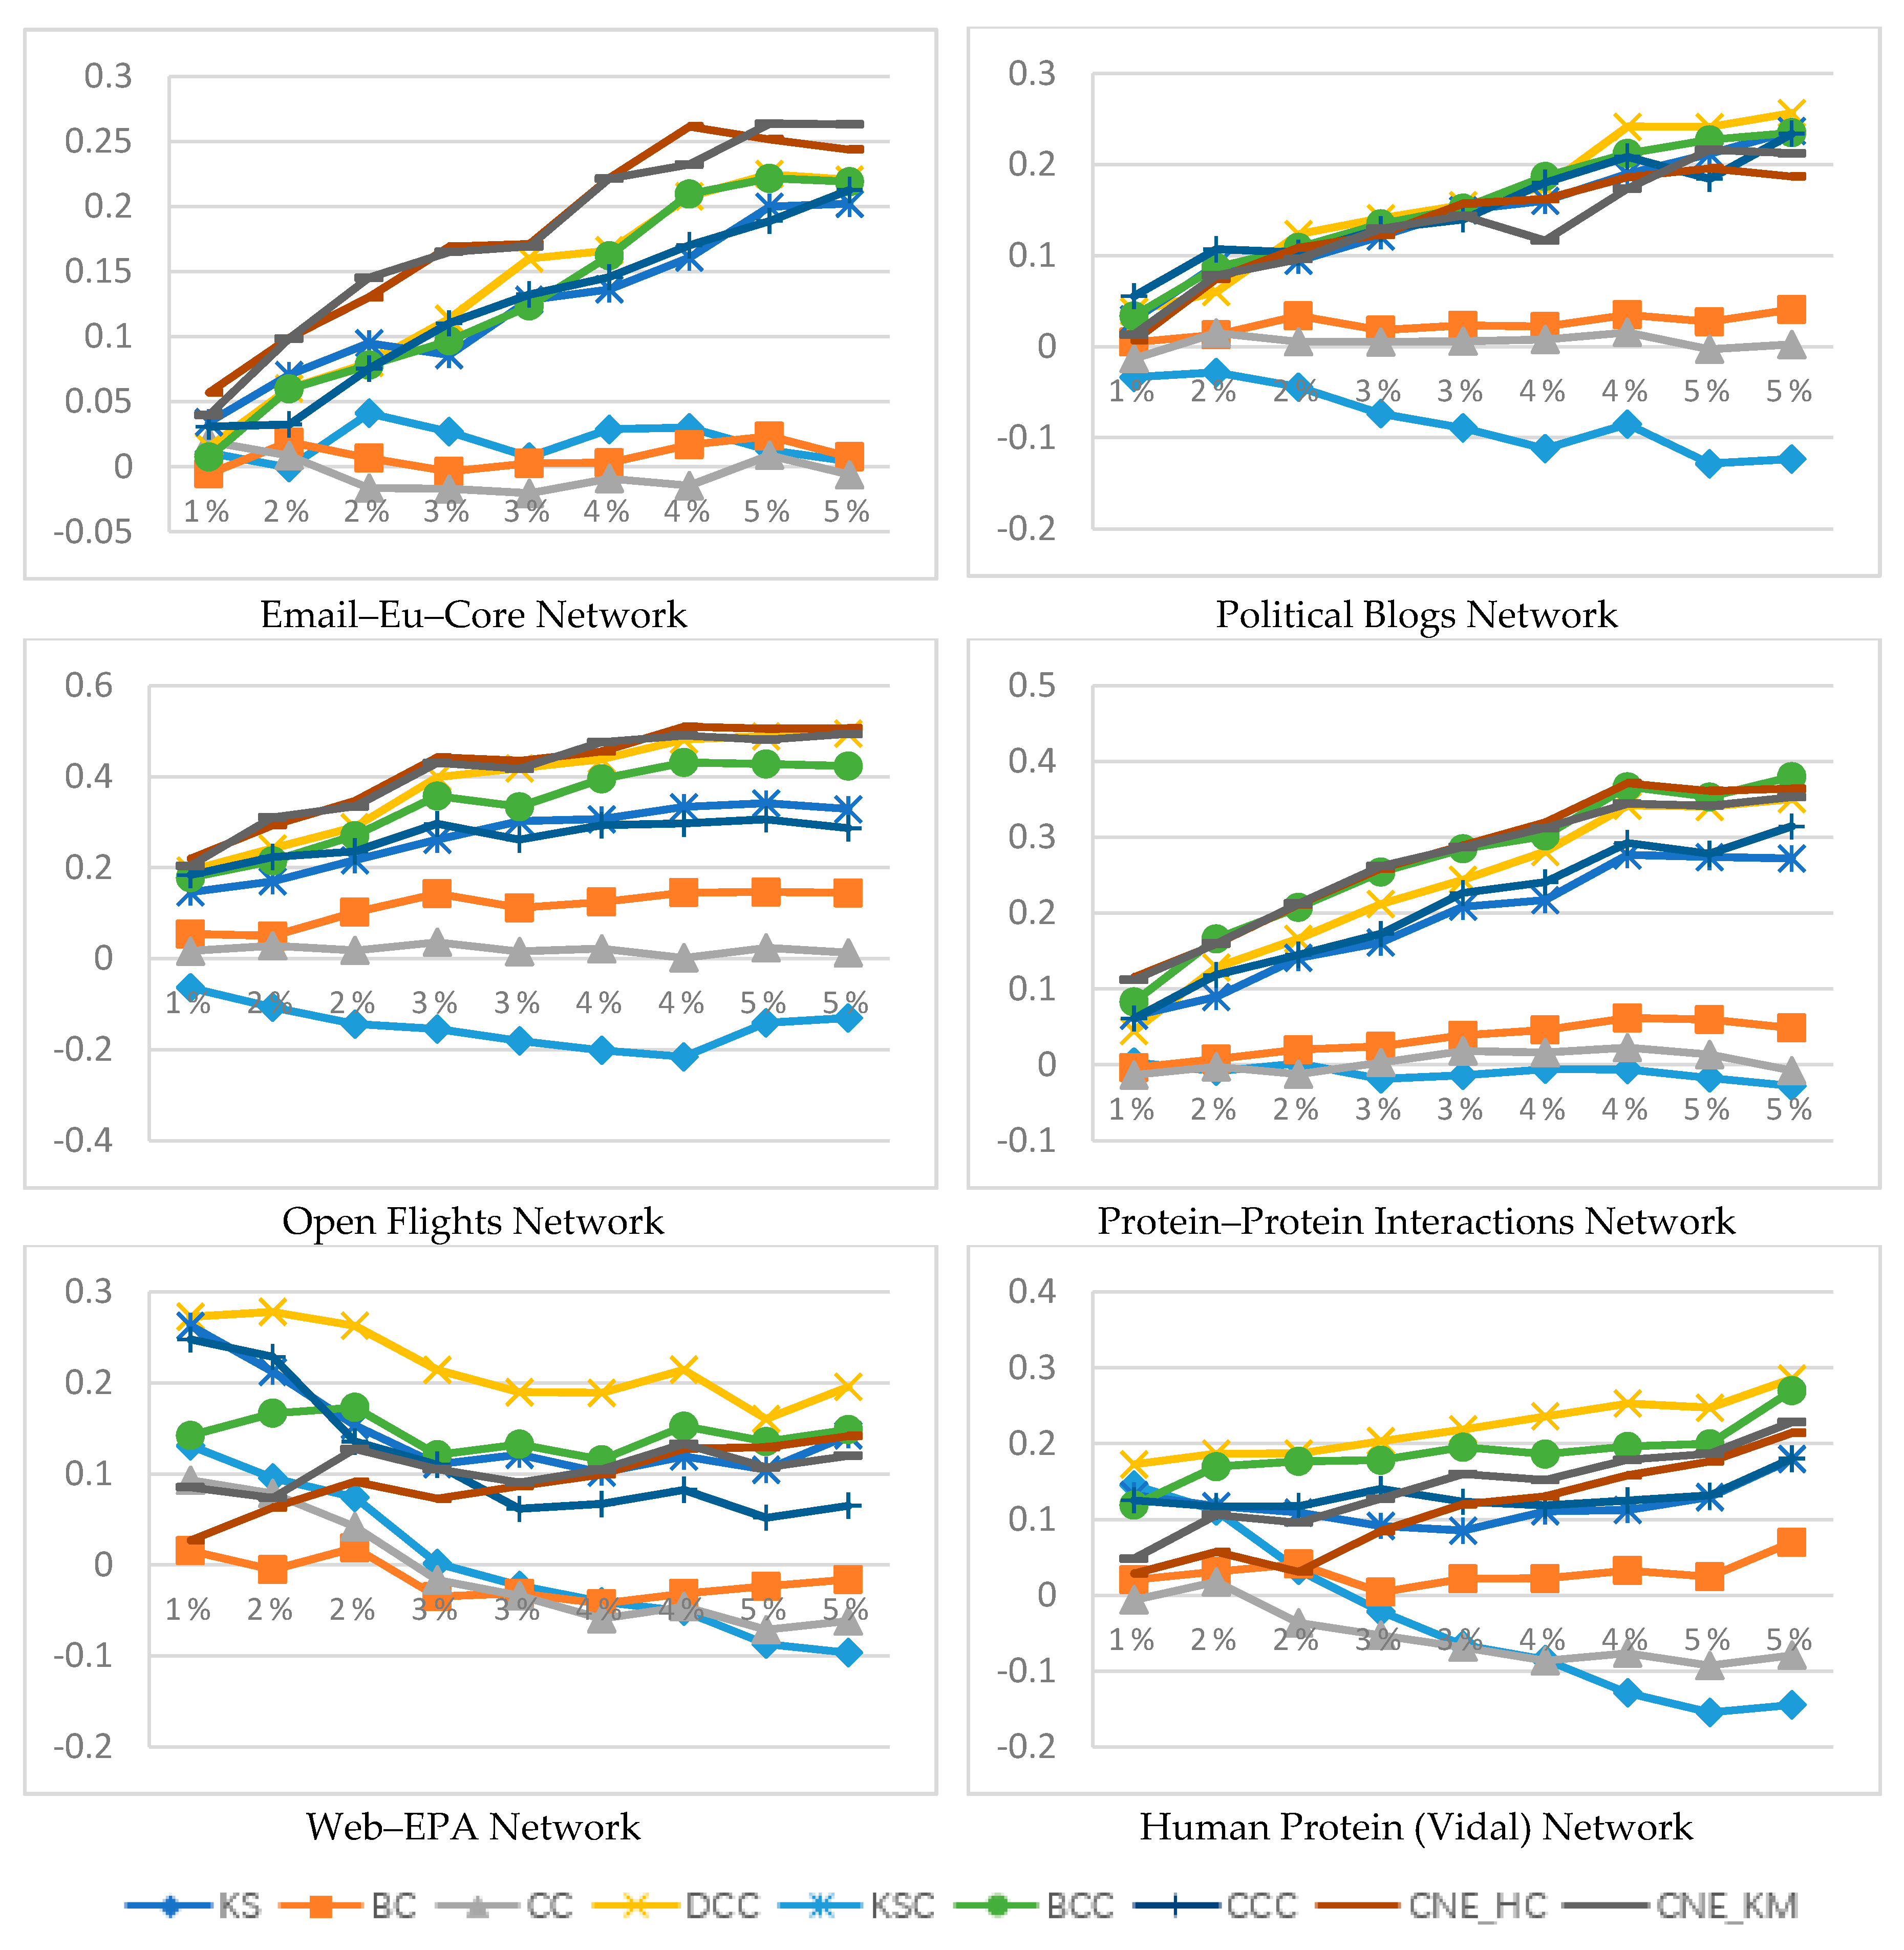
At the same time, we studied the performance of different methods in the full-contact SIR model. The experimental results are shown in Figure 4. In the full-contact SIR model, every round of I-state nodes try to infect all its neighbor nodes, so the model has extremely strong information transmission capability. In order to facilitate our observation of the experimental results, we set the removal rate μ = 1 . From the experimental results in Figure 4, we find some conclusions different from the single-point contact SIR model.
(1)
In Email, Openflights, PPI networks, regardless of the number of nodes in the key node group is 1%, 3% or 5%, and regardless of the infection rate, CNE_HC and CNE_KM perform well and are superior to other algorithms on the whole.
(2)
There are obviously different rules from the other four datasets in the Web-EPA and Vidal datasets. In Web-EPA and Vidal, when the infection rate β is very small, i.e., β = 0.1 , the experimental results of CNE_HC and CNE_KM are not ideal. With the increase of infection rate, the experimental results of CNE_HC and CNE_KM gradually improve, and catch up with and surpass other algorithms in the later stage.
Next, we explore the relationship between the number of nodes m in key node groups and the relative proportion index of node group influence Δ based on different key node group identification algorithms through experiments. We set the infection rate β = 0.2 in single-point contact SIR (removal rate μ = 0.1 ) and full-contact SIR (removal rate μ = 1 ) models, respectively, and set the number of nodes in the node group to be 1%, 1.5%, 2%, 2.5%, 3%, 3.5%, 4%, 4.5% and 5% of the total number of nodes. The experimental results are shown in Figure 5. CNE_HC and CNE_KM have excellent effects and are superior to other algorithms in most cases. With the increase of the number of nodes m, the effect on the whole network increases significantly.
In order to try to explain the above experimental results, we calculated the geodetic distances between the nodes of key node groups in the network, and measured the differences between the distances by introducing the distance relative proportion index K , where, di represents the average geodesic distance between node i and all nodes in the network, and dDC represents the geodesic distance of DC (Degree Centricity) infecting the network.
K = d i d D C d D C ,
Considering various factors, the performance of CNE_HC and CNE_KM are still satisfactory. Finally, we conducted another experiment to analyze the performance of NE_HC and NE_KM in terms of infected network speed. Since the full-contact SIR model is very easy to transmit information and cannot distinguish the infection rate of different algorithms, we only carried out experiments on the single-point contact SIR model in this group of experiments. We set the infection rate β = 0.2 , divided the range that will ultimately affect the network (i.e., the number of nodes in the R-state) by the number of rounds that will eventually be needed to infect the entire network as the infection speed v . At the same time, in order to compare the infection speed of each method, we define the speed relative proportion index Φ , where vi represents the speed of a method infecting the network, v D C represents the speed of DC (Degree Centricity) infecting the network. The experimental results are shown in Figure 6.
v i = R i / t ,
Φ = v i v D C v D C ,
From the above results, we found that CNE_HC and CNE_KM in the Email, Polblogs, Openflights and PPI networks performed well in terms of the speed of infection network as a whole. In the Web-EPA and Vidal networks, although the performance is not the best, it also reaches a medium level. At the same time, it can be seen that the point coloring algorithm (DCC) based on degree centrality has the highest propagation speed. This experimental result inspires us that in sparse networks, we may obtain better results in infection speed by using the most basic degree centrality.

6. Conclusions

This paper proposed a network representation learning-based solution for the influence maximization problem (IMP). The solution was designed based on the innate understanding that each selected seed node should be influential enough by itself, and all the seed nodes should be more dispersed in the network topology. So it extended the CBOW algorithm from NLP by using node centrality as weights to guide the training and then clusters the network nodes into subgroups in learned vector space and selects the ‘center’ of subgroups as seed set for the IMP solution. Since IMP is an NP-hard problem, the proposed solution was compared with seven baseline IMP solutions on six commonly used network datasets. Experiment results show that the solution outperforms the baseline algorithm in transmission speed and network coverage in information propagation simulation.
The IMP problem has high application value, so research on the existing IMP solution’s real-world applications will be vital. For real applications, the research on multi-layer networks and temporal networks IMP is critical. The proposed approach aimed to recognize seed sets in simple networks so that we will put more research effort into the IMP solution for multi-layer and temporal networks in the future.

Author Contributions

Conceptualization, D.C. and B.F.; methodology, B.F. and D.C.; software, P.D. and X.H.; validation, X.H., D.C. and D.W.; formal analysis, P.D.; investigation, B.F.; resources, P.D.; data curation, B.F.; writing—original draft preparation, P.D. and B.F.; writing—review and editing, D.C. and D.W.; visualization, X.H.; supervision, D.C.; project administration, D.C. and D.W.; funding acquisition, D.C. and D.W. All authors have read and agreed to the published version of the manuscript.

Funding

This work is partially supported by the Liaoning Natural Science Foundation under grant no. 20170540320, the Fundamental Research Funds for the Central Universities under grants no. N161702001, no. N2017010 and no. N172410005-2.

Acknowledgments

We would like to thank the anonymous reviewers for their careful reading and useful comments that helped us to improve the final version of this paper.

Conflicts of Interest

The authors declare no conflict of interest.

References

  1. Tsugawa, S. Empirical Analysis of the Relation between Community Structure and Cascading Retweet Diffusion. In Proceedings of the International AAAI Conference on Web and Social Media, Munich, Germany, 11–14 June 2019; Volume 13, pp. 493–504. Available online: https://www.aaai.org/ojs/index.php/ICWSM/article/view/3247 (accessed on 11 August 2020).
  2. Weng, L.; Menczer, F.; Ahn, Y.-Y. Virality prediction and community structure in social networks. Sci. Rep. 2013, 3, 2522. [Google Scholar] [CrossRef] [PubMed] [Green Version]
  3. Centola, D. The spread of behavior in an online social network experiment. Science 2010, 329, 1194–1197. [Google Scholar] [CrossRef] [PubMed]
  4. De Arruda, G.F.; Barbieri, A.L.; Rodriguez, P.M.; A Rodrigues, F.H.; Moreno, Y.; Costa, L.D.F. Role of centrality for the identification of influential spreaders in complex networks. Phys. Rev. E 2014, 90. [Google Scholar] [CrossRef] [PubMed] [Green Version]
  5. Richardson, M.; Domingos, P. Mining knowledge-sharing sites for viral marketing. In Proceedings of the 8th ACM SIGKDD International Conference on Knowledge Discovery and Data Mining, Edmonton, AB, Canada, 23–26 July 2002; pp. 61–70. [Google Scholar]
  6. Probst, F.; Grosswiele, D.-K.L.; Pfleger, D.-K.R. Who will lead and who will follow: Identifying influential users in online social networks. Bus. Inf. Syst. Eng. 2013, 5, 179–193. [Google Scholar] [CrossRef]
  7. Lu, Z.; Zhang, W.; Wu, W.; Fu, B.; Du, D.Z. Approximation and Inapproximation for the Influence Maximization Problem in Social Networks under Deterministic Linear Threshold Model. In Proceedings of the 31st International Conference on Distributed Computing Systems Workshops, Minneapolis, MN, USA, 20–24 June 2011. [Google Scholar]
  8. Livstone, M.S.; Breitkreutz, B.J.; Stark, C.; Boucher, L.; Tyers, M. The biogrid interaction database. Nat. Preced. 2011. [Google Scholar] [CrossRef]
  9. Roy, M.; Pan, I. Lazy Forward Differential Evolution for Influence Maximization in Large Data Network. SN Comput. Sci. 2020, 1, 1–6. [Google Scholar] [CrossRef] [Green Version]
  10. Dospinescu, O.; Anastasiei, B.; Dospinescu, N. Key Factors Determining the Expected Benefit of Customers When Using Bank Cards: An Analysis on Millennials and Generation Z in Romania. Symmetry 2019, 11, 1449. [Google Scholar] [CrossRef] [Green Version]
  11. Liu, B.; Cong, G.; Zeng, Y.; Xu, D.; Chee, Y.M. Influence spreading path and its application to the time constrained social influence maximization problem and beyond. IEEE Trans. Knowl. Data Eng. 2014, 26, 1904–1917. [Google Scholar] [CrossRef] [Green Version]
  12. Hamilton, W.L.; Ying, R.; Leskovec, J.J. Representation learning on graphs: Methods and applications. arXiv 2017, arXiv:1709.05584. [Google Scholar]
  13. Perozzi, B.; Al-Rfou, R.; Skiena, S. DeepWalk: Online Learning of Social Representations. In Proceedings of the 20th ACM SIGKDD Int. Conf. on Knowledge Discovery and Data Mining (NY, USA) (KDD ’14); ACM: New York, NY, USA, 2014; pp. 701–710. [Google Scholar]
  14. Tang, J.; Qu, M.; Wang, M.; Zhang, M.; Yan, J.; Mei, Q. LINE: Large-Scale Information Network Embedding. In Proceedings of the 24th Int. Conf. on World Wide Web, Florence, Italy, 18–22 May 2015; IW3C2. pp. 1067–1077. [Google Scholar]
  15. Grover, A.; Leskovec, J. node2vec: Scalable Feature Learning for Networks. arXiv 2016, arXiv:1607.00653. [Google Scholar]
  16. Cao, S.; Lu, W.; Xu, Q. Grarep: Learning graph representations with global structural information. In Proceedings of the 24th ACM International on Conference on Information and Knowledge Management-CIKM ’15, Melbourne, Australia, 19–23 October 2015. [Google Scholar] [CrossRef]
  17. Zhou, D.; He, J.; Yang, H.; Fan, W. SPARC: Self-Paced Network Representation for Few-Shot Rare Category Characterization. In Proceedings of the 24th ACM SIGKDD International Conference, London, UK, 19–23 August 2018. [Google Scholar]
  18. Feng, L.P.; Wang, H.B.; Feng, S.Q. Improved SIR model of computer virus propagation in the network. J. Comput. Appl. 2011, 31, 1891–1893. [Google Scholar]
  19. Mikolov, T.; Chen, K.; Corrado, G.; Dean, J. Efficient estimation of word representations in vector space. arXiv 2013, arXiv:1301.3781. [Google Scholar]
  20. Schmidt, C.W. Improving a tf-idf weighted document vector embedding. arXiv 2019, arXiv:1902.09875. [Google Scholar]
  21. Chang, C.-Y.; Lee, S.-J.; Lai, C.-C. Weighted word2vec based on the distance of words. In Proceedings of the 2017 International Conference on Machine Learning and Cybernetics (ICMLC), Ningbo, China, 9–12 July 2017; Volume 2, pp. 563–568. [Google Scholar]
  22. Kitsak, M.; Gallos, L.K.; Havlin, S.; Liljeros, F.; Muchnik, L.; Stanley, H.E.; Makse, H. AIdentification of influential spreaders in complex networks. Nat. Phys. 2010, 6, 888–893. [Google Scholar] [CrossRef] [Green Version]
  23. Bollobás, B. Graph Theory and Combinatorics: Proceedings of the Cambridge Combinatorial Conference in Honour of Paul Erdös, Trinity College, Cambridge, 21–25 March 1983; Academic Press: Cambridge, MA, USA, 1984. [Google Scholar]
  24. Leskovec, J.; Kleinberg, J.; Faloutsos, C. Graph evolution: Densification and shrinking diameters. ACM Trans. Knowl. Discov. Data 2007, 1, 2-es. [Google Scholar] [CrossRef]
  25. Adamic, L.A.; Glance, N. The political blogosphere and the 2004 U.S. election: Divided they blog. In Proceedings of the 3rd International Workshop on Link Discovery, Chicago, IL, USA, 21–25 August 2005; ACM: New York, NY, USA; pp. 36–43. [Google Scholar]
  26. Opsahl, T.; Agneessens, F.; Skvoretz, J. Node centrality in weighted networks: Generalizing degree and shortest paths. Soc. Netw. 2010, 3, 245–251. [Google Scholar] [CrossRef]
  27. Rossi, R.A.; Ahmed, N.K. The Network Data Repository with Interactive Graph Analytics and Visualization. In Proceedings of the Twenty-Ninth AAAI Conference on Artificial Intelligence, Austin, TX, USA, 25–30 January 2015; AAAI Press: Menlo Park, CA, USA, 2015. [Google Scholar]
  28. Rual, J.F.; Venkatesan, K.; Hao, T.; Hirozane-Kishikawa, T.; Dricot, A.; Li, N.; Berriz, G.F.; Gibbons, F.D.; Dreze, M.; Ayivi-Guedehoussou, N.; et al. Towards a proteome-scale map of the human protein-protein interaction network. Nature 2005, 437, 1173–1178. [Google Scholar] [CrossRef] [PubMed]
  29. Fortunato, S. Community detection in graphs. Phys. Rep. 2011, 486, 75–174. [Google Scholar] [CrossRef] [Green Version]
  30. Newman, M. Networks: An Introduction; Oxford University Press, Inc.: Oxford, UK, 2010. [Google Scholar]
  31. Feixiong, L.; Liang, M.A. Heuristic ant search algorithm for Graph coloring problem. Comput. Eng. 2007, 33, 191–192. [Google Scholar]
Figure 1. The susceptible-infected-recovered (SIR) model [18].
Mathematics 08 01554 g001
Figure 2. Continuous bag of words (CBOW) model [19].
Mathematics 08 01554 g002
Figure 3. In the single-point contact SIR model, the relative proportion index of node group influence Δ varies with the infection rate β. From left to right corresponds to taking 1%, 3% and 5% of the number of nodes in the dataset as the number of nodes in the key node group respectively.
Mathematics 08 01554 g003aMathematics 08 01554 g003bMathematics 08 01554 g003c
Figure 4. In the full-contact SIR model, the relative proportion index of node group influence Δ varies with the infection rate β . From left to right corresponds to taking 1%, 3% and 5% of the number of nodes in the dataset as the number of nodes in the key node group respectively.
Mathematics 08 01554 g004aMathematics 08 01554 g004bMathematics 08 01554 g004c
Figure 5. The relative proportion index of node group influence Δ varies with the number of nodes. From left to right, the experimental results of single-point contact SIR and full-contact SIR models are respectively corresponding to the dataset.
Mathematics 08 01554 g005aMathematics 08 01554 g005b
Figure 6. Set the infection rate β = 0.2 , and the relative ratio Φ of infection rate V varies with the number of nodes m, repeating the experiment 500 times independently.
Mathematics 08 01554 g006
Table 1. Datasets for verifying representation effect.
DataSetsNodesEdgesCommunity
Email Network98616,06442
Political Blogs122216,7142
Table 2. Result of community detection.
DataSetsCBOWDegree_CBOW
Email network69.81%69.83%
Political blogs75.00%74.82%
Table 3. The preprocessed network data structure information.
DataSetsNodesEdges<k> (Average Degree)
Email Network98616,06432.5842
Political Blogs122216,71427.3552
OpenFlights290515,64510.7711
Protein–Protein Interactions (PPI)385237,84119.6475
Web-EPA425388974.1839
Human Protein (Vidal)278366074.3169

