2. Distinct Research Program (DRS)
Distinct research program is one of the research programs presented from DSR at KAU. This program is running over the year and all staff and researchers of KAU can submit on proposal or more. After publishing an article in ISI from each proposal, they got valuable financial incentives. All data of researchers, articles and journals are stored in deanship of scientific research database. So, data used in this research are got from the database, we focused on the finished projects that resulted in publishing articles in Thomson ISI and, at the same time, the articles information appearing on Web of Science from 2012 to April 2019.
Data include faculty name, department, authors (KAU staff members or external coauthors), journal category (means the area of research that the journal covers), project duration (the time between date of contract and data of publishing the article), budget of the project (it is divided into initial deposit, which is given when signing the contract and the final deposit, which is given after publishing the article and satisfying the rules of the distinct research study (DRS)), and contract category (which means the journal rank; Q1, Q2, Q3, and Q4, where the final deposit depends on this rank).
KAU has more than 70 faculties, centers, institutes and deanships; all these units have staff and researchers, and they can submit proposals for the DRS program.
Analyzing the data, it was found that the published articles were attended by the faculties of science, engineering, pharmaceuticals, computer engineering, and information technology, as well as the faculties of meteorology, environment, and agriculture with 77% of all the faculties, centers, and deanships. Additionally, it is found that departments of chemistry, mathematics, physics, statistics, pharmaceutics, biochemistry, production engineering and mechanical system design, computer science, and electrical and computer engineering have participated in the published articles with 60% of all departments of the faculties, centers, and deanships. Regarding the rank of the journals, it was found that of published articles 7% of Q1, 14% of Q2, 18% of Q3, and 22% of Q4, and 40% of Q5.
Few studies in the literature tried to determine the factors affecting number of published research or research productivity. A brief state of the art is formulated below. The reference [
2] developed a study to identify the factors affecting numbers of citations for papers in medicine based on the evidence-based approach. They found that journal rank subject, IF, h index of the authors, the notoriousness of the main author, SNIP (source normalized), and SJR (scientific journal ranks) had significantly positive correlations with paper citability. The reference [
3] developed a study based on researcher-made questionnaire about study factors impacting on the research productivity of Iranian women in ISI. The reference [
4] conducted a literature review and designed a questionnaire to determine the most influencing factors on the research performance of the university professor at different universities in Taiwan. They found that the most important factors are feeling in work, research funding, hardware climate, hardware and facility, human resources, and library resources. The reference [
5] used questionnaires, interview and document analysis to analyze resource, institutional, and cultural factors that influence research productivity in Mwenge Catholic University in Tanzania. He found that lack of the staff, low salaries, teaching workload, not enough research budget, and the inadequate computer application software for data analysis and plagiarism are the most factors affecting research productivity. The reference [
6] conducted a study in 14 institutions under the control of university of agricultural sciences. They found that human factors (organizational, sociopsychological, and personal) and organizational related factors have an effect on research productivity. The reference [
7] identified the opportunities and barriers that faculty members at Najran University can face when publishing in ISI journals. The reference [
8] examined research productivity of faculty at two major Kenyan public universities. The reference [
9] determined factors affecting the research productivity and the factors importance using statistical package LISREL (the linear structural relationship) and neural network analyses. The reference [
10] found that financial incentives motivate the improving of the research productivity from the Scopus data base study of the assignment of Russian authors’ affiliations to the branches of Russian science.
3. An Overview about ANN
Artificial neural networks (ANNs) are widely used in various fields and applications. The following overview provides some applications. The reference [
11] developed a comprehensive study of ANNs, with discussions on the applications and contributions. ANN is used in various fields such as computer security, medicine, business, finance, banking, insurance, the stock market, power generation, management, the nuclear industry, mineral exploration, mining, and forecasting the quality of oil fractions. The reference [
12] presented a study of neural networks of direct communication with random weights. The reference [
13] reviewed ANNs uses in energy. The reference [
14] presented a survey on randomized methods for training ANNs. The reference [
15] investigated random single-hidden layer feedforward neural network based on metaheuristic and non-iterative learning approach. Application of recurrent ANNs in the field of statistical language modeling can be found in [
16]. There are extensions and other developed types of ANN such as projection neural network. The reference [
17] provided a comprehensive review of the projection neural networks for solving various constrained optimizations. Additionally, the reference [
18] presented Zeroing neural networks to solve complex computation equations. The reference [
19] applied ANN ensemble for the mapping of landslide susceptibility where this type has feature of higher accuracy.
4. Implementation of MLP ANN
IBM SPSS 25 was used to develop the proposed MLP neural network to determine the most important factors affects publishing in ISI journals.
Table 1 shows the case processing summary; where the percentage of the included cases was 91.0% and the excluded cases was 9.0%. From the included cases 80.0% of the sample was employed for training and 20.0% was used for testing.
The proposed multilayer perceptron ANN structure had one input layer, one output layer, and two hidden layers.
Table 2 shows MLP ANN information and it was discussed in the subsections. Two hidden layers were used because the data of the problem addressed was deterministic and two layers were enough for the NN to be learned and to find the most important factors affecting publication in ISI.
4.1. The Input Layer
The variables in the input layer were seven variables in two types; numeric variables (called covariates in SPSS) and nonnumeric variables (called factors in SPSS). The numeric variables were: budget of research, number of staff from KAU participated in these articles as principle authors or coauthors, number of staff out of KAU participated in these articles as principle authors or coauthors, and project duration (it is time between the contract date and the date of publishing the article on the web of science). The nonnumeric variables were the faculty of the author(s), the department at the faculty that the author(s) belongs to, and journal category that means the journal research area. The variables in the input layer were the independent variables. The output layer had two dependent variables; the first one was the contract category, which means the class of the journal where the article was published in A, B, C, D, or E, and the second variable was the number of published articles every year. The rescaling method for numerical variables was standardized. The ratio assigned to the three samples was 70% for training, 30% for testing, and 0% for holdout.
4.2. The Hidden Layers
We determined the number of hidden layers in layer 2, where the hidden layer contained network nodes (units). The first hidden unit is a function of the weighted sum of the input data, and the second hidden layer is a function of the weighted sum of units in the first hidden layer, and the activation function is the same for two hidden layers. The number of units in each hidden layer was automatically determined by SPSS.
The activation function used in this research was the hyperbolic tangent of the form:
where
λ is a scale parameter. For the output layer, which contains the dependent variables, the activation function is a hyperbolic tangent.
4.3. Types of Training
There were three types of training: batch, online, and mini-lot. The difference between the three types is the updating synaptic scales. In a batch training type, synaptic weights were updated after all training data records were completed. In an online workout, synaptic weights were updated after each workout data record. In the mini-lot type, the training data records were divided into groups of the same size and then update the synaptic weights after passing through the group. We tried the three types of training. For batch training type, we used the scaled conjugate gradient method to estimate the synaptic weights.
4.4. The Output Layer
The output layer contained two variables: the number of published articles and rank of the journals that the articles were published in. The activation function is defined by the hyperbolic tangent function. The error function is given by the sum of squares.
5. ANN Results
After determining the input and output variables and featuring the MLP ANN, the results are shown in
Table 3.
Where the model summary shown in
Table 3 displays a summary of the neural network results by partition and overall, including the error, the relative error or the percentage of incorrect predictions, the stopping rule used to stop training, and the training time. The error is the sum-of-squares error when the identity, sigmoid, or hyperbolic tangent activation function is applied to the output layer. It is the cross-entropy error when the softmax activation function is applied to the output layer.
Since one of the output variables (ContractCateg) is categorical,
Table 4 shows the classification of this variable by sections and general parameters. This table shows the number of cases rightly or wrongly classified for a dependent variable of type ContractCateg. A percentage of the total number of cases that were classified correctly was also reported.
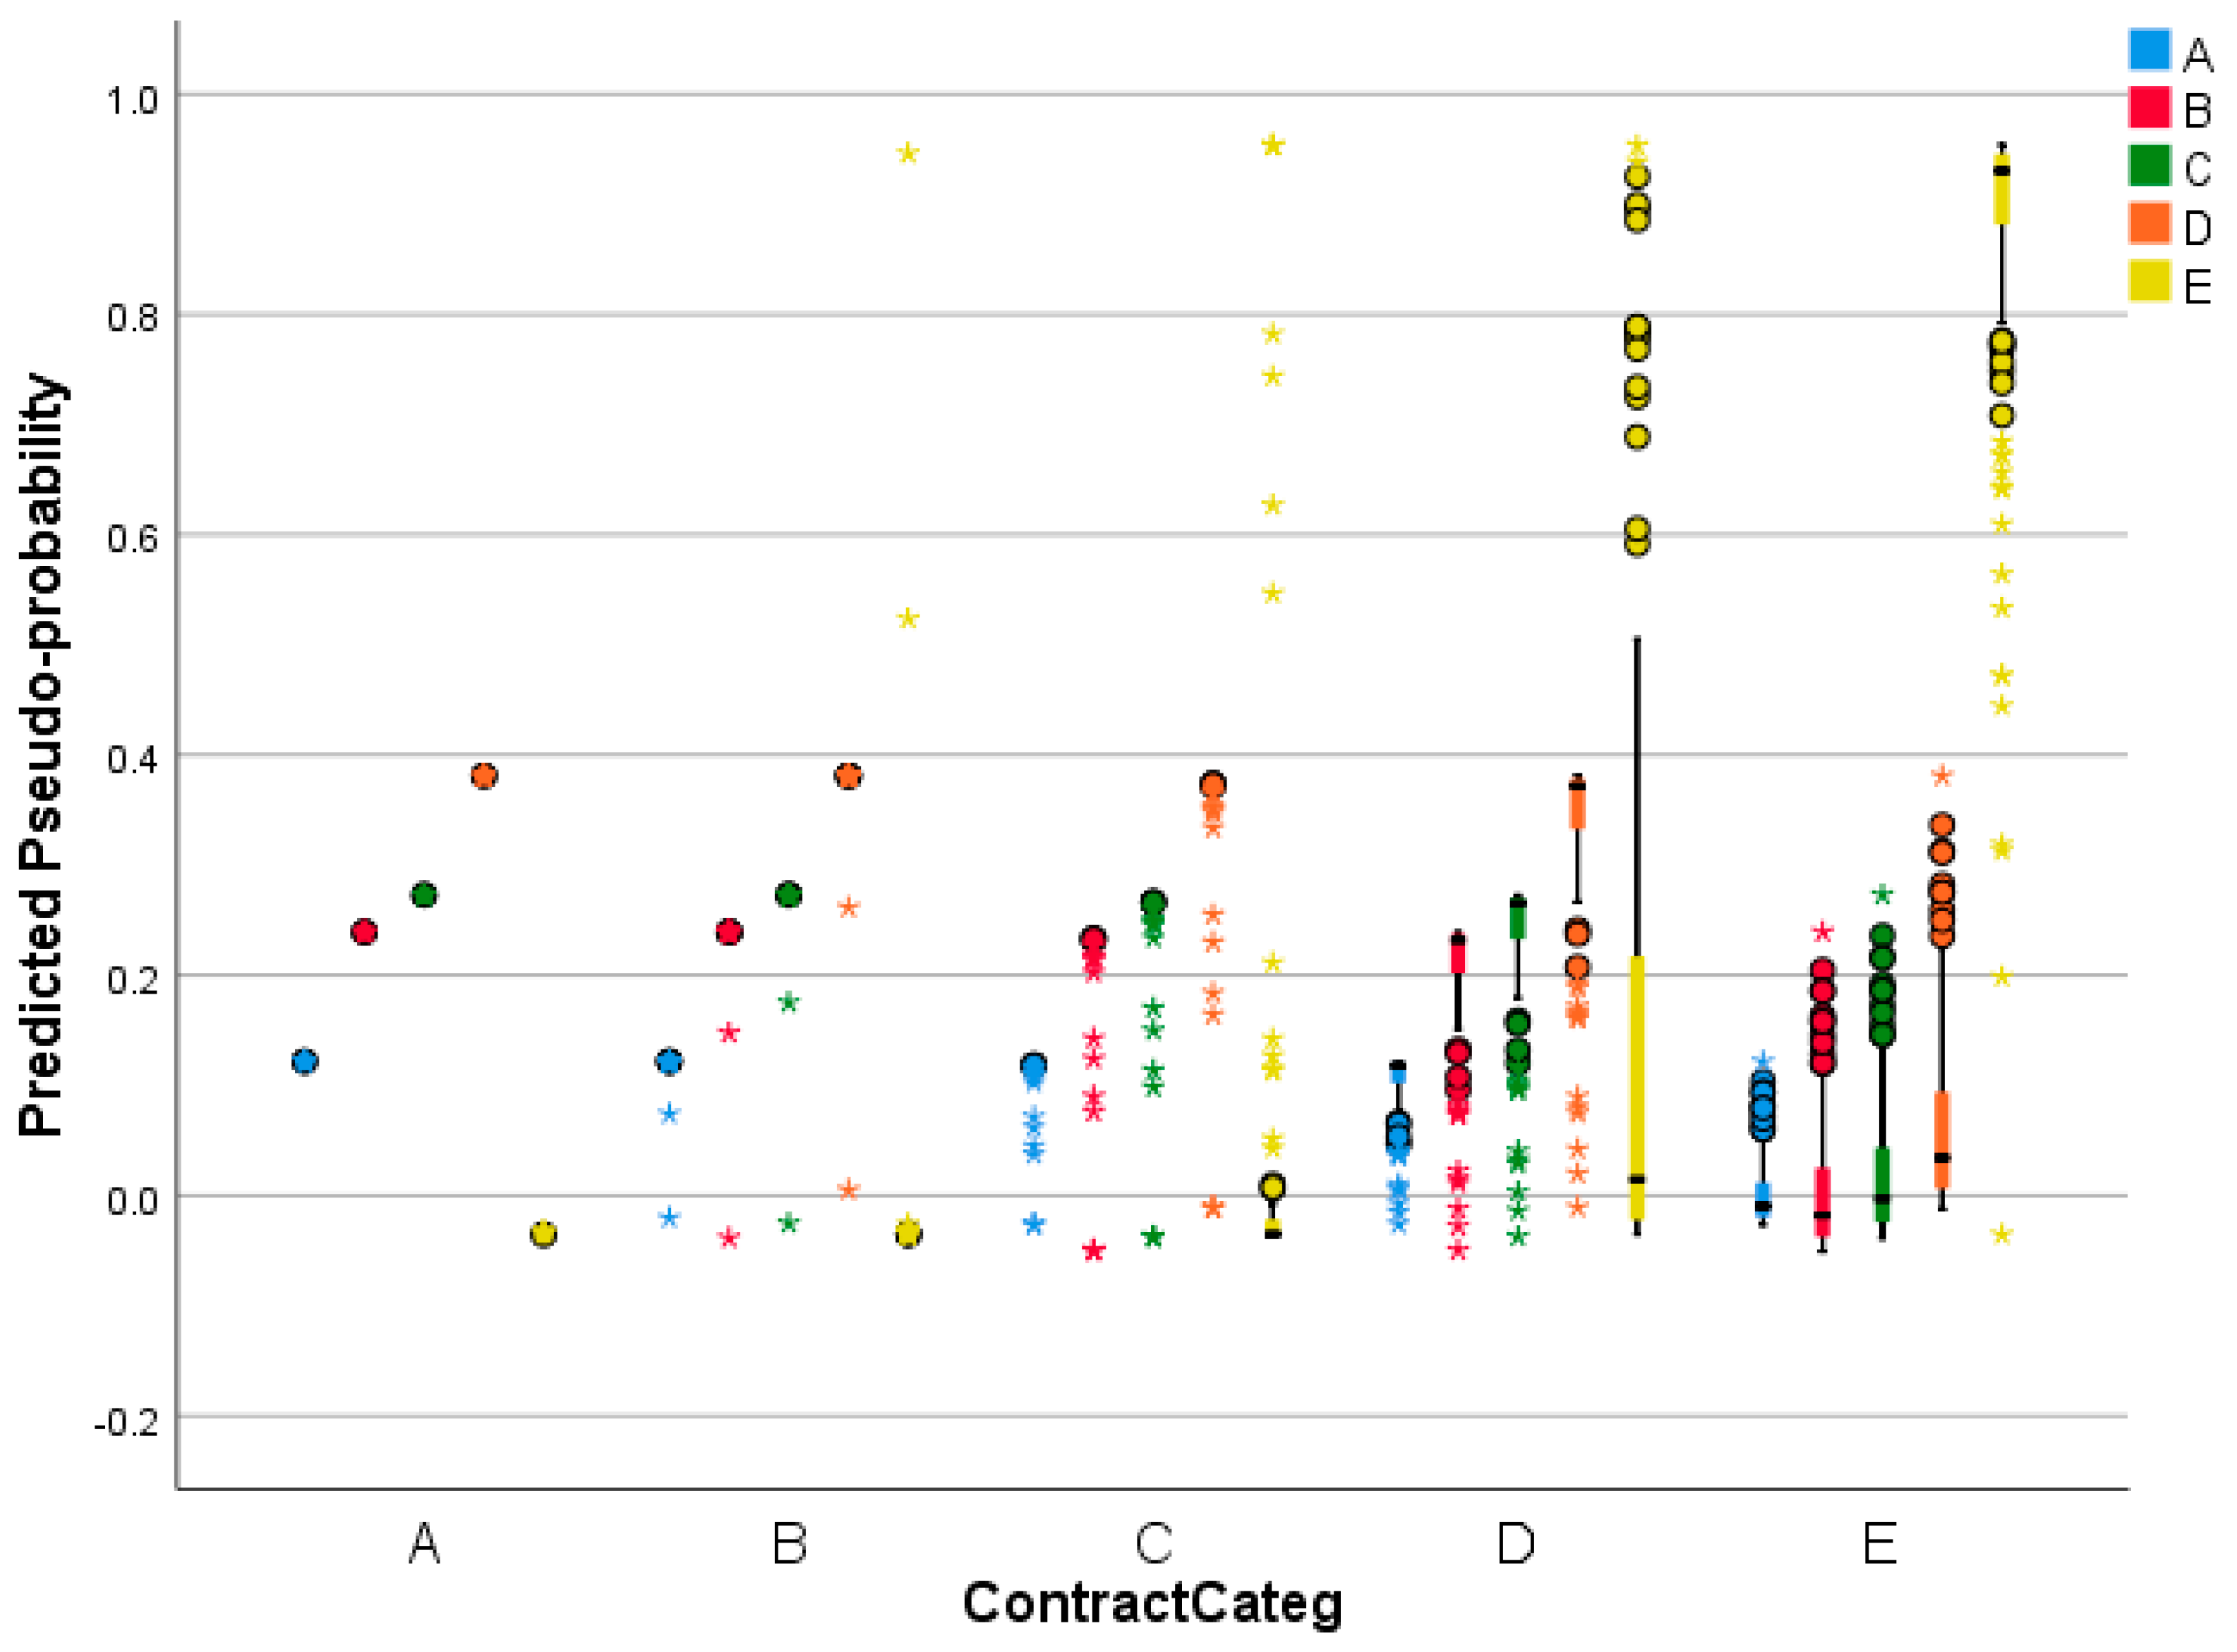
Figure 1 shows a graph predicted by the observed. It displays grouped rectangles with predicted pseudo-sequences for combined training and test samples for categorical dependent variables from ContractCateg. The x axis is for the observed response categories, and the legend is for the predicted categories.
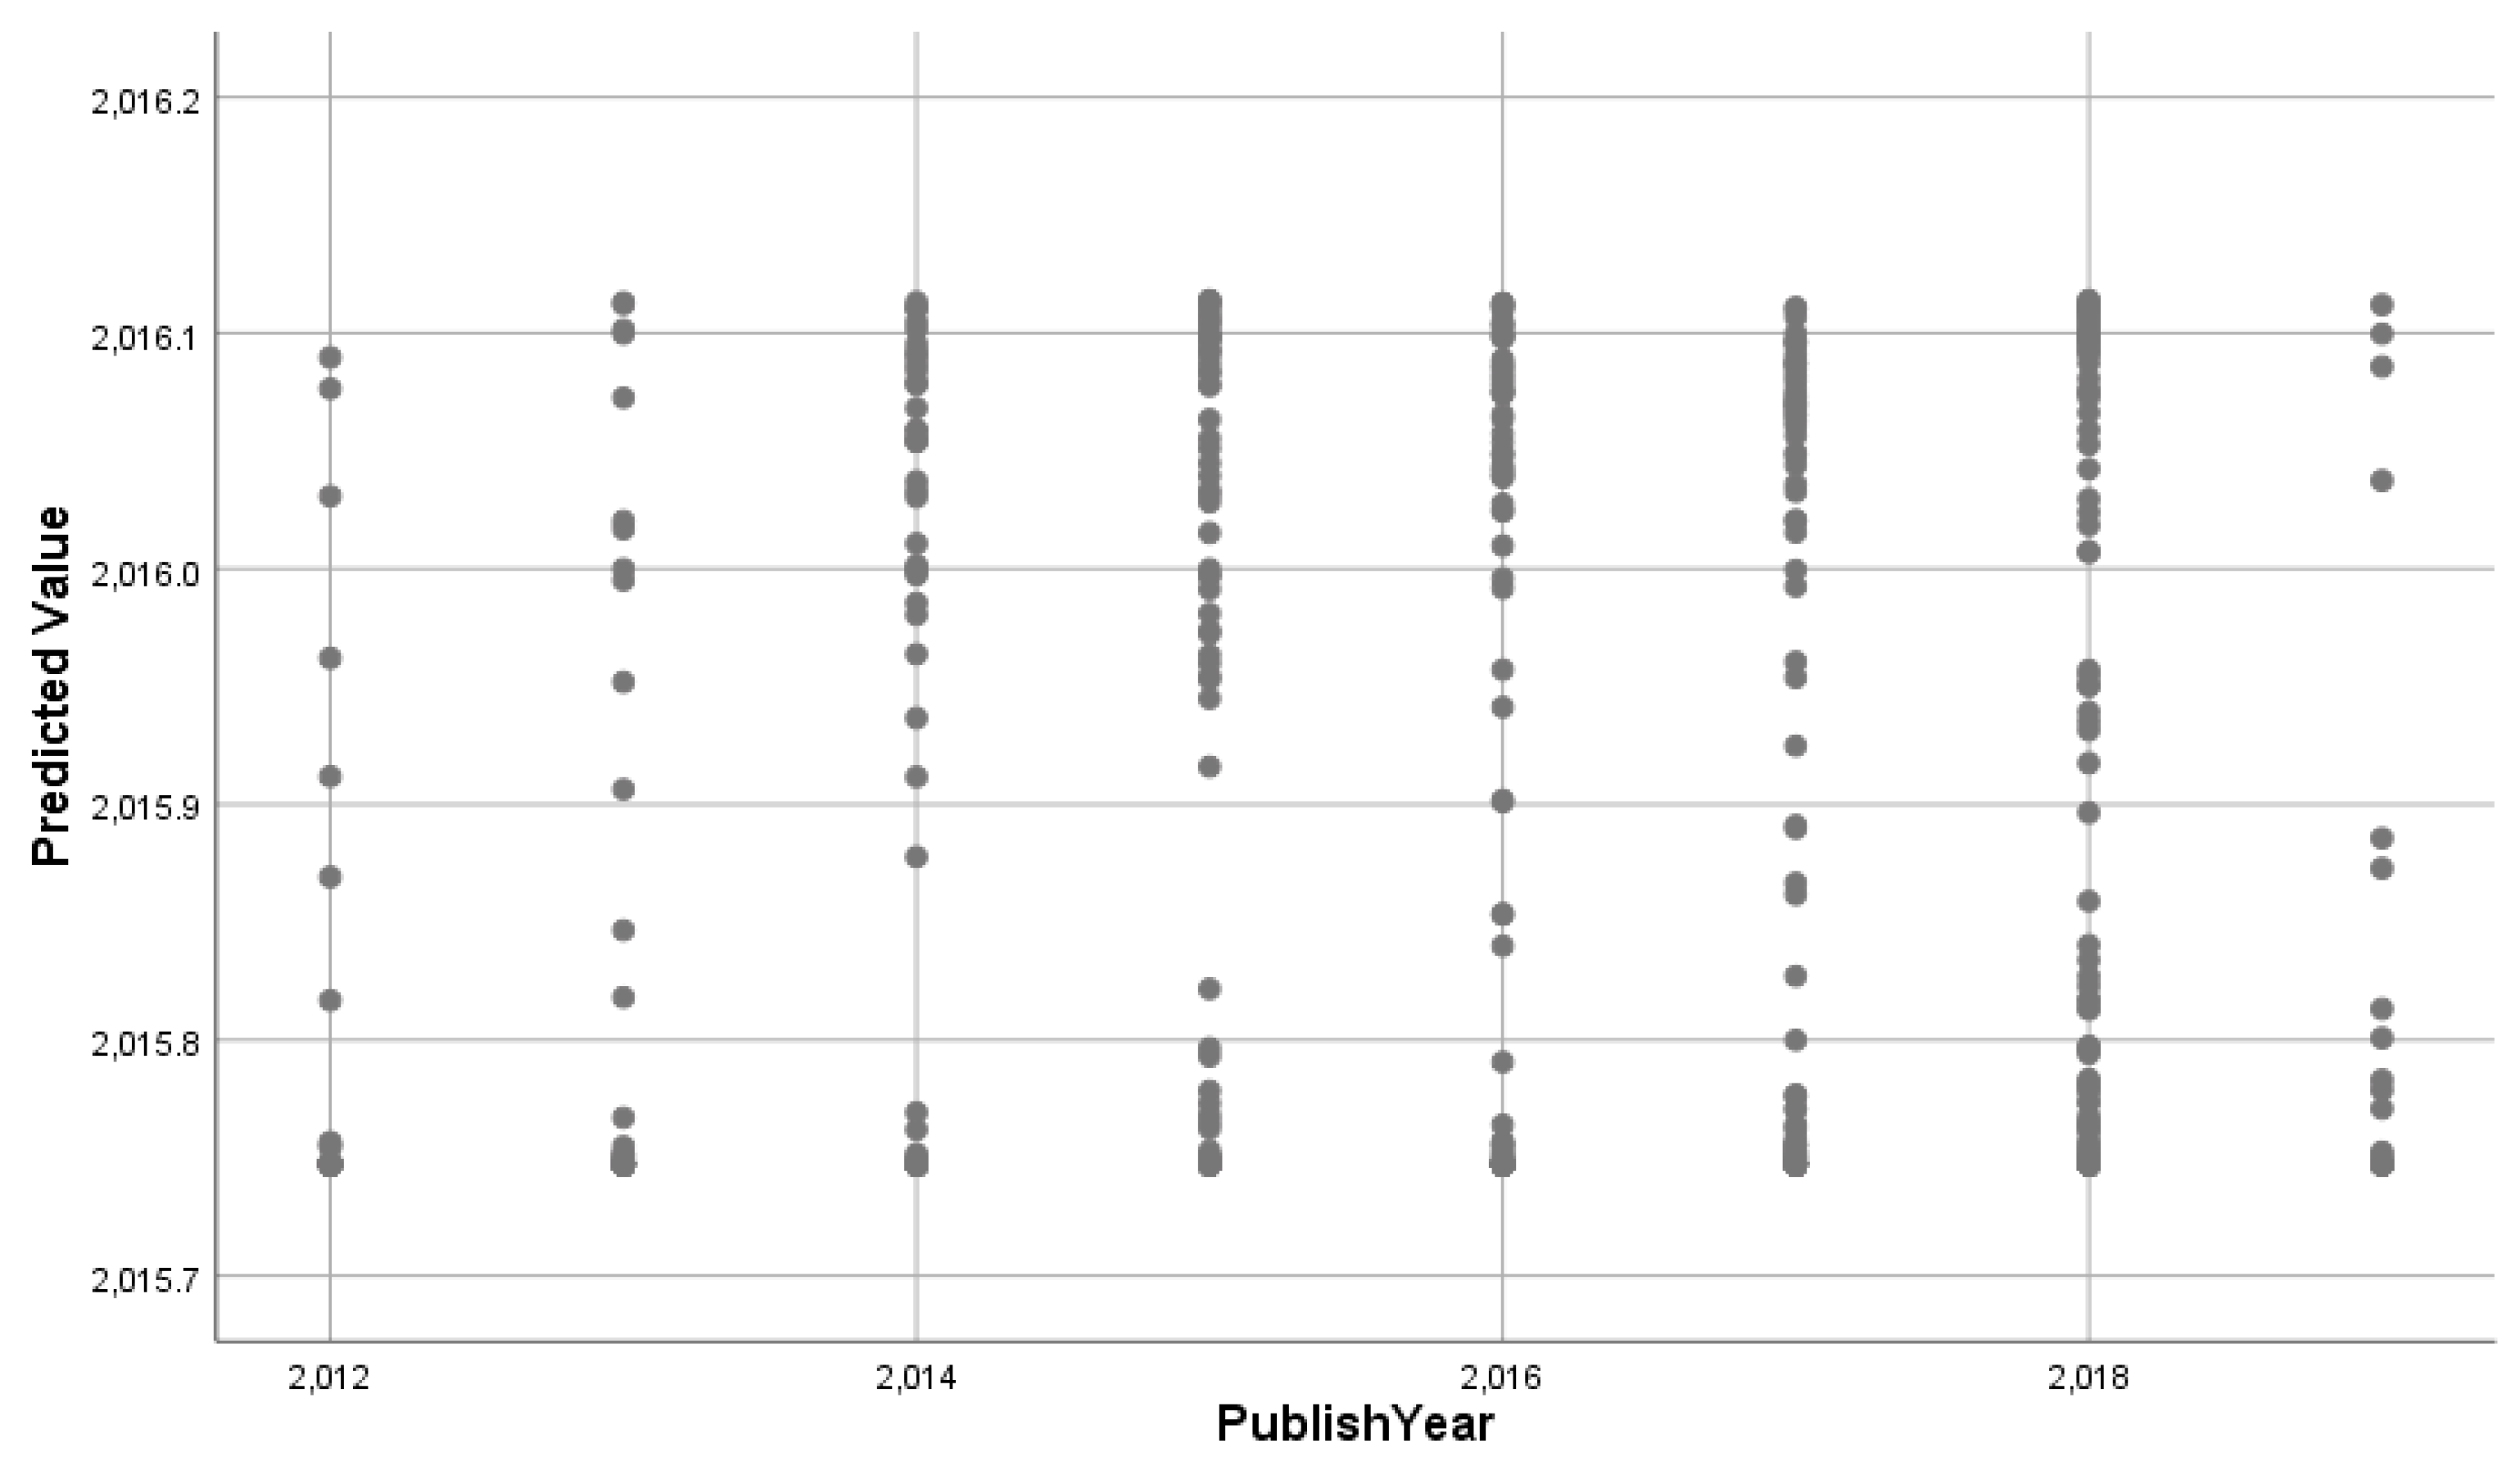
Figure 2 shows a graph predicted by observables, in which this graph displays a graph of the variance of values predicted on the y axis over values observed on the x axis for combined training and testing samples for the dependent variable on the publish year scale.
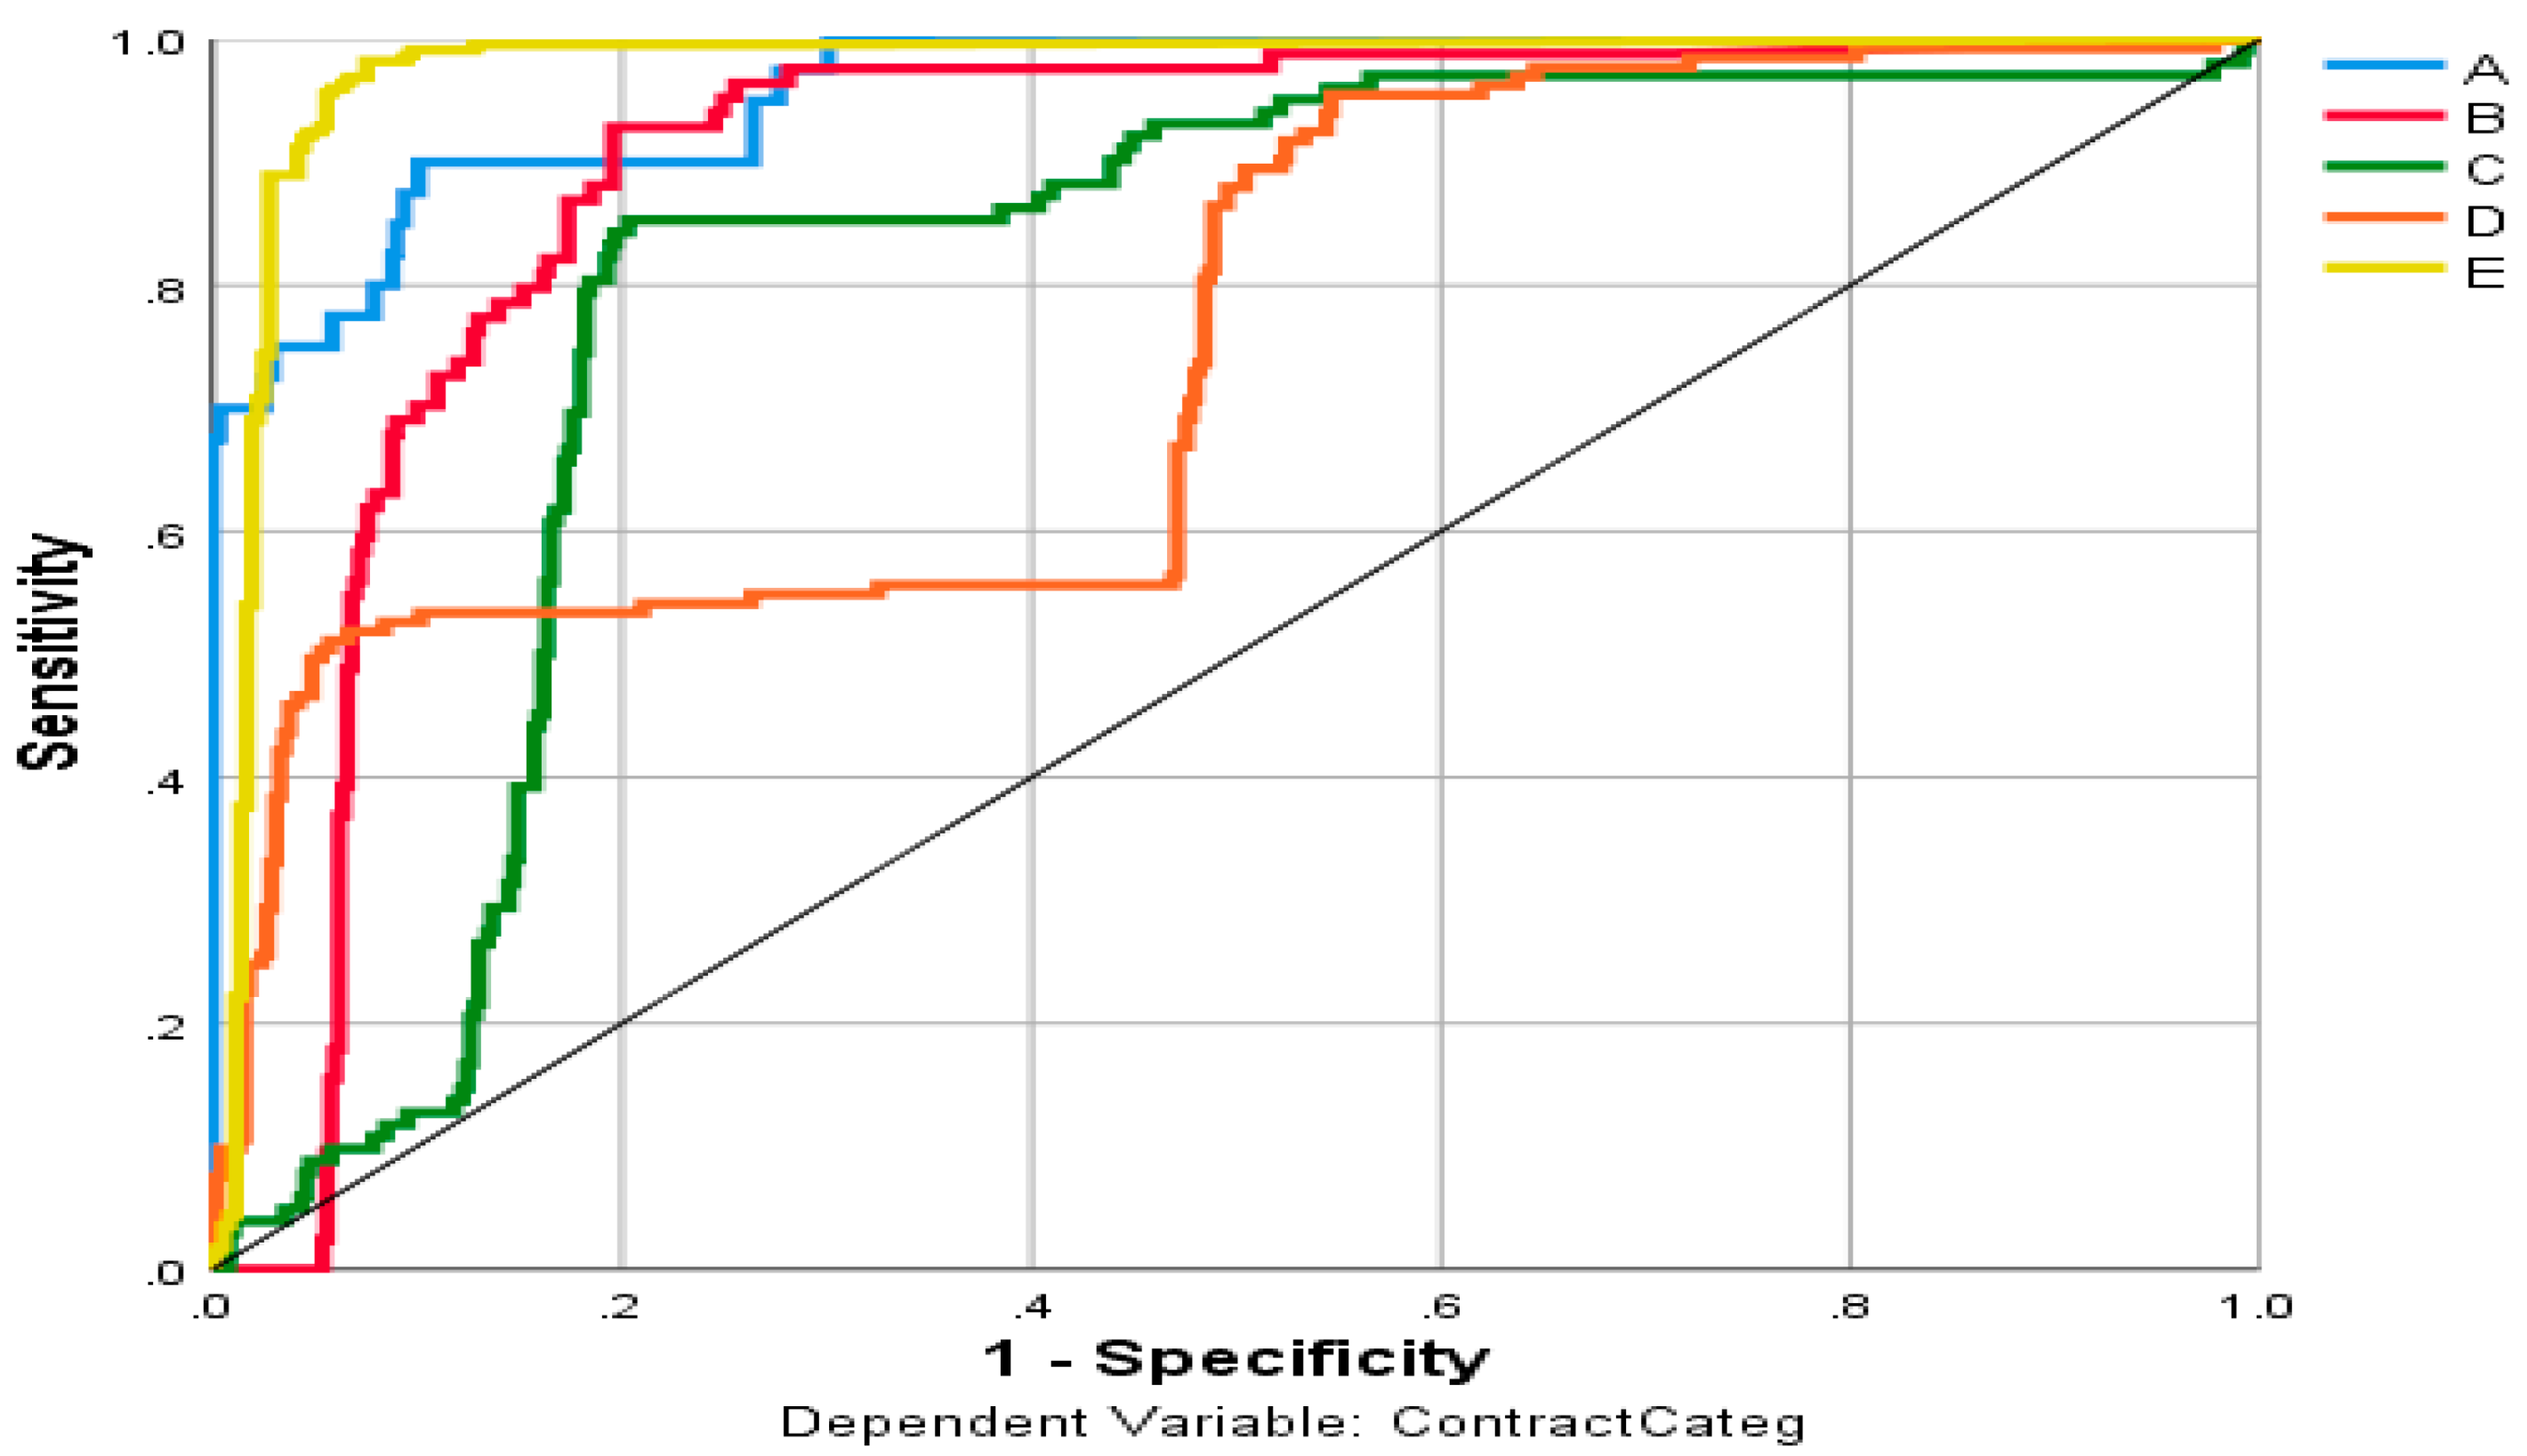
Figure 3 shows the ROC curve (receiver performance) for the categorical dependent variable ContractCateg. It displays a curve for each category. Where the ROC is graph showing the performance of a classification model at all classification thresholds and serves to visualize and analyze the relationship between one or two performance measures and the threshold as well.
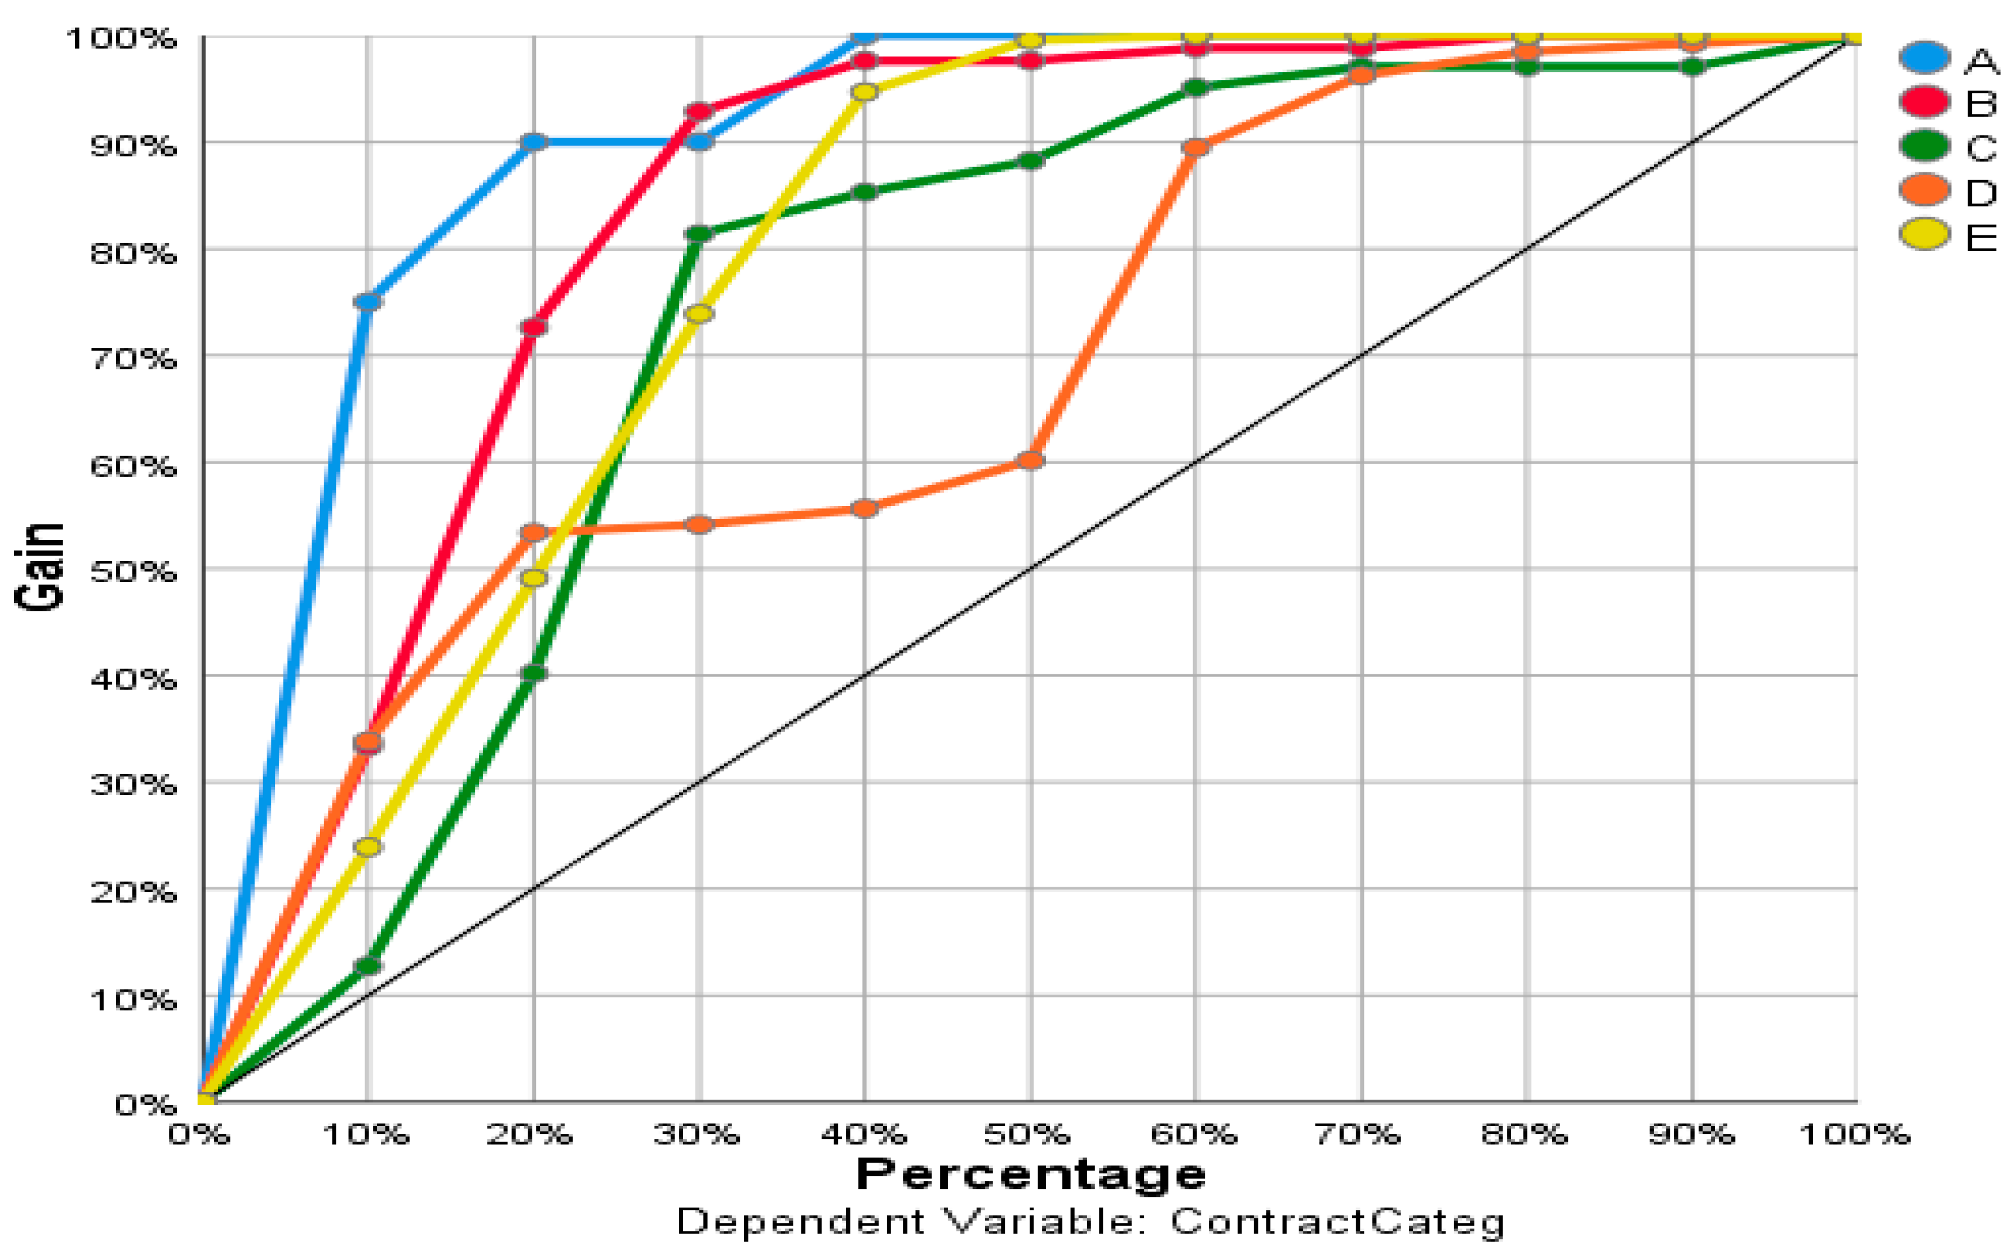
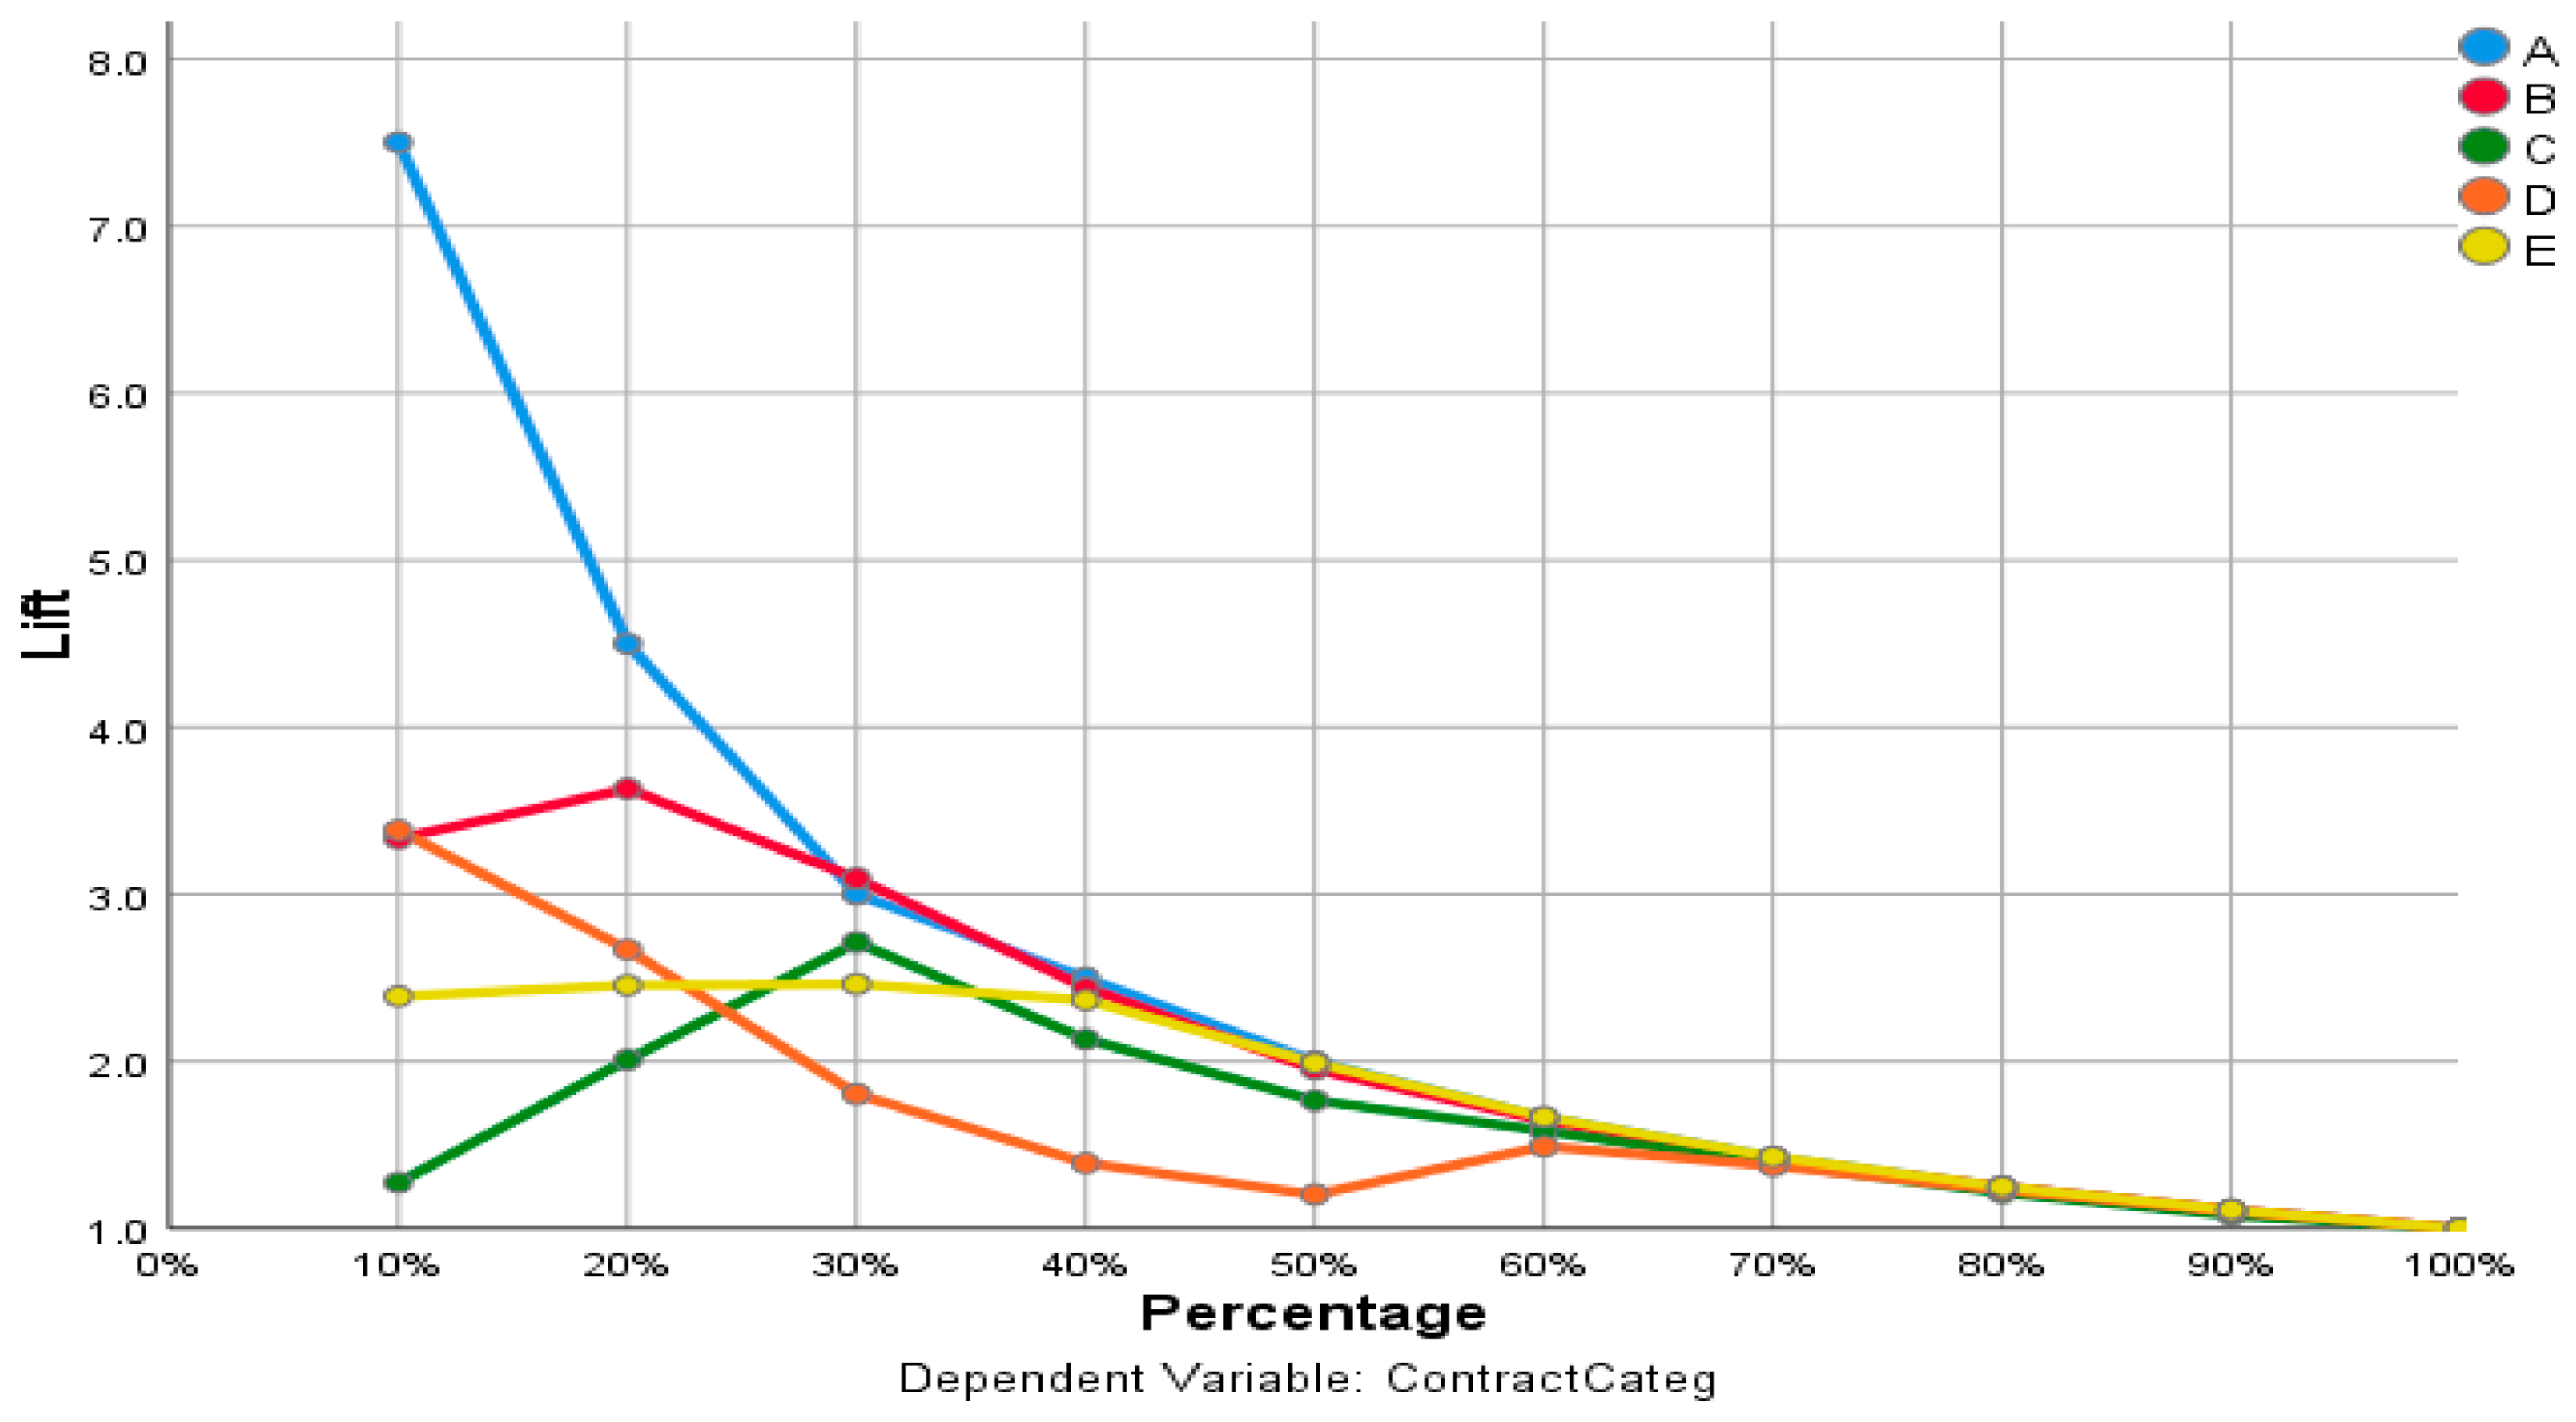
Figure 4 displays a graph of total revenue for the dependent variable ContractCateg. It shows a percentage of the total number of cases in this “acquired” category, segmenting a percentage of the total number of cases.
Figure 5 shows a height graph for the categorical dependent variable ContractCateg.
Table 5 indicates the area under each curve for the dependent variable ContractCateg.
Table 6 presents an independent variable importance analysis (the factors weights and their rank). Thus, a sensitivity analysis is performed, showing the significance of each predictor by the determination of the neural network.
From
Table 6, budget is the most important factor affecting the number of published articles and the class of the journal for all the training types.
When calculating the average of weights for the three types of training, the order of the ranks that affect publishing articles was as follows: budget, project duration, department, journal category, faculty, staff from outside the KAU, and finally staff from inside the KAU.
6. Conclusions and Future Research
In this a study, a multilayer perceptron ANN was developed to determine the factors affecting publishing articles of distinct research study program in KAU and their weights. The factors taken into consideration in this study such as project duration, number of inside, and number of outside staff were not considered in many similar studies.
The results show that the budget, as most of the similar research studies in this area, was the most important factor and the three different training types gave the same rank for the budget. The second important factor was the project duration, which is the available time to complete the project and publish the article in ISI journal. Two types of training gave this factor rank 2 while the third training approach ranked it 4. The third important factor is the department that the submitted project belongs to it. Two training methods ranked the department 3 while the third training method ranked it 4.
ANN was selected to handle this problem because it has the ability to store information on the entire network and parallel processing capability. Additionally, ANN is more suitable to handle our problem because we had two dependent variables; number of publications per year, which is numerical, and the contract category (A, B, C, D, or E), which is ordinal (string).
Determining the factors affecting publishing in ISI journals needs further large-scaled research that can handle all different research areas. This study can be extended to include the staff scientific rank and their number at each rank. It is recommended to use a neural network merged with other metaheuristics approaches such as genetic algorithm and particle swarm in to increase the performance of NN. Additionally, the problem can be dealt as a fuzzy problem for some variables.


