Article

Using Data-Compressors for Classification Hunting Behavioral Sequences in Rodents as “Ethological Texts”

1
Institute of Animal Systematics and Ecology, Siberian Branch of the Russian Academy of Sciences, 630091 Novosibirsk, Russia
2
Department of General Biology and Ecology, Novosibirsk State University, 630090 Novosibirsk, Russia
3
V. Zelman Institute for Medicine and Psychology, Novosibirsk State University, 630090 Novosibirsk, Russia
4
Department of Information Technologies, Novosibirsk State University, 630090 Novosibirsk, Russia
5
Institute of Computational Technologies, Siberian Branch of the Russian Academy of Sciences, 630090 Novosibirsk, Russia
*
Author to whom correspondence should be addressed.
Mathematics 2020, 8(4), 579; https://doi.org/10.3390/math8040579
Submission received: 29 February 2020 / Revised: 2 April 2020 / Accepted: 9 April 2020 / Published: 14 April 2020
(This article belongs to the Special Issue Information Theory, Cryptography, Randomness and Statistical Modeling)

Abstract

:
One of the main problems in comparative studying animal behavior is searching for an adequate mathematical method for evaluating the similarities and differences between behavioral patterns. This study aims to propose a new tool to evaluate ethological differences between species. We developed the new compression-based method for the homogeneity testing and classification to investigate hunting behavior of small mammals. A distinction of this approach is that it belongs to the framework of mathematical statistics and allows one to compare the structural characteristics of any texts in pairwise comparisons. To validate a new method, we compared the hunting behaviors of different species of small mammals as ethological “texts.” To do this, we coded behavioral elements with different letters. We then tested the hypothesis whether the behavioral sequences of different species as “texts” are generated either by a single source or by different ones. Based on association coefficients obtained from pairwise comparisons, we built a new classification of types of hunting behaviors, which brought a unique insight into how particular elements of hunting behavior in rodents changed and evolved. We suggest the compression-based method for homogeneity testing as a relevant tool for behavioral and evolutionary analysis.

1. Introduction

Since the mathematical succession of Fibonacci, that can be expressed in the petals or leaves on many plants, in the shells, as well in as galaxies in space, and in hurricanes over the ocean, scientists have tried to predict the behavior of nature (see, for example, [1]). Behavioral reactions of animals seem changeable and rather ephemeral, however, since classic works of Konrad Lorenz [2], behavioral patterns serve as a criterion for distinguishing between species, often as reliable as morphological features. One of the main problems in comparative studying animal behavior is searching for a reliable tool for evaluating the similarities and differences between behavioral patterns within more or less closely related taxa. The primary rationale for the use of phylogenetically based statistical methods is that phylogenetic signal, the tendency for related species to resemble each other, is ubiquitous; however, behavioral traits exhibit a lower signal than body size, morphological, life-history, or physiological characteristics [3]. When dealing with behavioral sequences, it is desirable to take into consideration the probabilistic nature of this kind of data and extreme context sensitivity [4]. Comparison and classification of the same types of behavioral sequences in different species would help to reveal the relationship between behavioral plasticity and evolutionary processes (sensu: [5]). The solution to these problems depends to a great extent on the availability of an adequate mathematical method. There is a huge body of literature that analyses “biological texts” mainly, DNA sequences (see for example [6,7,8,9]). The analysis of behavioral organization in humans and animals is an area being greatly advanced through the application of mathematical methods [10,11,12,13,14,15,16], and some of them are based on the ideas of Kolmogorov complexity [17,18] and on the use of data compressors [19,20]. However, these approaches do not give a possibility to use hypothesis testing, which is the primary method of quantitative analysis of biological data since Fisher’s classic works [21].
Recently we found a good model for the comparative study of widespread behavioral sequences of the same types within a particular taxon: optional hunting behavior in rodents [22]. We applied the data-compression method [23] to analyze hunting behavior in different rodent species as “texts” in which specific letters coded elements of hunting patterns. The data compression method is based on the ability of archiver programs to find regularities in any “text”, and do so within a frame of formal statistical analysis. By regularity, we mean any characteristic of a text that makes it more predictable, such as frequency of occurrence of letters and sub-sequences and so on. With the use of this method, we revealed a surprising similarity between hunting behaviors of the common shrew, which is insectivorous, and several rodent species [24]. However, further behavioral observations showed that the modes of hunting could differ in different species. The differences concern the order of particular behavioral elements, as well as some aspects of hunting attacks in different species. This means that although different rodent species display similar predictability of transitions between elements within sequences, they possibly possess the different structure of hunting behavior [25]. We thus need a new tool to evaluate differences between the structural features of the ethological “texts”.
Recently a compression-based solution for the homogeneity testing and classification of texts was proposed [26]. A distinction of the suggested method from other approaches is that it belongs to the framework of mathematical statistics and allows one to compare the structural characteristics of the texts in pairwise comparisons. In our case, this approach allows us to quantify the degree of structural similarities and differences between sequences of behaviors of different species as biological “texts”. Here we developed this method to evaluate structural differences between hunting behaviors in nine species of small mammals with various ecological traits and different types of diets. To do this, we recorded hunting behavior towards an insect in individual members of eight species of rodents and one insectivorous species as a standard of a predator. All behavioral elements were coded with different letters. We then tested the hypothesis whether the behavioral sequences of different species as “texts” are generated either by a single source or by different ones. The main idea of the approach is to combine fragments of the behavioral sequence of one species (“text X”) with fragments of another one (“text Y”), and then compress the combined sequences by an archiver. The text files which contain similar sequences will be compressed better. Based on the association coefficients obtained from pairwise comparisons, we built a new classification of types of hunting behaviors, which brought a unique insight into how hunting behavior in rodents possibly changed and evolved. The new classification obtained indicates the effectiveness of the proposed method for ethological and evolutionary studies.

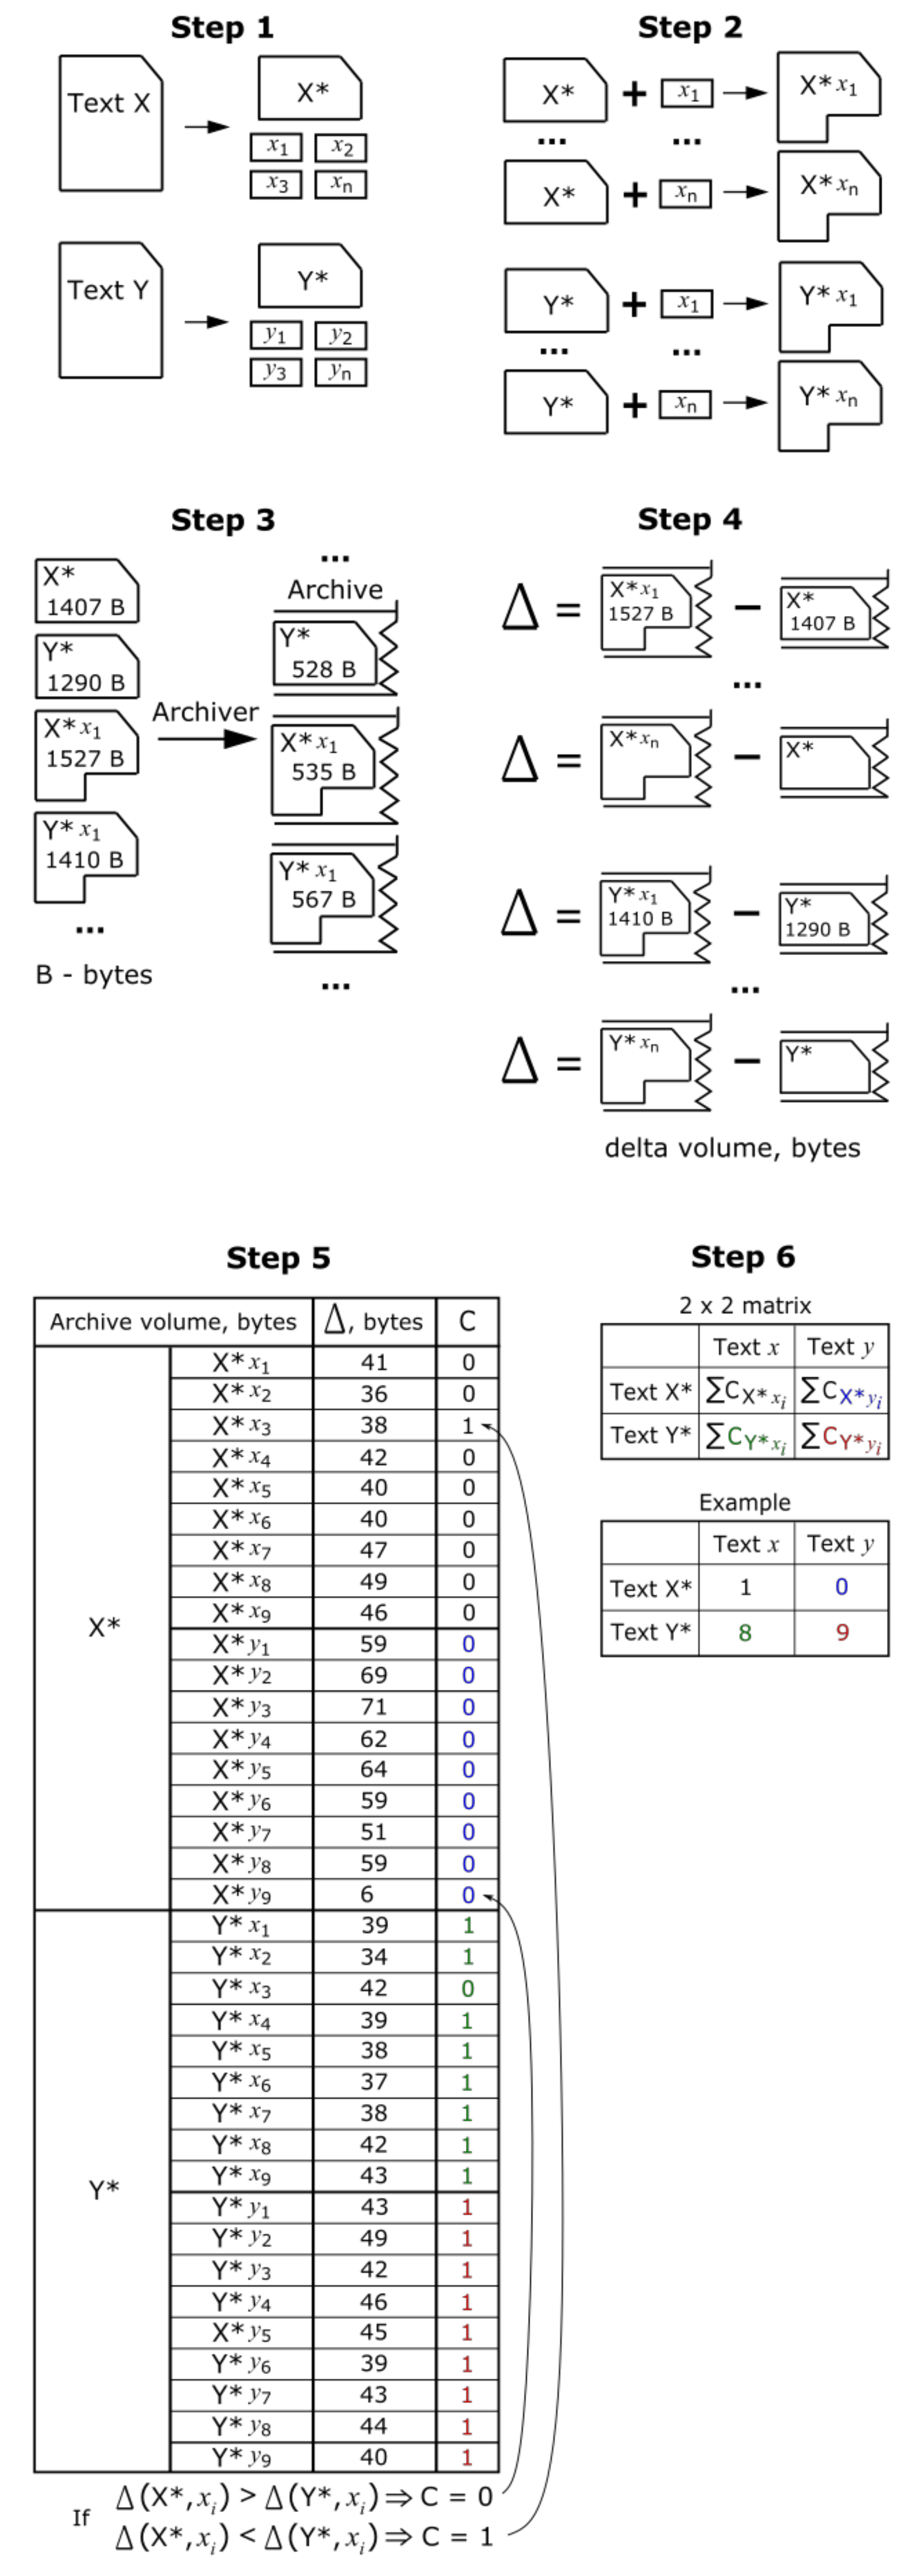
2. The Suggested Method

When comparing behavioral sequences as “texts”, we consider the hypotheses H0 = {the behavioral sequences are generated by a single source} and the alternative hypotheses H1 = {the behavioral sequences are generated by different sources}. We stored sequences of symbols (each corresponded to the performed behavioral element) into the text files (txt) (say, X, Y, Z). All species were compared with each other in pairs. Our task is to answer the question of how close these sources are to each other. To do this, first, we divide each source text file approximately in half. Suppose we are dealing with three sources. The first half we denote by X*, Y*, and Z*. We divide the second halves into fragments of the same size, for example, 120 bytes and designate them x1, x2 … xn; y1, y2 … yn and z1, z2 … zn. In our example, let “n” be equal to 9, and thus, there will be 27 such sample files. Then we individually add each resulting fragment (xi, yi, zi) to the first halves (X*, Y* and Z*). We thus obtain 81 augmented text files (X*xi, X*yi, X*zi, Y*xi, Y*yi, Y*zi and etc). All files obtained, including the first halves of the source files X*, Y* and Z*, are separately archived. Then each pair (X, Y), (X, Z), and (Y, Z) is examined separately and the association coefficient is determined for each one. Let us consider the pair (X, Y) as an example. We then obtained the differences between the volumes of archives source files and the augmented files (let us denote this difference as Δ; Δ(X*yi) = ϕ(X*yi) − ϕ(X*)), the example: ϕ(X*y1) – ϕ(X*) = 59 b and ϕ(Y*y1) − ϕ(Y*) = 41 b; ϕ(X*y2) − ϕ(X*) = 69 b, and ϕ(Y*y2) − ϕ(Y*) = 46 b; ϕ(X*y3) − ϕ(X*) = 71 b, and ϕ(Y*y3) − ϕ(Y*) = 38 b and etc. (where ϕ is the archive). We thus detected the number of cases in which the difference between the volumes of the source files and the augmented files were the smallest. Suppose, we have in all nine cases Δ (X*yi) > Δ (Y*yi), in one from those Δ (X*xi) < Δ (Y*xi), and in the rest eight Δ (Y*xi) < Δ (X*xi). Put the number of these cases in the corresponding cells of the 2 × 2 table (see also Figure A1 in Appendix A). In the case of our example, to compare the sources “X” and “Y”, the matrix will have the following form (Table 1):
Having done the same actions for pairs of sources X and Z, Y and Z, we obtain, for example, the following tables (Table 2 and Table 3):
For each of the matrices N 2 , 2 = n 1 , 1 n 1 , 2 n 2 , 1 n 2 , 2 , we calculated the coefficient of association V = ( n 1 , 1 n 2 , 2 n 1 , 2 n 2 , 1 ) / ( n 1 , 1 + n 1 , 2 ) ( n 1 , 1 + n 2 , 1 ) ( n 1 , 2 + n 2 , 2 ) ( n 2 , 1 + n 2 , 2 ) and the value of Fisher’s exact test [27,28]. The value of the association coefficient for the pair X and Y is 0.2, for X and Z is 1, and Y and Z it is 0.6. Coefficient V varies from 0 to 1; the closer the value to 1, the more differences, and vice versa, the closer to 0, the higher the similarity. The exact Fisher test shows the presence of significant differences for samples from the matrices X and Z, and Y and Z; for both cases, p < 0.01. Thus, we can say that the sequences X and Y are generated by one or very close sources, and the source Z is well distinguishable from others.
Returning to the suggested method itself in general, we placed all the obtained values of the association coefficients in the K × K matrix (where K is the number of species) symmetrically concerning the diagonal. Based on the association coefficients, we performed a joining cluster analysis (tree clustering) using Euclidean distance as a metric. For clustering, we used the free software PAST (PAleontological STatistics) v. 3.25.
In this study, we applied the open-source data compressor 7-zip v. 18.05 (64-bit), which uses the method of data compression called Bzip2, (compressed file format bz2). Preliminary, we compared three data compression methods (algorithms), namely, LZMA, Deflate and BZip2, and chose the one that compressed better. We set the following parameters in the graphical user interface (GUI) for archiving: compression level–normal; dictionary size–100 kb; number of CPU threads–6.

3. The Procedure

3.1. Notions and Data Encoding

We denote elementary movements and postures as minimal units of behavior (“behavioral elements” for brevity), we call a “behavioral sequence” an arbitrary sequence of successive behavioral elements. We use the notion “behavior”/”behavors” in general cases. Note that when comparing behavioral sequences belonging to different species, we thus compare “species themselves”. To assign behavioral elements and obtain behavioral sequences, we applied The Observer XT 12.5 (Noldus Information Technology). In sum, we selected 19 behavioral elements (see Appendix A, Table A1, Video S1; details in: [22,24]). We assigned the letters to elements of behavior, in the order of their appearance, without taking into account their duration. For example, if a rodent pursued an insect by calm walking for some time and then captured it with paws, the sequence would be SE. If an animal repeated a behavioral act several times, we recorded this as follows: one capturing with paws–E, if this element is repeated 4 times–EEEE, capturing with paws and then handling twice–ERR.

3.2. Constructing Sequences for Hypothesis Testing
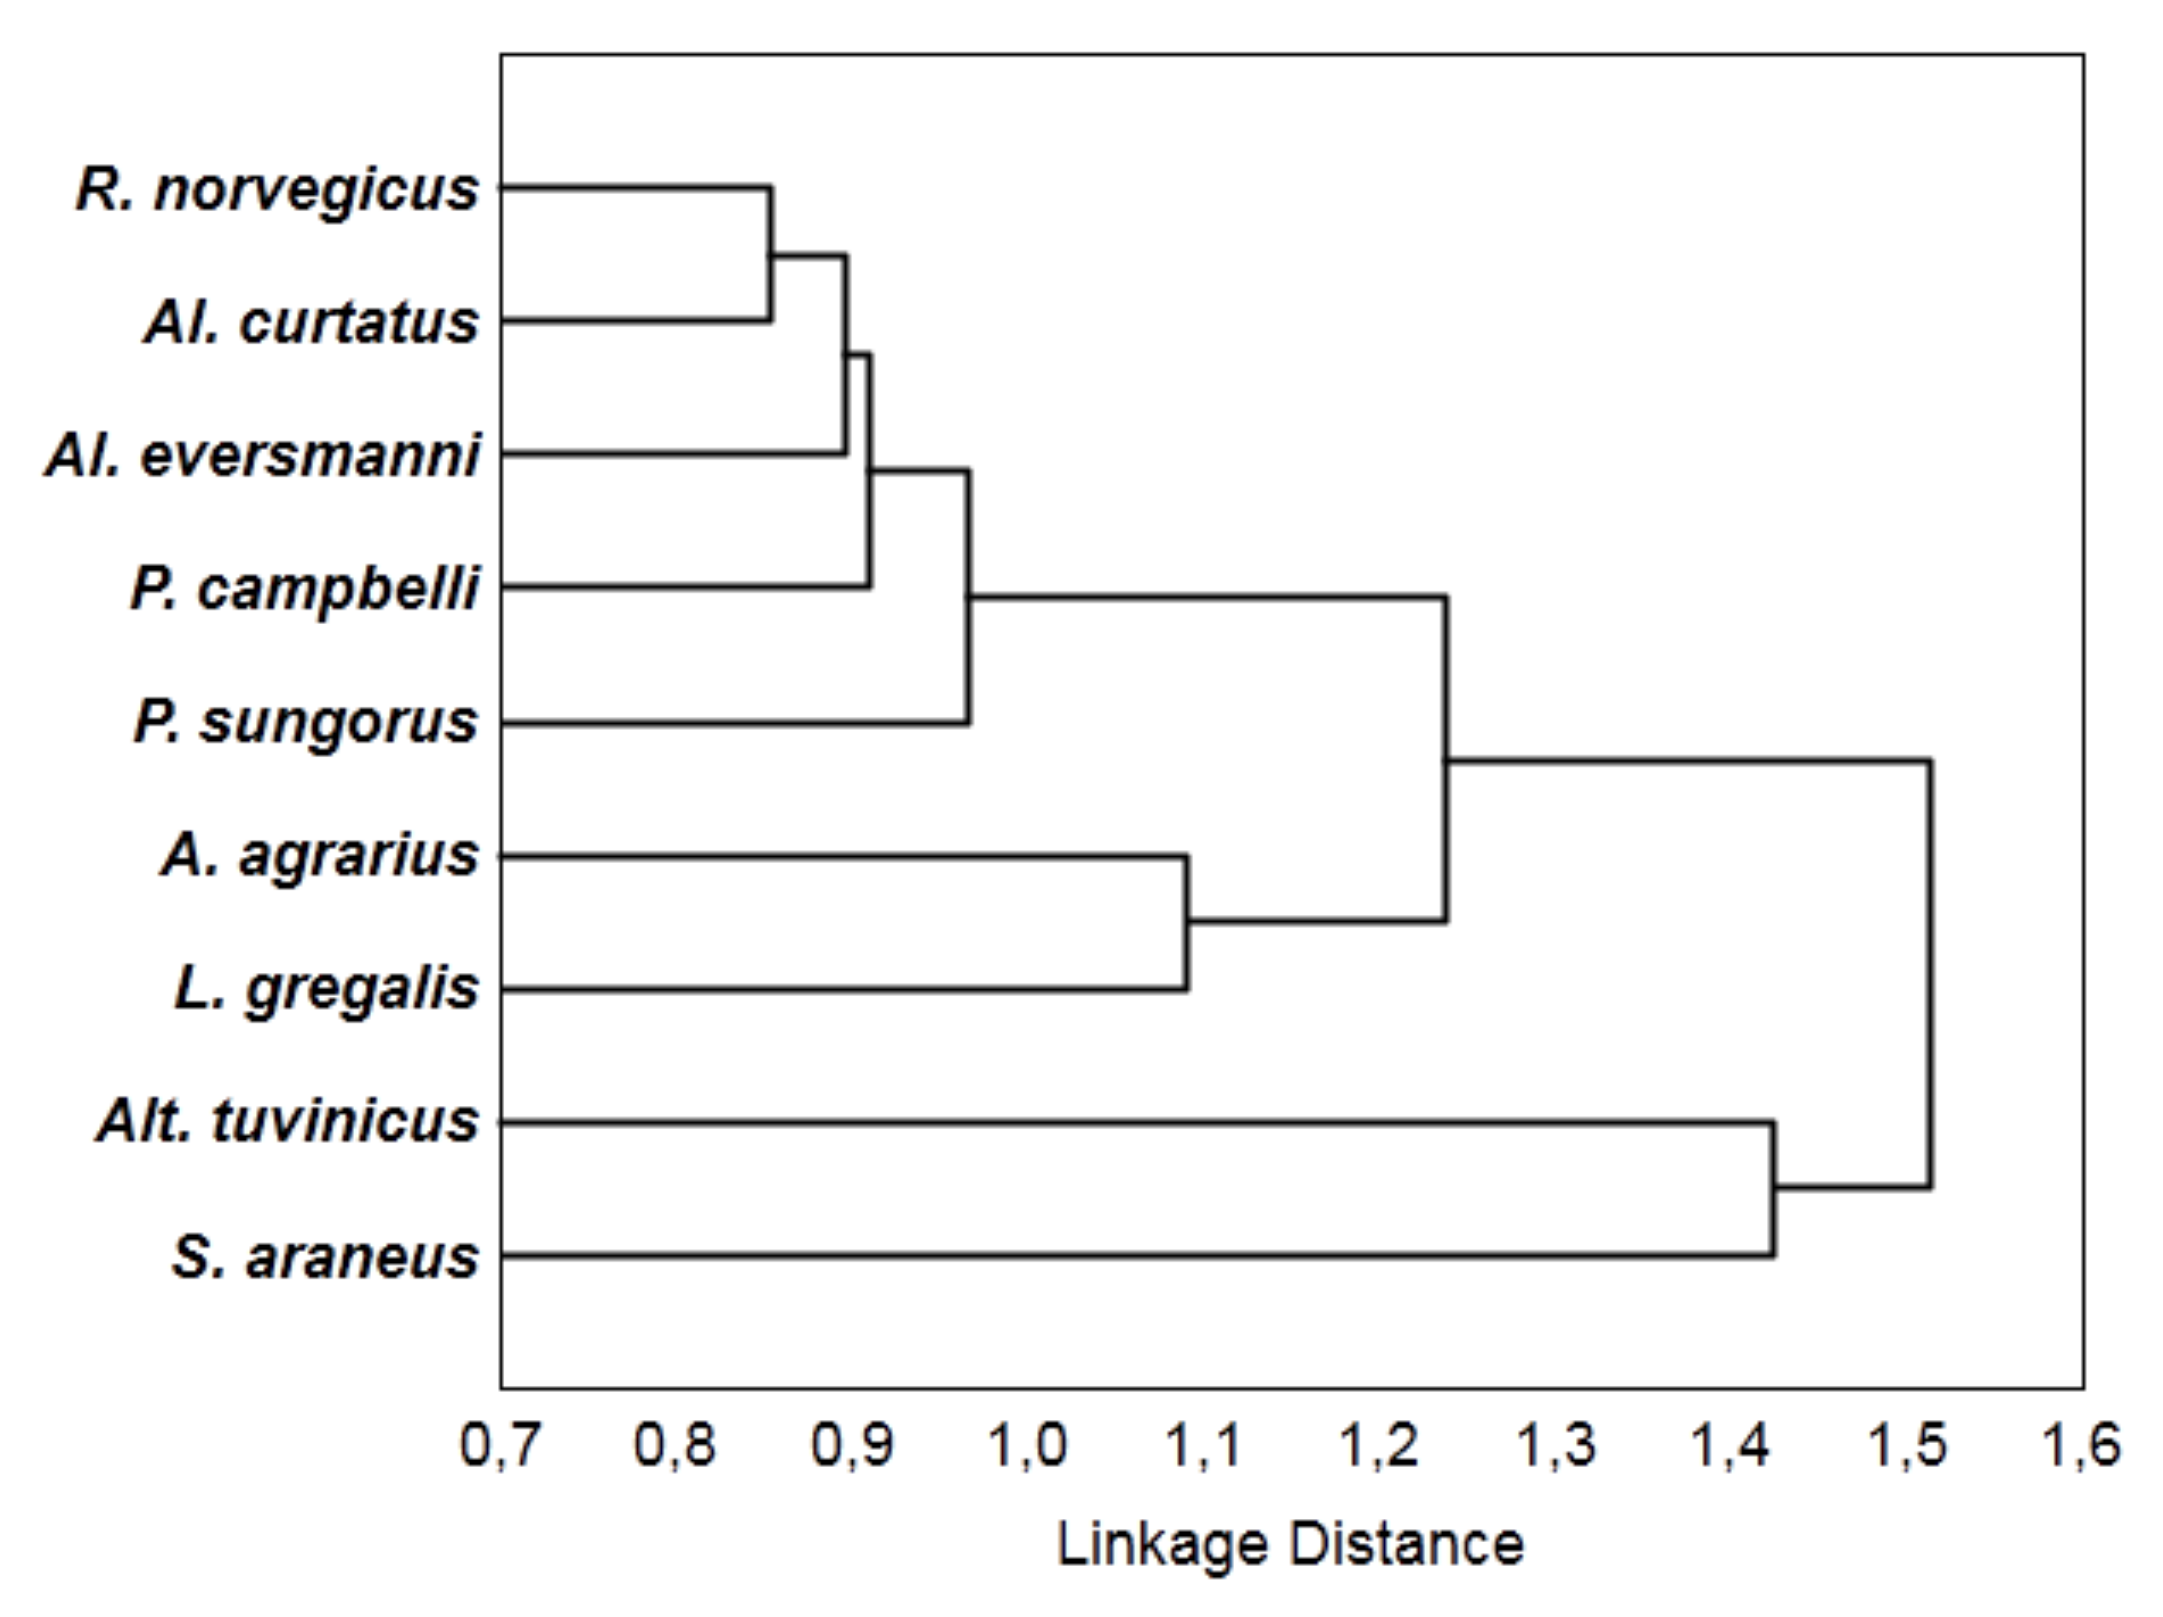
The resulting sequences, separated by spaces (such as, for example, QWERR QWEQWWEWVWE SWWWWWWWH), we transferred to text files, a separate file for each of the nine species. Then we divided each source file into approximately two halves, obtaining two text files (the difference between the halves was no more than 150 bytes). The first file containing half of the data was used as a whole for further calculations. The second file, using a special program, we divided into several fragments (sample text files), each with a volume of 120 bytes. For example, one of the sample text files included five behavioral sequences (116 symbols) and four blanks. The number of files in the output depended on the size of second half-part the source file. We obtained different numbers of sample files because the lengths and numbers of behavioral sequences and, correspondingly, the sizes of the half size source files were different for each species. We obtained 55 sample files in sum, for all nine species, in such a way that each sequence would not be exported twice, that is, it would appear in one file only. Information on the volume of data obtained is presented in Table 4.

4. Results

In sum, we obtained 36 tables 2 × 2, such as Table 5, as an example.
For each table, the association coefficient was calculated (see Table 6).
Based on the data from Table 6, we built a dendrogram (Figure 1). There are three groups here: (1) Alt. tuvinicus and S. araneus, (2) A. agrarius and L. gregalis, and (3) R. norvegicus and four hamster species.
To assess whether the value of the association coefficient is significant for each of the 2 × 2 matrices, we calculated the value of Fisher’s exact criterion (Table 7).

5. Discussion and Conclusions

We developed the compression-based method for the homogeneity testing and classification [26] to compare and analyze the hunting behavior of small mammals as ethological “texts”. This new approach allowed us to give an answer to the question about the differences between structural characteristics of hunting behaviors within a representative group of species at a significance level of 0.05. We compared in pairs eight rodent species with various ecological traits and different types of diets, and one insectivorous species as a standard of a predator. We can now propose a new classification of predatory behavior within the studied group, based on association coefficients.
In particular, we found that the behavioral sequences of S. araneus and Alt. tuvinicus differ from those of all other species. On the dendrogram (Figure 1), they are combined into a separate cluster. Naturally, these ethological “texts” are generated by different sources (the association coefficient is 1), as the first species is insectivorous, and the second one belongs to rodents, like the rest of all species. From the ethological point, that the herbivorous vole, like the insectivorous shrew, differs from the rest of the species, enables us to search distinct traits in its hunting attacks.
It is of particular interest for us to find four species of hamsters in the same cluster with the rat R. norvegicus. That all hamster species bear similarities, confirms the validity of the method. That precisely the sequences of R. norvegicus, Al. eversmanni and Al. curtatus, are generated by one source, although hamsters and rats are not phylogenetically close, possibly caused by the particular abilities of these three species to manipulate with forepaws when handling the prey. Recently we revealed similarities between these two hamster species and the Norway rat at a behavioral level [25]; however, only now we find quantitative confirmation of this.
In sum, a new classification of types of hunting behaviors obtained brings a unique insight into how particular elements of hunting behavior in rodents possibly changed and evolved. We suggest that the compression-based method for the homogeneity testing may well be more broadly applicable to behavioral and evolutionary analysis.

Supplementary Materials

The following are available online at https://www.mdpi.com/2227-7390/8/4/579/s1, Video S1: The Tuva silver vole preys on a cockroach.

Author Contributions

Conceptualization, J.L., B.R., Z.R. and S.P.; data curation, J.L., A.N. and S.P.; formal analysis, J.L., A.N. and S.P.; funding acquisition, Z.R. and B.R.; investigation, J.L., A.N., S.P., Z.R. and B.R.; methodology, B.R., J.L., Z.R., S.P. and A.N.; project administration, Z.R. and B.R.; resources, J.L. and Z.R.; software, J.L.; supervision, Z.R. and B.R.; validation, J.L. and S.P.; visualization, J.L., S.P. and A.N.; writing, original draft preparation, J.L. and Z.R.; writing, review and editing, J.L., Z.R., B.R. and S.P. All authors have read and agreed to the published version of the manuscript.

Funding

Jan Levenets, Anna Novikovskaya, Sofia Panteleeva and Zhanna Reznikova were supported by Russian Fund for Basic Research 20-04-00072 and by Program of the Russian Academy of Sciences 2013–2021, AAAA-A16-AAAA-A16-116121410120-0. Boris Ryabko was supported by Russian Fund for Basic Research 18-29-03005.

Acknowledgments

We are grateful to colleagues who provided us with the opportunity to work with live collections of animals: doctors Yurii Linvinov and Natalya Lopatina (Institute of Animal Systematics and Ecology, SB RAS) and doctors Alexey Surov, Natalia Feoktistova, and Anna Gureeva (Severtsov Institute of Ecology and Evolution, RAS). We thank Maxim Novikov for writing auxiliary programs for handling the data. We appreciate the efforts and valuable comments of four anonymous reviewers that helped us to improve the manuscript.

Conflicts of Interest

The authors declare no conflict of interest. The funders had no role in the design of the study; in the collection, analyses, or interpretation of data; in the writing of the manuscript, or in the decision to publish the results.

Appendix A

Animals and Housing

The experiments were conducted in the laboratory in 2012–2018 on nine species of small mammals. We used 81 non-pedigree Norway rats Rattus norvegicus, 26 striped field mice Apodemus agrarius, 19 Campbell’s dwarf hamster Phodopus campbelli, 30 Djungarian hamster P. sungorus, 8 Eversmann’s hamster Allocricetulus eversmanni, 13 Mongolian hamster Al. curtatus, 46 narrow-headed vole Lasiopodomys gregalis, 53 Tuva silver vole Alticola tuvinicus, 11 common shrews Sorex araneus.

Experimental Scheme

We placed each vertebrate animal in a separate arena and placed an insect as prey five min after. For video recordings we used a Sony Handycam DCR-SR68 camera (frame rate, 25 frames per second) for the most rodent species, and Sony HDR-AS200V (60 frames per second) for S. araneus, Al. eversmanni and Al. curtatus. During each test, an animal received three insects in turn. Video example (see Supplementary Video S1).
Table A1. An “alphabet” consisting of elements of hunting patterns in species studied.
SymbolsBehavioural Elements
QRunning
SWalking
WBite
ECapturing the prey by forepaws (only in rodents)
RHandling (only in rodents)
HNibbling insects’ legs
GCarrying the prey in teeth
DSniffing
NPinning the prey down to the ground by one paw (only in shrew)
MThe same, by two paws (only in shrew)
CFreezing
VTurning a body to 90°
BU-turn
FTurning a head
YRearing against the wall
UBackwards movement
XSelf-grooming
JJump
IFree-standing rearing
Figure A1. Here is a procedure for processing data to obtain the 2 × 2 matrices. Step 1. We divide each source file approximately in half. Then we leave the first half unchanged and divide the second one into several fragments of the same volume. The program that we used to cut text files is in the public domain: https://github.com/m-novikov/sequence_cut. Step 2. To the first parts of the source files, we added individually the fragments containing behavioral sequences of the same species and thus obtained files: X*x1, Y*y1, etc. After that, to the first parts of the source files, we added individually the fragments containing sequences of another species and thus obtained files X*y1, Y*x1, etc. We thus obtained the augmented files and got a possibility to compare structural features of behavioral sequences of two species. Step 3. We now archive all files obtained individually. Step 4. For each pair of species, we calculate the difference between the archive containing the augmented file and the first half of the source file. Step 5. We detect cases in which the difference between the archive containing the augmented file and the first half of the source file was minimal and calculate the sum of numbers of these cases. Step 6. We place the obtained data into the cells of the 2 × 2 matrix.
Mathematics 08 00579 g0a1

References

  1. Li, C.; Zhang, X.; Cao, Z. Triangular and Fibonacci number patterns driven by stress on core/shell microstructures. Science 2005, 309, 909–911. [Google Scholar] [CrossRef] [PubMed] [Green Version]
  2. Lorenz, K.Z. The comparative method in studying innate behavior patterns. In Society for Experimental Biology, Physiological Mechanisms in Animal Behavior (Society’s Symposium IV); Cambridge University Press: Cambridge, UK, 1950; pp. 221–268. [Google Scholar]
  3. Blomberg, S.P.; Garland, T., Jr.; Ives, A.R. Testing for phylogenetic signal in comparative data: Behavioral traits are more labile. Evolution 2003, 57, 717–745. [Google Scholar] [CrossRef]
  4. Malange, J.; Alberts, C.C.; Oliveira, E.S.; Japyassú, H.F. The evolution of behavioural systems: A study of grooming in rodents. Behaviour 2013, 150, 1295–1324. [Google Scholar] [CrossRef]
  5. West-Eberhard, M.J. Developmental Plasticity and Evolution; Oxford University Press: New York, NY, USA, 2003. [Google Scholar]
  6. Li, M.; Chen, X.; Li, X.; Ma, B.; Vitányi, P.M. The similarity metric. IEEE Trans. Inf. Theory 2004, 50, 3250–3264. [Google Scholar] [CrossRef]
  7. Cilibrasi, R.; Vitányi, P.M. Clustering by compression. IEEE Trans. Inf. Theory 2005, 51, 1523–1545. [Google Scholar] [CrossRef] [Green Version]
  8. Xie, X.; Guan, J.; Zhou, S. Similarity evaluation of DNA sequences based on frequent patterns and entropy. BMC Genomics 2015, 16, S5. [Google Scholar] [CrossRef] [PubMed] [Green Version]
  9. Huo, H.; Chen, X.; Guo, X.; Vitter, J.S. Efficient compression and indexing for highly repetitive DNA sequence collections. IEEE/ACM Trans. Comput. Biol. Bioinform. 2020, 14, 1–14. [Google Scholar] [CrossRef]
  10. Forrester, G.S. A multidimensional approach to investigations of behaviour: Revealing structure in animal communication signals. Anim. Behav. 2008, 76, 1749–1760. [Google Scholar] [CrossRef]
  11. Asher, L.; Collins, L.M.; Ortiz-Pelaez, A.; Drewe, J.A.; Nicol, C.J.; Pfeiffer, D.U. Recent advances in the analysis of behavioural organization and interpretation as indicators of animal welfare. J. R. Soc. Interface 2009, 6, 1103–1119. [Google Scholar] [CrossRef] [Green Version]
  12. Gadbois, S.; Sievert, O.; Reeve, C.; Harrington, F.H.; Fentress, J.C. Revisiting the concept of behavior patterns in animal behavior with an example from food-caching sequences in Wolves (Canis lupus), Coyotes (Canis latrans), and Red Foxes (Vulpes vulpes). Behav. Process. 2015, 110, 3–14. [Google Scholar] [CrossRef]
  13. Kershenbaum, A.; Blumstein, D.T.; Roch, M.A.; Akçay, Ç.; Backus, G.; Bee, M.A.; Coen, M.; Cao, Y.; Bohn, K.; Carter, G.; et al. Acoustic sequences in non-human animals: A tutorial review and prospectus. Biol. Rev. 2016, 91, 13–52. [Google Scholar] [CrossRef] [PubMed] [Green Version]
  14. Moore, T.Y.; Cooper, K.L.; Biewener, A.A.; Vasudevan, R. Unpredictability of escape trajectory explains predator evasion ability and microhabitat preference of desert rodents. Nat. Commun. 2017, 8, 1–9. [Google Scholar] [CrossRef] [Green Version]
  15. Whishaw, I.Q.; Faraji, J.; Kuntz, J.R.; Agha, B.M.; Metz, G.A.; Mohajerani, M.H. The syntactic organization of pasta-eating and the structure of reach movements in the head-fixed mouse. Sci. Rep. 2017, 7, 10987. [Google Scholar] [CrossRef] [PubMed] [Green Version]
  16. Casarrubea, M.; Aiello, S.; Di Giovanni, G.; Santangelo, A.; Palacino, M.; Crescimanno, G. Combining quantitative and qualitative data in the study of feeding behavior in male Wistar rats. Front. Psychol. 2019, 10, 881. [Google Scholar] [CrossRef] [PubMed]
  17. McCowan, B.; Doyle, L.R.; Hanser, S.F. Using information theory to assess the diversity, complexity, and development of communicative repertoires. J. Comp. Psychol. 2002, 116, 166–172. [Google Scholar] [CrossRef] [PubMed]
  18. Kadota, M.; White, E.J.; Torisawa, S.; Komeyama, K.; Takagi, T. Employing relative entropy techniques for assessing modifications in animal behavior. PLoS ONE 2011, 6, e28241. [Google Scholar] [CrossRef] [PubMed] [Green Version]
  19. Peng, Z.; Genewein, T.; Braun, D.A. Assessing randomness and complexity in human motion trajectories through analysis of symbolic sequences. Front. Hum. Neurosci. 2014, 8, 168. [Google Scholar] [CrossRef] [Green Version]
  20. Gauvrit, N.; Singmann, H.; Soler-Toscano, F.; Zenil, H. Algorithmic complexity for psychology: A user-friendly implementation of the coding theorem method. Behav. Res. Methods 2016, 48, 314–329. [Google Scholar] [CrossRef] [Green Version]
  21. Fisher, R.A. Statistical Methods, Experimental Design, and Scientific Inference; Oliver & Boyd: Edinburgh, UK, 1956. [Google Scholar]
  22. Reznikova, Z.; Levenets, J.; Panteleeva, S.; Ryabko, B. Studying hunting behaviour in the striped field mouse using data compression. Acta Ethol. 2017, 20, 165–173. [Google Scholar] [CrossRef]
  23. Ryabko, B.; Reznikova, Z.; Druzyaka, A.; Panteleeva, S. Using ideas of Kolmogorov complexity for studying biological texts. Theory Comput. Syst. 2013, 52, 133–147. [Google Scholar] [CrossRef] [Green Version]
  24. Reznikova, Z.; Levenets, J.; Panteleeva, S.; Novikovskaya, A.; Ryabko, B.; Feoktistova, N.; Gureeva, A.; Surov, A. Using the data-compression method for studying hunting behavior in small mammals. Entropy 2019, 21, 368. [Google Scholar] [CrossRef] [Green Version]
  25. Levenets, J.V.; Panteleeva, S.N.; Reznikova, Z.I.; Gureeva, A.V.; Feoktistova, N.Y.; Surov, A.V. Experimental Comparative Analysis of Hunting Behavior in Four Species of Cricetinae Hamsters. Biol. Bull. 2019, 46, 1182–1191. [Google Scholar] [CrossRef]
  26. Ryabko, B.; Guskov, A.; Selivanova, I. Using data-compressors for statistical analysis of problems on homogeneity testing and classification. In Proceedings of the 2017 IEEE International Symposium on Information Theory (ISIT), Aachen, Germany, 25–30 June 2017; IEEE: Piscataway, NJ, USA, 2017; pp. 121–125. [Google Scholar] [CrossRef] [Green Version]
  27. Fisher, R.A. On the interpretation of χ2 from contingency tables, and the calculation of P. J. R. Stat. Soc. 1922, 85, 87–94. [Google Scholar] [CrossRef]
  28. Fisher, R.A. Statistical Methods for Research Workers; Oliver and Boyd: New York, NY, USA, 1950. [Google Scholar]
Figure 1. A dendrogram of similarity between hunting behaviors in the species studied based on the association coefficients from Table 6.
Mathematics 08 00579 g001
Table 1. The 2 × 2 matrix obtained when comparing the sources “X” and “Y”.
xy
X*10
Y*89
Table 2. The 2 × 2 matrix obtained when comparing the sources “X” and “Z”.
xz
X*90
Z*09
Table 3. The 2 × 2 matrix obtained when comparing the sources “Y” and “Z”.
yz
Y*50
Z*49
Table 4. The volumes of data obtained.
SpeciesSizes of a Source Text Files (Bytes)Numbers of Sequences in Source Text FilesSizes of the First Parts of the Source Text Files (Bytes)Number of the Sample Files Obtained
Rattus norvegicus257210812909
Apodemus agrarius33438316729
Phodopus campbelli1715438014
P. sungorus1585767926
Allocricetulus eversmanni1463607315
Al. curtatus281411514079
Lasiopodomys gregalis1086345433
Alticola tuvinicus13191576595
Sorex araneus1637618185
Table 5. 2 × 2 matrix sample obtained when comparing two species (a concrete example).
SpeciesA. agrariusL. gregalis
A. agrarius60
L. gregalis33
Table 6. Volumes of coefficients of association for the 2 × 2 matrices.
SpeciesR. nor.A. ag.P. cam.P. sun.Al. ev.Al. cur.L. gr.Alt. tuv.S. ar.
R. norvegicus00.5810.740.370.2410.851
A. agrarius0.5800.280.870.8510.580.860.93
P. campbelli10.2800.5300.440.7311
P. sungorus0.740.870.5300.830.49111
Al. eversmanni0.370.8500.8300.450.611
Al. curtatus0.2410.440.490.4500.8211
L. gregalis10.580.7310.60.82011
Alt. tuvinicus0.850.861111101
S. araneus10.931111110
Note to the Table 6. We did not conduct pairwise comparisons within the same species and set 0 at the intersection of the corresponding column and row. In the same format, we fed the data info in a program for building a dendrogram.
Table 7. The volumes of Fisher’s exact criterion (** p < 0.01, * p < 0.05).
SpeciesR. nor.A. ag.P. cam.P. sun.Al. ev.Al. cur.L. gr.Alt. tuv.S. ar.
R. norvegicusX0.029*0.001 **0.011 *0.3601.0000.005 **0.005 **0.001 **
A. agrarius X1.0000.002 **0.005 **0.001 **0.1800.003 **0.003 **
P. campbelli X0.2001.0000.2300.1400.008 **0.009 **
P. sungorus X0.015*0.1000.020*0.002 **0.002 **
Al. eversmanni X0.1500.1900.008 **0.008 **
Al. curtatus X0.020*0.001 **0.001 **
L. gregalis X0.020 *0.020 *
Alt. tuvinicus X0.008 **
S. araneus X

