Article

Rock Classification from Field Image Patches Analyzed Using a Deep Convolutional Neural Network

1
College of Earth Science, Jilin University, Changchun 130061, China
2
College of Applied Technology, Jilin University, Changchun 130012, China
3
Jilin Business and Technology College, Changchun 130012, China
4
School of Environment Science and Spatial Informatics (CESI), China University of Mining and Technology, Xuzhou 221008, China
*
Author to whom correspondence should be addressed.
Mathematics 2019, 7(8), 755; https://doi.org/10.3390/math7080755
Submission received: 3 July 2019 / Revised: 13 August 2019 / Accepted: 13 August 2019 / Published: 18 August 2019
(This article belongs to the Special Issue Evolutionary Computation)

Abstract

:
The automatic identification of rock type in the field would aid geological surveying, education, and automatic mapping. Deep learning is receiving significant research attention for pattern recognition and machine learning. Its application here has effectively identified rock types from images captured in the field. This paper proposes an accurate approach for identifying rock types in the field based on image analysis using deep convolutional neural networks. The proposed approach can identify six common rock types with an overall classification accuracy of 97.96%, thus outperforming other established deep-learning models and a linear model. The results show that the proposed approach based on deep learning represents an improvement in intelligent rock-type identification and solves several difficulties facing the automated identification of rock types in the field.

1. Introduction

Rocks are a fundamental component of Earth. They contain the raw materials for virtually all modern construction and manufacturing and are thus indispensable to almost all the endeavors of an advanced society. In addition to the direct use of rocks, mining, drilling, and excavating provide the material sources for metals, plastics, and fuels. Natural rock types have a variety of origins and uses. The three major groups of rocks (igneous, sedimentary, and metamorphic) are further divided into sub-types according to various characteristics. Rock type identification is a basic part of geological surveying and research, and mineral resources exploration. It is an important technical skill that must be mastered by students of geoscience.
Rocks can be identified in a variety of ways, such as visually (by the naked eye or with a magnifying glass), under a microscope, or by chemical analysis. Working conditions in the field generally limit identification to visual methods, including using a magnifying glass for fine-grained rocks. Visual inspection assesses properties such as color, composition, grain size, and structure. The attributes of rocks reflect their mineral and chemical composition, formation environment, and genesis. The color of rock reflects its chemical composition. For example, dark rocks usually contain dark mafic minerals (e.g., pyroxene and hornblende) and are commonly basic, whereas lighter rocks tend to contain felsic minerals (e.g., quartz and feldspar) and are acidic. The sizes of detrital grains provide further information and can help to distinguish between conglomerate, sandstone, and limestone, for example. The textural features of the rock assist in identifying its structure [1] and thus aid classification. The colors, grain sizes, and textural properties of rocks vary markedly between different rock types, allowing a basis for distinguishing them [2]. However, the accurate identification of rock type remains challenging because of the diversity of rock types and the heterogeneity of their properties [3] as well as further limitations imposed by the experience and skill of geologists [4]. The identification of rock type by the naked eye is effectively an image recognition task based on knowledge of rock classification. The rapid development of image acquisition and computer image pattern recognition technology has thus allowed the development of automatic systems to identify rocks from images taken in the field. These systems will greatly assist geologists by improving identification accuracy and efficiency and will also help student and newly qualified geologists practice rock-type identification. Identification systems can be incorporated into automatic remote sensing and geological mapping systems carried by unmanned aerial vehicles (UAVs).
The availability of digital cameras, hand-held devices and the development of computerized image analysis provide technical support for various applications [
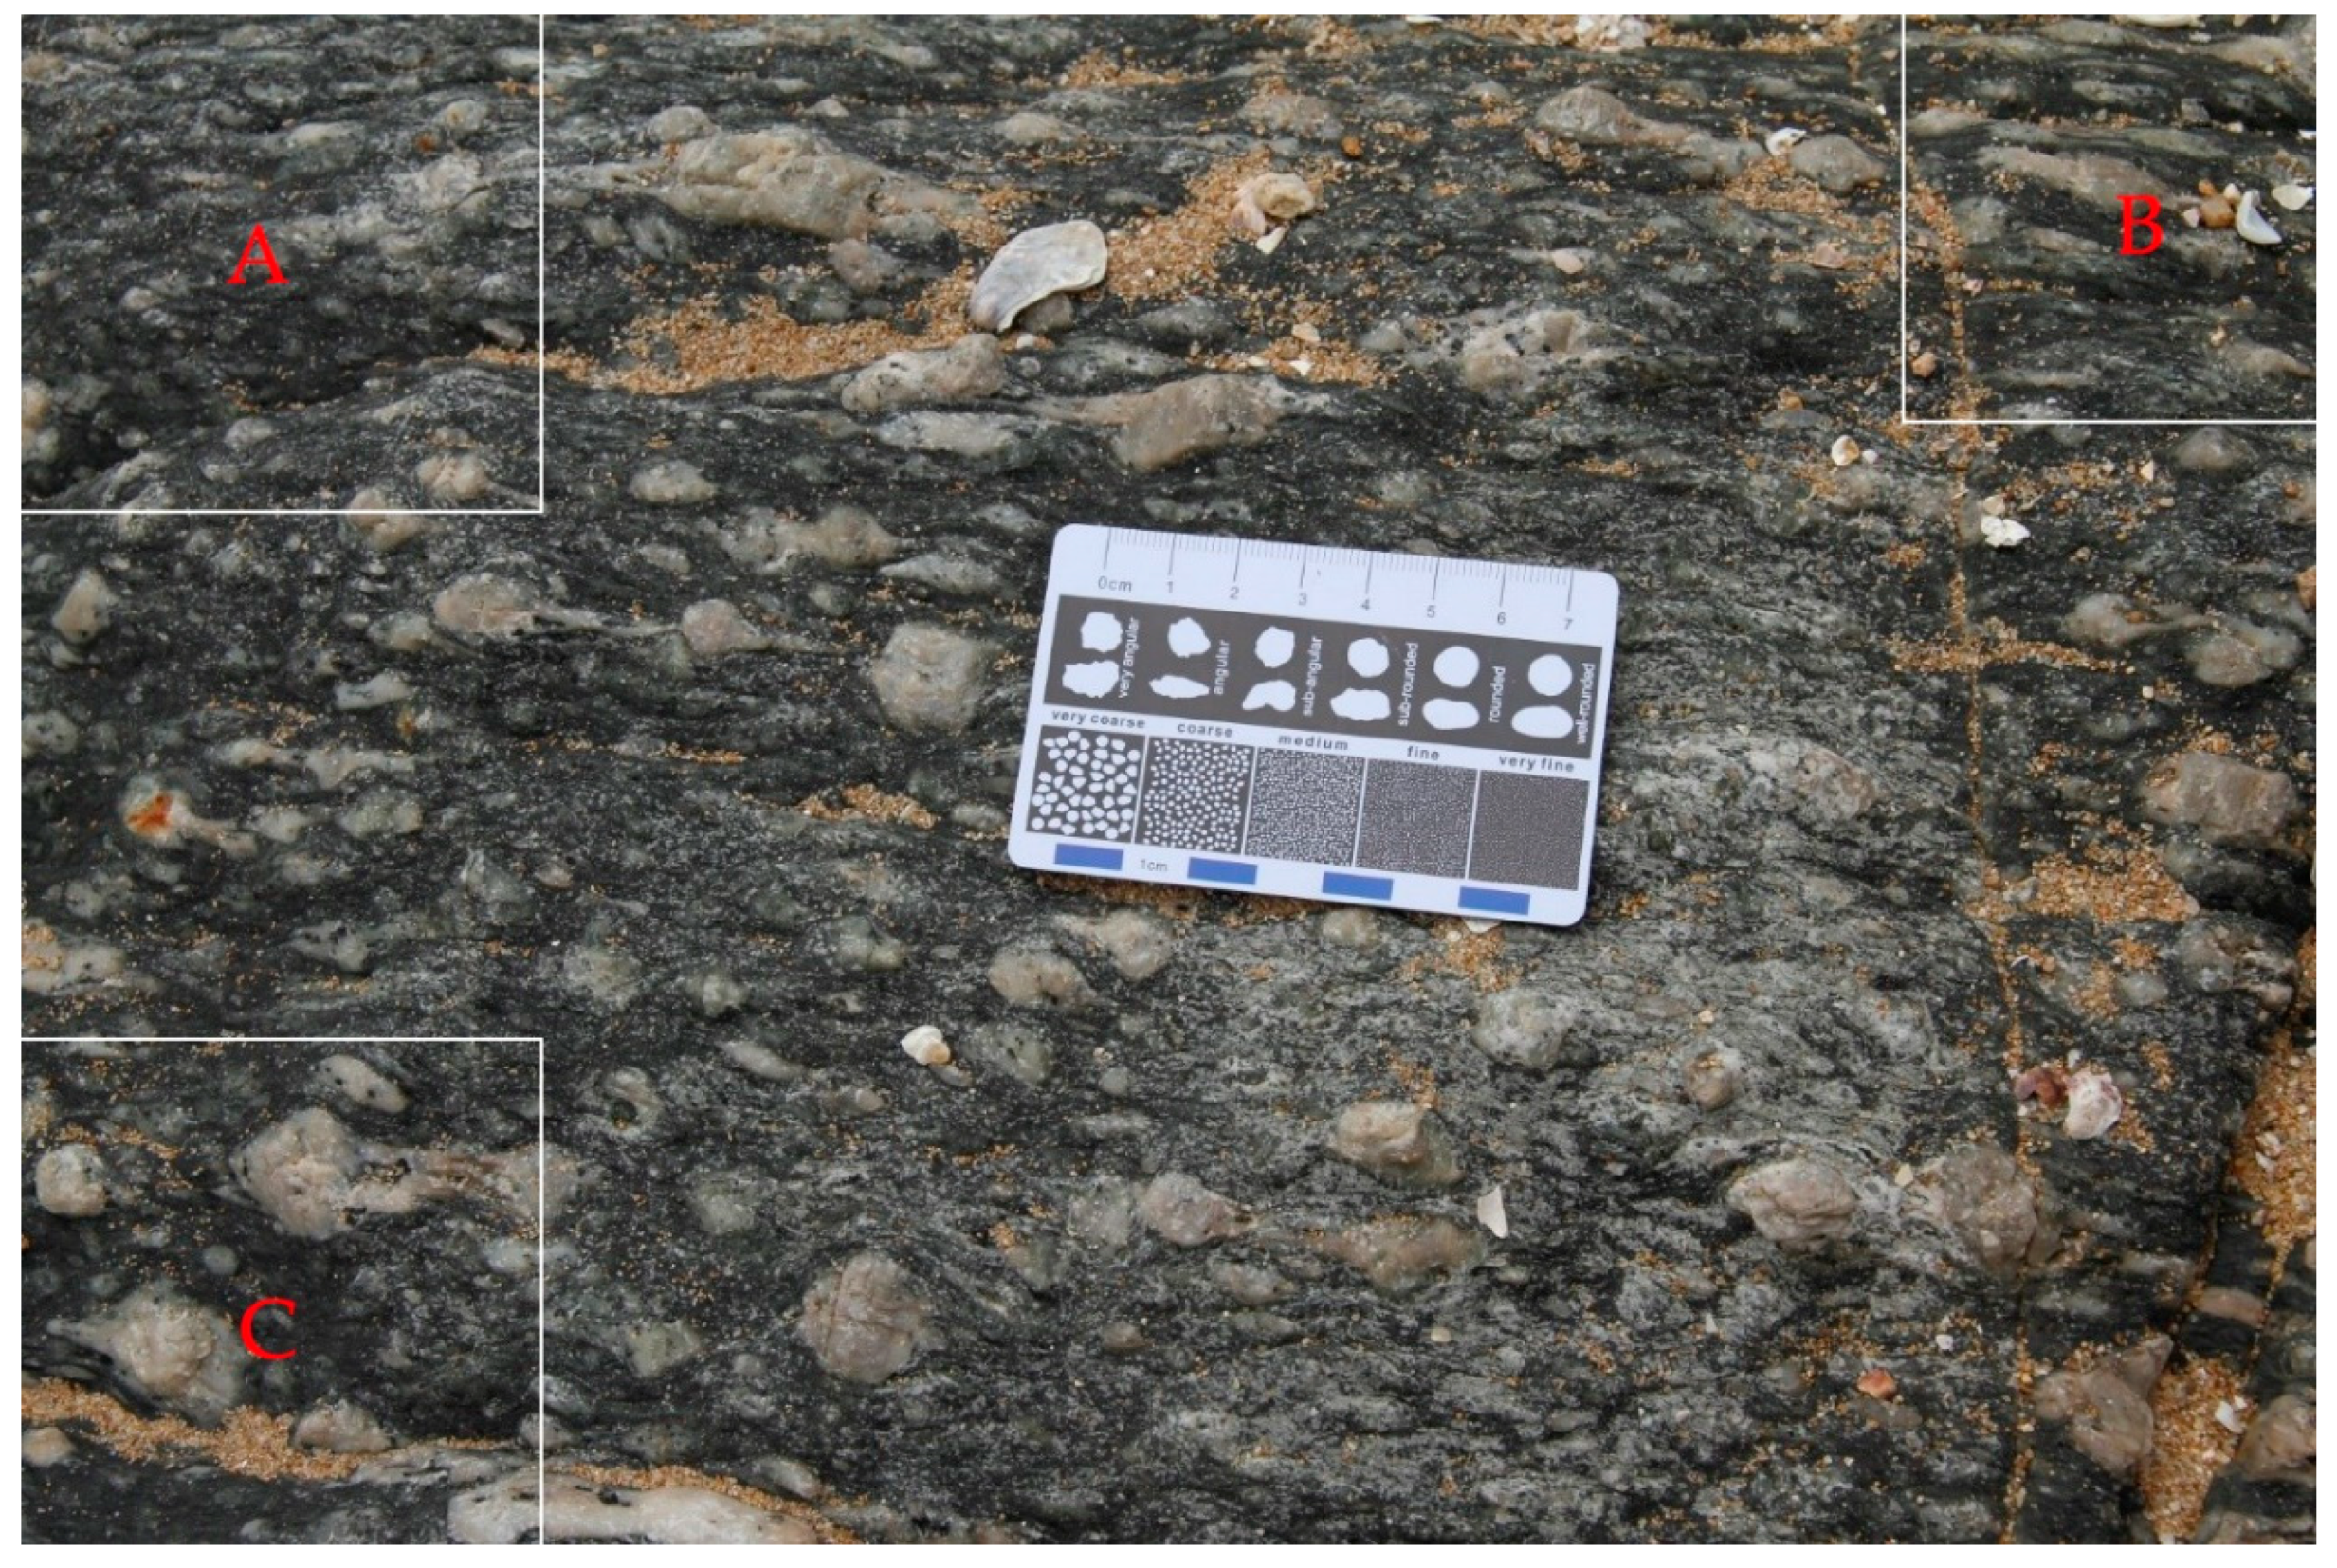
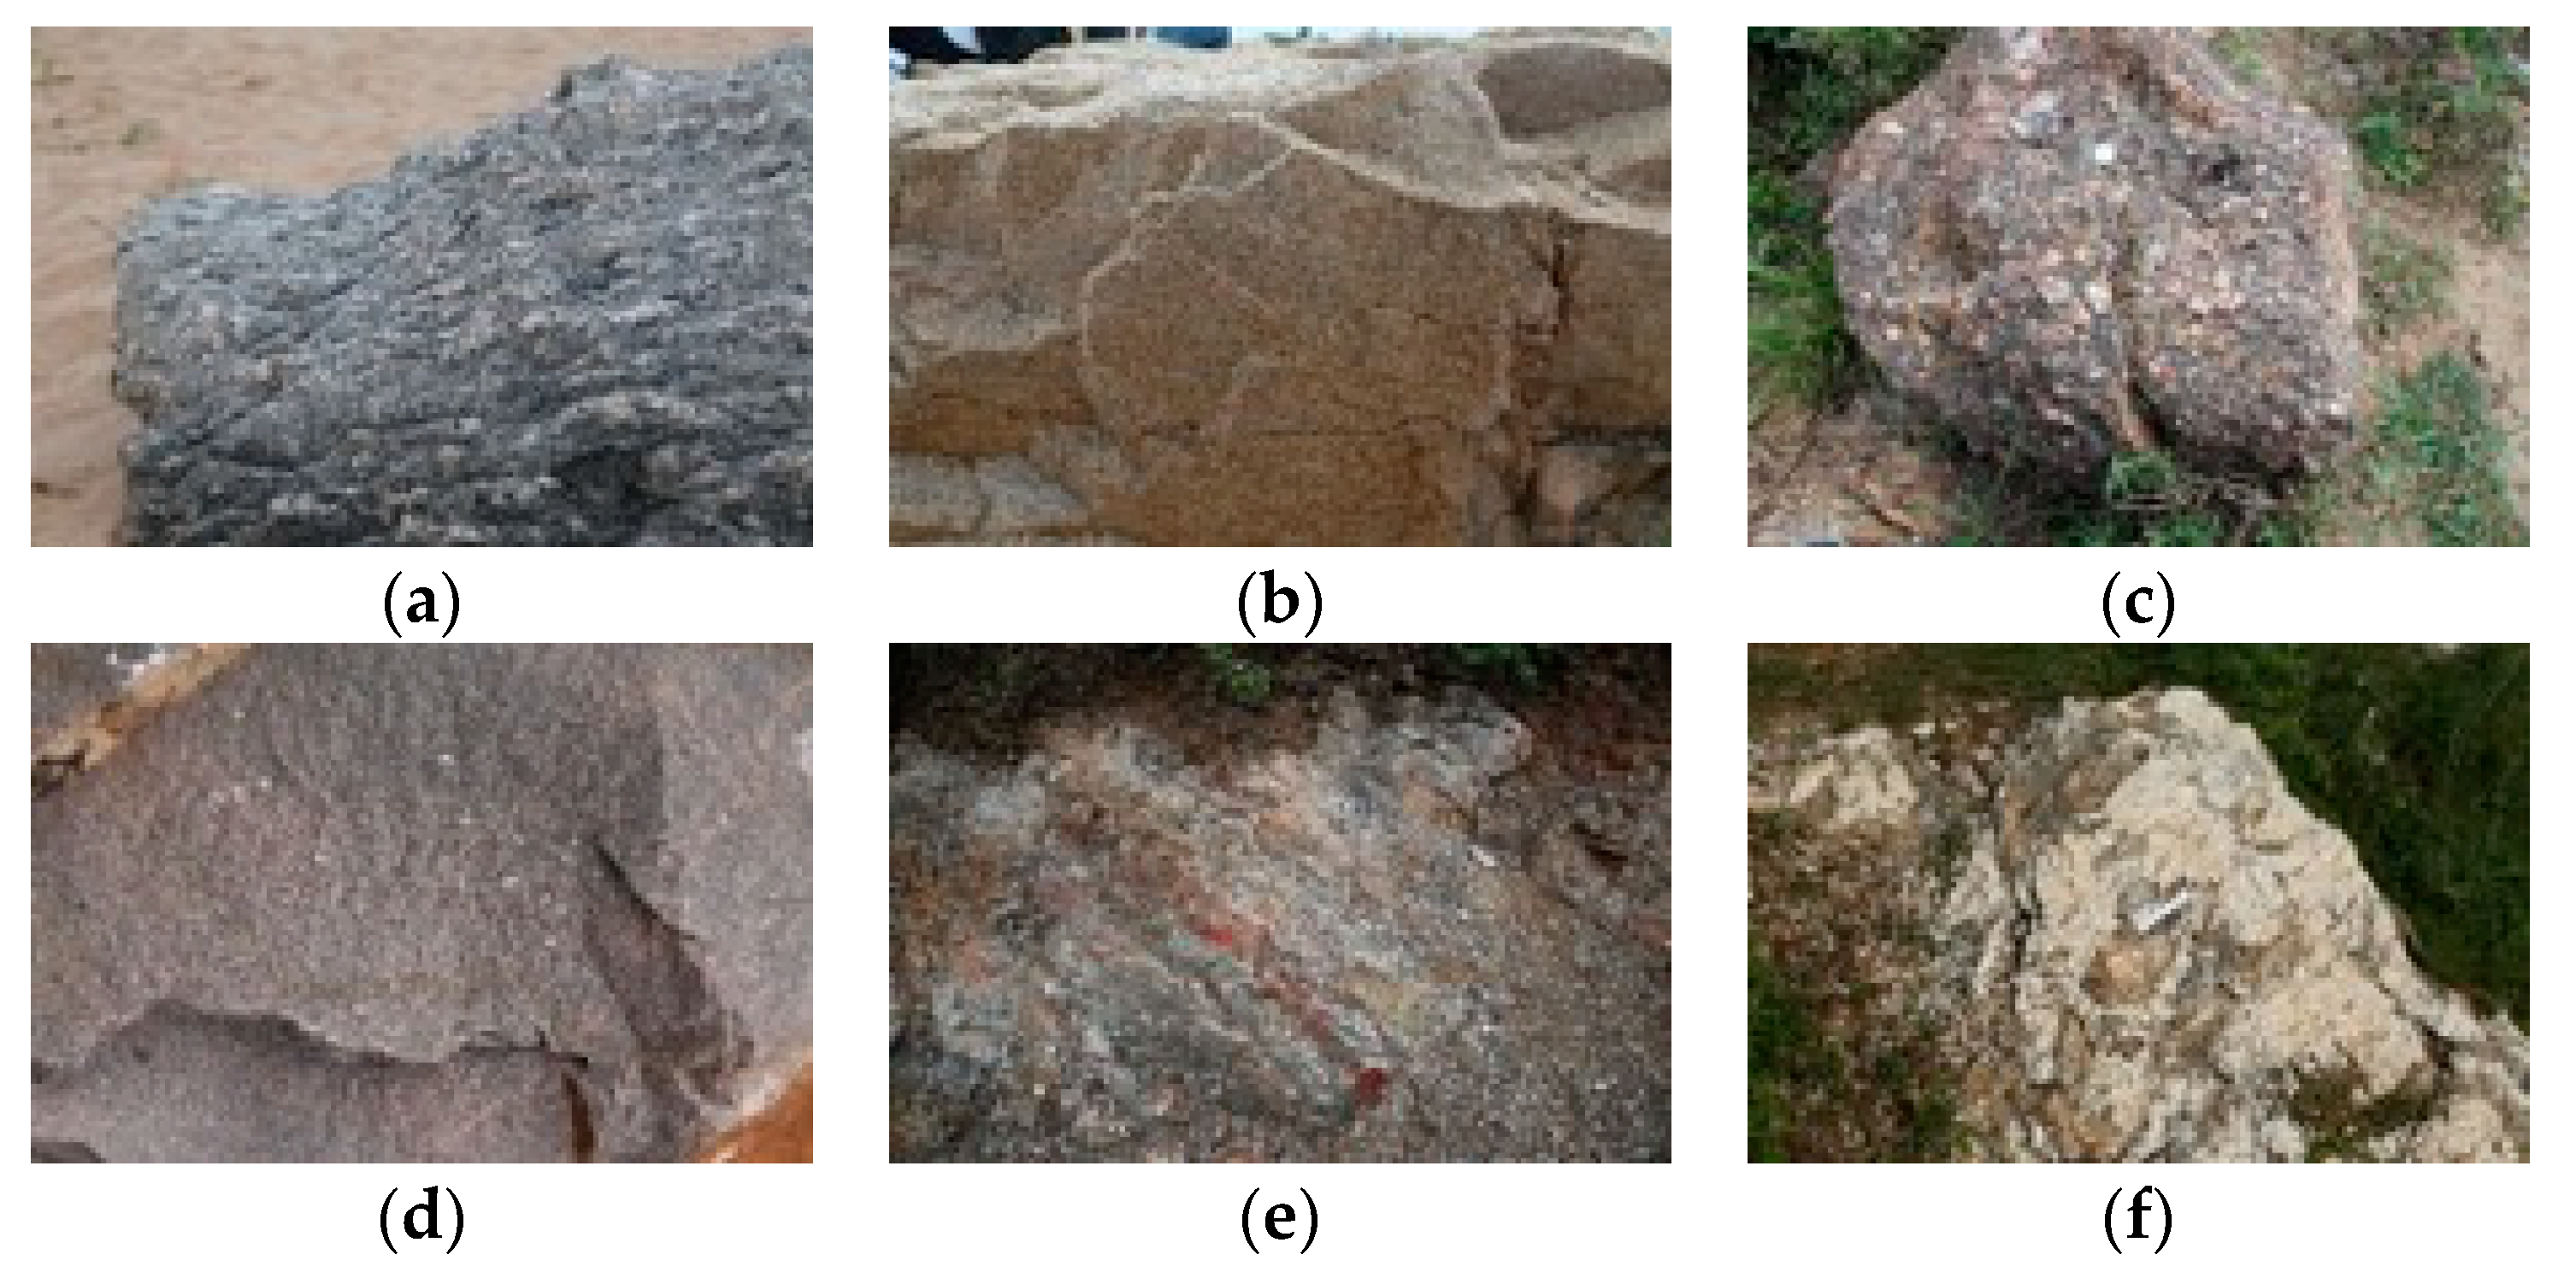
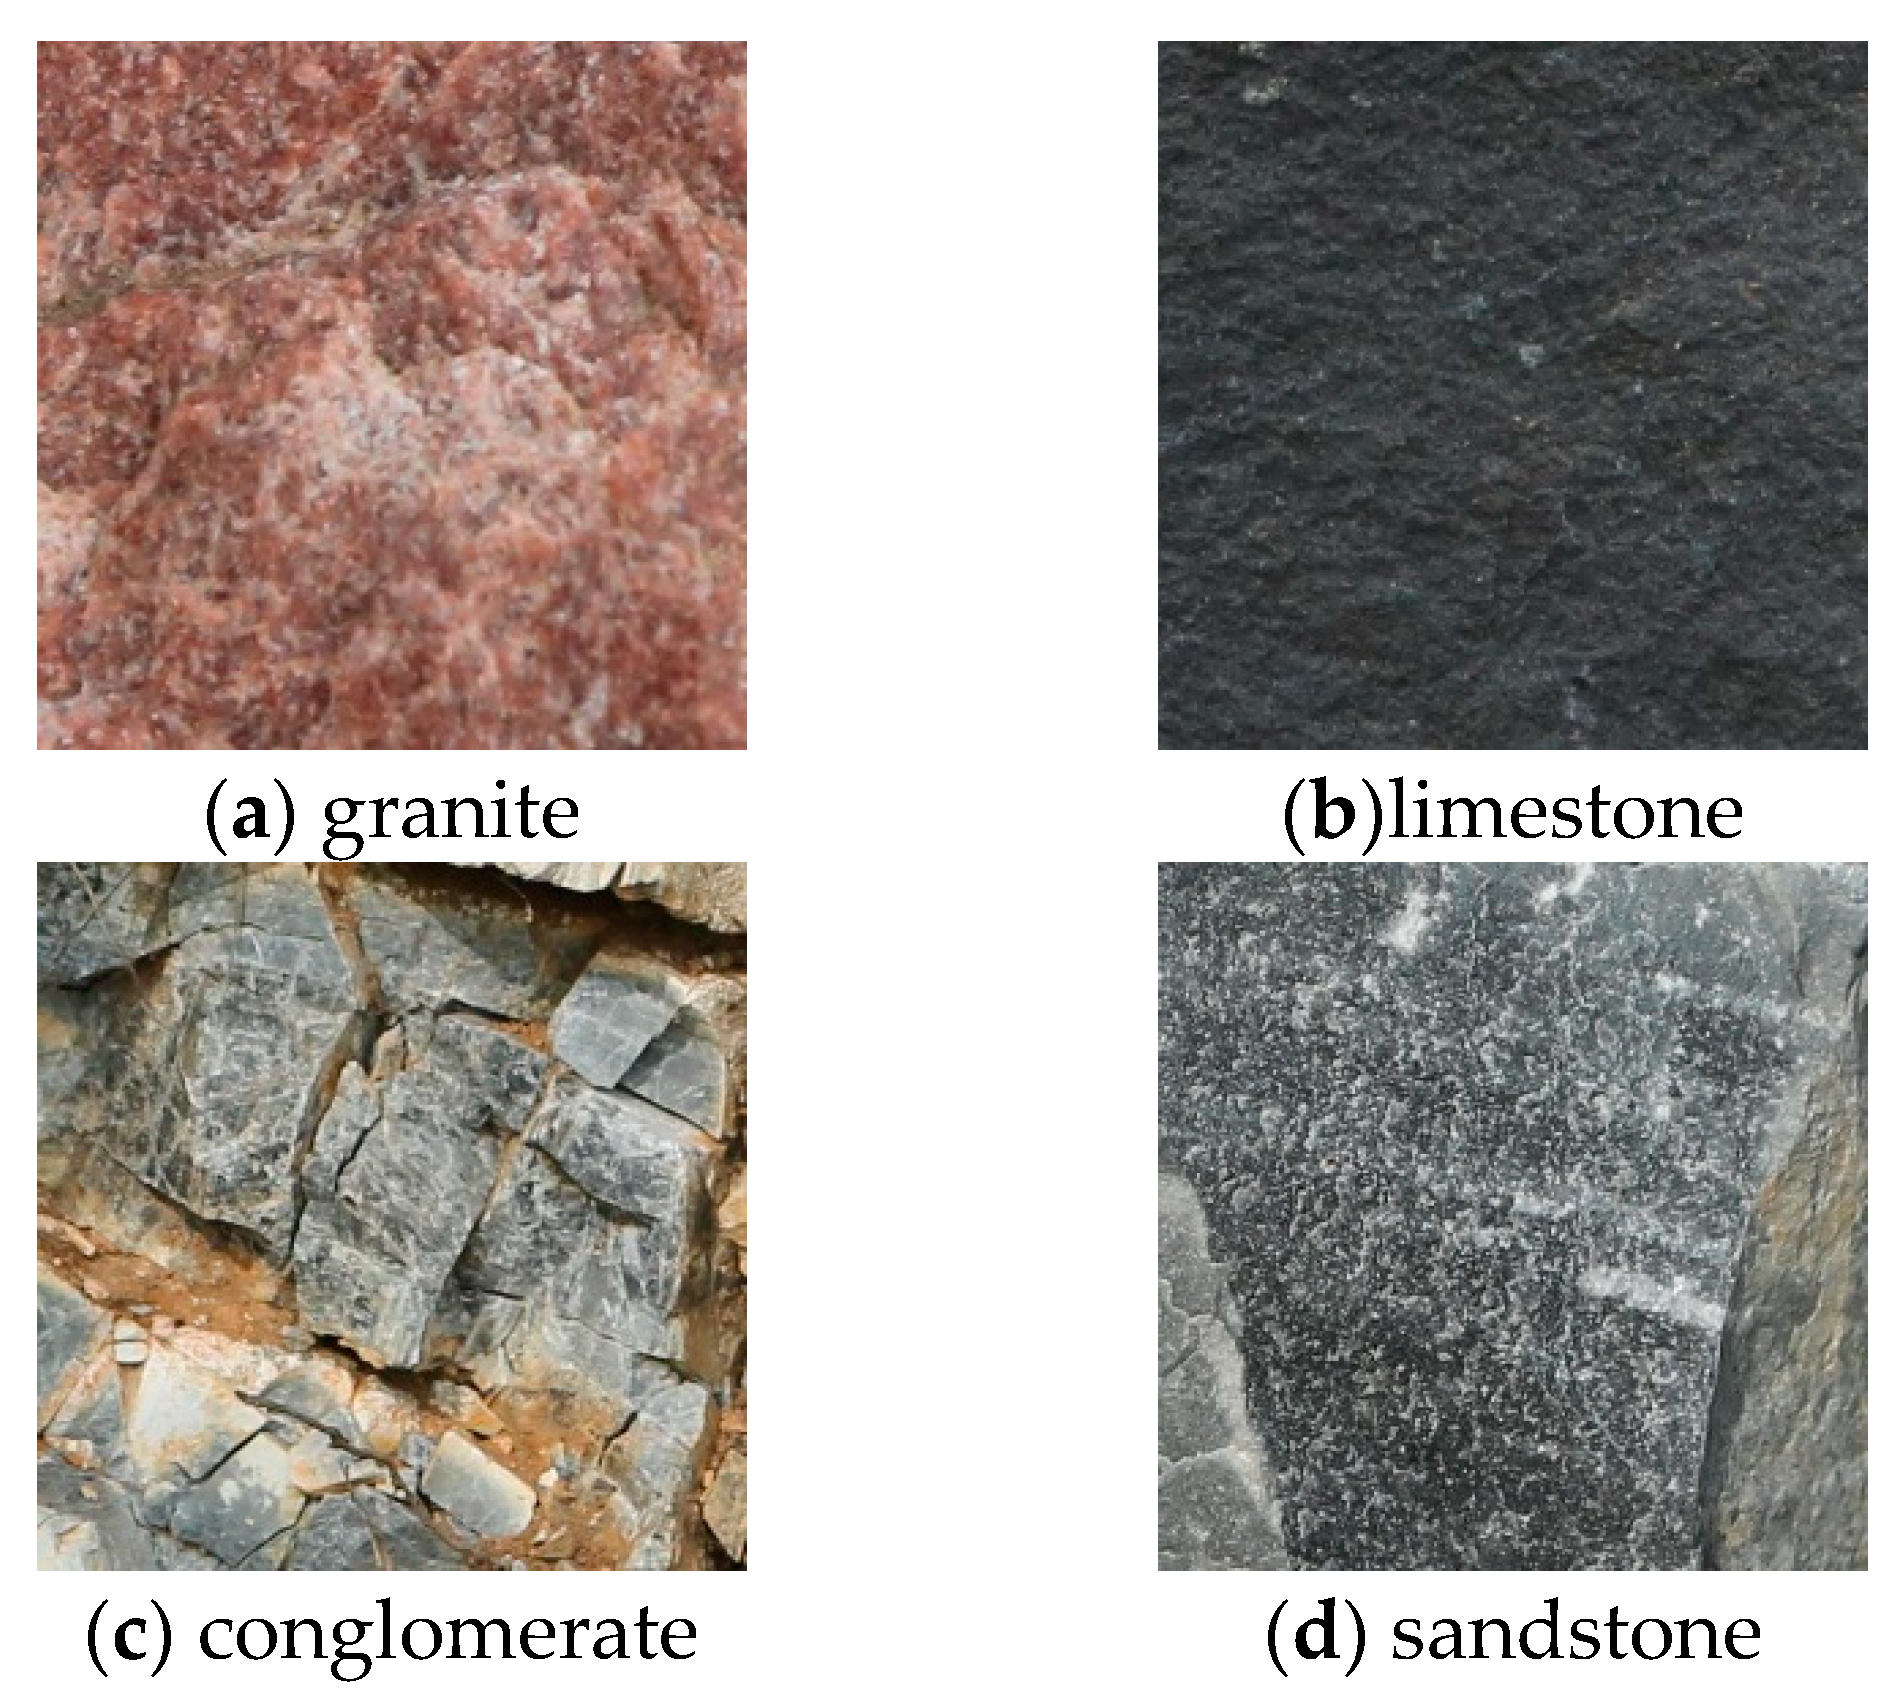
5], so, they allow several characteristics of rocks to be collected and assessed digitally. Photographs can clearly show the characteristics of color, grain size, and texture of rocks (Figure 1). Although images of rocks do not show homogeneous shapes, textures [1,6], or colors, computer image analysis can be used to classify some types of rock images. Partio et al. [7] used gray-level co-occurrence matrices for texture retrieval from rock images. Lepistö et al. [6] classified rock images based on textural and spectral features.
Advances in satellite and remote sensing technology have encouraged the development of multi-spectral remote sensing technology to classify ground objects of different types [8,9], including rock. However, it is expensive to obtain ultra-high-resolution rock images in the field with the use of remote sensing technology. Therefore, the high cost of data acquisition using hyperspectral technology carried by aircraft and satellites often prevents its use in teaching and the automation of rock type identification.
Machine learning algorithms applied to digital image analysis have been used to improve the accuracy and speed of rock identification, and researchers have studied automated rock-type classification based on traditional machine learning algorithms. Lepistö et al. [1] used image analysis to investigated bedrock properties, and Chatterjee [2] tested a genetic algorithm on photographs of samples from a limestone mine to establish a visual rock classification model based on imaging and the Support Vector Machine (SVM) algorithm. Patel and Chatterjee [4] used a probabilistic neural network to classify lithotypes based on image features extracted from the images of limestone. Perez et al. [10] photographed rocks on a conveyor belt and then extracted features of the images to classify their types using the SVM algorithm.
The quality of a digital image used in rock-type identification significantly affects the accuracy of the assessment [2,4]. Traditional machine learning approaches can be effective in analyzing rock lithology, but they are easily disturbed by the selection of artificial features [11]. Moreover, the requirements for image quality and illumination are strict, thus limiting the choice of equipment used and requiring a certain level of expertise on the part of the geologist. In the field, the complex characteristics of weathered rocks and the variable conditions of light and weather, amongst others, can compromise the quality of the obtained images, thus complicating the extraction of rock features from digital images. Therefore, existing available methods are difficult to apply to the automated identification of rock types in the field.
In recent years, deep learning, also known as deep neural networks, has received attention in various research fields [12]. Many methods for deep learning have been proposed [13]. Deep convolutional neural networks (CNNs) are able to automatically learn the features required for image classification from training-image data, thus improving classification accuracy and efficiency without relying on artificial feature selection. Very recent studies have proposed deep learning algorithms to achieve significant empirical improvements in areas such as image classification [14], object detection [15], human behavior recognition [16,17], speech recognition [18,19], traffic signal recognition [20,21], clinical diagnosis [22,23], and plant disease identification [11,24]. The successes of applying CNNs to image recognition have led geologists to investigate their use in identifying rock types [8,9,25], and deep learning has been used in several studies to identify the rock types from images. Zhang et al. [26] used transfer learning to identify granite, phyllite, and breccia based on the GoogLeNet Inception v3 deep CNNs model, achieving an overall accuracy of 85%. Cheng et al. [27] proposed a deep learning model based on CNNs to identify three types of sandstone in image slices with an accuracy of 98.5%. These studies show that CNNs have obtained good results when applied to geological surveying and rock-type recognition. Deep CNNs can identify rock types from images without requiring the manual selection of image features. However, deep CNNs have not yet been applied in the field, and the accuracy of the above results was not sufficient for the identification of rocks.
This paper proposes a new method for automatically classifying field rock images based on deep CNNs. A total of 2290 field rock photographs were first cropped to form a database of 24,315 image patches. The sample patches were then utilized to train and test CNNs, with 14,589 samples being used as the training dataset, 4863 samples being used as the validation dataset and the remaining 4863 samples being used as the testing dataset. The results show that the proposed model achieves higher accuracy than other models. The main contributions of this paper are as follows: (1) the very high resolution of the digital rock images allows them to include interference elements such as grass, soil, and water, which do not aid rock type’s identification. This paper proposes a method of training-image generation that can decrease computation and prevent overfitting of the CNNs-based model during training. The method slices the original rock image into patches, selects patches typical of rock images to form a dataset, and removes the interference elements that are irrelevant to rock classification. (2) Rock Types deep CNNs (RTCNNs) model is employed to classify field rock types. Compared with the established SVM, AlexNet, VGGNet-16, and GoogLeNet Inception v3 models, the RTCNNs model has a simpler structure and higher accuracy for identifying rock types in the field. Based on various factors, such as model type, sample size, and model level, a series of comparisons verified the high performance of the RTCNNs model, demonstrating its reliability and yielding an overall identification accuracy of 97.96%.
The remainder of this paper is organized as follows. Section 2 presents details of the modification and customization of the RTCNNs for the automated identification of field rock types. Section 3 describes the techniques of classifying the field rock types (including acquiring images of rock outcrops and generating patched samples) and the software and hardware configurations of the method, followed by a presentation of the results. 
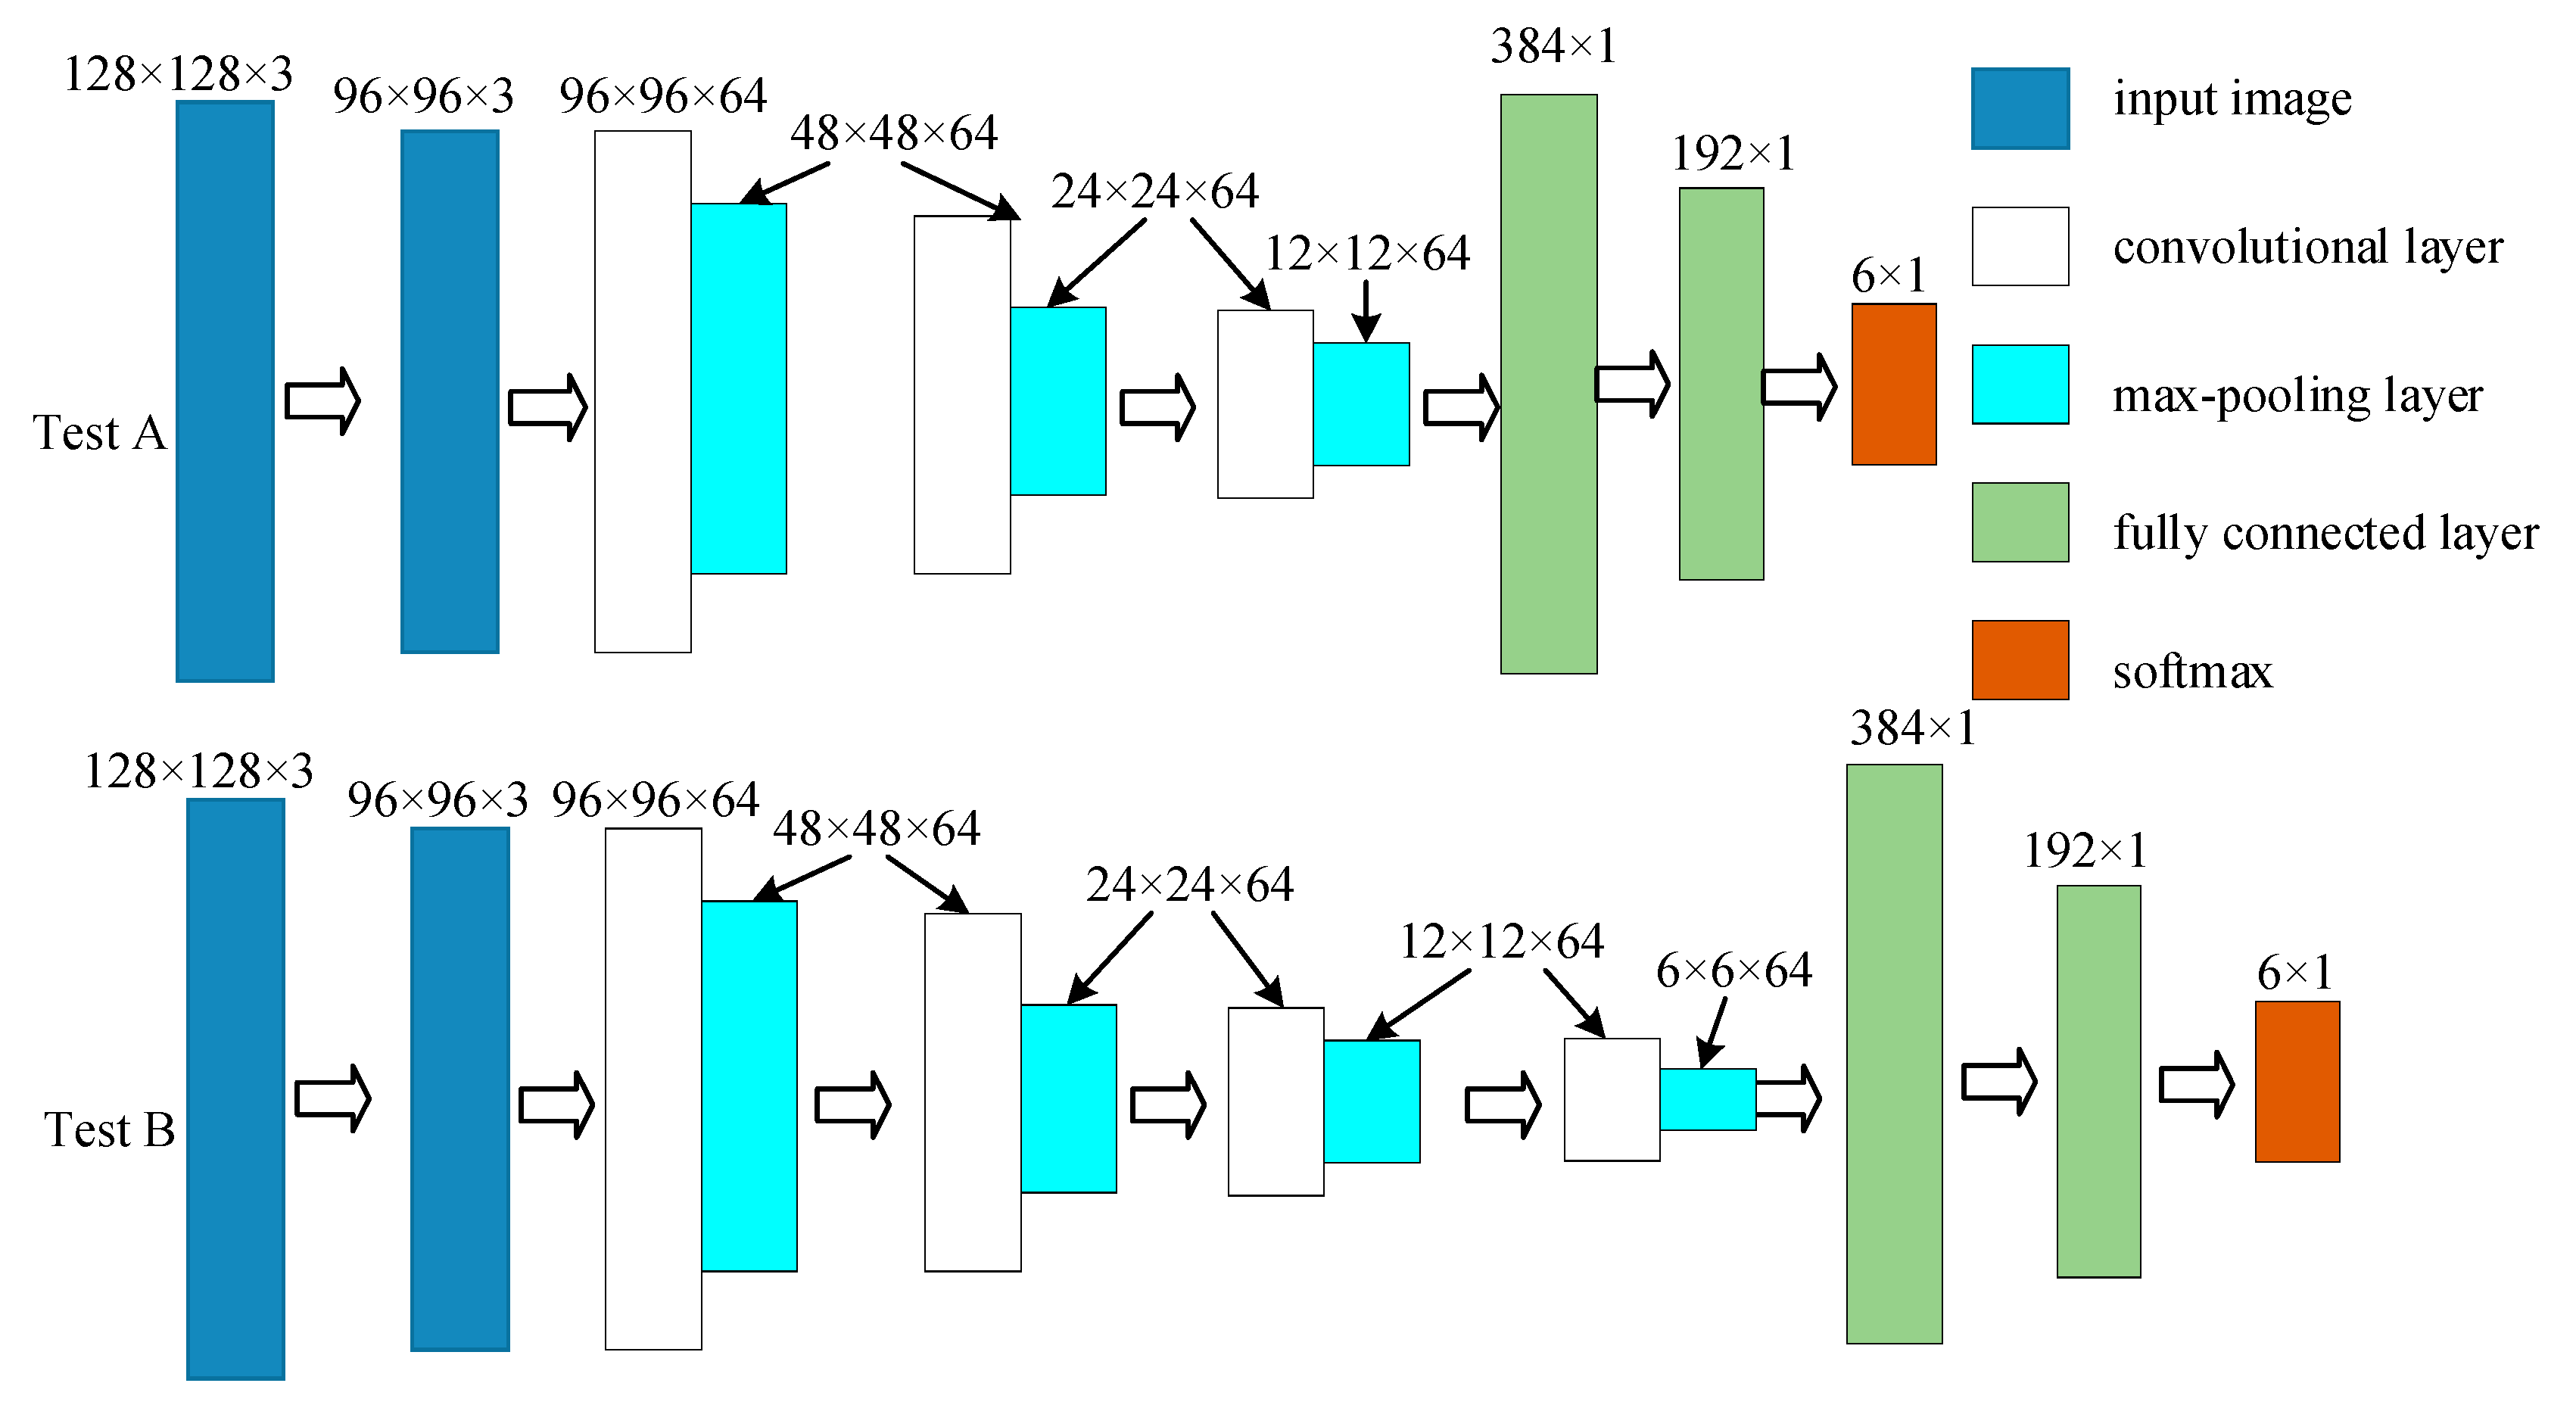
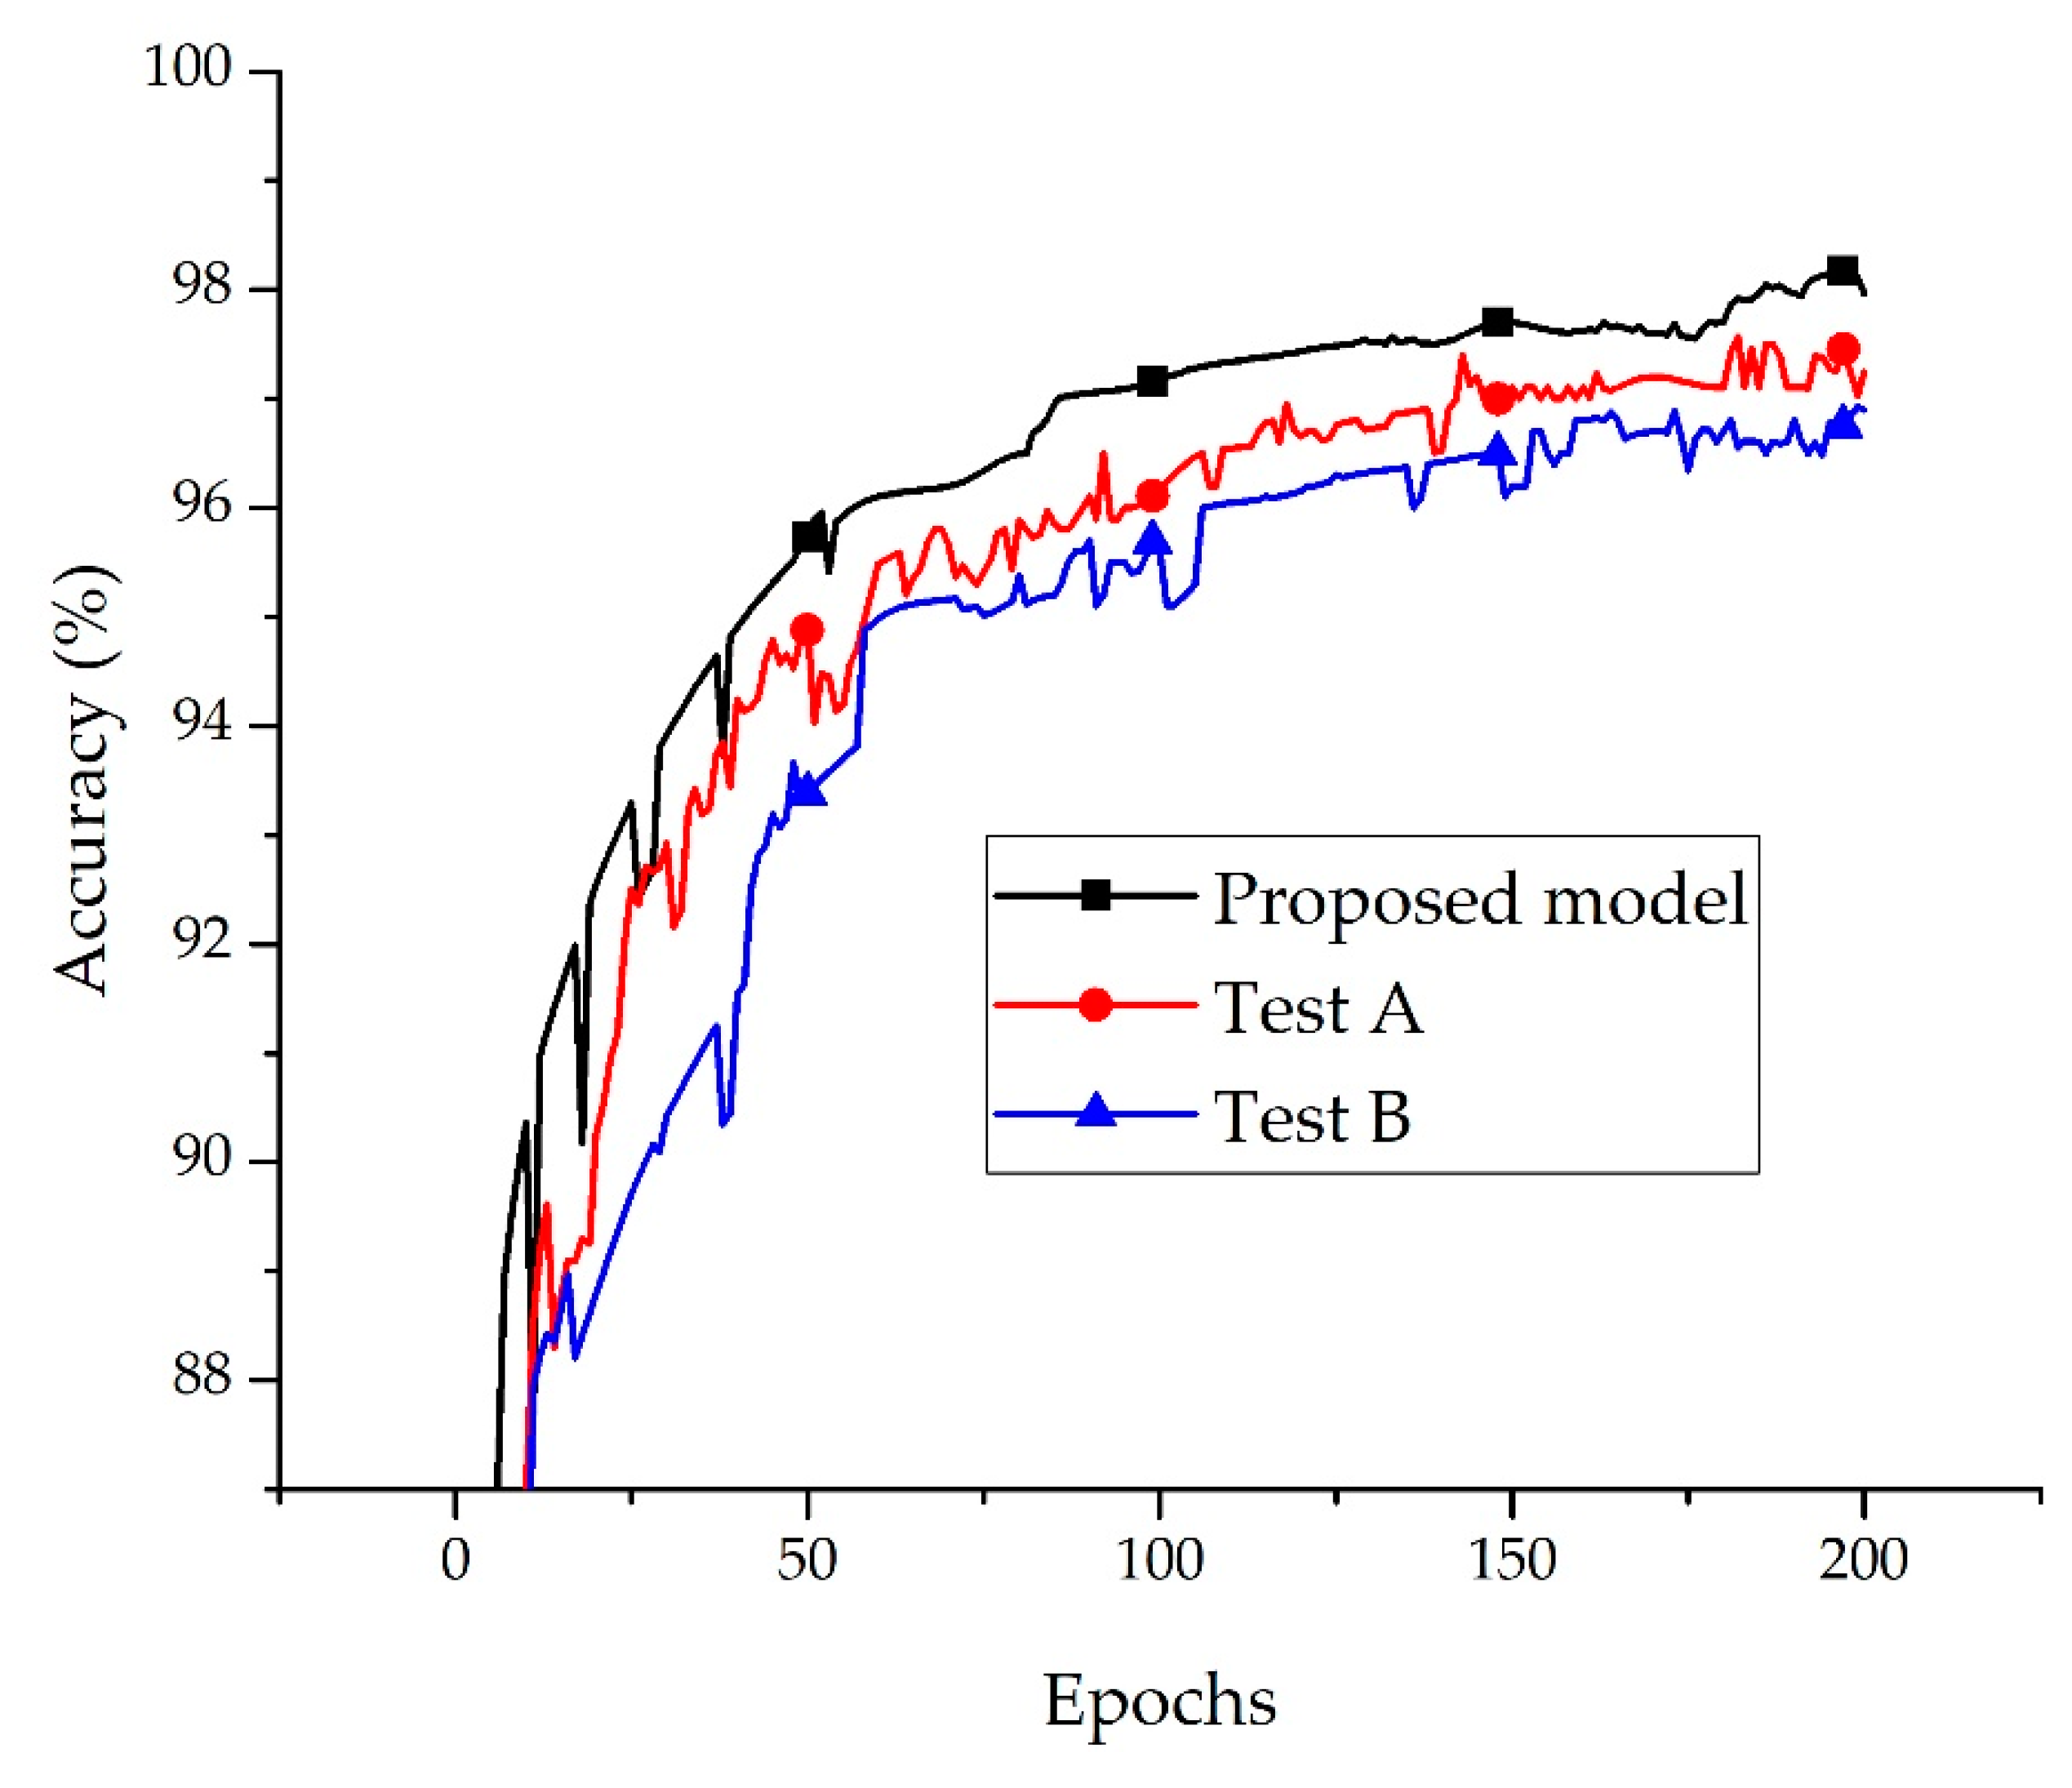
Section 4 analyzes the factors that affect the identification accuracy, such as the type of model, sample size, and model level, and presents the results. Section 5 provides the conclusions of the study.

2. Architecture of the Rock Types Deep Convolutional Neural Networks Model

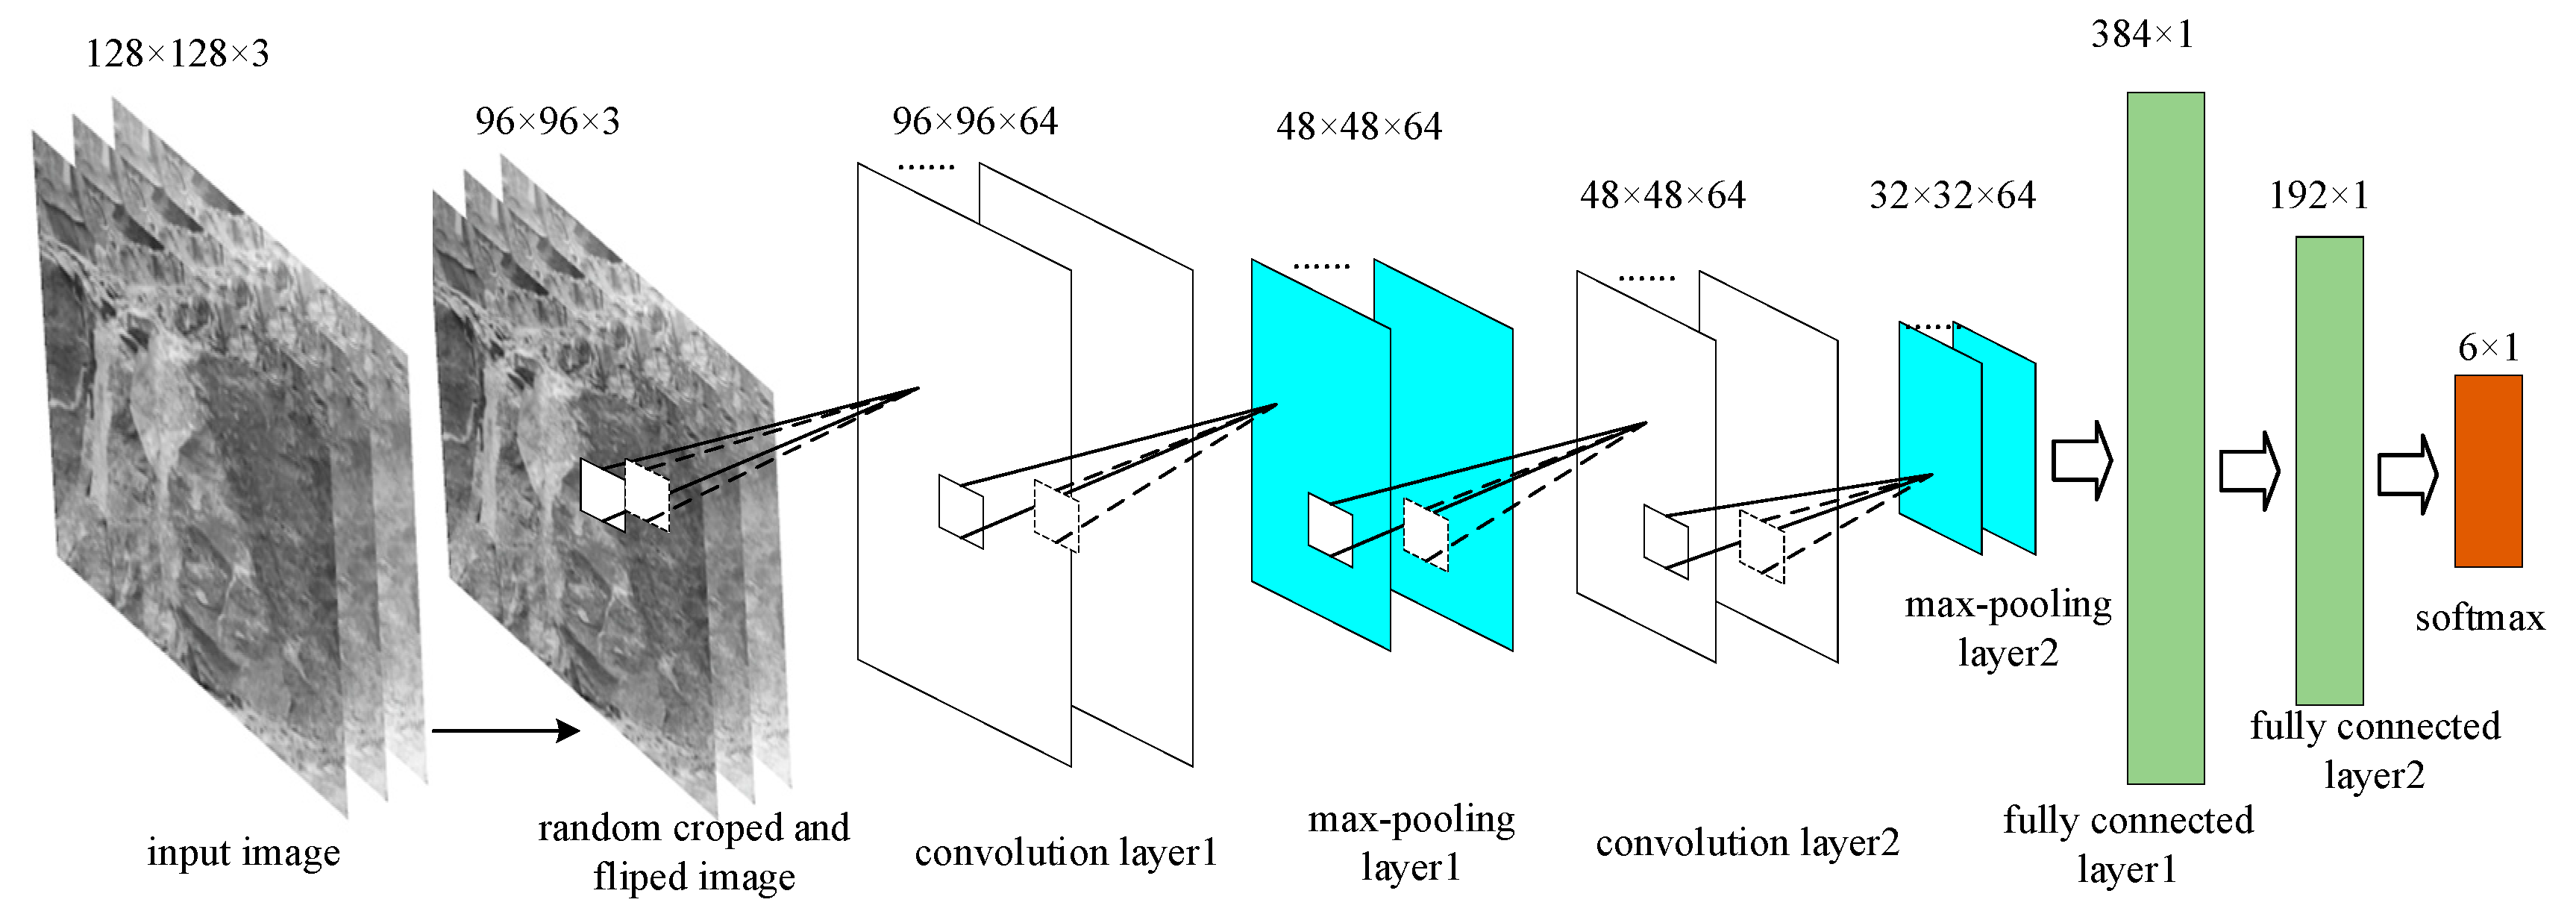
Developments in deep learning technology have allowed continuous improvements to be made in the accuracy of CNNs models. Such advances have been gained by models becoming ever deeper, which has meant that such models demand increased computing resources and time. This paper proposes a RTCNNs model for identifying rock types in the field. The computing time of the RTCNNs model is much less than that of a model 10 or more layers. The hardware requirements are quite modest, with computations being carried out with commonly used device CPUs and Graphics Processing Units (GPUs). The RTCNNs model includes six layers (Figure 2).
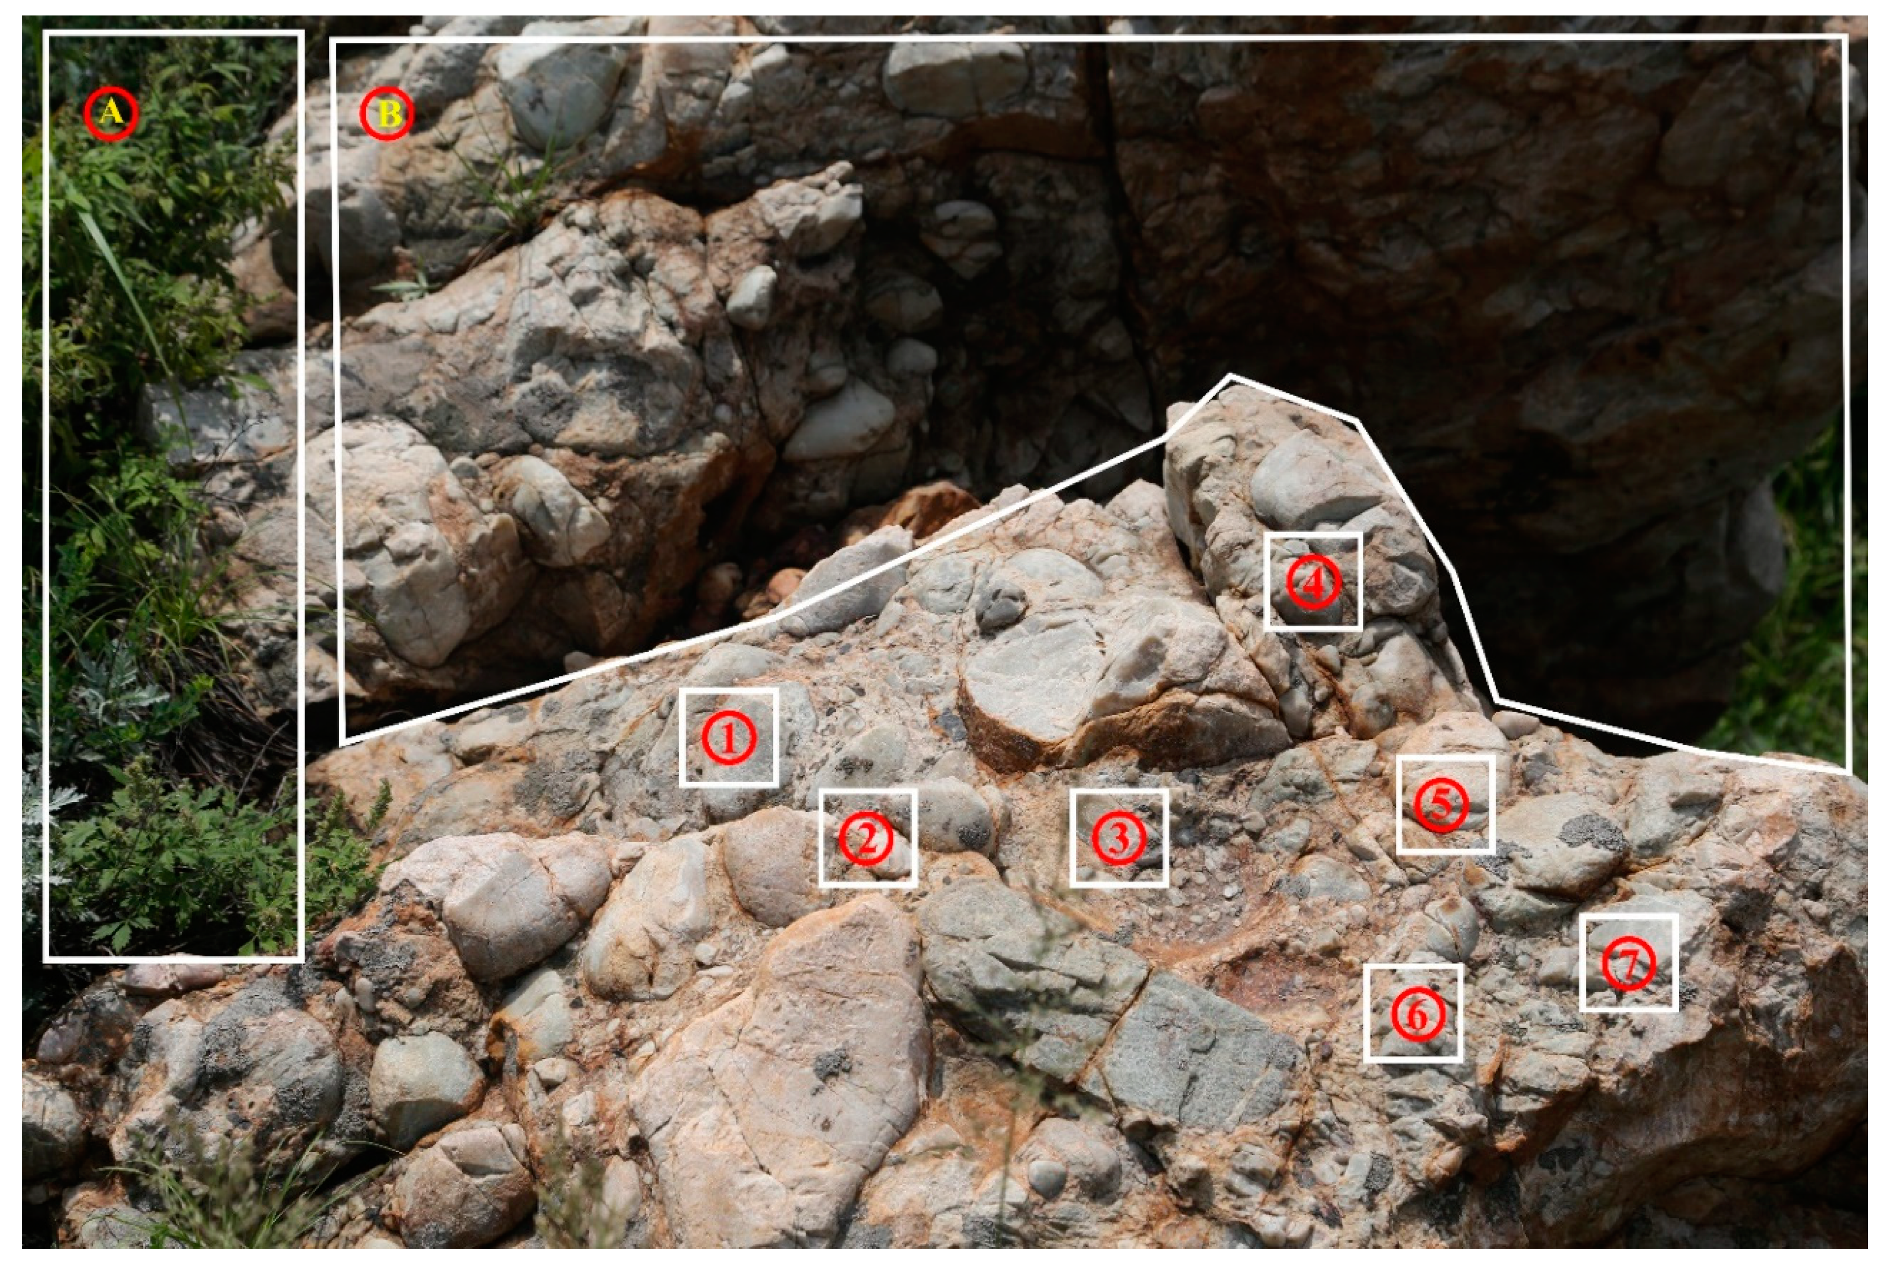
Before feeding the sample images into the model, Random_Clip and Random_Flip operations are applied to the input samples. Each part of the image retains different feature of the target object. Random clipping can reserve the different features of the image. For example, partition A of the image shown in Figure 1 records smaller changes in grain size of mylonite, in which quartz particles do not undergo obvious deformation, while partition B records larger tensile deformation of quartz particles, and the quartz grains in the partition C are generally larger. In addition, in the proposed model, each layers of training have fixed size parameters, such as the input size of convolution layer1 is 96 × 96 × 3, while the output size of feature is 96 × 96 × 64 (Figure 2). The input images are cropped into sub-images with given size, while the given size is less. In the proposed model, the cropped size is 96 × 96 × 3, while the input size is 128 × 128 × 3. Through the random clipping operation of fixed size and different positions, different partitions of the same image are fed into the model during different training epochs. The flipping function can flip the image horizontally randomly. Both clipping and flipping operations are realized through the corresponding functions of TensorFlow deep learning framework [28]. The sample images fed into the model are therefore different in each epoch, which expands the training dataset, improving the accuracy of the model and avoiding overfitting.
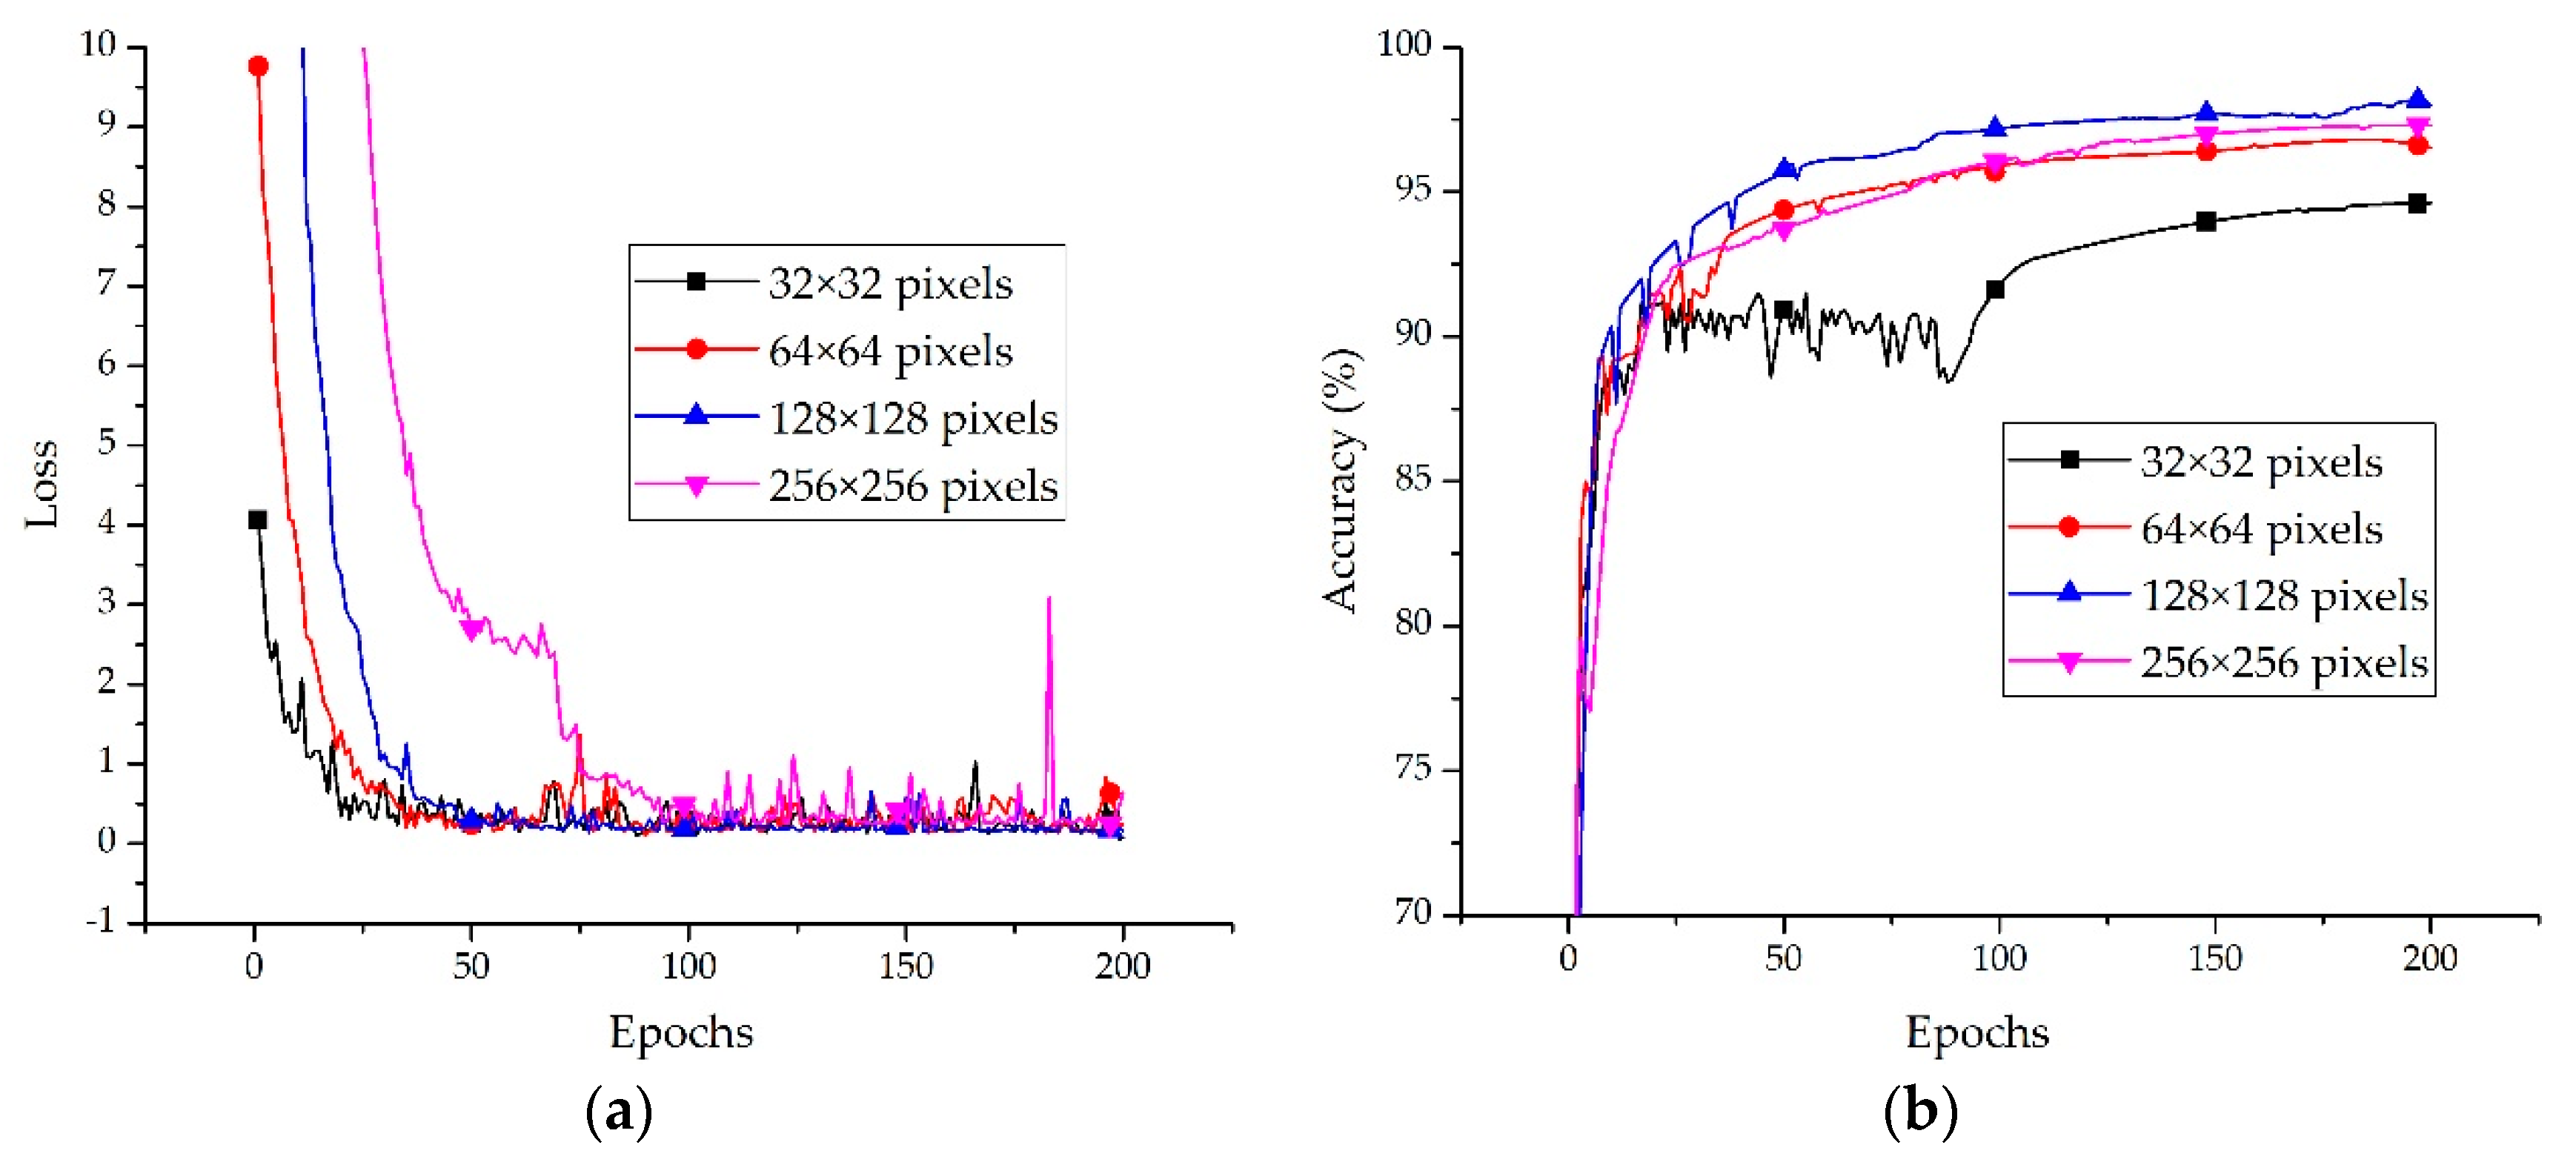
Before performing patch-based sampling, the various features of the rock are spread all over the entire original field-captured image. The experiments described in Section 4 show that a smaller convolution kernel can filter the rock features better than the bigger kernel of other models. As a consequence, the first convolutional layer is designed to be 64 kernels of size 5 × 5 × 3, followed by a max-pooling layer (Section 2.2), which can shrink the output feature map by 50%. A Rectified Linear Unit (ReLU, Section 2.3) activation function is then utilized to activate the output neuron. The second convolutional layer has 64 kernels of size 5 × 5 × 64 connected to the outputs of the ReLU function, and it is similarly followed by a max-pooling layer. Below this layer, two fully connected layers are designed to predict six classes of field rock, and the final layer consists of a six-way Softmax layer. Detailed parameters of the model, as obtained by experimental optimization, are listed in Table 1.

2.1. Convolution Layer

A convolution layer extracts the features of the input images by convolution and outputs the feature maps (Figure 3). It is composed of a series of fixed size filters, known as convolution kernels, which are used to perform convolution operations on image data to produce the feature maps [29]. Generally, the output feature map can be realized by Equation (1):
h i j k   =   i M j ( ( w k × x ) i j + b k )
where k represents the k th layer, h represents the value of the feature, (i, j) are coordinates of pixels, w k represents the convolution kernel of the current layer, and b k is the bias. The parameters of CNNs, such as the bias ( b k ) and convolution kernel ( w k ) , are usually trained without supervision [11]. Experiments optimized the convolution kernel size by comparing sizes of 3 × 3, 5 × 5, and 7 × 7; the 5 × 5 size achieves the best classification accuracy. The number of convolution kernels also affects the accuracy rate, so 32, 64, 128, and 256 convolution kernels were experimentally tested here. The highest accuracy is obtained using 64 kernels. Based on these experiments, the RTCNNs model adopts a 5 × 5 size and 64 kernels to output feature maps.
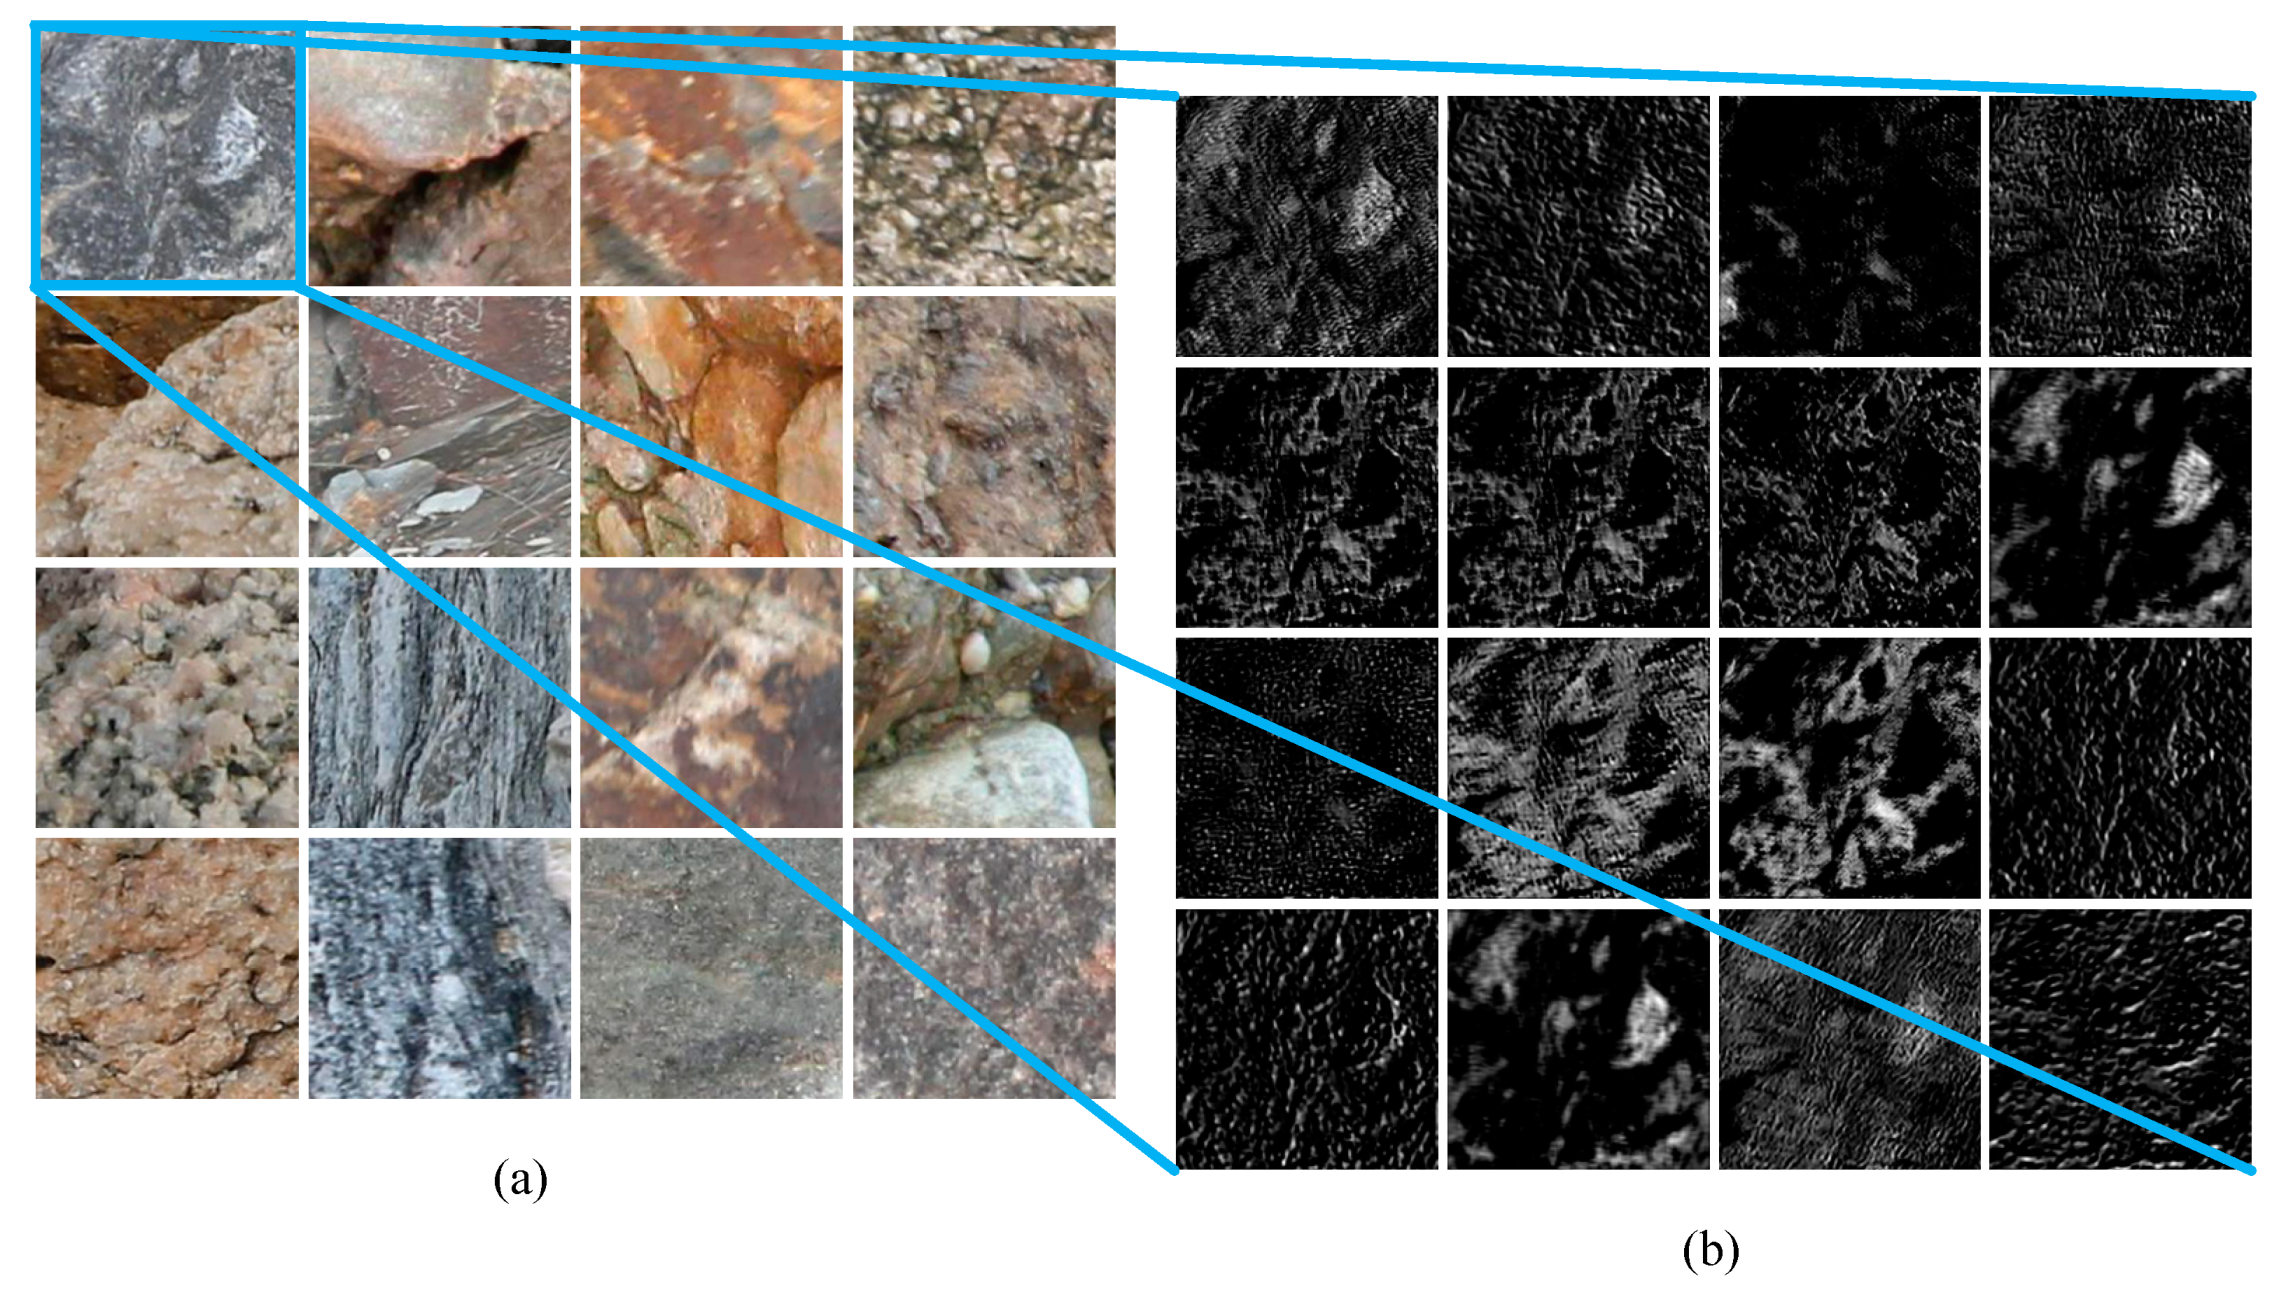
Figure 3 shows the feature maps outputted from the convolution of the patched field images. Figure 3a depicts the patch images from field photographs inputted to the proposed model during training, and Figure 3b shows the edge features of the sample patches learned by the model after the first layer convolution. The Figure indicates that the RTCNNs model can automatically extract the basic features of the images for learning.

2.2. Max-Pooling Layer

The pooling layer performs nonlinear down-sampling and reduces the size of the feature map, also accelerating convergence and improving computing performance [12]. The RTCNNs model uses max-pooling rather than mean-pooling because the former can obtain more textural features than can the latter [30]. The max-pooling operation maximizes the feature area of a specified size and is formulated by
h j   =   m a x i R j α i
where R j is the pooling region j in feature map α , i is the index of each element within the region, and h is the pooled feature map.

2.3. ReLU Activation Function

The ReLU activation function nonlinearly maps the characteristic graph of the convolution layer output to activate neurons while avoiding overfitting and improving learning ability. This function was originally introduced in the AlexNet model [14]. The RTCNNs model uses the ReLU activation function (Equation (3)) for the output feature maps of every convolutional layer:
f ( x )   =   m a x ( 0 , x )

2.4. Fully Connected Layers

Each node of the fully connected layers is connected to all the nodes of the upper layer. The fully connected layers are used to synthesize the features extracted from the image and to transform the two-dimensional feature map into a one-dimensional feature vector [12]. The fully connected layers map the distributed feature representation to the sample label space. The fully connected operation is formulated by Equation (4):
a i   =   j   =   0 m * n * d 1 w i j * x i + b i
where i is the index of the output of the fully connected layer; m, n, and d are the width, height, and depth of the feature map outputted from the last layer, respectively; w represents the shared weights; and b is the bias.
Finally, the Softmax layer generates a probability distribution over the six classes using the output from the second fully connected layer as its input. The highest value of the output vector of the Softmax is considered the correct index type for the rock images.

3. Rock-Type Classification Method for Field Images of Rocks

The main steps for classifying field samples are acquiring images, collecting typical rock-type images, establishing databases of rock-type images, setting up deep learning neural networks, and identifying rock types (Figure 4).

3.1. Acquisition of Original Field Rock Images

The Xingcheng Practical Teaching Base of Jilin University in Xingcheng (southwest Liaoning Province in NE China) was the field site for the collection of rock images. The site is situated in Liaodong Bay and borders the Bohai Sea. There are various types of rock with good outcrops in this area, mainly granite, tuff and other magmatic rocks, limestone, conglomerate, sandstone, and shale and other sedimentary rocks as well as some mylonite. This diverse geological environment enables the collected images to be used to test the reliability and consistency of the classification method.
The development of UAVs has led to their use in geological research [31,32,33], as they allow image acquisition to take place in inaccessible areas. As part of this study’s objective of obtaining as many photographs of surface rocks as possible, a UAV carrying a camera captured images of many of the better outcrops of rocks on cliffs and in other unapproachable areas. Two cameras were used: a Canon EOS 5D Mark III (EF 24–70 mm F2.8L II USM) was used to take photographs (5760 × 3840 pixels) of outcrops that field geologists could access, and a Phantum 4 Pro DJi UAV with FC300C camera (FOV 84°8.8 mm/24 mm f/2.8–f/11 with autofocus) captured images (4000 × 3000 pixels) of inaccessible outcrops.
Figure 5 shows typical images of the six rock types. There are clear differences in grain size distribution, structure, and color between the rocks, allowing them to be distinguished. However, weathering and other factors in the field can significantly affect the color of sedimentary rocks, for example, which increases the complexity of rock-type identification in the field.
The photographic image capture used different subject distances and focal lengths for different rock types to best capture their particular features. For example, for conglomerates with large grains, the subject distance was 2.0 m, and the focal length was short (e.g., 20 mm), so that the structural characteristics of these rocks could be recorded. For sandstones with smaller grains, the subject distance was 0.8 m with a longer focal length (e.g., 50 mm), allowing the grains to be detectable.
A total of 2290 images with typical rock characteristics of six rock types were obtained: 95 of mylonite, 625 of granite, 530 of conglomerate, 355 of sandstone, 210 of shale, and 475 of limestone. These six rock types include four sedimentary rocks (conglomerate, sandstone, shale, and limestone), one metamorphic rock (mylonite), and one igneous rock (granite). After every three samples, one sample was selected as the validation date, and then another sample as selected as the testing data, so 60% of the images of each rock type were selected for the training dataset, 20% for the validation dataset, and leaving 20% for the testing dataset (Table 2).

3.2. Preprocessing Field Rock Image Data

In the field, a variety of features may obscure rocks or otherwise detract from the quality of rock images obtained. Grass, water, and soil commonly appear in the collected images (e.g., area A in Figure 6). These features hinder recognition accuracy and consume computing resources. In addition, any image of a three-dimensional rock outcrop will contain some areas that are out of focus and which cannot therefore be seen clearly or properly analyzed (e.g., area B in Figure 6). Furthermore, if the captured image is directly used for training, then the image size of 5760 × 3840 pixels consumes large amounts of computing resources. Therefore, before training the model, it is necessary to crop the original image into sample patches without the interfering elements, thus reducing the total size of imagery used in the analysis.
The color, mineral composition, and structure of a rock are the basic features for identifying its type. These features have to be identifiable in the cropped images. The original images (of either 5760 × 3840 pixels or 4000 × 3000 pixels) are first labeled according to the clarity of the rock and are then cropped into a variable number of sample patches of 512 × 512 pixels (e.g., boxes 1–7 in Figure 6), before being compressed to 128 × 128 pixels. Labeling is performed manually and is based on the open-source software “LabelImg” [34], a graphical image annotation tool. Cropping is achieved automatically by a python script based on the QT library. The steps used for processing are as follows:
(1)
Open the original field rock image;
(2)
Label the areas in the image with typical rock features (Figure 6);
(3)
Save the current annotation, after the labeling operation; and
(4)
Read all annotated locations and crop the annotated image locations to the specified pixel size for the sample patches.
After the above-mentioned steps, the sample patch images were separated into a training dataset containing 14,589 samples (60% of the total), a validation dataset of 4863 images (20% of the total) and a testing dataset of 4863 images (20% of the total). Table 3 gives the specific distribution of training, validation and testing images across rock types. Using sample patches retains the best representation of rock features and benefits the training of the RTCNNs model.

3.3. Training the Model

3.3.1. Software and Hardware Configurations

As the RTCNNs model has fewer layers than VGGNet-16 and other models, the computations were carried out on laptops. Table 4 gives the detailed hardware and software specifications. The RTCNNs model was realized under the TensorFlow deep learning framework [28].

3.3.2. Experimental Results

Training employs random initial weights. After each batch of training is complete, the learning rate changes and the weights are constantly adjusted to find the optimal value, which decreases the loss value of training. After each epoch, the trained parameters are saved in files and used to evaluate the validation dataset and obtain the identification accuracy of each epoch. After 200 epochs, the training loss gradually converged to the minimum. The trained parameters trained after 200 epochs are used to evaluate the testing dataset and obtain the identification accuracy. 10 identical experiments are established totally Figure 7 shows the average loss and accuracy curves for the training and validation datasets from the model using sample patch images of 128 × 128 pixels in the same 10 experiments. The curves show that the model has good convergence after 50 training epochs, with the loss value being below 1.0, and the training accuracy being 95.7%, validation accuracy achieved 95.4%. The highest accuracy of training and validation achieved was 98.6% and 98.2% at 197th epoch. After 200 training epochs, the final training and validation accuracy of the model reached 98.5% and 98.0% respectively. The saved parameters at 197th epoch with the highest validation accuracy was used to test the testing dataset, and the confusion matrix was gained (Table 5). Finally, the testing accuracy achieved was 97.96%.
The confusion matrix in Table 5 shows that the RTCNNs model can effectively classify mylonite, but is less effective in classifying sandstone and limestone, which yielded error rates of 4.06% and 3.4%, respectively.
The sample images in Figure 8 show sandstone (a and b) and limestone (c and d) incorrectly classified as granite, limestone, conglomerate, and sandstone, respectively. These samples have similar characteristics to the predicted rock types and are thus misclassified. For example, the grain size, texture, and shape of minerals in the sandstone in (a) are similar to those of minerals in granite.

4. Discussion

The identification of rock type from field images is affected by many factors. The choice of model, the size of training images, and the training parameters used will all influence training accuracy. This section reports and discusses various comparative tests and related results.

4.1. Influence of Model Choice on Recognition Accuracy

To test the effectiveness of classification, the RTCNNs model’s performance was compared with three other learning models (SVM, AlexNet, GoogLeNet Inception v3, and VGGNet-16) using the same training and testing datasets. All models were trained in 200 epochs using the batch size parameters listed in Table 6. The linear SVM classifier was applied to the datasets to test the performance using the super parameters listed in Table 6. Three other existing models, AlexNet, GoogLeNet Inception v3, and VGGNet-16, were also run using transfer learning, with initial learning rates of 0.01, 0.01, and 0.001, respectively (Table 6). During transfer learning, all the convolution and pooling layers of each model are frozen, and the trainings are conducted only for the fully-connected layers. For AlexNet model, the final FC6, FC7, and FC8 layers are trained. While training the GoogLeNet Inception V3 model, the final FC layer is trained. For VGGNet-16 model, the final FC7 and FC8 layers are trained.
The experimental results show that the RTCNNs model proposed in the present study achieved the highest overall accuracy (97.96%) on the testing dataset. Given that the same training and testing images were used for each model, we ascribe this high accuracy mainly to the proposed CNNs model. The next best performing model was GoogLeNet Inception v3, which obtained an overall accuracy of 97.1% with transfer learning. Although the overall testing accuracy of RTCNNs model is only 0.86% higher than that of GoogLeNet Inception V3 model, it leads to 42 more images identified by RTCNNs model than by GoogLeNet Inception V3 model. When identifying larger dataset, the advantage of RTCNNs model will be more obvious. Meanwhile, the results show that the CNNs model outperforms the linear SVM model in terms of classifying rocks from field images.
In addition, the RTCNNs model has fewer layers than the other models, meaning it is less computationally expensive and can be easily trained on common hardware (see Section 3.3.1). It also requires less time for training than the other deep learning models (Table 6).

4.2. The Effect of Sample Patch Images’ Size on Rock-Type Identification

The sample patch images preserve those rock features (e.g., structure, mineral composition, and texture) that are most important to its identification. To test the influence of the size of sample patch images on the accuracy of rock identification, we compressed the sample patches from 512 × 512 pixels to 32 × 32, 64 × 64, 128 × 128, and 256 × 256 pixels and compared the results under otherwise identical conditions. The results show that using a training dataset with patches of 128 × 128 pixels achieved the best performance (Figure 9).

4.3. The Effect of Model Depth on Identification Accuracy

Many previous studies have established that increasing the depth of a model improves its recognition accuracy. Two modifications to the proposed model with different depths are shown in Figure 10; Figure 11 plots the performance accuracy of the two modified models and of the original model.
The results of the comparison show that increasing the depth of the model (model Test A and Test B) does not improve the accuracy of recognition/identification in the present case; in fact, increasing the depth reduces such identification (Figure 11). We infer that the feature extraction operation of the proposed CNNs for rock image recognition does not require additional levels, with the convolution operation at a deeper level serving only to lose features and cause classification errors.

5. Conclusions

The continuing development of CNNs has made them suitable for application in many fields. A deep CNNs model with optimized parameters is proposed here for the accurate identification of rock types from images taken in the field. Novelly, we sliced and patched the original obtained photographic images to increase their suitability for training the model. The sliced samples clearly retain the relevant features of the rock and augment the training dataset. Finally, the proposed deep CNNs model was trained and tested using 24,315 sample rock image patches and achieved an overall accuracy of 97.96%. This accuracy level is higher than those of established models (SVM, AlexNet, VGNet-16, and GoogLeNet Inception v3), thereby signifying that the model represents an advance in the automated identification of rock types in the field. The identification of rock type using a deep CNN is quick and easily applied in the field, making this approach useful for geological surveying and for students of geoscience. Meanwhile, the method of identifying rock types proposed in the paper can be applied to the identification of other textures after retraining the corresponding parameters, such as rock thin section images, sporopollen fossil images and so on.
Although CNNs have helped to identify and classify rock types in the field, some challenges remain. First, the recognition accuracy still needs to be improved. The accuracy of 97.96% achieved using the proposed model meant that 99 images were misidentified in the testing dataset. The model attained relatively low identification accuracy for sandstone and limestone, which is attributed to the small grain size and similar colors of these rocks (Table 5; Figure 8). Furthermore, only a narrow range of sample types (six rock types overall) was considered in this study. The three main rock groups (igneous, sedimentary, and metamorphic) can be divided into hundreds of types (and subtypes) according to mineral composition. Therefore, our future work will combine the deep learning model with a knowledge library, containing more rock knowledge and relationships among different rock types, to classify more rock types and improve both the accuracy and the range of rock-type identification in the field. In addition, each field photograph often contains more than one rock type, but the proposed model can classify each image into only one category, stressing the importance of the quality of the original image capture.
Our future work will aim to apply the trained model to field geological surveying using UAVs, which are becoming increasingly important in geological data acquisition and analysis. The geological interpretation of these high-resolution UAV images is currently performed mainly using manual methods, and the workload is enormous. Therefore, the automated identification of rock types will greatly increase the efficiency of large-scale geological mapping in areas with good outcrops. In such areas (e.g., western China), UAVs can collect many high-resolution outcrop images, which could be analyzed using the proposed method to assist in both mapping and geological interpretation while improving efficiency and reducing costs. In order to improve the efficiency of labeling, the feature extraction algorithm [35] will be studied to automatically extract the advantageous factors in the image. We also plan to apply other deep learning models, such as the state-of-art Mask RCNN [36], to identify many types of rock in the same image. In addition, we will study various mature optimization algorithms [37,38,39] to improve computing efficiency. These efforts should greatly improve large-scale geological mapping and contribute to the automation of mapping.

Author Contributions

Conceptualization, X.R. and L.X.; Data curation, Z.L.; Formal analysis, X.R.; Funding acquisition, L.X.; Investigation, X.R.; Methodology, X.R. and L.X.; Project administration, L.X.; Resources, Z.L. and X.S.; Software, X.R. and Y.Z.; Supervision, L.X.; Validation, Y.Z. and J.H.; Visualization, X.R.; Writing—Original draft, X.R.; Writing—Review & Editing, L.X.

Funding

This research was funded by the China Geological Survey, grant number 1212011220247, and Department of Science and Technology of Jilin Province, grant number 20170201001SF, and the Education Department of Jilin Province, grant number JJKH20180161KJ and JJKH20180518KJ.

Acknowledgments

The authors are grateful for anonymous reviewers’ hard work and comments that allowed us to improve the quality of this paper. The authors would like to thank Gaige Wang for discussions and suggestions. The authors wish to acknowledge the Xingcheng Practical Teaching Base of Jilin University for providing the data for this project.

Conflicts of Interest

The authors declare no conflict of interest.

References

  1. Lepistö, L.; Kunttu, I.; Visa, A. Rock image classification using color features in Gabor space. J. Electron. Imaging 2005, 14, 040503. [Google Scholar] [CrossRef]
  2. Chatterjee, S. Vision-based rock-type classification of limestone using multi-class support vector machine. Appl. Intell. 2013, 39, 14–27. [Google Scholar] [CrossRef]
  3. Lepistö, L.; Kunttu, I.; Autio, J.; Visa, A. Rock image retrieval and classification based on granularity. In Proceedings of the 5th International Workshop on Image Analysis for Multimedia Interactive Services, Lisboa, Portugal, 21–23 April 2004. [Google Scholar]
  4. Patel, A.K.; Chatterjee, S. Computer vision-based limestone rock-type classification using probabilistic neural network. Geosci. Front. 2016, 7, 53–60. [Google Scholar] [CrossRef] [Green Version]
  5. Ke, L.; Gong, D.; Meng, F.; Chen, H.; Wang, G.G. Gesture segmentation based on a two-phase estimation of distribution algorithm. Inf. Sci. 2017, 394, 88–105. [Google Scholar]
  6. Lepistö, L.; Kunttu, I.; Autio, J.; Visa, A. Rock image classification using non-homogenous textures and spectral imaging. In Proceedings of the 11th International Conference in Central Europe on Computer Graphics, Visualization and Computer Vision 2003 (WSCG 2003), Plzen-Bory, Czech Republic, 3–7 February 2003; pp. 82–86. [Google Scholar]
  7. Partio, M.; Cramariuc, B.; Gabbouj, M.; Visa, A. Rock texture retrieval using gray level co-occurrence matrix. In Proceedings of the 5th Nordic Signal Processing Symposium (NORSIG-2002), Trondheim, Norway, 4–10 October 2002; pp. 4–7. [Google Scholar]
  8. Sharma, A.; Liu, X.; Yang, X.; Shi, D. A patch-based convolutional neural network for remote sensing image classification. Neural Netw. 2017, 95, 19–28. [Google Scholar] [CrossRef]
  9. Nogueira, K.; Penatti, O.A.B.; dos Santos, J.A. Towards better exploiting convolutional neural networks for remote sensing scene classification. Pattern Recognit. 2017, 61, 539–556. [Google Scholar] [CrossRef] [Green Version]
  10. Perez, C.A.; Saravia, J.A.; Navarro, C.F.; Schulz, D.A.; Aravena, C.M.; Galdames, F.J. Rock lithological classification using multi-scale Gabor features from sub-images, and voting with rock contour information. Int. J. Miner. Process. 2015, 144, 56–64. [Google Scholar] [CrossRef]
  11. Liu, B.; Zhang, Y.; He, D.; Li, Y. Identification of Apple Leaf Diseases Based on Deep Convolutional Neural Networks. Symmetry 2017, 10, 11. [Google Scholar] [CrossRef]
  12. Guo, Y.; Liu, Y.; Oerlemans, A.; Lao, S.; Wu, S.; Lew, M.S. Deep learning for visual understanding: A review. Neurocomputing 2016, 187, 27–48. [Google Scholar] [CrossRef]
  13. Lecun, Y.; Bengio, Y.; Hinton, G. Deep learning. Nature 2015, 521, 436. [Google Scholar] [CrossRef]
  14. Krizhevsky, A.; Sutskever, I.; Hinton, G.E. ImageNet classification with deep convolutional neural networks. Commun. ACM 2012, 60, 2012. [Google Scholar] [CrossRef]
  15. Yang, C.; Li, W.; Lin, Z. Vehicle Object Detection in Remote Sensing Imagery Based on Multi-Perspective Convolutional Neural Network. Int. J. Geo-Inf. 2018, 7, 249. [Google Scholar] [CrossRef]
  16. Han, S.; Ren, F.; Wu, C.; Chen, Y.; Du, Q.; Ye, X. Using the TensorFlow Deep Neural Network to Classify Mainland China Visitor Behaviours in Hong Kong from Check-in Data. Int. J. Geo-Inf. 2018, 7, 158. [Google Scholar] [CrossRef]
  17. Sargano, A.; Angelov, P.; Habib, Z. A Comprehensive Review on Handcrafted and Learning-Based Action Representation Approaches for Human Activity Recognition. Appl. Sci. 2017, 7, 110. [Google Scholar] [CrossRef]
  18. Sainath, T.N.; Kingsbury, B.; Saon, G.; Soltau, H.; Mohamed, A.R.; Dahl, G.; Ramabhadran, B. Deep Convolutional Neural Networks for large-scale speech tasks. Neural Netw. Off. J. Int. Neural Netw. Soc. 2015, 64, 39. [Google Scholar] [CrossRef] [PubMed]
  19. Noda, K.; Yamaguchi, Y.; Nakadai, K.; Okuno, H.G.; Ogata, T. Audio-visual speech recognition using deep learning. Appl. Intell. 2015, 42, 722–737. [Google Scholar] [CrossRef]
  20. Lv, Y.; Duan, Y.; Kang, W.; Li, Z.; Wang, F.Y. Traffic Flow Prediction with Big Data: A Deep Learning Approach. IEEE Trans. Intell. Transp. Syst. 2015, 16, 865–873. [Google Scholar] [CrossRef]
  21. Sermanet, P.; Lecun, Y. Traffic sign recognition with multi-scale Convolutional Networks. Int. Jt. Conf. Neural Netw. 2011, 7, 2809–2813. [Google Scholar]
  22. Zhang, Y.C.; Kagen, A.C. Machine Learning Interface for Medical Image Analysis. J. Digit. Imaging 2017, 30, 615–621. [Google Scholar] [CrossRef]
  23. Alipanahi, B.; Delong, A.; Weirauch, M.T.; Frey, B.J. Predicting the sequence specificities of DNA- and RNA-binding proteins by deep learning. Nat. Biotechnol. 2015, 33, 831–838. [Google Scholar] [CrossRef]
  24. Lu, Y.; Yi, S.; Zeng, N.; Liu, Y.; Zhang, Y. Identification of rice diseases using deep convolutional neural networks. Neurocomputing 2017, 267, 378–384. [Google Scholar] [CrossRef]
  25. Perol, T.; Gharbi, M.; Denolle, M. Convolutional Neural Network for Earthquake Detection and Location. Sci. Adv. 2017, 4, 1700578. [Google Scholar] [CrossRef]
  26. Zhang, Y.; Li, M.; Han, S. Automatic identification and classification in lithology based on deep learning in rock images. Acta Petrol. Sin. 2018, 34, 333–342. [Google Scholar]
  27. Cheng, G.; Guo, W.; Fan, P. Study on Rock Image Classification Based on Convolution Neural Network. J. Xi’an Shiyou Univ. (Nat. Sci.) 2017, 4, 116–122. [Google Scholar] [CrossRef]
  28. Inc, G. TensorFlow. Available online: https://www.tensorflow.org/ (accessed on 5 August 2018).
  29. Ferreira, A.; Giraldi, G. Convolutional Neural Network approaches to granite tiles classification. Expert Syst. Appl. 2017, 84, 1–11. [Google Scholar] [CrossRef]
  30. Boureau, Y.L.; Ponce, J.; Lecun, Y. A Theoretical Analysis of Feature Pooling in Visual Recognition. In Proceedings of the International Conference on Machine Learning, Haifa, Israel, 21–24 June 2010; pp. 111–118. [Google Scholar]
  31. Blistan, P.; Kovanič, Ľ.; Zelizňaková, V.; Palková, J. Using UAV photogrammetry to document rock outcrops. Acta Montan. Slovaca 2016, 21, 154–161. [Google Scholar]
  32. Vasuki, Y.; Holden, E.J.; Kovesi, P.; Micklethwaite, S. Semi-automatic mapping of geological Structures using UAV-based photogrammetric data: An image analysis approach. Comput. Geosci. 2014, 69, 22–32. [Google Scholar] [CrossRef]
  33. Zheng, C.G.; Yuan, D.X.; Yang, Q.Y.; Zhang, X.C.; Li, S.C. UAVRS Technique Applied to Emergency Response Management of Geological Hazard at Mountainous Area. Appl. Mech. Mater. 2013, 239, 516–520. [Google Scholar] [CrossRef]
  34. Tzutalin LabelImg. Git code (2015). Available online: https://github.com/tzutalin/labelImg (accessed on 5 August 2018).
  35. Zhang, Y.; Song, X.F.; Gong, D.W. A Return-Cost-based Binary Firefly Algorithm for Feature Selection. Inf. Sci. 2017, 418, 567–574. [Google Scholar] [CrossRef]
  36. He, K.; Gkioxari, G.; Dollar, P.; Girshick, R. Mask R-CNN. In Proceedings of the IEEE International Conference on Computer Vision, Venice, Italy, 22–29 October 2017; p. 1. [Google Scholar]
  37. Rizk-Allah, R.M.; El-Sehiemy, R.A.; Wang, G.G. A novel parallel hurricane optimization algorithm for secure emission/economic load dispatch solution. Appl. Soft Comput. 2018, 63, 206–222. [Google Scholar] [CrossRef]
  38. Zhang, Y.; Gong, D.W.; Cheng, J. Multi-Objective Particle Swarm Optimization Approach for Cost-Based Feature Selection in Classification. IEEE/ACM Trans. Comput. Biol. Bioinform. 2017, 14, 64–75. [Google Scholar] [CrossRef]
  39. Wang, G.G.; Gandomi, A.H.; Alavi, A.H. An effective krill herd algorithm with migration operator in biogeography-based optimization. Appl. Math. Model. 2014, 38, 2454–2462. [Google Scholar] [CrossRef]
Figure 1. Digital image obtained in the field, allowing the rock type to be identified as mylonite by the naked eye. Partition (A) shows the smaller changes in grain size of mylonite; partition (B) shows larger tensile deformation of quartz particles; partition (C) shows larger grains than partition A and B.
Mathematics 07 00755 g001
Figure 2. The Rock Types deep CNNs (RTCNNs) model for classifying rock type in the field.
Mathematics 07 00755 g002
Figure 3. Learned rock features after convolution by the RTCNNs model. (a) Input patched field rock sample images. (b) Outputted feature maps partly after the first convolution of the input image, from the upper left corner in (a).
Mathematics 07 00755 g003
Figure 4. Whole flow chart for the automated identification of field rock types. (a) Cameras: Canon EOS 5D Mark III (above) and a Phantum 4 Pro DJi UAV with FC300C camera (below). (b) Rock images obtained from outcrops. (c) Cutting images (512 × 512 pixels) of marked features from the originals. (d) Rock-type identification training using CNNs. (e) Application of the trained model to related geological fields.
Mathematics 07 00755 g004
Figure 5. The six types of rock in the field: (a) mylonite, (b) granite, (c) conglomerate, (d) sandstone, (e) shale, and (f) limestone.
Mathematics 07 00755 g005
Figure 6. The extraction of typical rock samples from high-resolution images. Two or more image samples (512 × 512 pixels) are cropped from an original field rock image of 5760 × 3840 pixels. Area A is identified as vegetation cover, and area B is out of focus. Boxes 1–7 are manually labeled as sample patch images.
Mathematics 07 00755 g006
Figure 7. Average loss (a) and accuracy curves (b) for the training and validation dataset using samples of 128 × 128 pixels in 10 experiments.
Mathematics 07 00755 g007
Figure 8. Samples that were incorrectly classified: (a,b) sandstone classified as granite and limestone, respectively; (c,d) limestone classified as conglomerate and sandstone, respectively.
Mathematics 07 00755 g008
Figure 9. (a) Validation loss and (b) validation accuracy curves for four sample patch image sizes.
Mathematics 07 00755 g009
Figure 10. Schematics of two modifications to the proposed model by introducing additional layers. Test A uses one additional convolution layer and one additional pooling layer. Test B has two additional layers of each type.
Mathematics 07 00755 g010
Figure 11. Validation accuracy curves for three models with different depths. The two models Test A and Test B are described in Figure 10 and its caption.
Mathematics 07 00755 g011
Table 1. Parameters and output shapes of the RTCNNs model.
Layer NameFunctionWeight Filter Sizes/KernelsPaddingStrideOutput Tensor
Input//// 128   ×   128   ×   3
Cropped imagerandom_crop/// 96   ×   96   ×   3
Conv1conv2d 5   ×   5   ×   3 /64SAME1 96   ×   96   ×   64
Pool1max_pool 3   ×   3 SAME2 48   ×   48   ×   64
Conv2conv2d 5   ×   5   ×   64 /64SAME1 48   ×   48   ×   64
Pool2max_pool 3   ×   3 SAME2 24   ×   24   ×   64
Outputsoftmax/// 6   ×   1
Table 2. Numbers of original field rock images.
TypeTraining DatasetValidation DatasetNumber of Testing Data
Mylonite571919
Granite375125125
Conglomerate318106106
Sandstone2137171
Shale1264242
Limestone2859595
Total1374458458
Table 3. Datasets for image classification of field rocks.
TypeTraining DataValidation DataTesting Data
Mylonite1584528528
Granite375312511251
Conglomerate337211241124
Sandstone2958986986
Shale1686562562
Limestone1236412412
Total1458948634863
Table 4. Software and hardware configurations.
Configuration ItemValue
Type and specificationDell Inspiron 15-7567-R4645B
CPUIntel Core i5-7300HQ 2.5 GHz
Graphics Processor UnitNVIDIA GeForce GTX 1050Ti with 4GB RAM
Memory8 GB
Hard Disk1 TB
Solid State Disk120 GB
Operating SystemWindows 10 Home Edition
Python3.5.2
Tensorflow-gpu1.2.1
Table 5. Confusion matrix of the RTCNNs model based on the testing dataset.
PredictedMyloniteGraniteConglomerateSandstoneShaleLimestoneError Rate
Actual
mylonite528000000.00%
granite01221618422.40%
conglomerate0011142260.89%
sandstone51629462154.06%
shale002355700.89%
limestone204803983.4%
Table 6. Recognition performance and related parameters.
MethodAccuracy (%)Batch SizeInitial Learning RateComputing Time
SVM85.52000.0013:32:20
AlexNet92.781280.014:49:28
GoogLeNet Inception v397.11000.017:12:53
VGGNet-1694.21000.0015:18:42
Our present study97.96160.034:41:47

