1. Introduction
As the global climate crisis escalates, environmental threats have transformed into worldwide risks, with carbon emissions as the primary driver of climate change. Aiming to safeguard the living environment, the consumer market demonstrates a preference for low-carbon products. In 2019, Toluna found that nearly 40% of respondents were willing to pay more for environmentally friendly products. The Sustainable Consumption in China 2022 Report reveals that 84.78% of consumers may change their purchasing behavior because of negative information about the environmental protection of products. Furthermore, to curb carbon emissions, certain countries and regions have initiated carbon emission policies. Among them, the carbon cap-and-trade policy is one of the most common policies and has been implemented in 31 countries and regions. This mechanism has spawned a new marketplace: the carbon market. In simpler terms, the carbon market is a market in which carbon emission rights are traded as a commodity. The changes in carbon prices are an important reflection of the volatility of the carbon market. Enterprises within the carbon market are assigned a carbon emission cap. Those successfully reducing emissions are capable of selling surplus allowances, while those exceeding their limit must purchase additional allowances within the carbon market. This system not only regulates the overall volume of carbon emissions but also motivates enterprises to reduce emissions by optimizing their energy structure and enhancing efficiency. It is noteworthy that the market-oriented arrangement not only establishes property rights but also leverages the financing function of carbon emission rights. Carbon pledge financing emerged when enterprises used carbon emission rights as collateral to secure loans from financial institutions. The obtained funds can be utilized for clean production as well as improvements in technologies related to pollution prevention and control. This activates carbon assets and alleviates the financial dilemma of enterprises carrying out emission control actions.
Driven by the triple drive from the consumer market, the carbon market, and the financial market, enterprises have recognized the importance of a low-carbon transition. However, the actual carbon reduction efforts of enterprises remain unsatisfactory. This study identifies enterprises working independently and externalities of environmental protection as important reasons that hinder the enthusiasm of enterprises to reduce carbon emissions. Specifically, while enterprises taking proactive action to reduce emissions can help optimize their operations, it usually also indirectly benefits other supply chain players who are not making any effort. However, the associated costs are borne by those who are proactive enterprises themselves. The inequity caused by environmental benefits spillover weakens the motivation for many enterprises to reduce carbon emissions, negatively impacting the entire supply chain’s sustainable development. Consequently, given the green requirements of the supply chain, exploring how to achieve the decarbonization plan through cooperation among enterprises is still an important topic requiring in-depth exploration.
The early literature relating to emission reduction cooperation is mostly based on questionnaire surveys from the perspective of green supply chains, such as [
1,
2,
3]. Their work provides ideas for the practical implementation of carbon reduction cooperation among enterprises. Core enterprises in many supply chains have initiated or are developing cooperative emission reduction programs with their partners. Two cooperation mechanisms are the most widely employed. The first involves a cost cooperation model, where core enterprises share a portion of the carbon emission reduction investment costs for partners to promote overall emission reduction. For instance, Nestle plans to invest CHF 1.2 billion in 2025 to encourage regenerative agriculture development in collaboration with suppliers. Walmart shares the cost of organic cotton cultivation with its suppliers, facilitating the transition from traditional farming to organic farming. Coca-Cola collaborates with upstream suppliers to innovate emissions reduction technologies and update eco-friendly materials. The second type is the alliance cooperation model, where the core enterprises integrate with their partners, jointly developing a decarbonization plan for the supply chain as a whole. For example, BASF actively leverages its influence by establishing the “Sustainable Development Alliance” with upstream and downstream partners. This initiative brings together industry chain partners to collaboratively create emission reduction projects and promote low-carbon development in key sectors and industries.
With increasing practical experience, some scholars attempt to construct mathematical models to quantitatively analyze the impact of enterprises’ cooperative carbon reduction. However, they primarily rely on investigations conducted in the context of single or dual markets, rarely covering multiple markets simultaneously, such as the consumer market, the financial market, and the carbon market. For instance, both the analyses by Yang and Chen [
4] and Wu et al. [
5] on the value of cost cooperation and the exploration of the impact of cross-shareholding by Xia et al. [
6] focus solely on the consumer market. Wang et al. [
7] and Lee and Yoon [
8] considered the carbon market but overlooked potential differences in enterprises finance levels. Huang et al. [
9] discussed the effectiveness of incentivizing enterprises’ carbon reduction behaviors through financial innovation cooperation under financial constraints, yet they unfortunately failed to consider the impact of the internalization of environmental benefits from carbon trading. However, as the global carbon market and green financial market continue to advance and the consumer market trends towards greening, the development of low-carbon supply chains is inevitably influenced by multi-market interaction. Therefore, it is of great significance to discuss the value and market applicability of cooperation under multi-market interaction. This is vital for achieving profits, efficient distribution, and satisfying the development of a low-carbon supply chain. Specifically, we focus on the following questions: How does vertical cooperation impact supply chain operational decisions under multi-market intersections? Can it incentivize enterprises to reduce carbon emissions, expand the supply chain market, and enhance economic benefits? How should enterprises choose their collaborative strategies? Is there variation in the market applicability of different cooperation models? Are fluctuations in the carbon markets and financial markets likely to affect the advantages of vertical cooperation?
Drawing from the preceding analysis, we focus our attention on a low-carbon supply chain system comprising one retailer and one supplier. The retailer is the leader, while the supplier, facing capital constraints, operates as the follower. In the context of a carbon cap-and-trade policy, the supplier lacks the upfront capital for low-carbon investments but has the option to pledge carbon emission rights in exchange for a loan from a bank. At the same time, the retailer strives to collaborate with the supplier through cost-sharing or alliances. Through model construction and comparative analysis, we investigate the impact, value, and market applicability of vertical cooperation within the intersection of the consumer market, financial market, and carbon market.
The main findings and contributions of this study are summarized below. Firstly, compared to most prior research on low-carbon supply chains, this study integrates three markets simultaneously: the consumer market, the financial market, and the carbon market. Game models are developed to capture the operational characteristics of various vertical cooperation mechanisms under multi-market interactions and obtain corresponding equilibrium decisions. Secondly, we analyze the multi-party impacts of vertical cooperation using the case without cooperation as a benchmark. Our findings reveal that both cost cooperation and alliance cooperation effectively incentivize the supplier to reduce carbon emissions and assist enterprises in gaining more market share. Unlike the discussion of Qin et al. [
10], we further return pricing power to enterprises and find that while cost cooperation may lead to inflated retail prices, alliance cooperation is more consumer-friendly, potentially enabling consumers to purchase greener products at lower prices. In addition, only alliance cooperation can enhance the overall economic efficiency of the supply chain, whereas cost cooperation is limited in this regard. Lastly, we observe the influence of various market fluctuations on the applicability of vertical cooperation models. We confirm that, concerning environmental protection and market expansion, alliance cooperation is more suitable in the early market where enterprise carbon emission reduction technology is immature, or consumer environmental awareness is shallow. As carbon emission reduction technology improves or consumer environmental awareness grows, cost cooperation becomes the preferred choice in the mid-to-late market. Additionally, fluctuations in the financial markets and carbon markets impact the scope of the application. The environmental protection advantages of cost cooperation expand with increased interest rates in the financial market and higher transaction prices in the carbon market. Conversely, the advantages of alliance cooperation are gradually compressed with the rise of interest rates and carbon prices.
The remainder of the paper is structured as follows.
Section 2 provides a summary of the literature relevant to this study. In
Section 3, we describe the basic problem. In
Section 4, we construct game models based on different cooperation models and derive the corresponding optimal decisions.
Section 5 explores the impact and applicability of vertical cooperation through comparative analysis, and substantiates our findings with numerical analysis.
Section 6 summarizes the key findings and offers managerial insights, along with suggesting avenues for future research. Detailed proofs of the propositions and corollaries presented in this paper can be found in
Appendix A.
2. Literature Review
This study emphasizes the integration of low-carbon production, green investment and financing, and operational cooperation. Therefore, the research in this paper involves the following three areas: (1) carbon emission reduction incentives; (2) low-carbon supply chain cooperation; and (3) the cross-interface between finance and green operations.
2.1. Carbon Emission Reduction Incentives
Incentivizing enterprises to reduce carbon emissions is an important topic in the green economy. Many scholars have explored this area, primarily concentrating on the impact of policy guidance on low-carbon supply chains. For instance, regarding carbon trading policy, Zhang and Xu [
11] demonstrated that a cap-and-trade policy induces enterprises to produce more carbon-efficient products in a multi-project production planning. Du et al. [
12] clarified the key drivers of enterprises’ decisions in low-carbon supply chains, indicating that a sufficiently high carbon price promotes the adoption of low-carbon technologies more effectively than consumers’ low-carbon premium. Following this, Tong et al. [
13] developed an evolutionary game model, again validating the drivers of carbon price and consumers’ low-carbon preferences on enterprises’ green behaviors. Xia et al. [
14] highlighted the impact of carbon trading policy in a competitive environment between low-carbon products and ordinary products. For the carbon tax policy, Dou et al. [
15] introduce the carbon tax policy into a supply chain system with two-phase production to explore the differential impacts of the tax price on the different production phases. Chen et al. [
16] analyzed the impact of the carbon tax on environmental regulation under a duopoly market structure. For subsidy policies, Cohen et al. [
17] discussed the impact of demand uncertainty on customer subsidy policy. Berenguer et al. [
18] studied how enterprise characteristics affect the subsidy equilibrium when both purchase and sales subsidies are available. Huang et al. [
19] considered the government’s subsidized decision for energy-efficient products in a competitive environment. Of course, there are some other policy discussions, such as fuel fee policy [
20,
21], carbon standard policy [
22], and so on.
The above research results provide a systematic and comprehensive description of the impact of various carbon reduction policies. They offer insights into the green transformation of enterprises within different policy contexts. Inspired by these results, we also discuss incentive behaviors for carbon reduction but in different ways and directions. Specifically, the carbon reduction policies mainly originate from the government or other regulatory agencies, constituting external incentives for the supply chain. Our work is to extend the research to the supply chain’s internal perspective on the basis of external policy incentives, focusing on enterprises’ vertical cooperation and green investment interactions. This involves discussing the convergence of internal and external incentives within the supply chain.
2.2. Low-Carbon Supply Chain Cooperation
The importance of cooperation as a strategic development approach has been widely acknowledged in [
23,
24]. With the development of the low-carbon economy, scholars have incorporated cooperation into low-carbon supply chains. Initially, some researchers focused on selecting green partners. For example, Rao et al. [
25] established an evaluation index system for choosing low-carbon cooperators. Yu et al. [
26] proposed an incentive framework for selecting green suppliers based on carbon footprints. Sebastian et al. [
27] introduced an ANP model to assess the ability of suppliers to implement emission reduction cooperation. Subsequently, scholars shifted their focus to analyzing the green supply chain contract coordination mechanism, aiming to strengthen relationships by devising reasonable contract terms. For instance, Song [
28] discussed the role of revenue-sharing contracts in coordinating benefit distribution among enterprises and improving overall performance. Ghosh and Shah [
29] investigated the effectiveness of repurchase contracts in two-stage supply chain coordination. Cao et al. [
30] designed cost-sharing contracts and repurchase contracts in environmentally sensitive agricultural supply chains. With the ongoing progress of economic globalization, strategic alliances have emerged as a novel form of collaboration. Currently, academic discussions on alliance cooperation primarily revolve around empirical analyses. For instance, Hübel et al. [
31] substantiated the contribution of alliance cooperation to market sustainability transformation by scrutinizing the meat supply chain in Europe. Steven and Merklein [
32] analyzed the influence of a strategic alliance membership on determinants of carbon intensity in passenger transportation by using the international aviation data. Existing studies provide limited discussion on the functional path profiling and value quantification analysis of alliance cooperation.
In this paper, we introduce alliance cooperation and cost cooperation into green supply chains, quantitatively analyze their values, and explore cooperation choices in diverse market contexts based on variations in functional paths. Additionally, most of the studies have overlooked the aspect of financial constraints. In reality, many enterprises, particularly SMEs, face financial shortages in their day-to-day operations, and carbon emission reduction further amplifies financial pressures. This circumstance prompts us to consider capital constraints and explore the impact of financial market fluctuations on the advantages and choices of different cooperation models. We do find that rising financing costs will increase the carbon reduction advantage of cost cooperation.
2.3. Cross-Interface between Finance and Green Operations
The cross-interface between finance and green operations is also a research direction involved in our work. Several scholars have verified the linkage between financial market development and environmental quality through empirical analysis, highlighting the positive impact of a thriving financial market on environmental quality [
33,
34,
35]. Unlike the above economics literature, this paper employs game theory to examine the influence of the financial market on the low-carbon operations of enterprises. This mostly emphasizes the rigorous derivation of decisions and the examination of stakeholders’ performance, especially the decision-making discussion under the newsboy framework, such as in literature [
36,
37]. Our study summarizes the related literature, providing references and extensions. Firstly, it assumes that enterprises in the supply chain sell low-carbon products, with product demand sensitive to both price (or functional attributes) and carbon footprint due to consumers’ environmental preferences. Second, the existing literature is primarily centered on trade credit and insights into optimal payment timing, such as [
38,
39]. In this paper, we introduce a carbon cap-and-trade policy, wherein the carbon emission rights are pledged to banks for external financial support, creating an interaction of three markets (the consumer market, the carbon market, and the financial market). Consequently, this situation also forces us to explore the impact of different market fluctuations on the value play and choice of vertical cooperation. This novel perspective adds uniqueness to our research on both theoretical and practical levels.
Studies closely related to ours are Qin et al. [
10] and Xia et al. [
6], but there are significant differences. Firstly, although Qin et al. [
10] also explore cost incentives for carbon emission reduction, they only consider enterprises’ carbon reduction decisions and do not give the corresponding pricing power. Intuitively, varying product inputs lead to distinct pricing schemes or profit levels. Therefore, we return pricing power to supply chain participants and find that different cooperation models influence enterprises’ pricing decisions. Specifically, cost cooperation can result in inflated retail prices, while alliance cooperation may enhance product cost-effectiveness. The study by Xia et al. [
6] also fails to consider product pricing. Secondly, Xia et al. [
6] concentrate on enhancing strategic synergies in green supply chains through cross-shareholding cooperation, whereas our investigation centers on evaluating the value of cost cooperation and alliance cooperation. Additionally, we incorporate an external incentive background for carbon cap-and-trade policies based on supply chain internal cooperation, and examine the impact of consumer market, financial market, and carbon market volatility on the value and choice of cooperation, which is also not considered in the study by Xia et al. [
6].
3. Problem Description
Enterprise operations and bank loans. In a supply chain consisting of a supplier and a retailer, the supplier is responsible for the production of low-carbon products. Carbon emissions are generated in production. The initial carbon emission per unit of product is
. Under the carbon cap-and-trade policy, the supplier, as an emission control enterprise, can obtain a carbon allowance
from the government. In actual production, the supplier may experience shortages or surpluses of carbon allowances. When emissions are exceeded, it can buy carbon emission rights in the carbon trading market. Conversely, if the supplier retains surplus carbon allowances post-production, the surplus can be sold. The carbon price is
. Therefore, to control carbon emissions, the supplier commits to carbon reduction efforts denoted by
. Similar to the literature [
40], the corresponding carbon reduction cost is
, where
is the difficulty of carbon reduction for enterprises. The larger the
, the higher the cost of carbon reduction. In addition to low-carbon investments, the supplier is also accountable for basic production costs. According to literature [
41] and literature [
42], the main cost of product decarbonization lies in R&D investment, which has little impact on the production cost of products and is ignored here. Thus, we denote the unit production cost of the product as
and assume it is fixed. It is presumed that the supplier possesses sufficient capital for fundamental production activities but lacks the funding to cover the costs of low-carbon investment. To facilitate carbon reduction, the supplier can obtain bank loans by pledging carbon emission rights with an interest rate
. After the product is delivered to the retailer, the supplier receives the payment and then pays the principal and interest to the bank to redeems the carbon emission credits. The retailer sells the product to the market at a price
, adhering to the cost-plus method, expressed as
, where
is the wholesale price of the product and
is the unit retail profit.
Market demand. With the increasing environmental consciousness of the consumer market, we introduce consumers’ preferences for low-carbon products. According to the literature [
43], assuming the consumer market exhibits dual sensitivity to price and carbon reduction, the market demand is represented as
, where
is the initial market size,
is the price sensitivity of the consumer market, and
is the carbon sensitivity of consumer market.
Enterprises gambling and cooperation. The Stackelberg game theory, also known as the “leader-follower model”, is adopted in this paper, which is frequently used to model scenarios with a dominant player. The leaders move first and can anticipate followers’ reactions, incorporating them into their decision-making. The followers, in turn, create the most advantageous decisions for themselves within the leader’s decision-making framework. With the expansion of the buyer’s market, traditional supplier dominance is being replaced by retailers in many industries [
44,
45], such as Carrefour and Aldi. In addition, considering that SMEs are more likely to fall into financial difficulties, we assume that the supplier is an SME and is subject to retailer leadership in the Stackelberg game. Within the game framework, the retailer determines the pricing decisions firstly, and then the supplier determines the carbon reduction level and the wholesale price of the product. To incentivize the supplier to reduce carbon emissions, the retailer, as a leader, can strengthen cooperation with the upstream supplier through cost cooperation and alliance cooperation. Under the cost cooperation model, the retailer will share the investment cost of carbon reduction with the supplier. Under the alliance cooperation model, the retailer and the supplier are considered a unified entity, and the entire supply chain grapples with carbon quota and financial constraints. Within the game framework, we model the low-carbon supply chain system under various cooperation models and seek the corresponding decisions.
Table 1 lists the parameters in this paper. In addition, to distinguish the different subjects more clearly, we use subscripts
to represent the retailer, the supplier, and the entire supply chain, respectively. Meanwhile, to clarify the different cooperation modes, superscripts
represent no cooperation, cost cooperation, and alliance cooperation, respectively.
4. Model Building and Analysis
4.1. Decision Analysis under No Cooperation Model
Under no cooperation model, the supplier bears all carbon reduction costs, and the retailer offers no support. In the face of capital constraints, the supplier can pledge its carbon rights to apply for a loan of from the bank for emission reduction. After production is completed, the product is delivered to the retailer, and the payment is . Subsequently, the supplier pays to the bank to redeem the carbon rights. Then, carbon trading occurs in the carbon market based on actual emissions to generate income (or pay expenses) . During the sales period, the retailer sells the product to the market and receives revenue . Both parties independently make balanced decisions to maximize their profits. We denote the scenario by model .
In this scenario, the retailer’s profit function is as follows:
The supplier’s profit function is as follows:
The backward induction approach is an effective method for analyzing dynamic games. It involves starting from the last stage, determining strategy choices backward to forward, and ultimately obtaining strategy combinations for each party at different stages. Within the Stackelberg game framework, equilibrium decisions can be obtained by the backward induction approach.
Proposition 1. Under no cooperation model, the optimal carbon reduction level, the wholesale price, and the retail price of the product are as follows: At this time, the market demand is as follows:
The profit of the supplier, the retailer, and the entire supply chain are as follows:
Proposition 1 outlines the operation decisions within no cooperation mode. Through observation, enterprises’ carbon reduction decisions and market demand are strongly correlated with the difficulty of carbon reduction, interest rates, the carbon sensitivity of the consumer market, and carbon prices. The following corollary provides the details.
Corollary 1. Under no cooperation model, and both decrease with and and increase with and .
Corollary 1 indicates that the difficulty of carbon reduction, and the fluctuations of different markets significantly impact enterprises’ motivation in emission reduction planning. High carbon reduction difficulty will overwhelm enterprises in the low-carbon transition, discouraging them from implementing carbon reduction. Excessively high interest rates in the financial market can lead to a surge in the financing cost of carbon reduction for the supplier, prompting a natural decrease in the level of carbon reduction. On the contrary, as consumer market carbon sensitivity and carbon prices rise, enterprises can gain higher benefits from both the consumer market and carbon market through carbon reduction actions, encouraging the supplier to adopt a higher carbon reduction level. This finding was also validated in [
46]. Moreover, affected by changes in carbon reduction decisions, product market demand shows a tendency to decrease as interest rates and the difficulty of carbon reduction rise and to increase with heightened consumer market carbon sensitivity and carbon prices. However, it is important to note that
is needed according to
and
. This implies a limitation on the growth of carbon prices. The supplier will be incentivized to reduce carbon emissions only when the carbon price is increased within a reasonable range. Conversely, if the carbon trading price is excessively high, it may diminish suppliers’ carbon reduction investment, as selling carbon allowances might be more lucrative than production activities. This could lead the supplier to withdraw from the consumer market and shift focus to the carbon market.
4.2. Decision Analysis under Cost Cooperation Model
To provide additional incentives for the supplier to carbon reduction, we explore scenarios in which the retailer opts to collaborate with the supplier to jointly bear the costs of carbon reduction in this section. The supplier is only responsible for
portion of the carbon reduction cost, while the retailer bears the remaining
portion. In this scenario, we use the model
to demonstrate. The profit functions for the supplier and the retailer are as follows:
According to the backward induction approach, the supply chain equilibrium decision under cost cooperation is as follows.
Proposition 2. Under the cost cooperation model, the optimal carbon reduction level, the wholesale price, and the retail price of products are as follows: At this time, the market demand is as follows:
The profit of the supplier, the retailer, and the entire supply chain are as follows:
Proposition 2 can be proved in a similar way to Proposition 1, but the details are omitted. Observing Proposition 2, we note that under the cost cooperation model, the equilibrium decisions are also influenced by various market fluctuations. Furthermore, the determination of the cost-sharing ratio plays a crucial role in the enterprise’s environmental effectiveness, market expansion capability, and profitability. Corollary 2 shows the specific details.
Corollary 2. Under cost cooperation model, we have the following:
- (1)
decrease with and and increase with and .
- (2)
, , , and increase first and then decrease with .
Corollary 2 indicates that the description outlined in Corollary 1, regarding the influence of market volatility on enterprises’ carbon reduction decisions, is equally applicable to the supply chain system with cost cooperation. In other words, regardless of the existence of cost cooperation between the retailer and the supplier, the carbon reduction level of the supplier is positively influenced by the carbon sensitivity of the consumer market and negatively affected by the carbon reduction difficulty and interest rate. An appropriate increase in the carbon price will also incentivize the supplier to increase the carbon reduction level. In addition, Corollary 2 also shows that the retailer and the supplier should not blindly pursue excessively high shareholdings, whether considering incentives for carbon reduction, market expansion, or profit enhancement. First of all, the increase in the share implies that the supplier can shift more of the carbon reduction costs to the retailer, incentivizing its active participation in carbon reduction. However, if the share is too high, the retailer will face excessive pressure on additional carbon reduction funds. At this time, the retailer, as a leader, may choose to transfer this pressure back to the supplier through preferential pricing, causing a slowdown in the supplier’s carbon reduction actions. This discovery extends the findings of Qin et al. [
10], who examined the value of the cost-sharing mechanism in the price-exogenous supply chain system. We attribute pricing power to supply chain players, revealing that the pricing power of enterprises somewhat erodes the value of cost cooperation. Secondly, changes in decision-making influence market demand, and as the sharing rate increases, market demand initially rises and then decreases. In the end, the key to profit change lies in the balancing force between demand growth and cost growth. With a low share ratio, the positive effect of market demand can offset the increased cost of carbon reduction, thereby boosting enterprises’ profits. However, with a high share, the additional carbon reduction costs for the retailer skyrocket. Even if market demand increases, it becomes challenging to bridge the cost gap, resulting in a decline in profits. Therefore, when determining the sharing ratio, enterprise managers should carefully consider maintaining it within an acceptable range to promote a harmonious relationship among the involved parties. In practice, the determination of the cost-sharing ratio typically relies on the attribution of discourse power.
Corollary 3. If the retailer prioritizes the share ratio, it will be set to . If the supplier prioritizes the sharing ratio, it will be set to .
Corollary 3 highlights that the retailer and the supplier, in their pursuit of maximizing profits, prefer distinct sharing ratios of carbon reduction costs, which is validated in [
9] as well. As this article focuses on a retailer-lead supply chain system, we will adopt the retailer’s preference for a share ratio when discussing the value and applicability of cost cooperation in
Section 5 below, i.e.,
.
4.3. Decision Analysis under Alliance Cooperation Model
Under the alliance cooperation model, the retailer and the supplier cease to be independent entities making decentralized decisions. Instead, they merge to collectively determine carbon reduction levels and retail prices of products. They also jointly bear the costs of production, carbon reduction, and financing, as well as jointly receive sales revenue and carbon trading income. For this scenario, we denote it by model
. The profit function of the entire supply chain is as follows:
The supply chain equilibrium decision under alliance cooperation model can also be obtained by the backward induction approach. The exact solution procedure is similar to the proof of Proposition 1, and we will not repeat this showing too many details.
Proposition 3. Under alliance cooperation model, the optimal carbon emission reduction level and product retail price are as follows: At this time, the market demand and the profit of the entire supply chain are as follows:
Through Proposition 3, we can find that the supplier’s carbon reduction level decreases with the increase in interest rates and the difficulty of carbon reduction under alliance cooperation model (i.e.,
and
). The heightened market sensitivity to carbon reduction indicates a greener market, where consumers prefer low-carbon products, leading suppliers to naturally increase investment in carbon emission reduction (i.e.,
). These characteristics align with those of the above-mentioned no cooperation model and cost cooperation model. This implies that, regardless of cooperation, the government can stimulate enterprises to reduce carbon emissions through market regulation, such as expanding green financial inclusion, intensifying consumers’ environmental protection awareness by increasing publicity, and judiciously promoting carbon prices via expanding the carbon market. The conclusions in literature [
47,
48] provided substantiation for this finding.
Certainly, ensuring a fair profit distribution is pivotal for sustaining a stable cooperative relationship. Under the alliance cooperation model, the negotiation of internal wholesale prices can serve as a crucial means for adjusting profit distribution. The stability and sustainability of the partnership will be better preserved if it can be ensured that both parties can obtain profit enhancement from the cooperation.
Corollary 4. Under the alliance cooperation model, there exists an internal wholesale price that can be harmonized between the parties, satisfying , where Corollary 4 gives a space for the application of internal wholesale prices. The internal wholesale price cannot be too high or too low, as surpassing the threshold may lead to serious inequities in profit distribution, weakening incentives for cooperation between both parties. Additionally, it is worth noting that correlations exist between the cooperation area boundary and factors such as interest rates, the carbon sensitivity of the consumer market, and carbon prices. Therefore, when negotiating internal wholesale prices, enterprise managers should also monitor the volatility of financial markets, consumer markets, and carbon markets to make more accurate and flexible pricing decisions.
5. The Impact of Vertical Cooperation
In the above section, we have acquired carbon reduction and pricing decisions, market demand, and profits of supply chain players under different cooperation models. This section will further explore the impact of vertical cooperation through comparative analysis.
5.1. The Impact of Cooperation on Carbon Reduction Level
Proposition 4. Comparing the optimal carbon reduction levels of the supplier, we have the following:
- (1)
.
- (2)
.
- (3)
When (or ), ; Otherwise, .
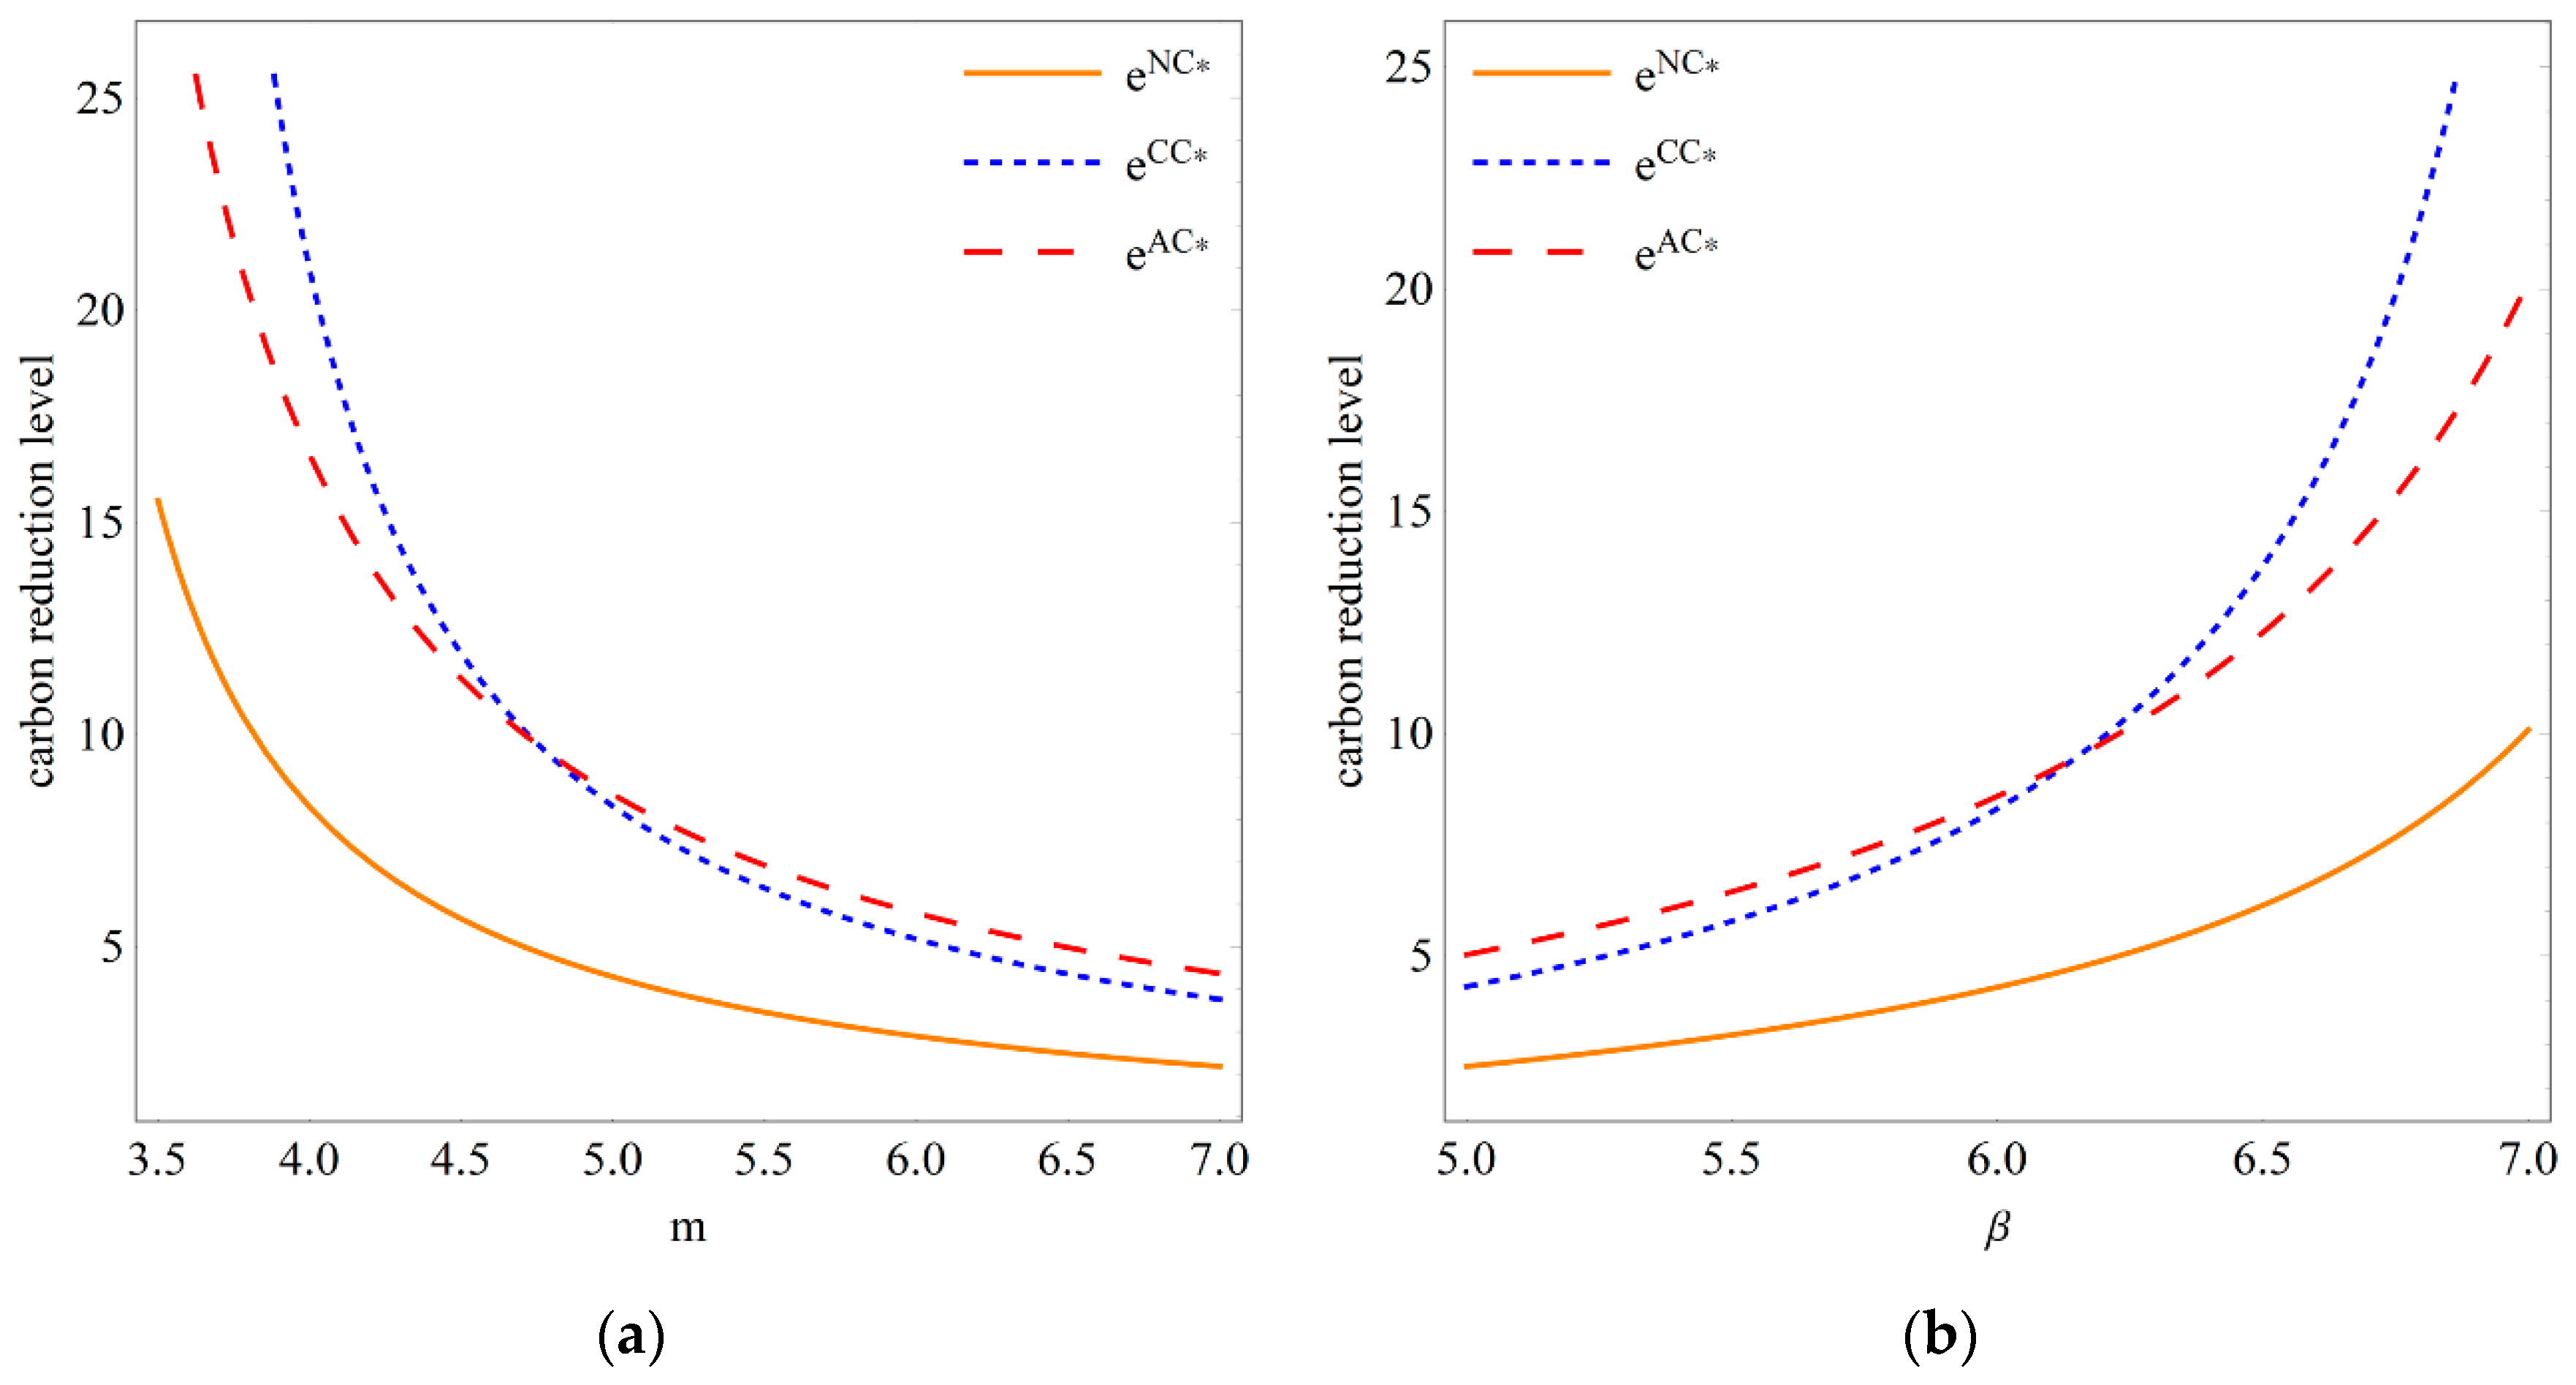
Proposition 4 indicates that in the cost cooperation model or alliance cooperation model, the supplier’s carbon reduction level consistently surpasses those without cooperation, highlighting the positive impact of vertical cooperation on motivating carbon reduction. However, it is not difficult to find that the degree of incentive for carbon reduction varies across different cooperation models. Which cooperation strategy is superior is highly correlated with the difficulty of carbon reduction and the carbon sensitivity of the market. To illustrate the influence of various market factors on the efficacy of cooperative emission reductions, we conducted a numerical analysis using the publicly available data from Chevy. In 2021, Chevy sales were approximately 242,000. As stated in literature [
49], the impact of prices and carbon reductions on demand typically falls within 2%~3.5%. According to the literature [
42], Chevrolet’s unit production cost is around USD 34,000. Each vehicle produces about 35 tons of CO2 during production. Therefore, we take
,
,
, and
.
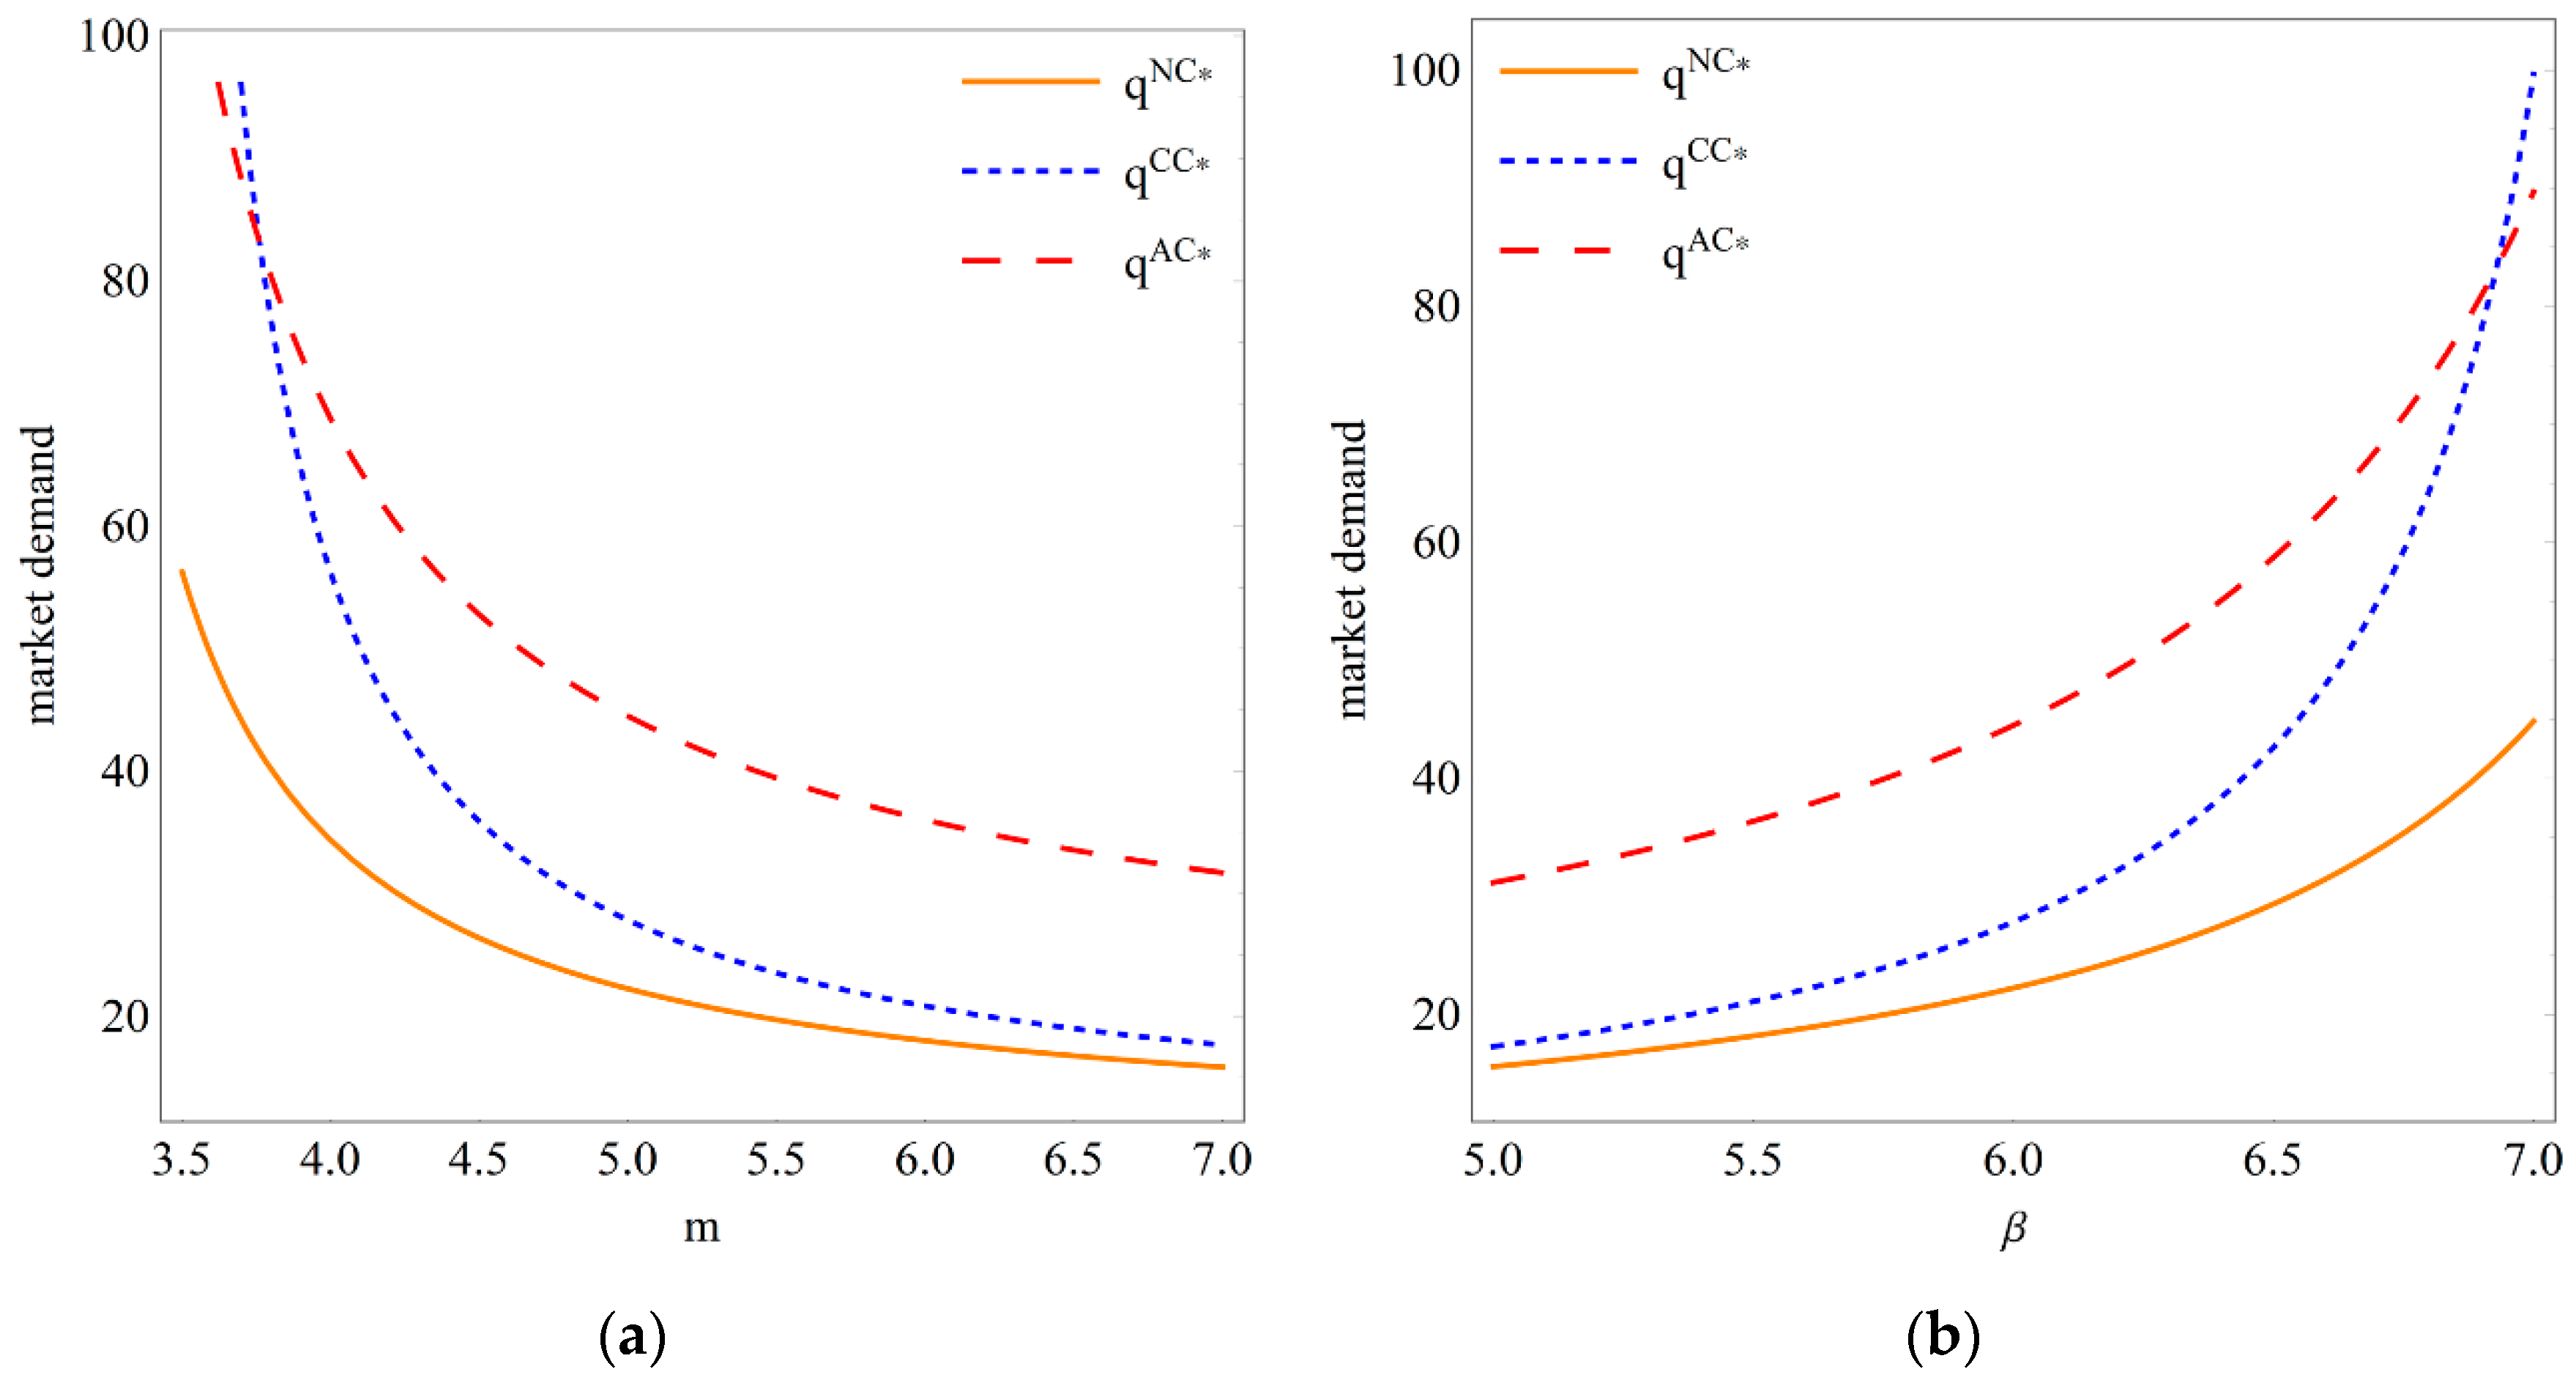
Figure 1 visually demonstrates the influence of carbon reduction difficulty and consumer market carbon sensitivity on the carbon reduction level. The increasing difficulty of carbon reduction consumes enterprises’ motivation to participate in carbon reduction, resulting in a continuous decline in carbon reduction levels. Conversely, a rise in consumer market carbon sensitivity encourages the supplier to set a higher carbon reduction level. This is consistent with the conclusions in Corollary 1 and Corollary 2. From the perspective of the realization effect of carbon reduction incentives, alliance cooperation is the optimal choice when the difficulty of carbon reduction is high or the carbon sensitivity of the consumer market. This is because, compared to cost cooperation, alliance cooperation at this time can assist the supplier in swiftly obtaining market access, securing an initial competitive advantage, and achieving the highest carbon reduction incentive effect. As the difficulty of carbon reduction decreases or the carbon sensitivity of the consumer market increases, the cost-effectiveness of carbon reduction gradually becoming apparent. The carbon reduction level under cost cooperation will surpass alliance cooperation, occupying the highest position. This discovery provides a valuable insight. In the early market stages, carbon reduction technologies are not yet mature, or consumers’ environmental awareness is shallow, alliance cooperation can be used as the main means to drive enterprises’ green transformation. In the mid-to-late stages of the market, with technological upgrades and consumers’ attention to the carbon footprint of products increases, the carbon reduction incentive effect of cost cooperation becomes more effective.
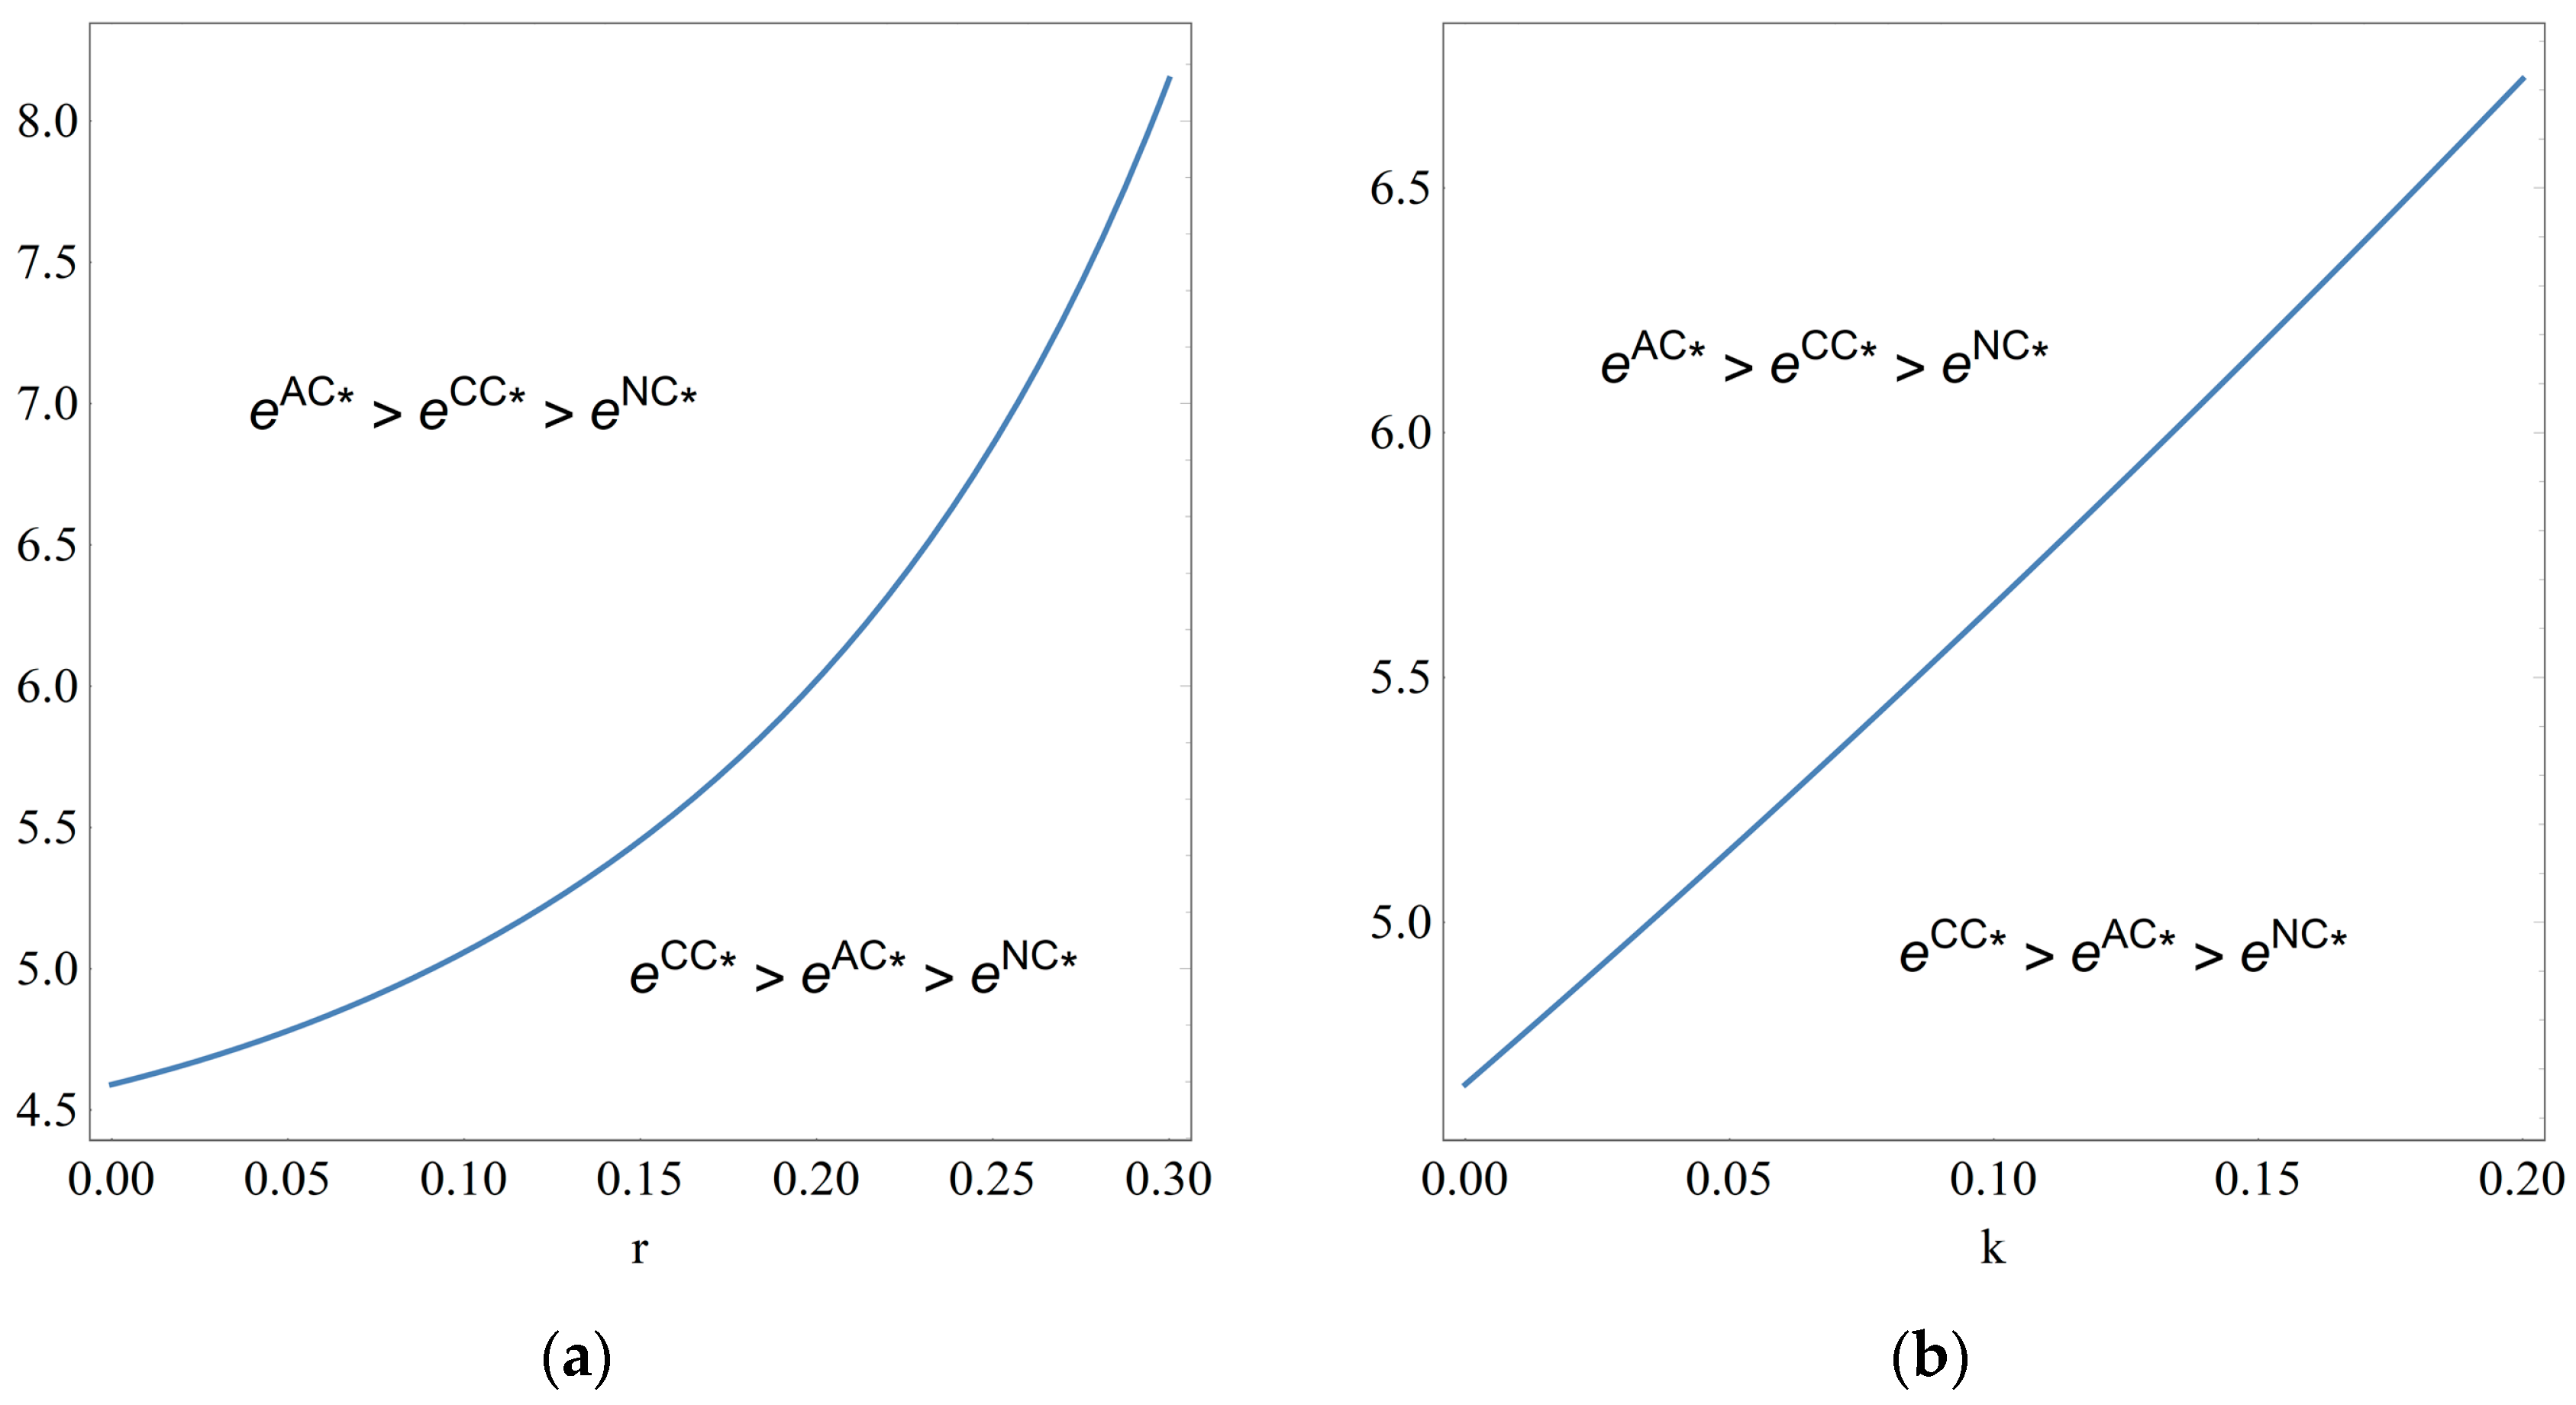
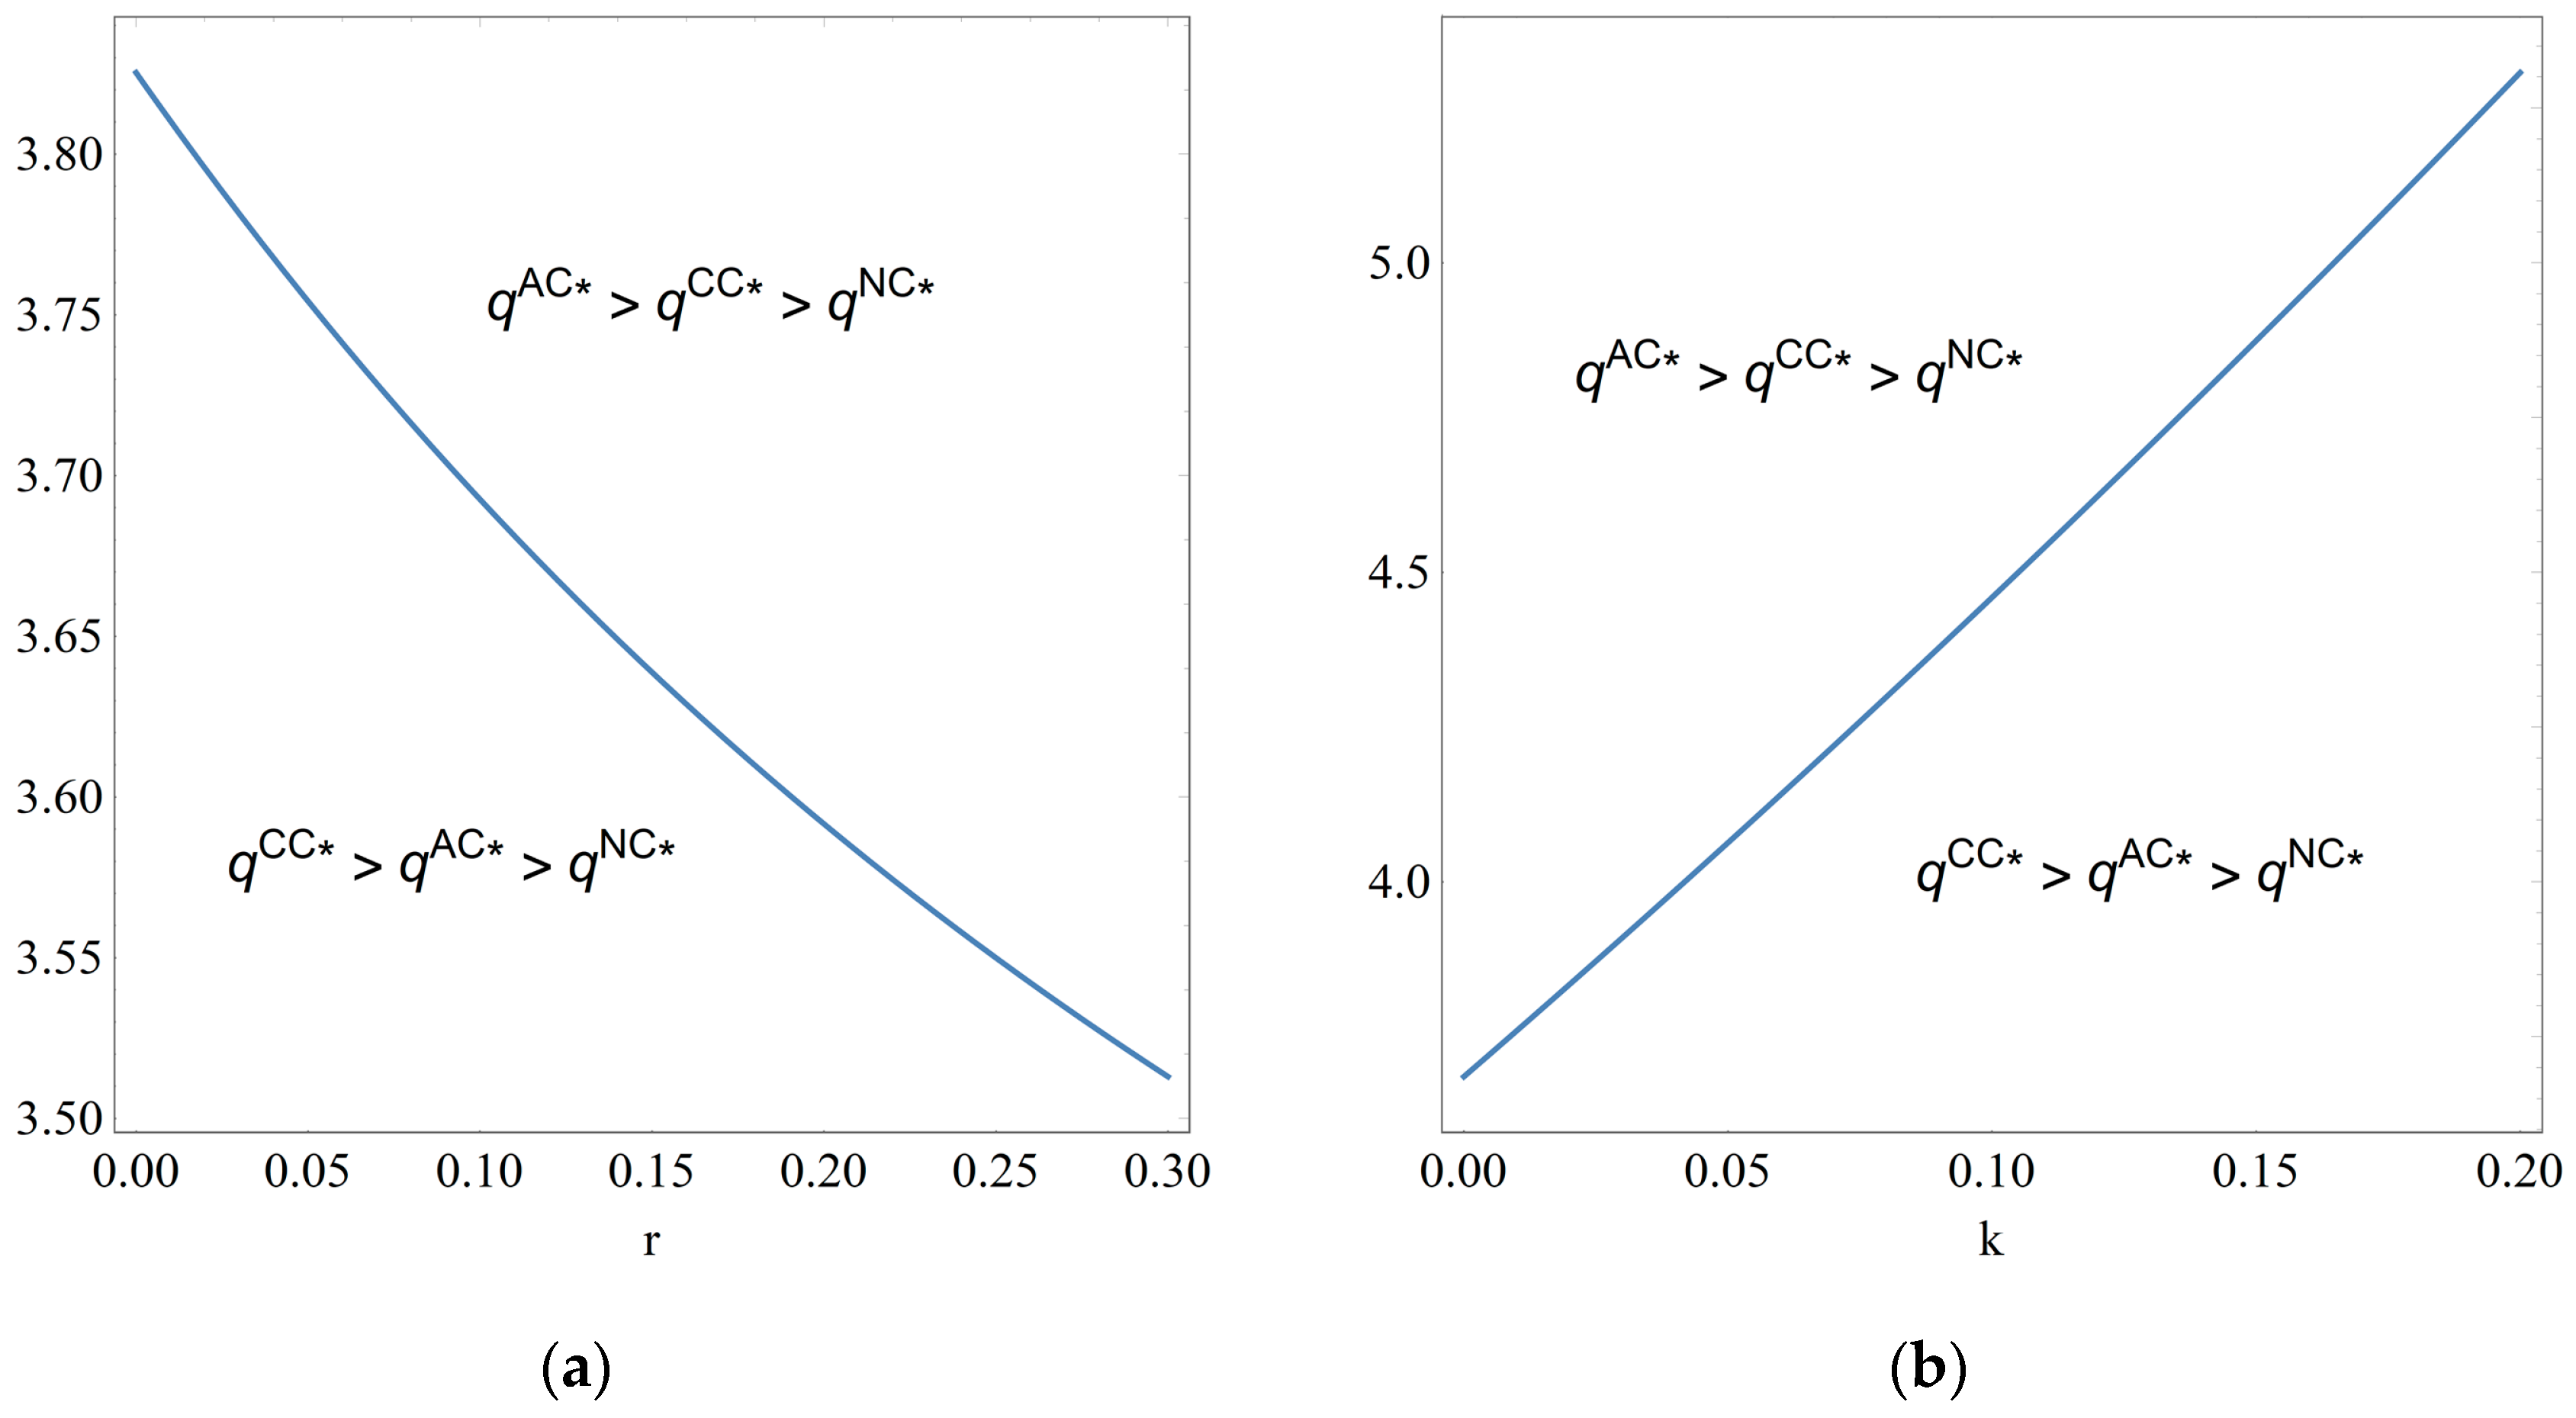
The solid line in
Figure 2 represents the critical value for the transition of carbon reduction dominance between carbon cooperation and alliance cooperation. Above it, the carbon reduction level with alliance cooperation is higher than that of cost cooperation; below it, the carbon reduction level with cost cooperation is the highest. Also, it is important to note that fluctuations in financing interest rates and carbon prices also impact the carbon reduction advantage areas of the cooperation strategy. The rise in interest rates implies a gradual increase in enterprise financing costs. In comparison to alliance cooperation, cost cooperation proves more effective in bridging the enterprise’s capital gap and reducing financing costs. Hence, as interest rates increase, the advantage of cost cooperation becomes more pronounced. Additionally, as the carbon price rises, enterprises pay more actively for carbon reduction, leading to a corresponding rise in financing demand. During this phase, cost-effectiveness becomes crucial again, expanding the scope of advantages for cost cooperation. Simultaneously, the scope of advantages for alliance cooperation gradually diminishes. This clearly illustrates the impact of the financial market and carbon market dynamics on cooperation choice. Therefore, managers should flexibly respond to changes in varied markets to ensure enterprises maintain competitiveness in environmental performance.
5.2. The Impact of Cooperation on Retail Price
Proposition 5. Comparing the retail price, we have the following:
- (1)
When (or ), ; Otherwise, .
- (2)
.
- (3)
.
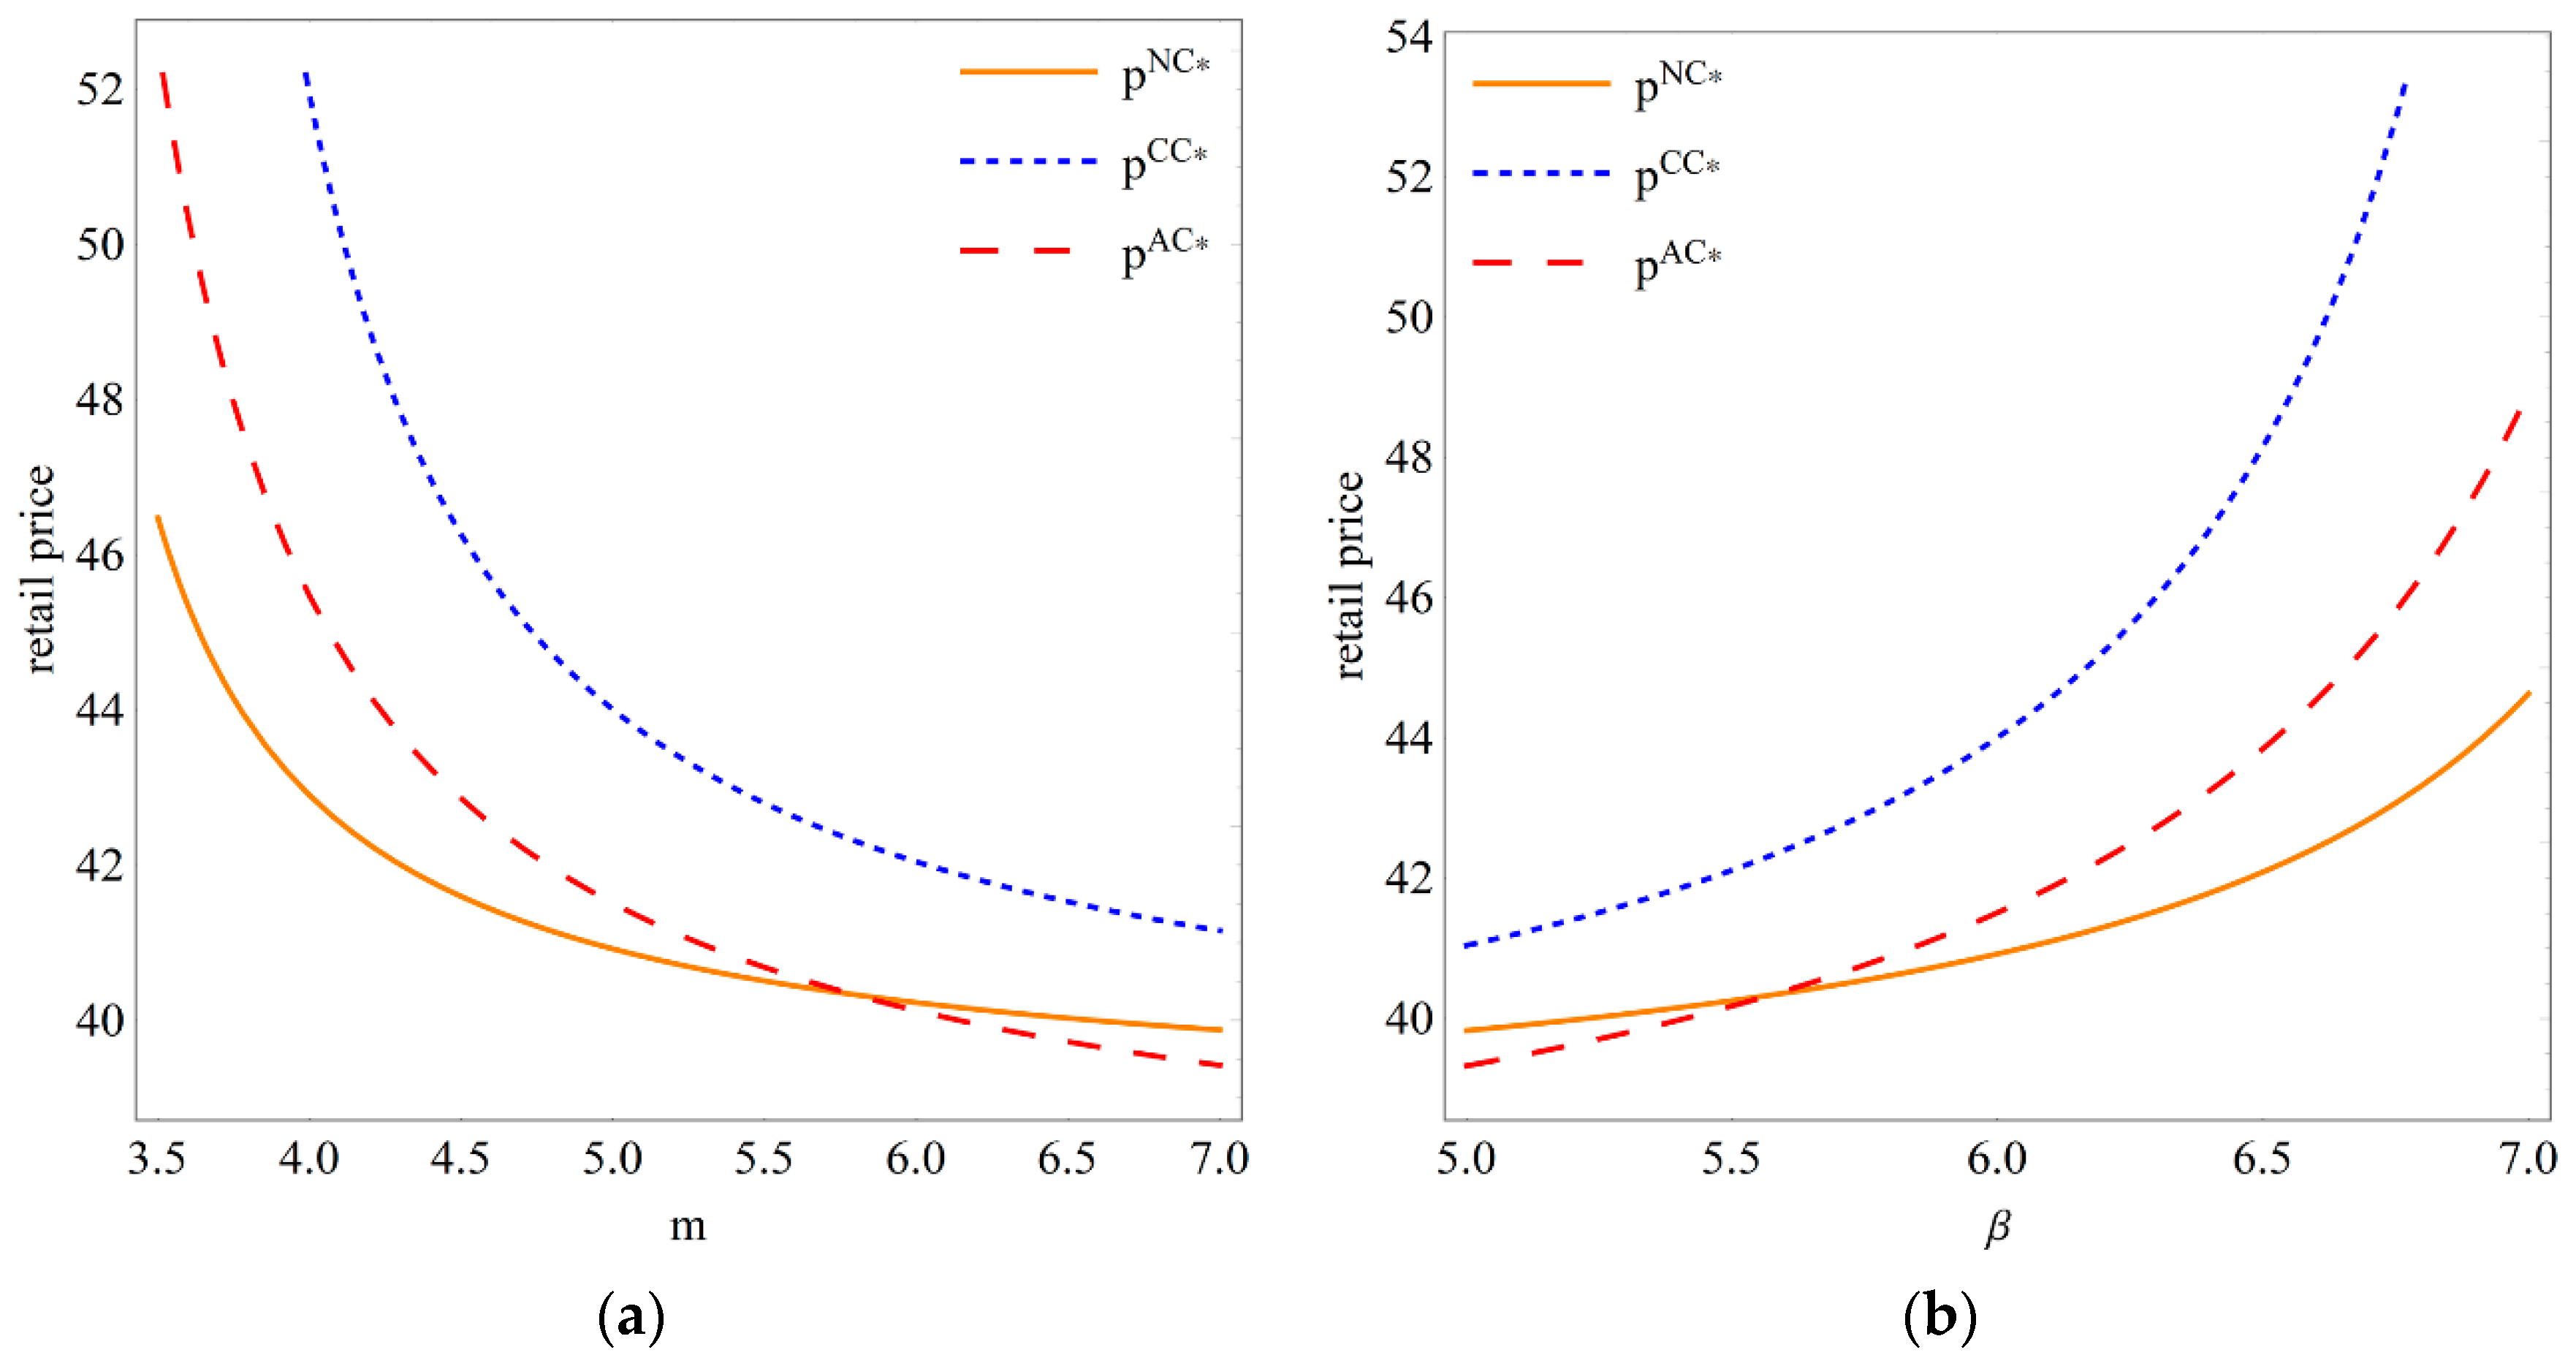
In the conclusion of Proposition 5, we observe that the impact of vertical cooperation on the retail price is not uniform. Specifically, cost cooperation prompts the retailer to establish a higher product price, while the influence of alliance cooperation on retail price depends on the difficulty of carbon reduction and the consumer market’s carbon sensitivity. Particularly in supply chains where carbon reduction is more difficult or the market is less carbon sensitive, alliance cooperation may result in lower retail prices. The explanation for this phenomenon lies in the operation mechanism of different cooperation strategies. In the supply chain with cost cooperation, the retailer shares the cost of carbon reduction from the supplier, increasing its upfront expenditure. As a result, the retailer chooses to raise the selling price of products to ensure profitability. In contrast, under alliance cooperation, the supply chain is viewed as a whole, reducing the double marginal effect and enabling the retailer to offer a more competitive price. In other words, alliance cooperation allows consumers to purchase more environmentally friendly products at lower prices. Additionally, as the difficulty of carbon reduction increases, the retailer tends to a lower price (
Figure 3a). This is because the heightened difficulty of carbon reduction hinders supplier’ carbon reduction efforts, affecting market demand. The retailer needs to reduce prices to attract consumers. Concerning the consumer market, there is a positive correlation between the retail price and the carbon sensitivity of the market (
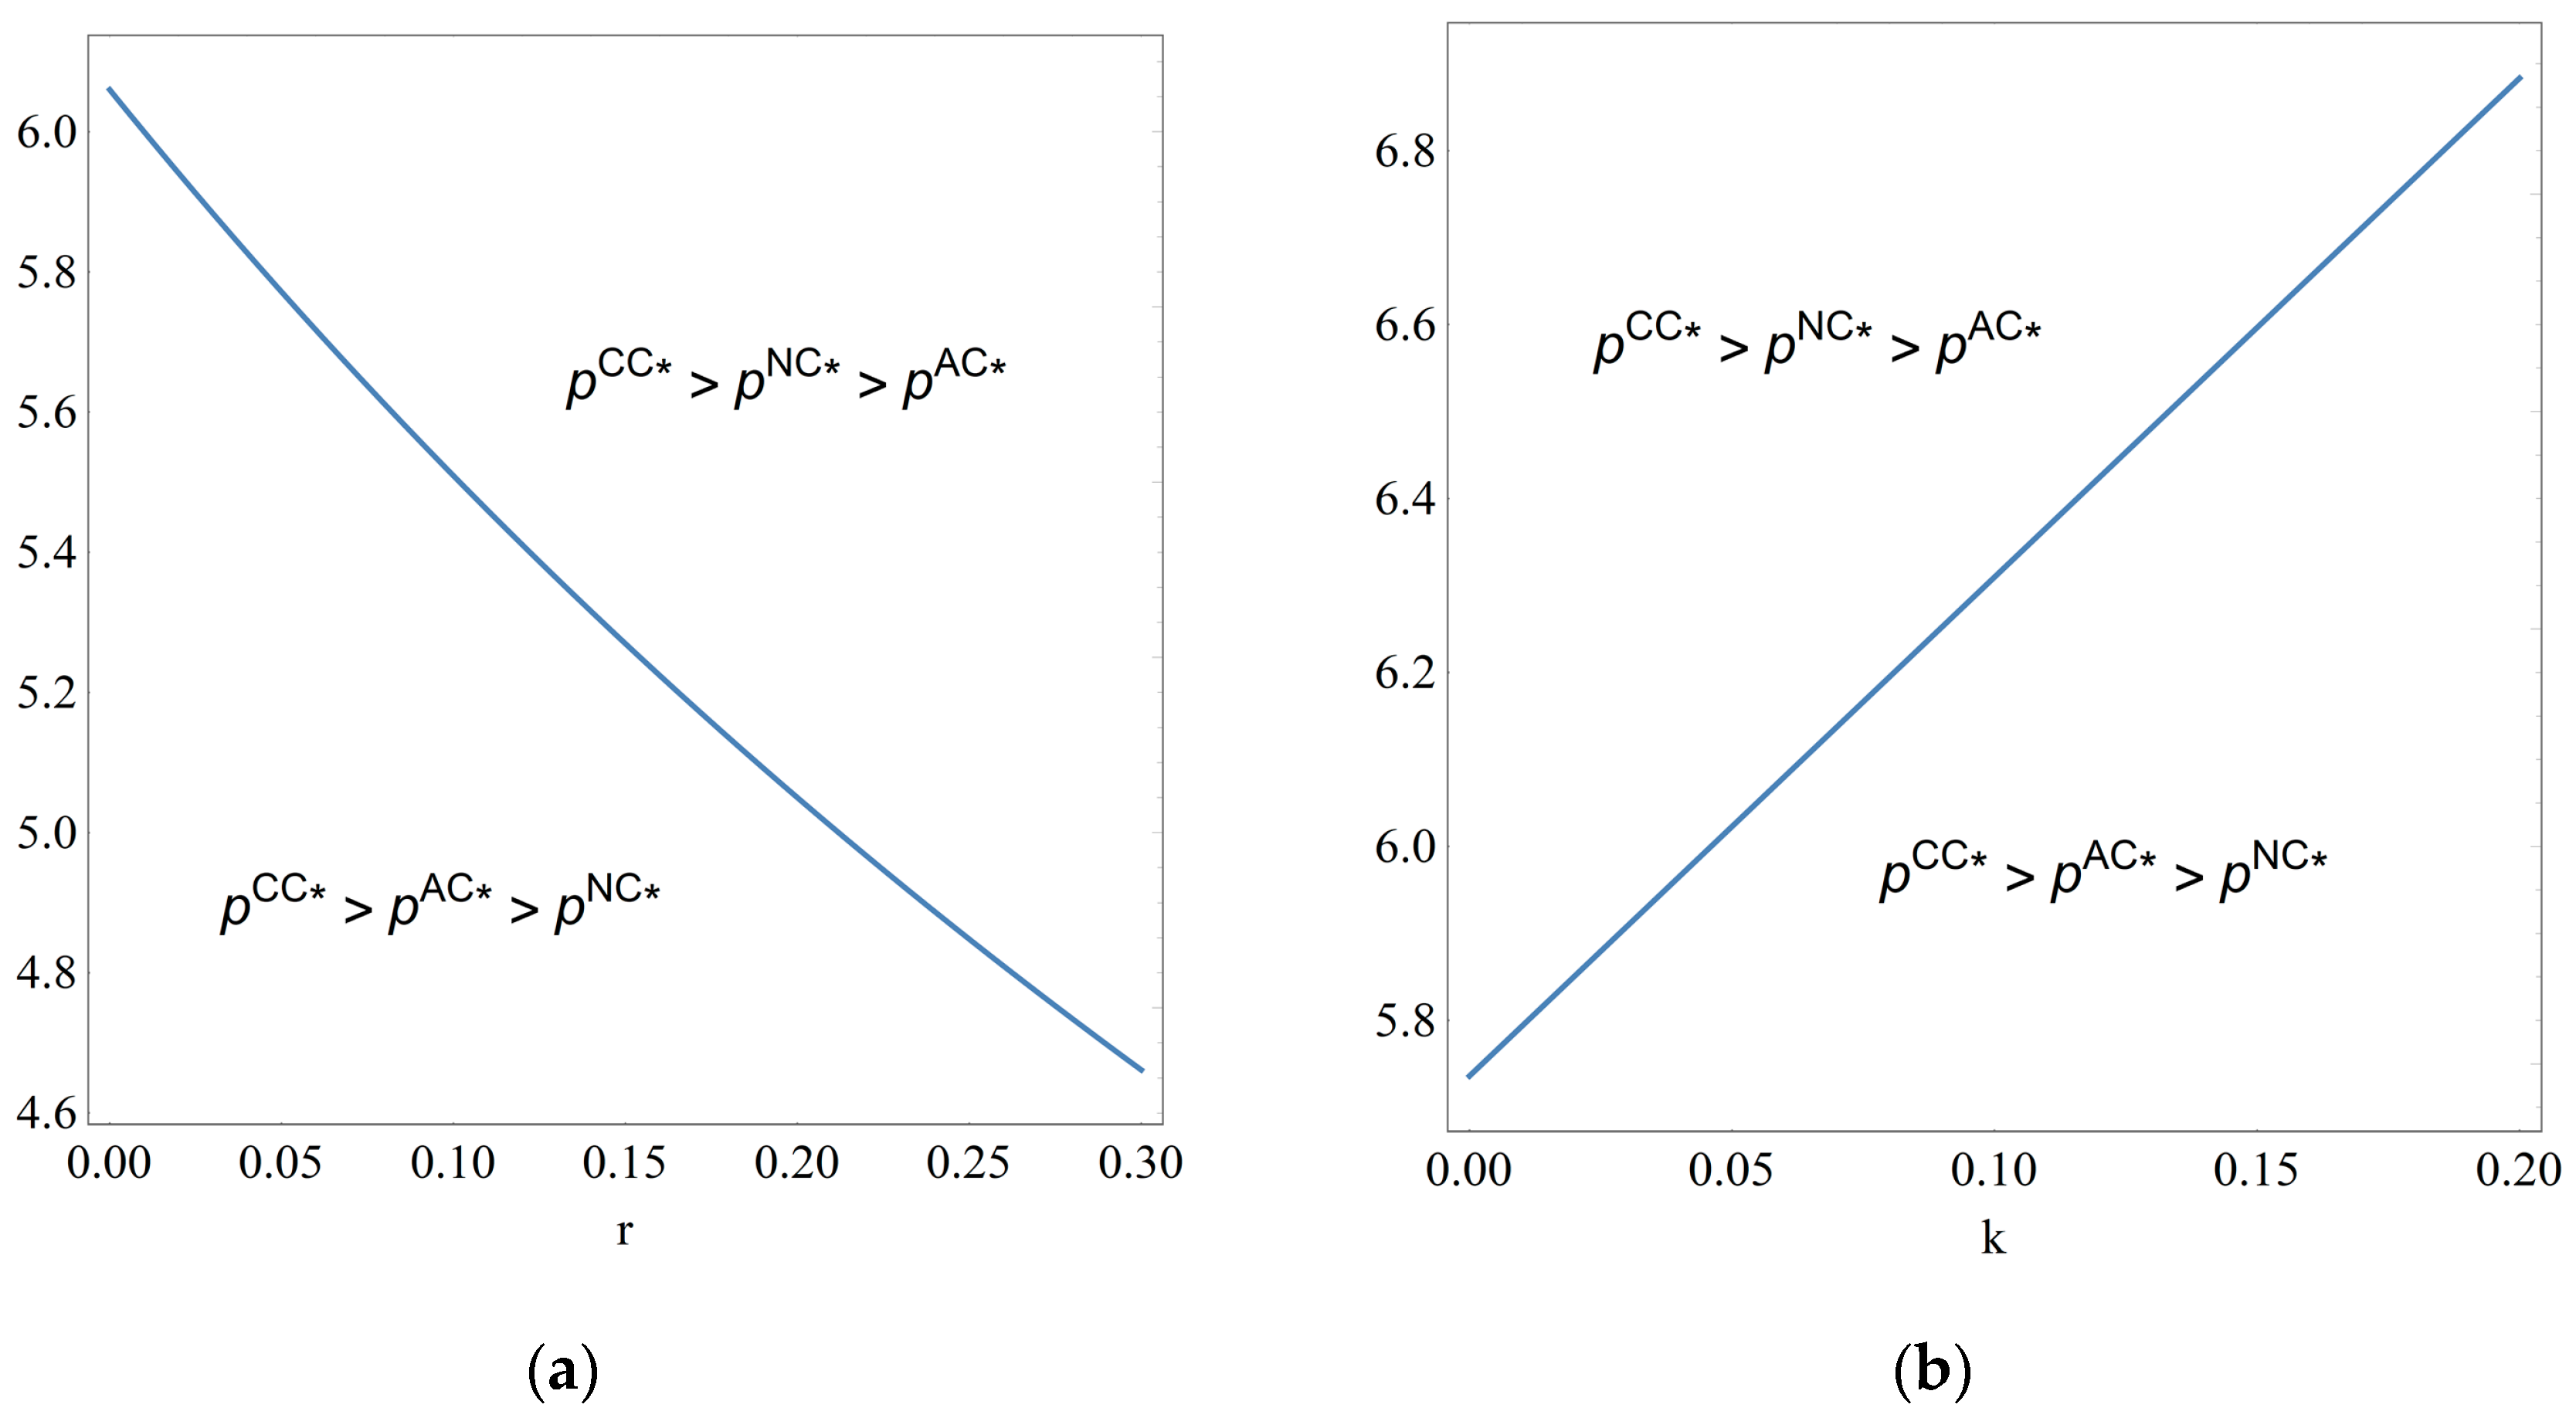
Figure 3b), because in more carbon-sensitive supply chains, the supplier is motivated to invest more in carbon reductions to gain market share. Consequently, the retailer may raise retail prices to safeguard its profit margins. Overall, in the early stage of the market, where carbon reduction technologies are not yet mature and consumer environmental awareness is not profound, the social welfare benefits of alliance cooperation become more significant. This reaffirms the social value of applying alliance cooperation in the early market. Similarly, the scope for this social value to be realized is also influenced by the financial market and the carbon market. A rise in interest rates makes enterprises more cautious about carbon reduction investments. Low-cost production accentuates the price benefits of alliance cooperation. Conversely, with the increase in carbon prices, enterprises increase their carbon reduction level. Affected by costs, the premium effect of low-carbon products becomes more pronounced, diminishing the price benefits of alliance cooperation. Therefore, the scope of price benefits from alliance cooperation expands with rising interest rates (
Figure 4a) and contracts as carbon prices increase (
Figure 4b).
5.3. The Impact of Cooperation on Market Demand
Proposition 6. Comparing the market demand, we have the following:
- (1)
.
- (2)
.
- (3)
When (or ), ; Otherwise, .
Proposition 6 illustrates the impact of vertical cooperation between upstream and downstream enterprises on market demand. This law is highly correlated with Proposition 4. In Proposition 4, we know that cooperation incentivizes the supplier to pay a higher carbon reduction level. The market demand is positively correlated with the carbon reduction level. Thus, the market demand increases in cooperation (
Figure 5). This indicates that consumers can accept a certain level of low-carbon premium in a supply chain with sensitivity to both price and carbon reduction. Despite the potential higher prices of low-carbon products (Proposition 5 and
Figure 3), carbon reduction actions will attract more consumers with low-carbon preferences. Similarly, regarding the impact of cooperation on market demand, in the early market stages with high carbon reduction difficulty or low carbon sensitivity, alliance cooperation will have a better effect on market expansion than cost cooperation (
Figure 5a). As the market develops in the mid-to-late stages, carbon reduction technologies continue to improve, the difficulty of carbon reduction decreases, and the increasing environmental awareness of consumers leads to a rise in the carbon sensitivity of the market, the degree of positive impact of cost cooperation on market share is dominant. (
Figure 5b). Because alliance cooperation can provide a more stable cooperation opportunity to help enterprises quickly gain a foothold in the early market. As the market matures, cost cooperation can more effectively leverage cost scale effects and pursue longer-term growth.
Similar to
Figure 2, the solid line in
Figure 6 represents the threshold for the transition of market dominance between different cooperation strategies. This threshold is also influenced by fluctuations in interest rates and carbon prices. However, due to price influences, changes in interest rates and carbon prices are no longer synchronized in terms of the impact of the cooperatives’ market dominance. The higher the interest rate, the broader the market advantage of alliance cooperation. The increase in carbon price enhances the market advantage of cost cooperation.
5.4. The Impact of Cooperation on Supply Chain Profit
Proposition 7. Comparing the profits of the whole supply chain, we have the following:
- (1)
.
- (2)
When (or ), ; Otherwise .
- (3)
.
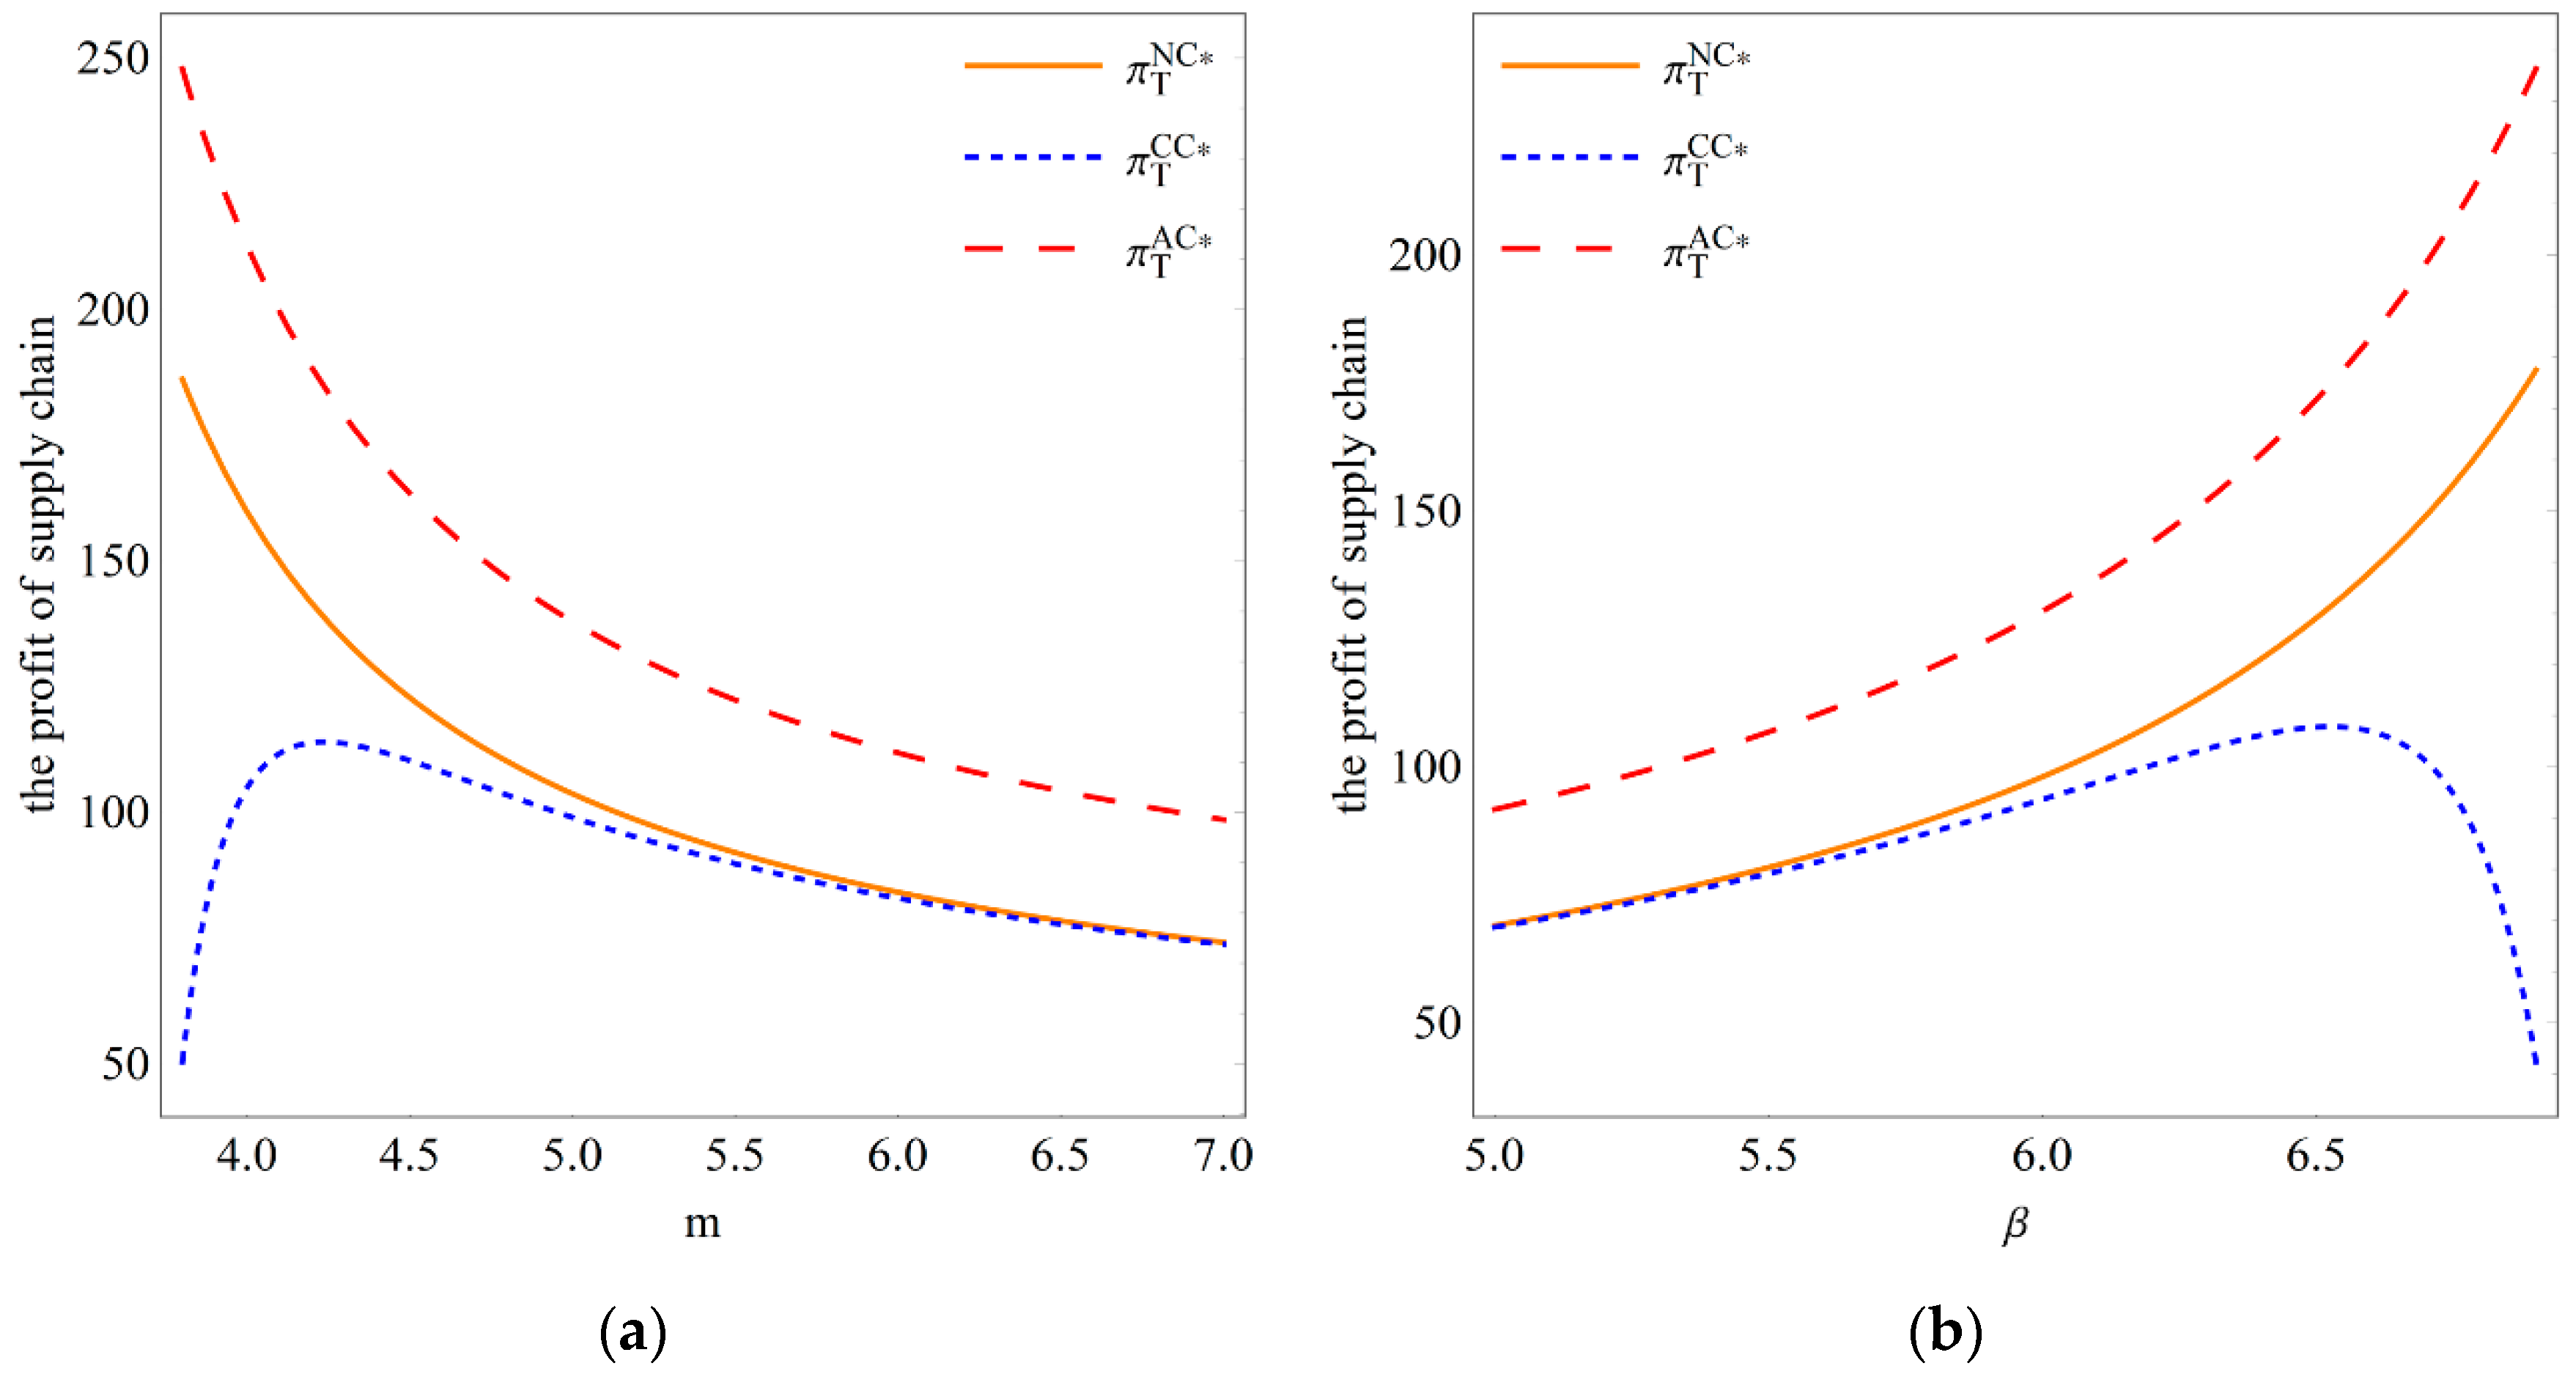
Proposition 7 suggests that alliance cooperation can alleviate the double marginal effect between supply chain players, thereby improving the overall performance of the supply chain. However, the positive impact of cost cooperation on supply chain performance is not apparent, and it may even weaken the profitability of the supply chain (
Figure 7). Combining Propositions 4 and 6 provides a more comprehensive understanding of the effectiveness of cost cooperation and alliance cooperation. While enterprises can collaborate to incentivize carbon reduction or increase market share, cost cooperation is unlikely to significantly impact supply chain performance. For those seeking to enhance supply chain performance, alliance cooperation is a more viable option.
6. Conclusions
Consumers’ low-carbon preference and carbon trading policy orientation require enterprises to start paying attention to carbon emission reduction. Simultaneously, cost cooperation and alliance cooperation, as two common ways of vertical cooperation within the supply chain, are considered to break the means of enterprises working alone in the process of carbon reduction. Based on the above facts, this paper takes a supply chain considering the interaction between consumer markets, financial markets, and carbon markets as the research object and constructs game models based on different cooperation backgrounds. We make detailed comparisons from the perspectives of low-carbon production, pricing, market demand, and economic benefits, analyzing the value and functional path of vertical cooperation, as well as the impact of different market fluctuations on the applicability of cooperation.
Our findings suggest that vertical cooperation influences supply chain member decision-making, market demand, and economic outcomes in distinct ways. Both cost cooperation and alliance cooperation can incentivize the supplier to engage in more carbon reduction actions and help enterprises capture a larger market share. However, only alliance cooperation can significantly enhance the economic benefits of the supply chain, as cost cooperation has certain limitations in this regard, and may even weaken the profitability of the supply chain. For consumers, cost cooperation results in higher product prices, while alliance cooperation makes products more cost-effective, offering the potential for consumers to purchase more environmentally friendly products at lower prices. Therefore, if supply chain players aim to accelerate the green transition or expand markets, both cost cooperation and alliance cooperation can be considered. However, for those seeking to improve the economic benefits of the supply chain, alliance cooperation is the preferred choice. Moreover, considering the suitability of vertical cooperation, in early markets with high carbo reduction difficulty or low market carbon sensitivity, alliance cooperation is preferable. It motivates the supplier to undertake more carbon reduction actions than cost cooperation, benefiting consumers with a lower retail price, and thereby achieving higher market demand. Conversely, in mid-to-late markets where the difficulty of carbon reduction is low or the carbon sensitivity of the consumer market is high, cost cooperation becomes a viable alternative. Lastly, the functioning of financial markets and carbon markets also influences the value of vertical cooperation. For instance, in terms of the value of carbon emission reduction, the advantages scope of cost cooperation will broaden with increased financing costs and carbon prices, while the effects of alliance cooperation will diminish.
Our research offers several managerial implications. Firstly, managers should recognize the positive role of vertical cooperation in enterprises’ commitment to environmental protection and market expansion. However, it is essential to emphasize that the selection of cooperative options should align with the effectiveness of the enterprise’s objectives and the developmental stage of the market. If the aim is to promote green transformation or expand market presence, alliance cooperation is preferred in the early market stage. As the market develops to the mid-to-late stages, enterprises may contemplate transitioning to cost cooperation. Yet, if the aim is to substantially enhance the economic efficiency of the supply chain, maintaining alliance cooperation remains crucial. Additionally, when implementing cooperation strategies, enterprise managers should vigilantly monitor fluctuations in financial markets and carbon markets, ensuring the dynamic adaptability of cooperation to create new opportunities in response to market changes.
In this study, the vertical cooperation mechanism of the supply chain is initially explored within the framework of the carbon cap-and-trade policy. However, there is ample room for expansion in this research. Firstly, uncertain demand can be considered. Enterprises may face the risk of bankruptcy due to insufficient demand or lose market share due to inadequate inventory. This uncertainty could make the partnership more challenging. Additionally, competition often accompanies collaboration, and future research can be extended to more intricate supply chain environments. For instance, the cross-operation of horizontal competition and vertical cooperation can be analyzed in a scenario where multiple suppliers or retailers coexist.


