Article

Mechanical and Surface Geometric Properties of Reinforcing Bars and Their Significance for the Development of Near-Surface Notch Stresses

by
Stefan Rappl
1,*,
Muhammed Zubair Shahul Hameed
2,
Christian Krempaszky
2 and
Kai Osterminski
1
1
TUM School of Engineering and Design, Department of Materials Engineering, Centre for Building Materials, Technical University of Munich, 81245 Munich, Germany
2
TUM School of Engineering and Design, Department of Materials Engineering, Institute of Materials Science, Technical University of Munich, 85748 Garching, Germany
*
Author to whom correspondence should be addressed.
Mathematics 2023, 11(8), 1910; https://doi.org/10.3390/math11081910
Submission received: 7 March 2023 / Revised: 15 April 2023 / Accepted: 16 April 2023 / Published: 18 April 2023
(This article belongs to the Special Issue Computational Modelling and Simulation of Building Materials)

Abstract

:
Due to the production process, reinforcing steel bars possess an inhomogeneous microstructure associated with different material properties over the cross-section (e.g., hardness, ductility or strength). Furthermore, the surface required for the bond has a negative effect on the fatigue behavior. The first investigations were carried out in the 1970s and detected the fillet radius r as a key influencing factor. Until now, few studies had been carried out that investigate the quantification of the surface properties on the fatigue behavior, and none of them compared these properties with the local strengths of the material. The current paper presents the first results of a reverse-engineered reinforcing steel bar based on a previously performed laser scanning process. The rebar models were used to calculate the notch stress factors for different diameters based on von Mises stresses taken from FEM simulations. The notch stress factors showed a functional relationship with the fillet radius, which was already shown in the literature. Further experimental investigations on the fatigue and tensile behavior of the structural components in the investigated Tempcore® rebars were carried out on microstructure specimens eroded by WEDM. The results of the tensile tests were used to derive a yield and tensile strength distribution in the cross-section. Depending on the microstructure, a yield strength between 415 N/mm2 (ferrite/pearlite core) and 690 N/mm2 (tempered martensite surface) was found. The acting notch stresses show a logarithmic dependency of the fillet radius, but do not reach the material strength of the surface.

1. Introduction

1.1. Motivation

Many solid structures (e.g., wind turbines, bridges) are exposed to a high number of dynamic loads throughout their service lifetime. These buildings are mainly pre-stressed reinforced concrete structures, which involve the materials concrete, reinforcing steel and pre-stressing steel. As well as being solid structures, the materials must have sufficient resistance against fatigue. Knowledge gained from research projects and the material testing (qualification tests) of reinforcing bars (rebars) shows that fatigue test results in particular are accompanied by large scatter. Understanding the main influencing factors on the fatigue test results and the source of the scatter is necessary for the adaption and development of new rebars with higher/more reliable fatigue resistance.
In a German Research Foundation (DFG) research project, the production process of rebars and its effect on fatigue was investigated. The thermomechanical point of view and its consequence on the residual stress distribution was already published elsewhere (for further information, see Hameed et al. [1] and Robl et al. [2]). This study focuses specifically on the surface topography and the mechanical behavior of the microstructure. The motivation for the work presented in the current paper was to identify the reason why rebars suffer millions of load cycles in uniaxial fatigue tests despite the fact that notch stresses on the surface surpass the nominal yield strength or nominal tensile strength, respectively. The behavior in the uniaxial fatigue test represents a fatigue behavior at the limit of the performance of the reinforcing steel, and thus differs from that of a reinforcing steel set in concrete. In the uniaxial fatigue test, the force application is concentrated at both ends in the clamping area. In contrast, the load of a reinforced concrete component is transmitted along the anchorage length. More details can be found, e.g., in [3]. As far as the authors are aware, there are no reports of the fatigue failure of reinforcement in a reinforced concrete structure, since it is always the concrete that fails first.

1.2. Production and Properties of Reinforcing Steel Bars

Modern high-ductile reinforcing steel bars are produced by hot rolling and heat treatment from the rolling heat—a production process also known as Tempcore®. According to [4,5], this process produces a structural setup of a ferrite/pearlite core with a surface layer of up to a few millimeters of tempered martensite. This structural setup allows for a yield strength of Re ≥ 500 N/mm2 in combination with a uniform elongation of significantly more than Agt ≥ 5.0%. The uniform elongation can be led back to the ductile ferrite/pearlite core. The increase in strength is mainly caused by the tempered martensite. Fernandez et al. [6] investigated the strength of each structural component, coming to the conclusion that the tempered martensite layer possesses nearly twice the strength (Rp0.2 = 806 N/mm2) of the ferrite/pearlite core (Re = 435 N/mm2). These results were obtained by testing several turned rebars in a uniaxial tensile test, allowing for a reverse calculation of the strength of each turned zone. It might be added that the single results for the structural components given by Fernandez et al. cannot be recalculated using their given formulae.

1.3. Fatigue Behavior of Reinforcing Steel Bars

According to [7], the fatigue failure of reinforcing steel bars under dynamic loading can be divided into crack initiation and crack propagation. The cracking starts at the local dislocations on the surface, which are typical for plastic deformations. These dislocation movements are mainly observed at notches (e.g., corrosion scars) and cross-section transitions (e.g., transversal ribs, process defects) on the reinforcing steel surface. As a result, fatigue slip bands are formed in the material near the surface. A distinction must be made between intrusions (micro-notches) and extrusions (micro-elevations) [8]. These are oriented in the direction of the maximum shear stress (45° angle to the main stress) and represent crack nuclei after a sufficiently high number of load cycles. As soon as the crack length reaches approximately grain size, microcracks originate [9]. These reorient after a few micrometers or a few grain diameters and run perpendicular to the direction of stress. If a certain crack length is reached, they are called macrocracks. Depending on the material properties or the stress type/level, these propagate in the cross-section perpendicular to the direction of stress (stable crack growth). When a critical crack length is exceeded, the crack growth rate increases significantly (unstable crack growth). If the stresses in the residual cross-section rise above the notch tensile strength, a forced fracture takes place.
The notching effect has a significant influence on the fatigue behavior of materials. As a result of the notch, the flow of the tensile trajectories within the specimen is disturbed. The stress trajectories are concentrated in these areas and lead to an increase in stress at the base of the notch [10]. Comparing ribbed with smooth rebars, Martin and Schießl [11] detected a decrease in the fatigue strength of ribbed rebars by approx. 60%. Further research showed that the design and the size of the rib geometry are decisive [12,13,14,15,16]. The transition zone between the rib valley and rib incline showed the greatest influence on fatigue. The fillet radius r, which defines the sharpness of the notch, was found to be the key influencing factor. The rib height a, the angle of the rib slope α and the width of the rib top bk have an effect on the fatigue strength as these geometrical parameters define the volume of the rib into which stress trajectories can be diverted. All of these geometrical parameters have to be measured in the direction of the tensile stress trajectories (rebar length axis). The following Figure 1 illustrates the geometrical parameters mentioned above.
With smaller fillets, the notch stress increases significantly [9,13]. These high notch stresses favor the fatigue crack initiation as a result of the stress concentration in these regions. Experiments confirm that fatigue failures usually start in these regions if no surface defects, such as pitting corrosion, exist [19,20]. As a result of the force equilibrium, high notch stresses on the surface produce lightly lower stresses in the core of the rebar, below the nominal stress applied to the specimen [9].
Jhamb [19] and MacGregor et al. [21] introduced the stress concentration factor kT (−) for reinforcing steels, as per Equation (1):
k T = σ max σ nom
where σmax (N/mm2) is the maximum stress at the notch and σnom (N/mm2) is the nominal stress in the cross-section. Assuming elastic behavior, kT depends mainly on the geometry of the notch and the type of loading (tension, compression, bending or torsion) [9]. Jhamb [19] investigated, using a two-dimensional finite element method (FEM), the influence of several rib geometry parameters on kT. He concluded that kT mainly decreases with increasing fillet radius r or r/a-ratio. This is consistent with the above-mentioned studies. Schießl [13] introduced an empirical equation based on the FEM results of Jhamb [19], as in Equation (2):
k T = 1 + 0.096 0.12 · ln r · b k + 2 · a · cot α · 3 + tan α  
where r (mm) is the fillet radius of the notch, bk (mm) is the width of the rib top, a (mm) is the rib height and α (°) is the angle of the rib slope. As mentioned above, all of these geometrical parameters have to be measured in the direction of the tensile stress trajectories. It should be added that Equation (2) is not consistent according to the units. In [22], the notch stress factors were calculated using Equation (2) in a one-dimensional way. The values lie within a range of 1.38 to 2.11. In the outlook, the author [22] emphasized the need for a three-dimensional investigation of kT using an FEM, which has been carried out as presented in the following section.

2. Materials and Methods

2.1. Program

The production process of rebars has a major influence on the fatigue behavior (neglecting the experimental influencing variables, e.g., load regime). On the one hand, the impact (e.g., notch stresses) is mainly influenced by the rib geometry. On the other hand, the material’s resistance is also affected. Due to the cooling and tempering process, different microstructures with variable material properties (e.g., strength, ductility) are generated.
In a first step, the geometry parameters of the transversal ribs were derived by scanning the surface of the rebars. Based thereon, a rebar geometry was designed, where FE simulations were carried out. In addition, the material’s resistance was derived by tensile and fatigue tests of the microstructure. Combining these tensile test results with the hardness values already published in Hameed et al. [1] over the cross-section, a strength profile was derived and compared with the simulated notch stresses.
The investigations in this study were carried out on reinforcing steel bars with grade B500B (Tempcore®) containing two transversal rib rows [17,23].

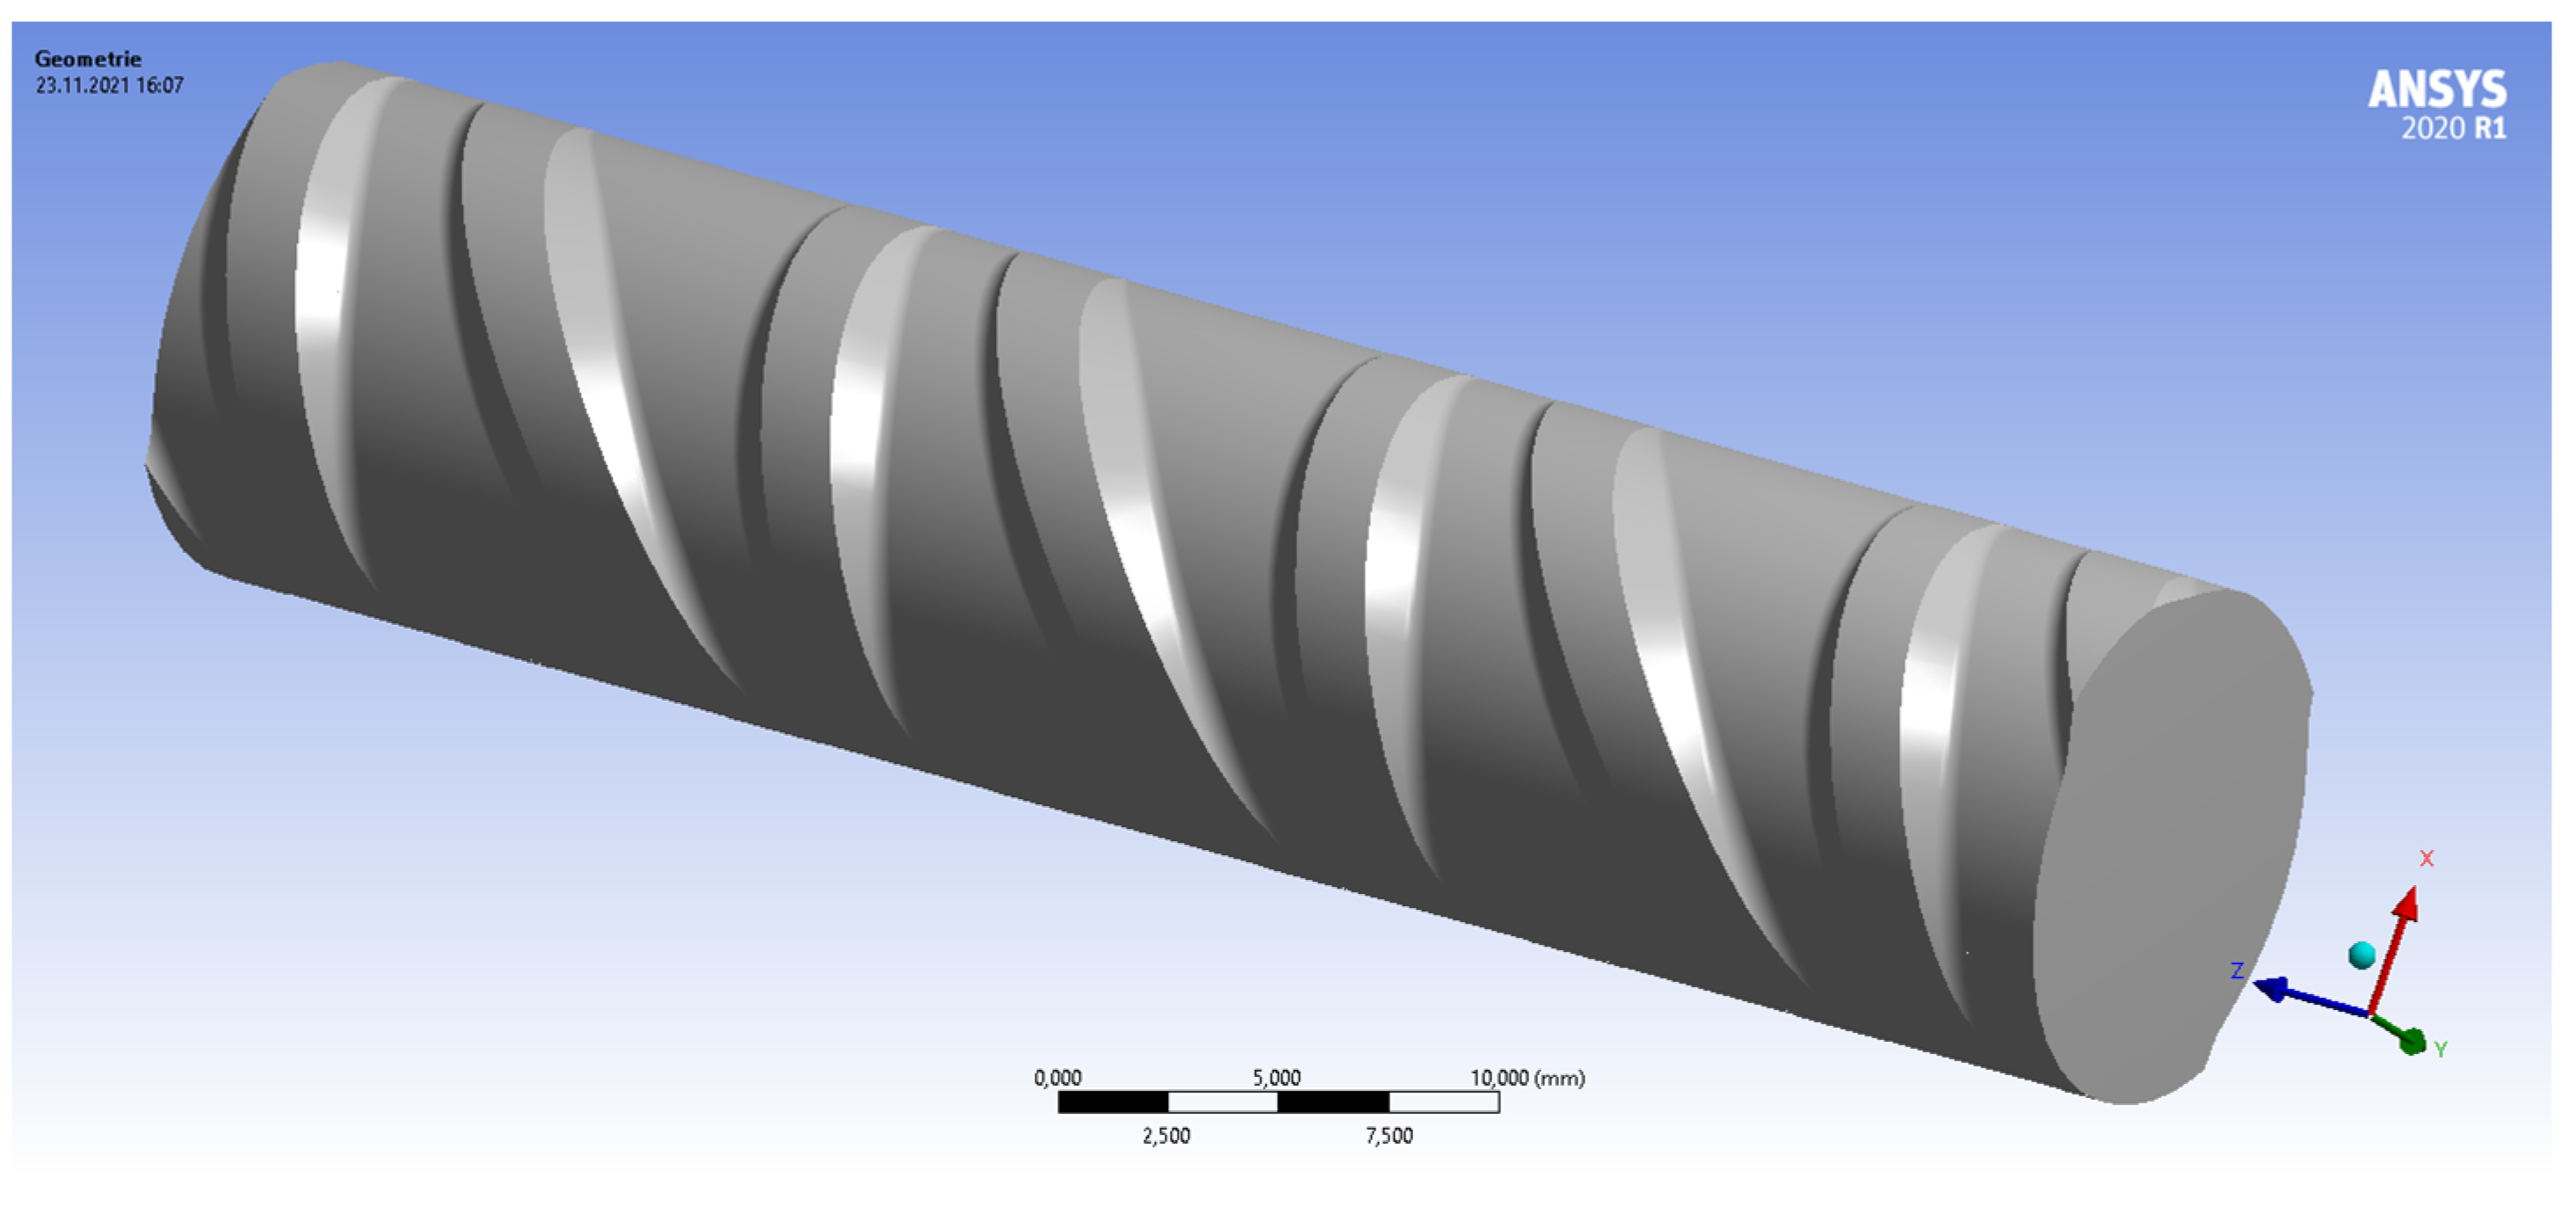
2.2. Geometry Modeling

In the first step, three specimens with a nominal diameter of 12, 16 and 28 mm were scanned with a laser-based line scan (LLS) system [24]. The laser moves in an axial direction, detecting surface coordinates in a defined measuring point distance, and repeats the procedure after rotating the specimen with the given angle. The edge length of the grid lay between 0.01608 and 0.01885 mm depending on the rebar diameter. However, for this study, the supporting points according DIN EN ISO 15630-1 [18] were extracted from the scan files. As a result, six line scans per specimen representing ¼, ½ and ¾ points for the transversal ribs were processed.
Based on these line scans, it was possible to derive the relevant geometry parameters of the transversal rib (rib height a, width of the rib top bk, rib spacing c, angle of the rib slope α, rib inclination angle β and the fillet radius r at the foot point). This was carried out for three exemplary transversal ribs and for the fillet radius as well as the rib slope on both sides of each transversal rib. Thereon, a reverse-engineered rebar was modeled using AutoCAD 2019. For the geometry parameters, which mainly define the rib volume, mean values were calculated. Since the fillet radius r has the greatest influence on the fatigue behavior [13,25], no mean values were calculated in order to carry out more detailed investigations in a parameter study. The length of the reengineered model was chosen depending on the rib spacing c in order to avoid boundary effects and to guarantee a homogeneous stress state in the middle of the model. Table 1 gives an overview of the different lengths of the specimens. Longitudinal ribs were neglected due to their minor influence on notch stresses. Notches due to the binding of transversal into longitudinal ribs are not permitted due to the standard [17] and were also not observed in the LLS data. Therefore, the transversal ribs phase out towards the non-existing longitudinal ribs. Figure 2 shows the geometry of a specimen with a nominal diameter of 12 mm.

2.3. Tensile and Fatigue Tests

The main investigations of tensile and fatigue tests on the microstructures of the rebar were carried out on cylindrical specimens. These specimens were eroded from different depths of the rebar using wire-cut electrical discharge machining (WEDM). WEDM enables cutting without applying mechanical or thermal energy to the material. First, a starting hole was drilled into the center of the rebar. The wire was inserted and the specimen was completely submerged in a dielectric fluid [26,27]. In the WEDM process, the specimen serves as an anode and the wire as a cathode [26]. Thus, a stable eroding process with stable temperatures was guaranteed. Further information about the process can be found in [27]. The WEDM allowed for the extraction of specific structural setup specimens with low to no impact on their structural setup. Admittedly, the extraction produced a change in the residual stress setup of the microstructure specimens. The authors consider the impact on the results of this investigation to be negligible.
A total of eight microstructure specimens were taken from two rebar specimens. The microstructure specimens were eroded at three different locations in the cross-section of the rebar (Figure 3): at a diameter of 7 mm in the ferrite/pearlite core, at 22 mm in the tempered martensite surface and in between both microstructures at the 15 mm transition zone. Due to the required dimensions, this could only be carried out on the specimens with a nominal diameter of 28 mm. All specimens had a length of 200 mm. Table 2 summarizes all laboratory experiments.
The tensile tests were carried out in a ZWICK Roell Z600. For the microstructure specimens, a maximum force of approximately 10 kN was expected. Therefore, a 10 kN load cell (class 0.5 according to [28]) was used to increase the accuracy in this force range. Figure 4 shows the test setup. The specimen was fixed at the top by a wedge coupling system and at the bottom by clamping jaws. The strain was recorded using a “videoXtens” optical extensometer (class 0.5 according to [29]) by ZWICK Roell. Focusing the optical extensometer on the specimen surface only allows for a measurement of the specimen elongation until its failure and without measurement artifacts resulting from the clamping at its top bearing.
The fatigue behavior of the microstructure specimens was investigated in a uniaxial fatigue test. A resonance pulsator 10 HPF 422 from Alfred J. Amsler & Co. (retrofitted) was used. The specimens were again fixed with a wedge coupling system on the upper and lower side. Figure 5 shows the fatigue test setup. The test parameters were selected according to the standards DIN 488-1 [23] and DIN EN ISO 15630-1 [18]. Therefore, the upper stress was set to σo = 300 N/mm2 (60% of the nominal yield strength of the whole rebar) in a first test series. In the following second test series, the upper stress limit was increased to σo = 400 N/mm2 for an adaption to the fatigue results of the first series. The free length was 140 mm for all tests. The frequency in all tests was between 70 and 81 Hz depending on the actuated mass of the specimen and thus below the limit of 200 Hz defined in the standard [18,23]. Two termination criteria were a priori given: runouts after reaching 10 million load cycles or a failure of the specimen in the free length. If the failure originated in the clamping area (up to a 20 mm distance from clamping), the specimen was tested again with a shorter length.
Furthermore, this paper uses the results of hardness measurements on cross-sections of rebars from the same melt and production process. The generation and discussion of these results can be found in Hameed et al. [1].

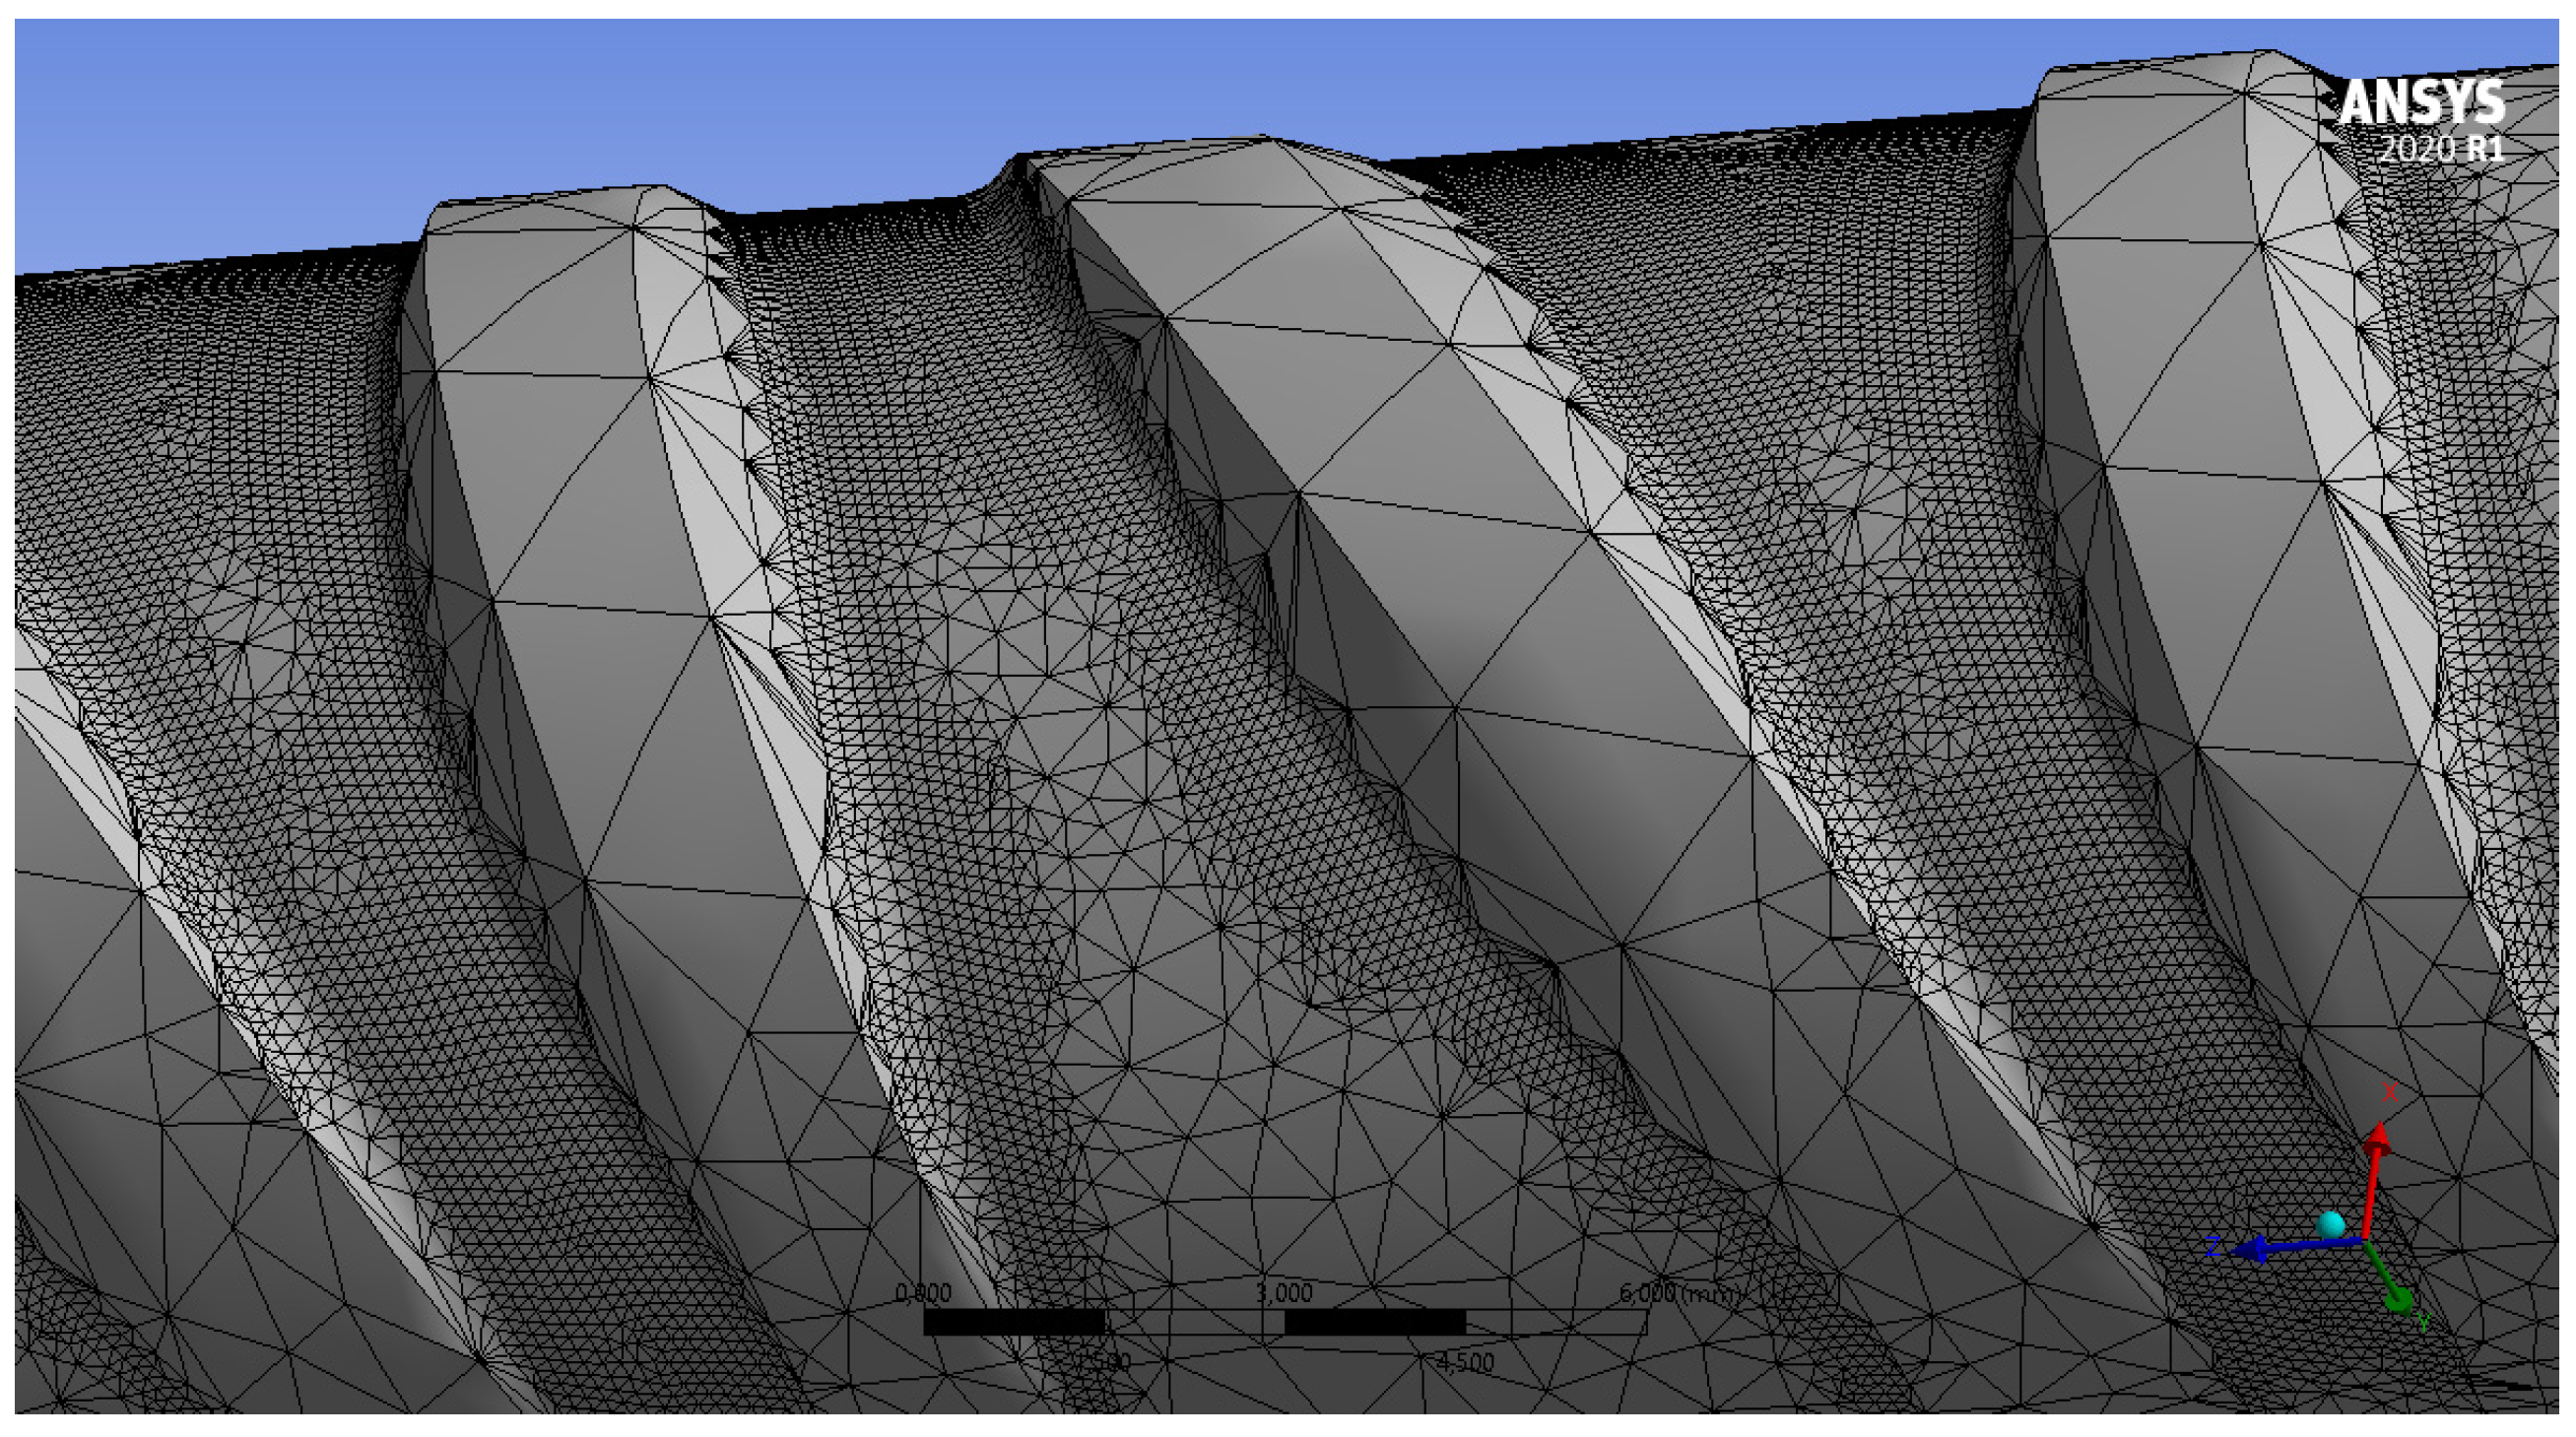
2.4. Finite Element Modeling

In the next step, the geometry model was implemented into ANSYS 2020 R1 Workbench. For each diameter, six geometry models were designed. All geometry parameters were kept constant except the fillet radius (Section 2.2). The radii were sorted by size. The first geometry model was designed using minimum values of r for alternating and parallel ribs. With further models, the radii were increased. No further combinations mixing smaller and larger radii on different sides of the model were investigated because an influence could be neglected (Section 3.4). All 3D modeling was conducted with the ANSYS DesignModeler. Table 3 shows the material parameters of B500B implemented in the simulations. Although tensile strength and yield strength were implemented, the material model selected was linear elastic, allowing for a simulation beyond yield and tensile strength. Thus, a comparison between the local linear elastic stress and the actual material strength (determined by tensile tests on microstructure specimens, Section 2.3) was carried out.
In the next step, an adaptive mesh was generated using tetrahedral elements. These consist of ten nodes per element and have three displacement degrees of freedom. The maximum element size in the fillet area was set first to 0.13 mm in order to generate a finer mesh in these areas. On the end surfaces, a force and a fixed support were applied. At the fixed surface, a homogeneous Dirichlet boundary condition for all three components (x = 0, y = 0, z = 0) of the nodal displacements were prescribed. On the surface where the external loading was prescribed, a distributed load was applied in the z-direction to cause tensile stresses in the nominal cross-section of σnom = 300 N/mm2. A diameter d = 12 mm was loaded with 33.93 kN, d = 16 mm with 60.32 kN and d = 28 mm with 184.73 kN. Since this work is focused primarily on the development and distribution of notch stresses, the maximum stresses were selected for convergence. Thus, the notch stress sensitive fillet radius [13,19,20] could be simulated more accurately. Since this is a CAE model with a smooth surface, no deviations of the stress distribution of, for instance, the rib tops from the literature were expected. The convergence criterion was set at 1%. The von Mises stresses σv,M were used to evaluate the notch stresses. The former serve as a prediction for the plastic flow of a ductile material (σv,M > Re or σv,M > Rp0.2) due to a triaxial stress state. Since, in particular, the boundary condition of the fixed support leads to unrealistically high stress values, only the stress distribution in the center of the specimen was used for the evaluation. An example of a final mesh of the alternating rib side is given in Figure 6.

3. Results

3.1. Geometry Modeling

The results of the geometry parameters measured from the LLS data are given in Table 4. The values of the top five rows are mean values calculated from three transversal rib measurements at their maximum height (at center of the transversal ribs). Due to the significant influence of the fillet radius r on the notch stress, a bigger number of six single values is given in Table 4. They were measured at the same position (same scan file) as the aforementioned parameters (three before and three after the transversal rib, with respect to the scanning direction).
The parameters were validated according to the standard [17]. All parameters were within the scope of the standard, except bk and c of the specimen with a diameter of 16 mm. The values are 3% (c) or 8% (bk) over the given guideline values. The values of r possess a large range between 0.351 mm and 1.324 mm for diameter 12 mm of parallel rib side. The same finding can be observed for the other rib sides of the different diameters investigated. Despite its importance for the fatigue of rebars, there are no specifications from the standards for the fillet radius r. However, due to their localized impact in relation to the entire specimen dimension, a mutual influence of the fillet radius on the other specimen side was not assumed.

3.2. Tensile Tests

Figure 7 and Table 5 show the results of the tensile tests on microstructure specimens.
The results of the core specimens show very small deviations according to yield and tensile strength. The graphs are almost congruent, with only a few variations of Agt visible. Similar results were detected in the transition zone. The observed stress is slightly higher than those of the core specimens. The surface specimens, however, show a significantly higher tensile strength than the core and transition zone specimens. A decrease in the strain can also be detected. The core and transition zone specimens possess a distinct yield stress, unlike the surface. One specimen from every zone was neglected (not depicted) due to a failure in the clamping area.
Table 5 additionally shows the results of tensile tests on five rebars with a nominal diameter of 28 mm of the same melt from which the microstructure specimens were taken.
In a next step, the plausibility of the measured yield and tensile strength were checked. The test specimens of the present investigation were from the same manufacturer and the same melt as the specimens from Hameed et al. [1]. In this study, a microstructure analysis and a hardness profile were carried out for the same rebar. Until a depth of 3 mm (≈79% of the normalized radius) under the rebar surface, a tempered martensite microstructure was observed, whereas the core consisted of a ferrite and pearlite microstructure. In the small transition zone, a bainite microstructure was found. The results of the microstructure are in good agreement with the structural setup of Tempcore® given in the literature [4]. The Vickers hardness profile [1] shows values in the core of approx. 180 HV0.5. Between 30% and 75% of the normalized radius, two different linear increases were detected (hollow squares in Figure 8).
In the surface area (≥75% of the normalized radius), almost constant hardness values between 280 and 310 HV0.5 could be observed. According to DIN EN ISO 18265 [30], a positive correlation between hardness and tensile strength can be derived for uniform and identical steel microstructures. As mentioned above, Tempcore® rebars possess several microstructural setups. Nevertheless, aside from this limit, the general method of correlation is adapted as a hypothesis, allowing an estimation of yield and tensile strength distribution based on the hardness profile. Furthermore, the results of the aforementioned tensile tests on different microstructure specimens were used. The correlation between hardness and tensile strength in the core (ferrite/pearlite) and the surface region (tempered martensite) were calculated with a constant conversion factor (valid for zones with constant hardness). Thus, the core region is labeled zone I and the surface region zone IV (Figure 8). Table 6 shows the results of the regression analysis for the modeled factors. In addition, the conversion factors for the transition zones II and III (microstructure changes from ferrite/pearlite to bainite and from bainite to tempered martensite) were modeled as two linear functions with different gradients according to the development of hardness. Figure 8 depicts the different zones as well as the results of the tensile strength profile modeled on the results of hardness analysis [1]. A comparable method was applied for the determination of the yield strength distribution in the cross-section. Here, the inverse yield ratio Rm/Re (or Rm/Rp0.2) calculated from the tensile test results was used for the derivation of the conversion factors from tensile strength to yield strength (last column in Table 6). The results are added to Figure 8. Furthermore, the yield strength and tensile strength results taken from Fernandez et al. [6] are given.
In contrast to [6], a slight increase in strength with increasing distance from the bar axis was already observed in the core area for both the test results and the calculated strengths. At the transition from zone III into zone IV, a sudden increase in hardness and strength can be seen. This is attributed to the tempered martensite microstructure that develops in the surface region as a result of rapid cooling and local heat treating [1].
The yield ratio indicates the mathematical relationship between tensile strength and yield strength. Due to the large deviation in the yield ratio between ferrite/perlite (core) and tempered martensite (surface) (Figure 7), a jump in conversion was assumed. For the first three zones, there is good agreement with the values from the work in [6] (Figure 8). In zone IV, clear deviations can be found.
Further calculation using the results of tensile tests on the whole rebars were executed. Herein, an integration of the yield and tensile strength curves over the cross-section of the rebar allowed for the calculation of the yield and tensile force (Figure 8). For this purpose, the results of the conversions of yield and tensile strength were distributed via the rotational symmetry assuming frustum. This assumption was applied to all converted and measured single values. By dividing the obtained forces with the nominal cross-sectional area of 615.7 mm2 for diameter 28 mm, the calculated yield strength Re,calc and tensile strength Rm,calc of the rebar could be derived. The tensile strength was calculated to Rm,calc = 720 N/mm2, which was only 2.6% larger than the mean value derived from five tensile tests on rebars (diameter 28 mm). The calculated yield strength of Re,calc = 571 N/mm2 was slightly below (0.5%) the test value Re = 574 N/mm2. With respect to the accuracy involved in testing, these results show very good agreement between the yield and tensile strength distribution and the results from the rebar specimens. Thus, the strength distributions can be used in further interpretation of the results.

3.3. Fatigue Tests

Two test series were executed. First, the load regime applied to rebars was processed. The starting stress level was set to a relatively high value of 250 N/mm2 at an upper stress level of 300 N/mm2. The runout criterion was further set to 107 load cycles in order to produce valid failures in the free length. Due to the outcome of the runouts alone, the stress level was further increased to 275 N/mm2, yielding to runouts as well. As a further increase in stress range would have led to a loss of integrity in the clamping, the upper stress level was increased to 400 N/mm2 with a stress range of 375 N/mm2. As a result, failures in the free length for a core (NF = 687,951 load cycles) and a transition zone specimen (NF = 582,425 load cycles) were achieved. The surface specimen again reached 10 million load cycles. The upper stress level of 400 N/mm2 represents a load capacity of approx. 60% of Rp0.2 in the surface specimen and additionally allows the core specimen to be fatigue-tested in the elastic domain of its stress–strain curve. Table 7 shows the load capacity of the investigated specimens in both load regimes.
Only a deviation from the testing regime, which is normally used for reinforcing steels, led to a fatigue failure of the core and transition zone specimens. Here, the high load capacity of these specimens of approx. 0.9·Re led to overloading. Furthermore, the surface specimen reached 10 million load cycles again without any failure, most likely due to the lower load capacity. Although only three specimens per zone were tested, it can be summarized that no failures occurred under the test conditions of DIN 488-1 [23] or DIN EN ISO 15630-1 [18], respectively. The fatigue results of the smoothly eroded microstructure specimens show once again the importance of the surface geometry as a key factor influencing the rebar fatigue behavior.

3.4. Finite Element Modeling

Figure 9 illustrates the notch stresses of specimen 12 with the smallest fillet radii. The highest stress concentrations were developed on the surface of the fillet areas. For this specimen, the local stresses at the fillet were approx. 55% higher than in the nearby rib valleys. The maximum stresses simulated by FEM were localized in the center of the transversal ribs, where the rib height reached its maximum. The rib itself showed much lower stresses. This is in good agreement with the results in the literature [19,25].
In the next step, the maximum notch stress factors were calculated from FEM results by implementing the von Mises stresses as σmax and σnom = 300 N/mm2 in Equation (1). A depiction of these results can be found in Figure 10. Therein, the notch stress factors kT are plotted over the local fillet radius r.
Two trends can be observed:
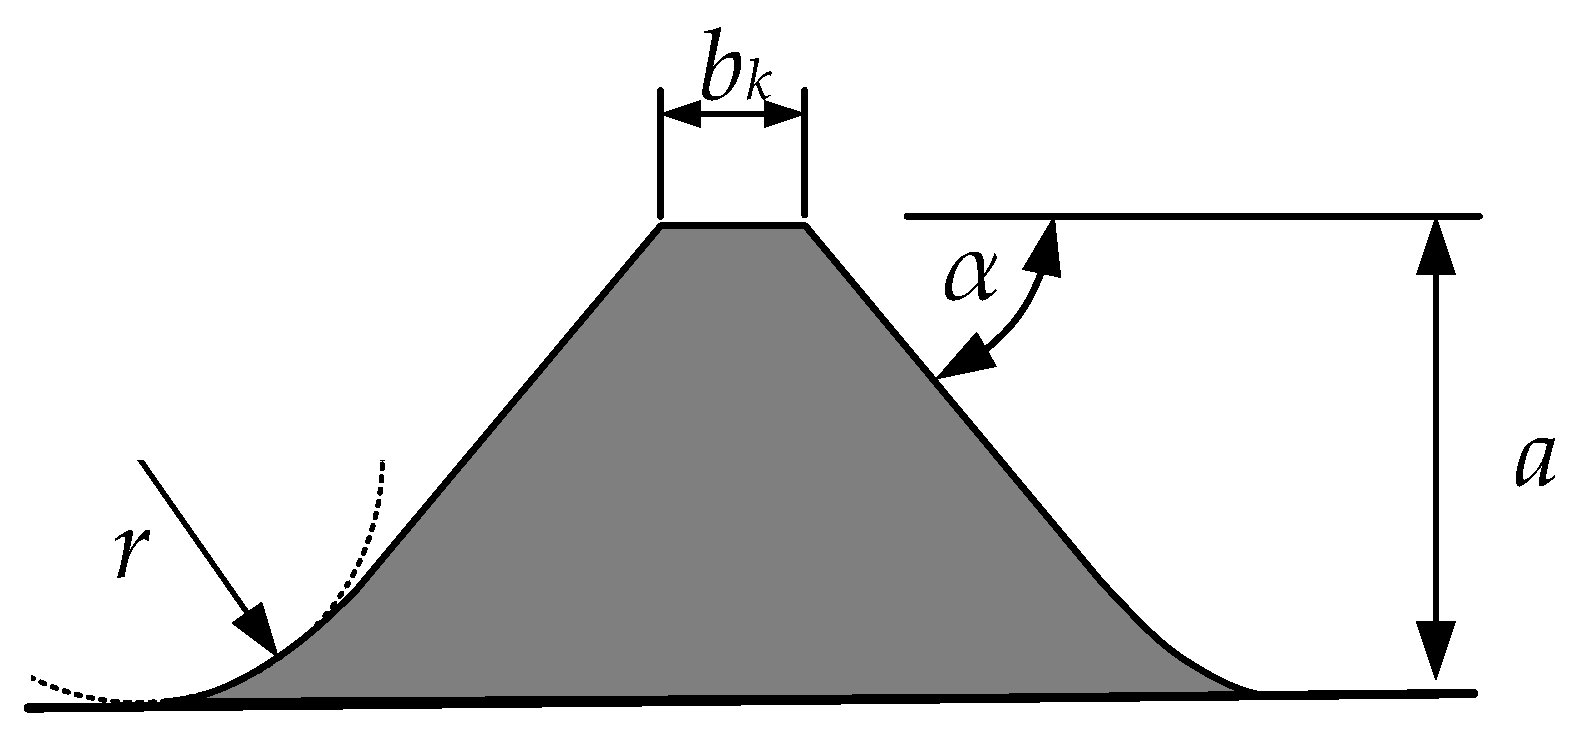
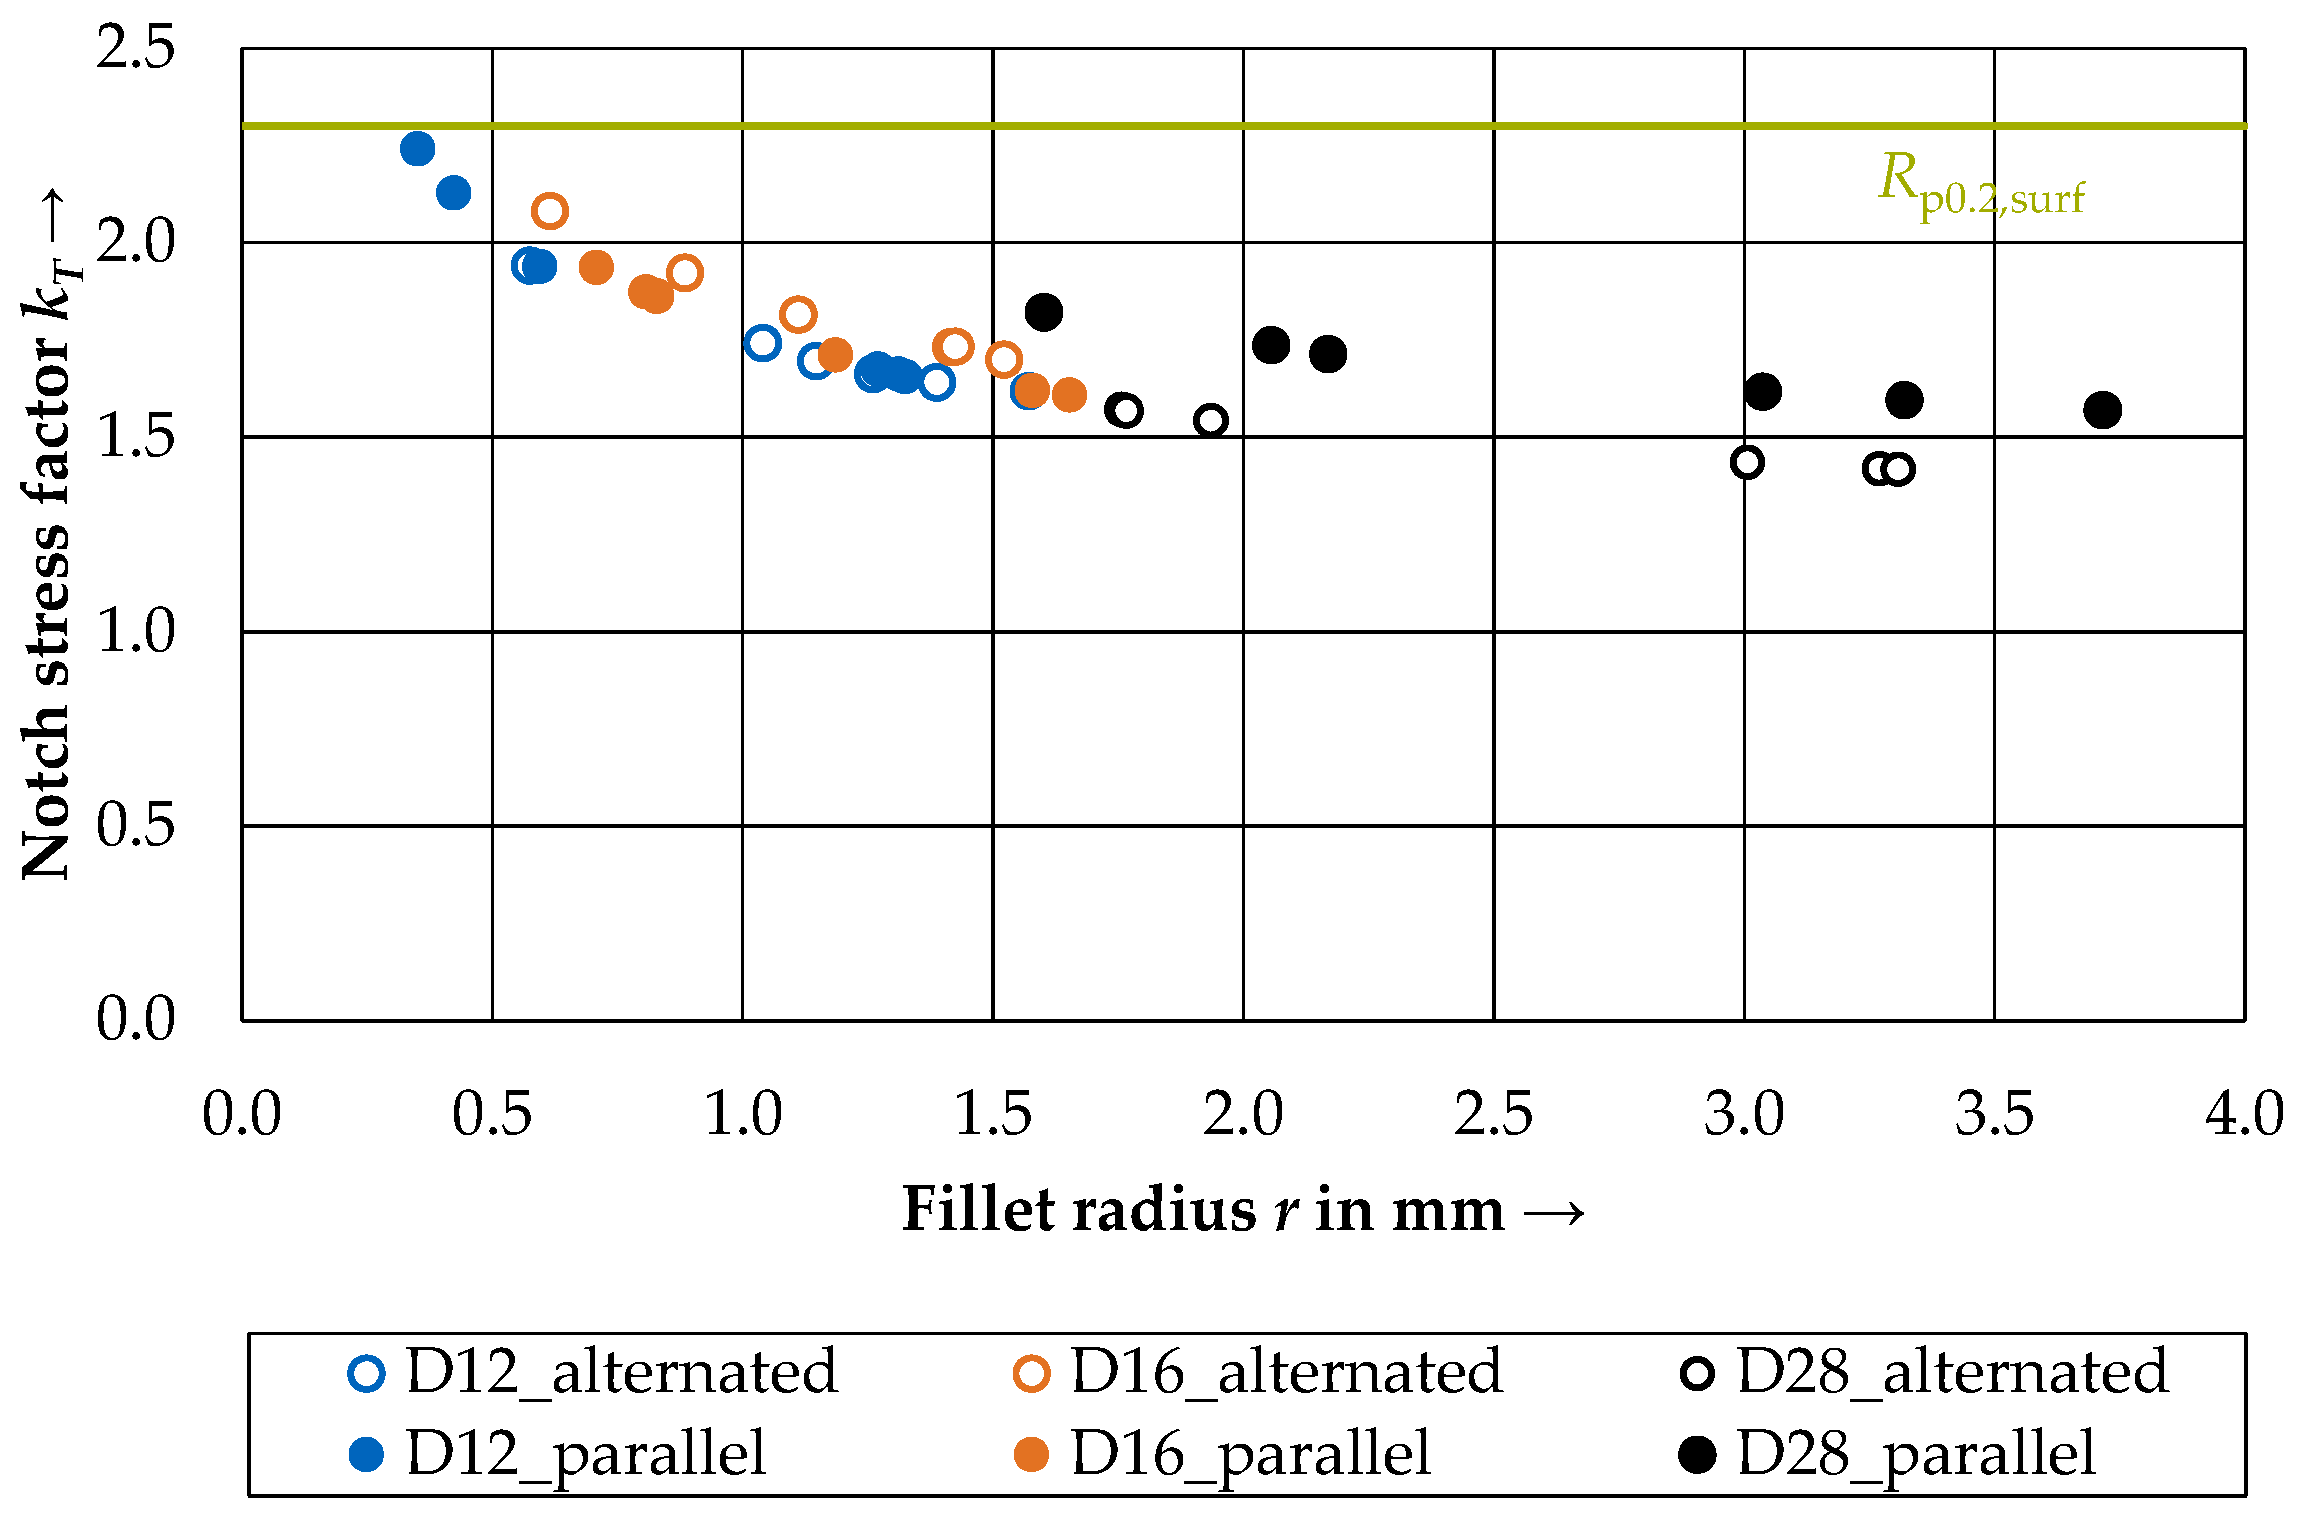
  • With an increase in diameter, the fillet radius also increased, leading to lower values for kT. This is expected, as smaller diameters need to have smaller surface dimensions (including fillet radius). In addition, the range of the fillet radii r increases with the increase in diameter (d = 12 mm: 0.35 mm ≤ r ≤ 1.57 mm; d = 16 mm: 0.63 mm ≤ r ≤ 1.68 mm; d = 28 mm: 1.60 mm ≤ r ≤ 3.72 mm). A possible reason for this result might lie in the production process in which a higher compression force is needed between the rolling calibers for larger diameters (accompanied with a larger section modulus), making the process more fluctuating.
  • The decrease in the notch stress factor with increasing radius follows a logarithmic trend, as derived from the values found in the literature [13,19] and Equation (2).
In comparison to the literature results, the values lie in the expected range. In Rocha et al. [17], only one similar geometry (a rebar with two rib sides parallel and alternating, sickle-shaped ribs) for a diameter of 16 mm could be found. Here, a notch stress factor of 1.53 was reported. Although a comparison between the investigated rebars of Rocha is limited, the specimen in the present study with surface parameters closest to the parameters implemented in Rocha et al. [25] produced a value of kT = 1.84. The probabilistic analysis of Osterminski [22] allows the calculation of quantiles for the notch stress factors of the present study. The maximum values of each simulation lie between 1.57 and 2.24, which equals quantile values between 75% and 99%.
The linear elastic FEM analysis returned von Mises stress values on the surface of the rebar (diameter 28 mm) of up to σv,M = 546 N/mm2. This stress is opposed by the strength of the material as its resistance. In comparison to the yield strength of the tempered martensite (approx. Rp0.2,surf = 690 N/mm2, Figure 8), the stress does not lead to any plastic deformations, but shows a high load capacity of the yield strength. In addition, the residual stress distribution in the specimen—to be more precise, on the surface of the specimen—needs to be taken into account. The first results of [5] indicated that depending on the producer, residual stresses between −45 N/mm2 (compressive stresses) and 10 N/mm2 (tensile stresses) could be found. By principle, a superposition in the linear field on the surface could lead to stresses between 501 N/mm2 and 556 N/mm2. These stresses are also below the yield strength of the tempered martensite. The specimen with a diameter of 12 mm and the smallest fillet radius lies closest to Rp0.2,surf at 674 N/mm2. In this case, small tensile residual stresses can lead to plastification in this zone.
Nevertheless, the study shows that the fillet radius alone has a significant impact on the development of surface stresses; the local distribution of residual stresses may vary significantly as well as the surface distribution of the yield strength (or any other material parameter). Further investigations into the fatigue behavior of rebars must follow in order to deepen the understanding and to further the development of modern rebars towards their application in highly dynamic or slender structures. Even the reduction in the scatter of the aforementioned phenomena could be of significant value considering a (semi-)probabilistic design of reinforced concrete structures.

4. Conclusions and Outlook

The current paper reports the research carried out in a DFG research project. Therein, the experimental results of surface scan data and tensile and fatigue tests on microstructure specimens were discussed. The results of the surface scan data were taken as a basis for the modeling of simplified 3D rebars. A linear elastic simulation was carried out. The following findings were obtained:
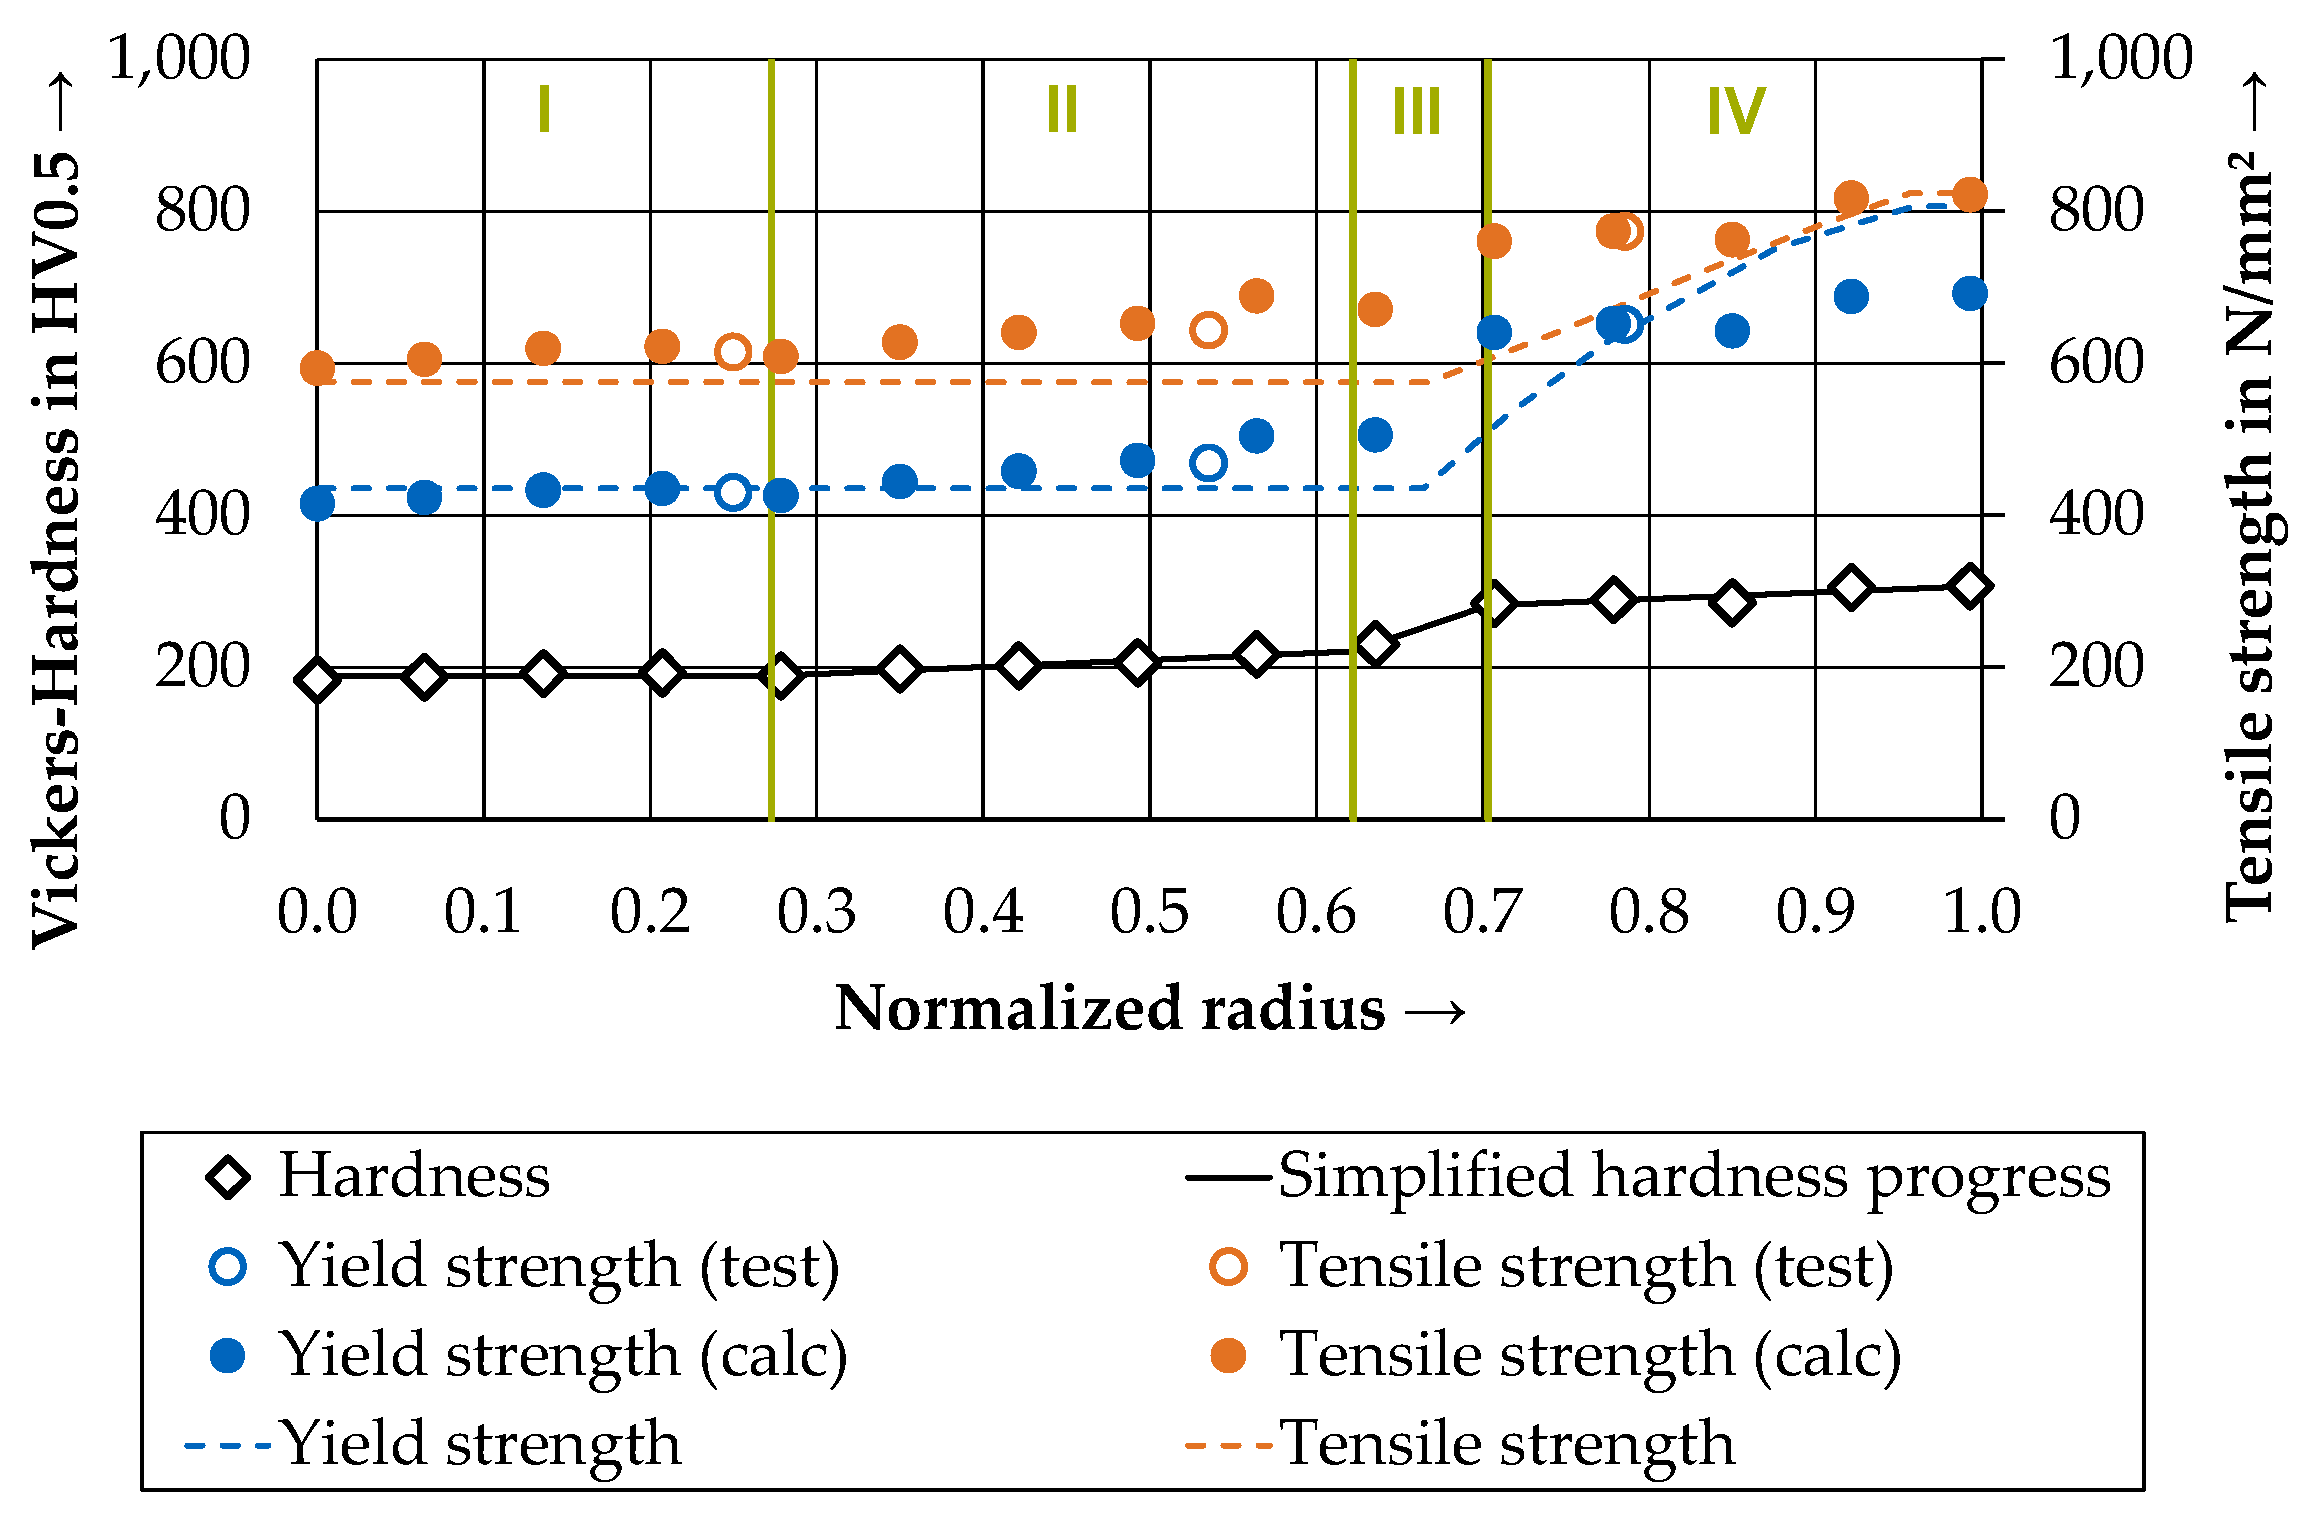
  • A method was developed that allowed the calculation of yield and tensile stress distribution in the cross-section based on the hardness and tensile test results of the microstructure specimens. A comparison with the tensile test results from the rebars showed very good agreement.
  • The paper tackles the influence of the surface properties of rebars and smooth microstructure specimens. The fatigue tests on the latter did not produce any failure under rebar fatigue test conditions. An increase in the load capacity of approx. 90% of the yield strength led to the failure of the core and transition zone specimens (both composed of a ferrite and pearlite microstructure). The tempered martensite specimen never failed under these conditions, most likely due to the load capacity of approx. 60%.
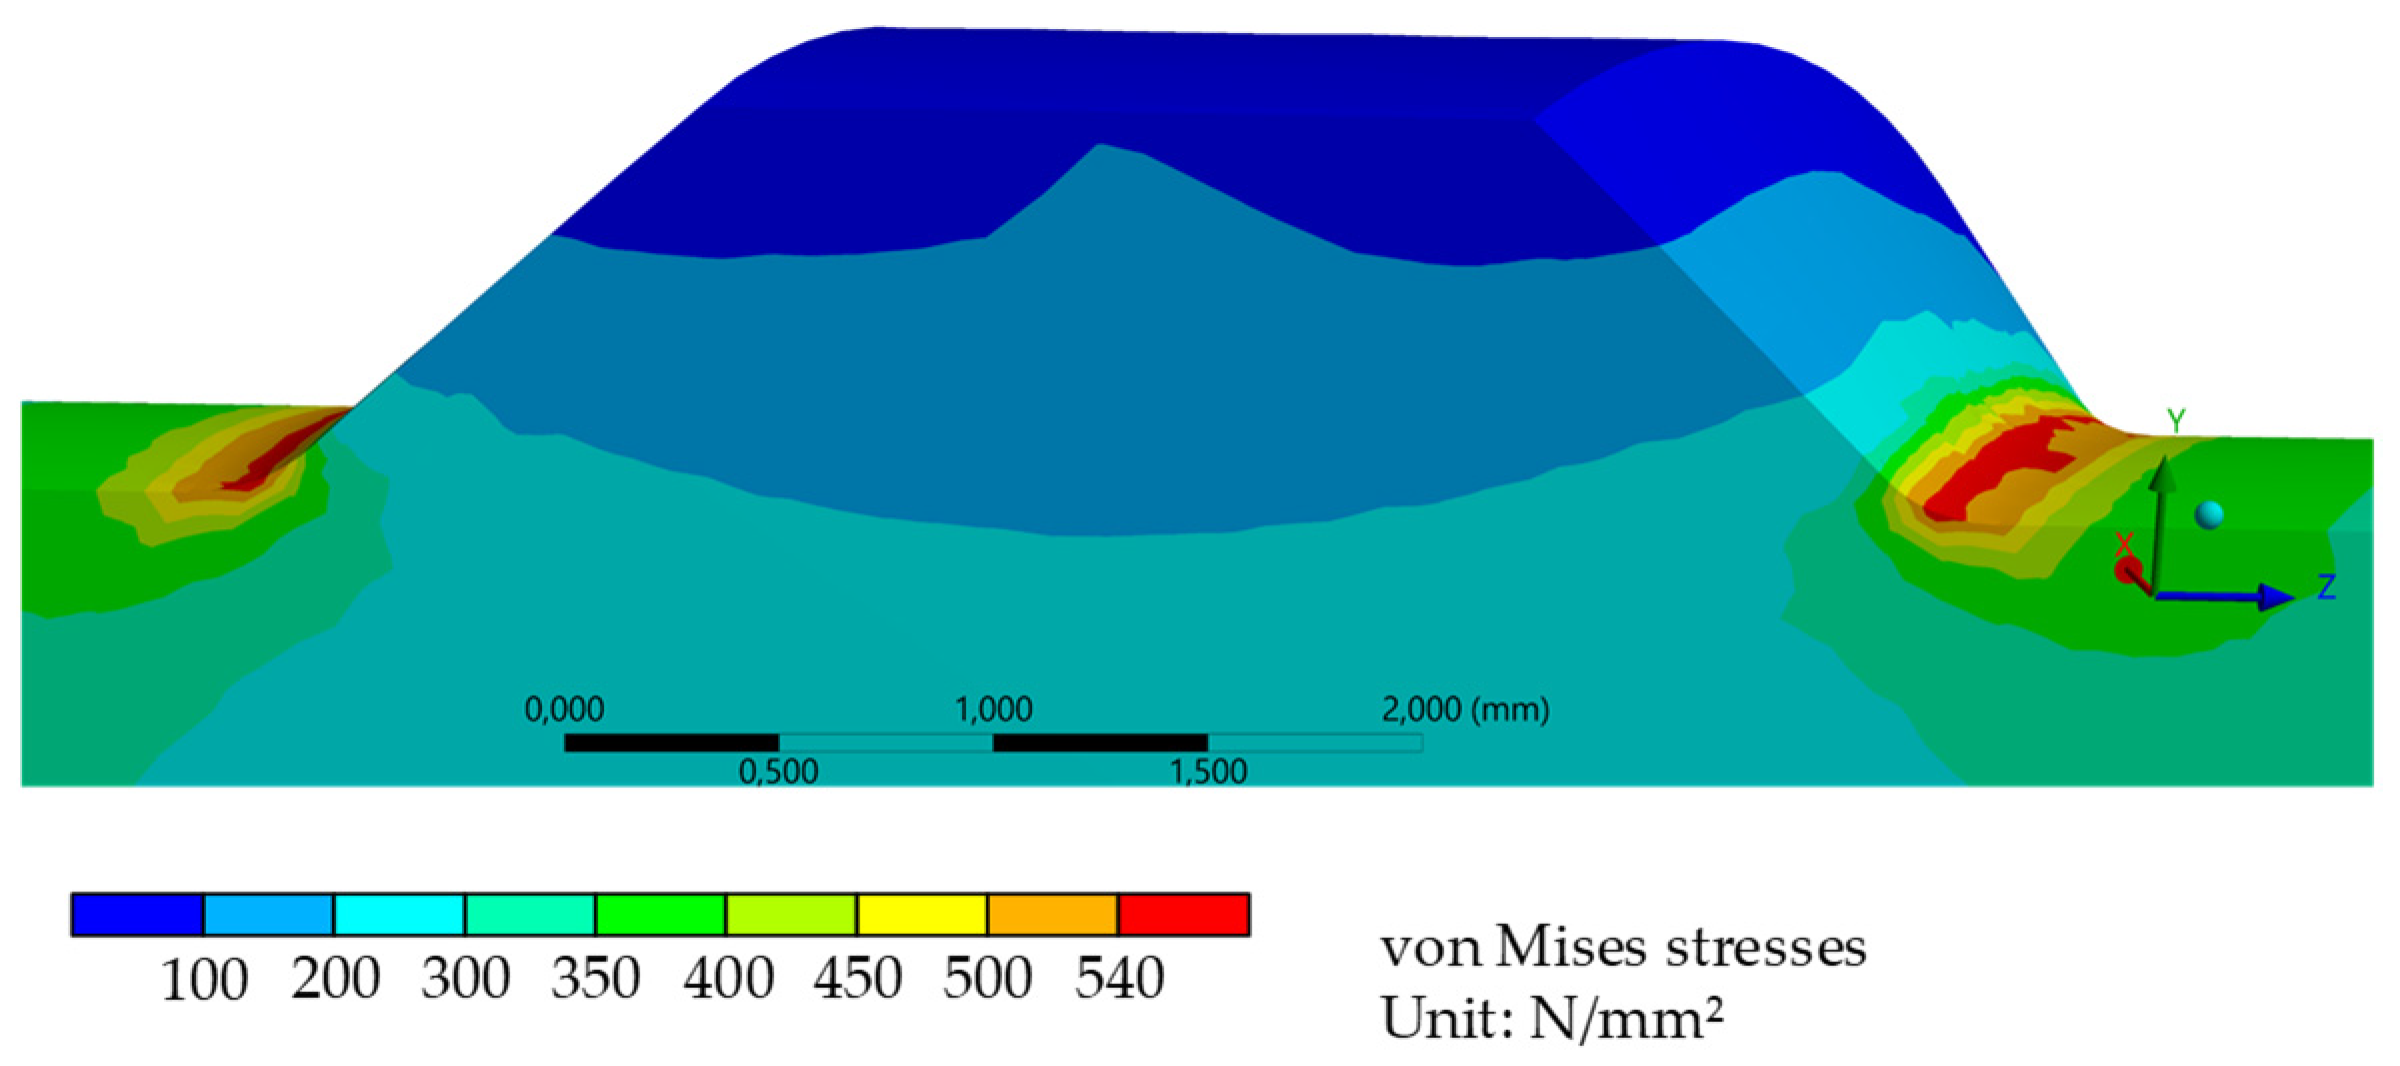
  • The results of the linear elastic FEM analyses showed notch stress factors of up to 2.24 for a diameter of 12 mm. In an example study for a rebar of a diameter of 28 mm, the local surface stress, including a superposed residual stress, led to a maximum of 556 N/mm2. This value is below the surface yield strength of 690 N/mm2 in the linear elastic behavior of the tempered martensite. Thus, the assumption of a linear elastic model approach seems justified in the static modeling of notch stresses.
The scatter involved in all parameters in this investigation has a significant impact on the fatigue life of rebars. The results of the surface scan returned values for the fillet radius of as low as 0.351 mm. Smaller values are likely. Furthermore, crack nuclei and, thus, micro-notches, which can have a higher notch sharpness, can occur during dynamic loading as a result of slip bands. Furthermore, the linear elastic model approach must be validated in future work and, if necessary, extended to include non-linear effects. A geometric twin modeled on the basis of full scanned rebars should show more precise insight into this matter. It is worth noting that a reverse-engineered rebar using CAE based on a real geometry was studied here. For the modeling of a digital geometric twin, a focus has to be placed on the convergence of the mesh in order to be able to represent the von Mises stresses realistically. Such an investigation would provide 3D information on the distribution of notch stresses on the actual and in situ rebar surface. This topic will be explored in research projects in the future.

Author Contributions

Conceptualization, S.R. and K.O.; investigation, S.R. and K.O.; resources, S.R. and M.Z.S.H.; writing—original draft preparation, S.R. and K.O.; writing—review and editing, S.R., M.Z.S.H., C.K. and K.O.; visualization, S.R. and K.O.; supervision, K.O.; project administration, C.K. and K.O.; funding acquisition, C.K. and K.O. All authors have read and agreed to the published version of the manuscript.

Funding

This research was funded by the Deutsche Forschungsgemeinschaft (DFG, German Research Foundation)—Project-number GE 1973/33-1.

Data Availability Statement

Data are available from the authors on reasonable request.

Acknowledgments

The authors wish to thank the German Research Foundation (DFG) for funding the project, as well as Timothy, at our Centre for Building Materials (TUM) for helping to solve some simulation-related questions in the peer review process. We would also like to thank Gehlen for the opportunity to work on the research project. Finally, yet no less important, our thanks go to the student assistants Ariane Focke, Katharina Tischner and Constantin Schwendner for their help with the data processing.

Conflicts of Interest

The authors declare no conflict of interest. The funders had no role in the design of the study; in the collection, analyses, or interpretation of data; in the writing of the manuscript; or in the decision to publish the results.

References

  1. Hameed, M.Z.S.; Wölfle, C.H.; Robl, T.; Obermayer, T.; Rappl, S.; Osterminski, K.; Krempaszky, C.; Werner, E. Parameter Identification for Thermo-Mechanical Constitutive Modeling to Describe Process-Induced Residual Stresses and Phase Transformations in Low-Carbon Steels. Appl. Sci. 2021, 11, 550. [Google Scholar] [CrossRef]
  2. Robl, T.; Wölfle, C.H.; Shahul Hameed, M.Z.; Rappl, S.; Krempaszky, C.; Werner, E. An Approach to Predict Geometrically and Thermo-Mechanically Induced Stress Concentrations in Ribbed Reinforcing Bars. Metals 2022, 12, 411. [Google Scholar] [CrossRef]
  3. Task Group Bond Models. Bond of Reinforcement in Concrete; State-of-Art Report. fib CEB-FIP Bulletin No. 10; fib CEB-FIP: Lausanne, Switzerland, 2000. [CrossRef]
  4. Economopoulos, M.; Respen, Y.; Lessel, G.; Steffes, G. Application of the Tempcore process to the fabrication of high yield strength concrete-reinforcing bars. C R M 1975, 3–19. [Google Scholar]
  5. Volkwein, A.; Osterminski, K.; Meyer, F.; Gehlen, C. Distribution of residual stresses in reinforcing steel bars. Eng. Struct. 2020, 223, 111140. [Google Scholar] [CrossRef]
  6. Fernandez, I.; Bairán, J.M.; Marí, A.R. 3D FEM model development from 3D optical measurement technique applied to corroded steel bars. Constr. Build. Mater. 2016, 124, 519–532. [Google Scholar] [CrossRef]
  7. König, G.; Danielewicz, I. Ermüdungsfestigkeit von Stahlbeton- und Spannbetonbauteilen mit Erläuterungen zu den Nachweisen gemäß CEB-FIP Model Code 1990. In Deutscher Ausschuss für Stahlbeton, Heft 439; Beuth-Verlag: Berlin, Germany, 1994. [Google Scholar]
  8. Weirich, T. Ermüdungsverhalten des Betonstahls unter Berücksichtigung möglicher Korrosionseinflüsse. Ph.D. Thesis, Universität Stuttgart, Stuttgart, Germany, 2013. [Google Scholar]
  9. Läpple, V. Einführung in die Festigkeitslehre; Springer Fachmedien Wiesbaden: Wiesbaden, Germany, 2016. [Google Scholar] [CrossRef]
  10. Radaj, D.; Vormwald, M. Ermüdungsfestigkeit; Springer: Berlin/Heidelberg, Germany, 2007. [Google Scholar] [CrossRef]
  11. Martin, H.; Schießl, P. Dauerschwingfestigkeit von Unbehandelten Betonstählen: Zusammenfassender Überblick über Versuchsergebnisse und Theoretische Erkenntnisse; Institut für Betonstahl- und Stahlbeton e.V.: Düsseldorf, Germany, 1975. [Google Scholar]
  12. Martin, H.; Schießl, P. Untersuchungen zur Dauerschwingfestigkeit von dispersionsgehärteten Betonrippenstählen BSt 50/55 mit III U- und IV U-Profilierung; Institut für Betonstahl- und Stahlbeton e.V.: Düsseldorf, Germany, 1974. [Google Scholar]
  13. Schießl, P. Theoretische Überlegungen zum Einfluß der Rippengeometrie auf die Dauerschwingfestigkeit von Betonstählen; Institut für Betonstahl- und Stahlbeton e.V.: Düsseldorf, Germany, 1974. [Google Scholar]
  14. Helgason, T.; Hanson, J.M.; Somes, N.F.; Corley, W.G.; Hognestad, E. Fatigue Strength of High-Yield Reinforcing Bars; Transportation Research Board National Research Council: Washington, DC, USA, 1976. [Google Scholar]
  15. Rehm, G.; Harre, W.; Beul, W. Schwingfestigkeitsverhalten von Betonstählen Unter Wirklichkeitsnahen Beanspruchungs- und Umgebungsbedingungen; Beuth Verlag: Berlin, Germany, 1986. [Google Scholar] [CrossRef]
  16. Zheng, H.; Abel, A. Stress concentration and fatigue of profiled reinforcing steels. Int. J. Fatigue 1998, 20, 767–773. [Google Scholar] [CrossRef]
  17. DIN 488-2:2009-08; Betonstahl—Betonstabstahl. Beuth-Verlag: Berlin, Germany, 2009. [CrossRef]
  18. DIN EN ISO 15630-1:2019-05; Stahl für die Bewehrung und das Vorspannen von Beton—Prüfverfahren—Teil 1: Bewehrungsstäbe, Walzdraht und Draht (ISO_15630-1:2019). Beuth-Verlag: Berlin, Germany, 2019. [CrossRef]
  19. Jhamb, I.C. Fatigue of Reinforcing Bars; University of Alberta Libraries: Edmonton, Kanada, 1972. [Google Scholar]
  20. Rocha, M.; Michel, S.; Brühwiler, E.; Nussbaumer, A. Very high cycle fatigue tests of quenched and self-tempered steel reinforcement bars. Mater. Struct. 2016, 49, 1723–1732. [Google Scholar] [CrossRef]
  21. MacGregor, J.G.; Jhamb, I.C.; Nuttall, N. Fatigue Strength of Hot Rolled Deformed Reinforcing Bars. J. Proc. 1971, 68. [Google Scholar] [CrossRef]
  22. Osterminski, K. Probabilistic modeling of reinforcing bar fatigue on the basis of surface topography data. Struct. Concr. 2021, 22, E860–E867. [Google Scholar] [CrossRef]
  23. DIN 488-1:2009-08; Betonstahl—Teil 1: Stahlsorten, Eigenschaften, Kennzeichnung. Beuth-Verlag: Berlin, Germany, 2009. [CrossRef]
  24. Osterminski, K.; Gehlen, C. Development of a laser-based line scan measurement system for the surface characterization of reinforcing steel. Mater. Test. 2019, 61, 1051–1055. [Google Scholar] [CrossRef]
  25. Rocha, M.; Brühwiler, E.; Nussbaumer, A. Geometrical and Material Characterization of Quenched and Self-Tempered Steel Reinforcement Bars. J. Mater. Civ. Eng. 2016, 28, 4016012. [Google Scholar] [CrossRef]
  26. Puri, A.; Bhattacharyya, B. An analysis and optimisation of the geometrical inaccuracy due to wire lag phenomenon in WEDM. Int. J. Mach. Tools Manuf. 2003, 43, 151–159. [Google Scholar] [CrossRef]
  27. Ho, K.H.; Newman, S.T.; Rahimifard, S.; Allen, R.D. State of the art in wire electrical discharge machining (WEDM). Int. J. Mach. Tools Manuf. 2004, 44, 1247–1259. [Google Scholar] [CrossRef]
  28. DIN EN ISO 7500-1:2018-06; Metallische Werkstoffe—Kalibrierung und Überprüfung von Statischen Einachsigen Prüfmaschinen—Teil 1: Zug- und Druckprüfmaschinen—Kalibrierung und Überprüfung der Kraftmesseinrichtung (ISO_7500-1:2018). Beuth-Verlag: Berlin, Germany, 2018. [CrossRef]
  29. DIN EN ISO 9513:2013-05; Metallische Werkstoffe—Kalibrierung von Längenänderungs-Messeinrichtungen für die Prüfung mit einachsiger Beanspruchung (ISO_9513:2012_+_Cor._1:2013). Beuth-Verlag: Berlin, Germany, 2013. [CrossRef]
  30. DIN EN ISO 18265:2014-02; Metallische Werkstoffe—Umwertung von Härtewerten (ISO_18265:2013). Beuth-Verlag: Berlin, Germany, 2014. [CrossRef]
Figure 1. Cross-section of a transversal rebar rib in the center with definition of geometrical parameters according to [17,18].
Mathematics 11 01910 g001
Figure 2. Geometry of a specimen with a diameter of 12 mm used for FEM.
Mathematics 11 01910 g002
Figure 3. Specimen distribution over the cross-section containing the different depths and diameters of the cylindrical microstructure specimens (left), and cross-section of the whole rebar after eroding the microstructure specimens (right).
Mathematics 11 01910 g003
Figure 4. Test setup “tension test” of microstructure specimens.
Mathematics 11 01910 g004
Figure 5. Test setup “fatigue test” of microstructure specimens.
Mathematics 11 01910 g005
Figure 6. Final mesh of the alternated rib side of specimen with a diameter of 12 mm generated in AN-SYS 2020 R1.
Mathematics 11 01910 g006
Figure 7. Results of the tensile tests in a stress–strain diagram for all microstructure specimens.
Mathematics 11 01910 g007
Figure 8. Hardness [1], tensile and yield strength distribution over the normalized radius including values from the literature (dashed lines) [6] and separated into the aforementioned zones by vertical green lines (Table 6).
Mathematics 11 01910 g008
Figure 9. Notch stresses in the center of a transversal rib of the specimen with a nominal diameter of 12 mm and the smallest fillet radii of the FEM analysis.
Mathematics 11 01910 g009
Figure 10. Maximum notch stress factors plotted over the fillet radius r for three different diameters separated into parallel and alternated rib sides.
Mathematics 11 01910 g010
Table 1. Distribution of the model lengths for FEM.
Specimen Diameter
(mm)
Model Length
(mm)
1250
1660
28100
Table 2. Test matrix of the experimental program.
SpecimenNumber of Tensile TestsNumber of Fatigue Tests
Rebar d = 28 mm5-
Microstructure5 each3 each
Table 3. Material parameters of B500B implemented in the material model of the FEM simulation.
ParameterUnitValue
Young’s modulus EN/mm2200,000
Poisson’s ratio ν-0.3
Yield strength ReN/mm2500
Tensile strength RmN/mm2540
Table 4. Geometry parameters measured from the LLS data and used to generate the digital geometry.
Geometry
Parameter
ValueDiameter
d = 12 mm
Diameter
d = 16 mm
Diameter
d = 28 mm
amm0.9560.9851.614
bkmm1.743.33.47
cmm7.1111.8817.05
α°474145
β 1°6053/716053/686055/70
r 1mm0.3510.5760.7080.6161.6021.758
0.4231.0410.8070.8852.0571.767
0.5951.1470.8281.1122.171.936
1.271.2611.1851.4253.0383.008
1.3111.3881.5791.5233.3213.271
1.3241.5721.6532.5283.7173.308
1 The first column shows the values of the parallel, the second of the alternated rib side. Values ordered by size.
Table 5. Results of the tensile tests.
Specimen ZoneParameterUnitMean ValueStandard DeviationCoefficient of Variation
(%)
CoreReN/mm24302.180.51
RmN/mm26152.40.39
Agt%14.1817.03
Transition zoneReN/mm246410.22.2
RmN/mm26399.411.47
Agt%13.745.85.8
SurfaceRp0.2N/mm265169.2210.63
RmN/mm277350.476.53
Agt%7.871.481.48
Whole rebar 28 mmReN/mm25746.511.13
RmN/mm27024.710.67
Agt%9.80.383.89
Table 6. Conversion factors for all defined zones over the rebar cross-section.
ZoneNormalized RadiusConversion Factor for Hardness into Tensile StrengthConversion Factor for Inverse Yield Ratio
Rm/Re or Rm/Rp0.2
I0.273.231.43
II0.62−0.86·x + 3.47−0.22·x + 1.49
III0.70−3.14·x + 4.89−2.03·x + 2.62
IV1.002.681.19
Table 7. Load capacity of the different microstructure specimens according to the load regime.
SpecimenUnitLoad Capacity with Respect to Re/Rp0.2
σo = 300 N/mm2σo = 400 N/mm2
Core%69.893.1
Transition zone%64.786.2
Surface%46.161.5
Disclaimer/Publisher’s Note: The statements, opinions and data contained in all publications are solely those of the individual author(s) and contributor(s) and not of MDPI and/or the editor(s). MDPI and/or the editor(s) disclaim responsibility for any injury to people or property resulting from any ideas, methods, instructions or products referred to in the content.

