1. Introduction
The aim of this work is to carry out a large-scale study on patients affected by aneurysmal pathologies, in order to test, numerically and clinically, an assisted diagnosis procedure that allows the identification and extraction of the patent lumen of the vessel from basal CT images.
The aneurysm is one of the main pathologies affecting blood vessels [
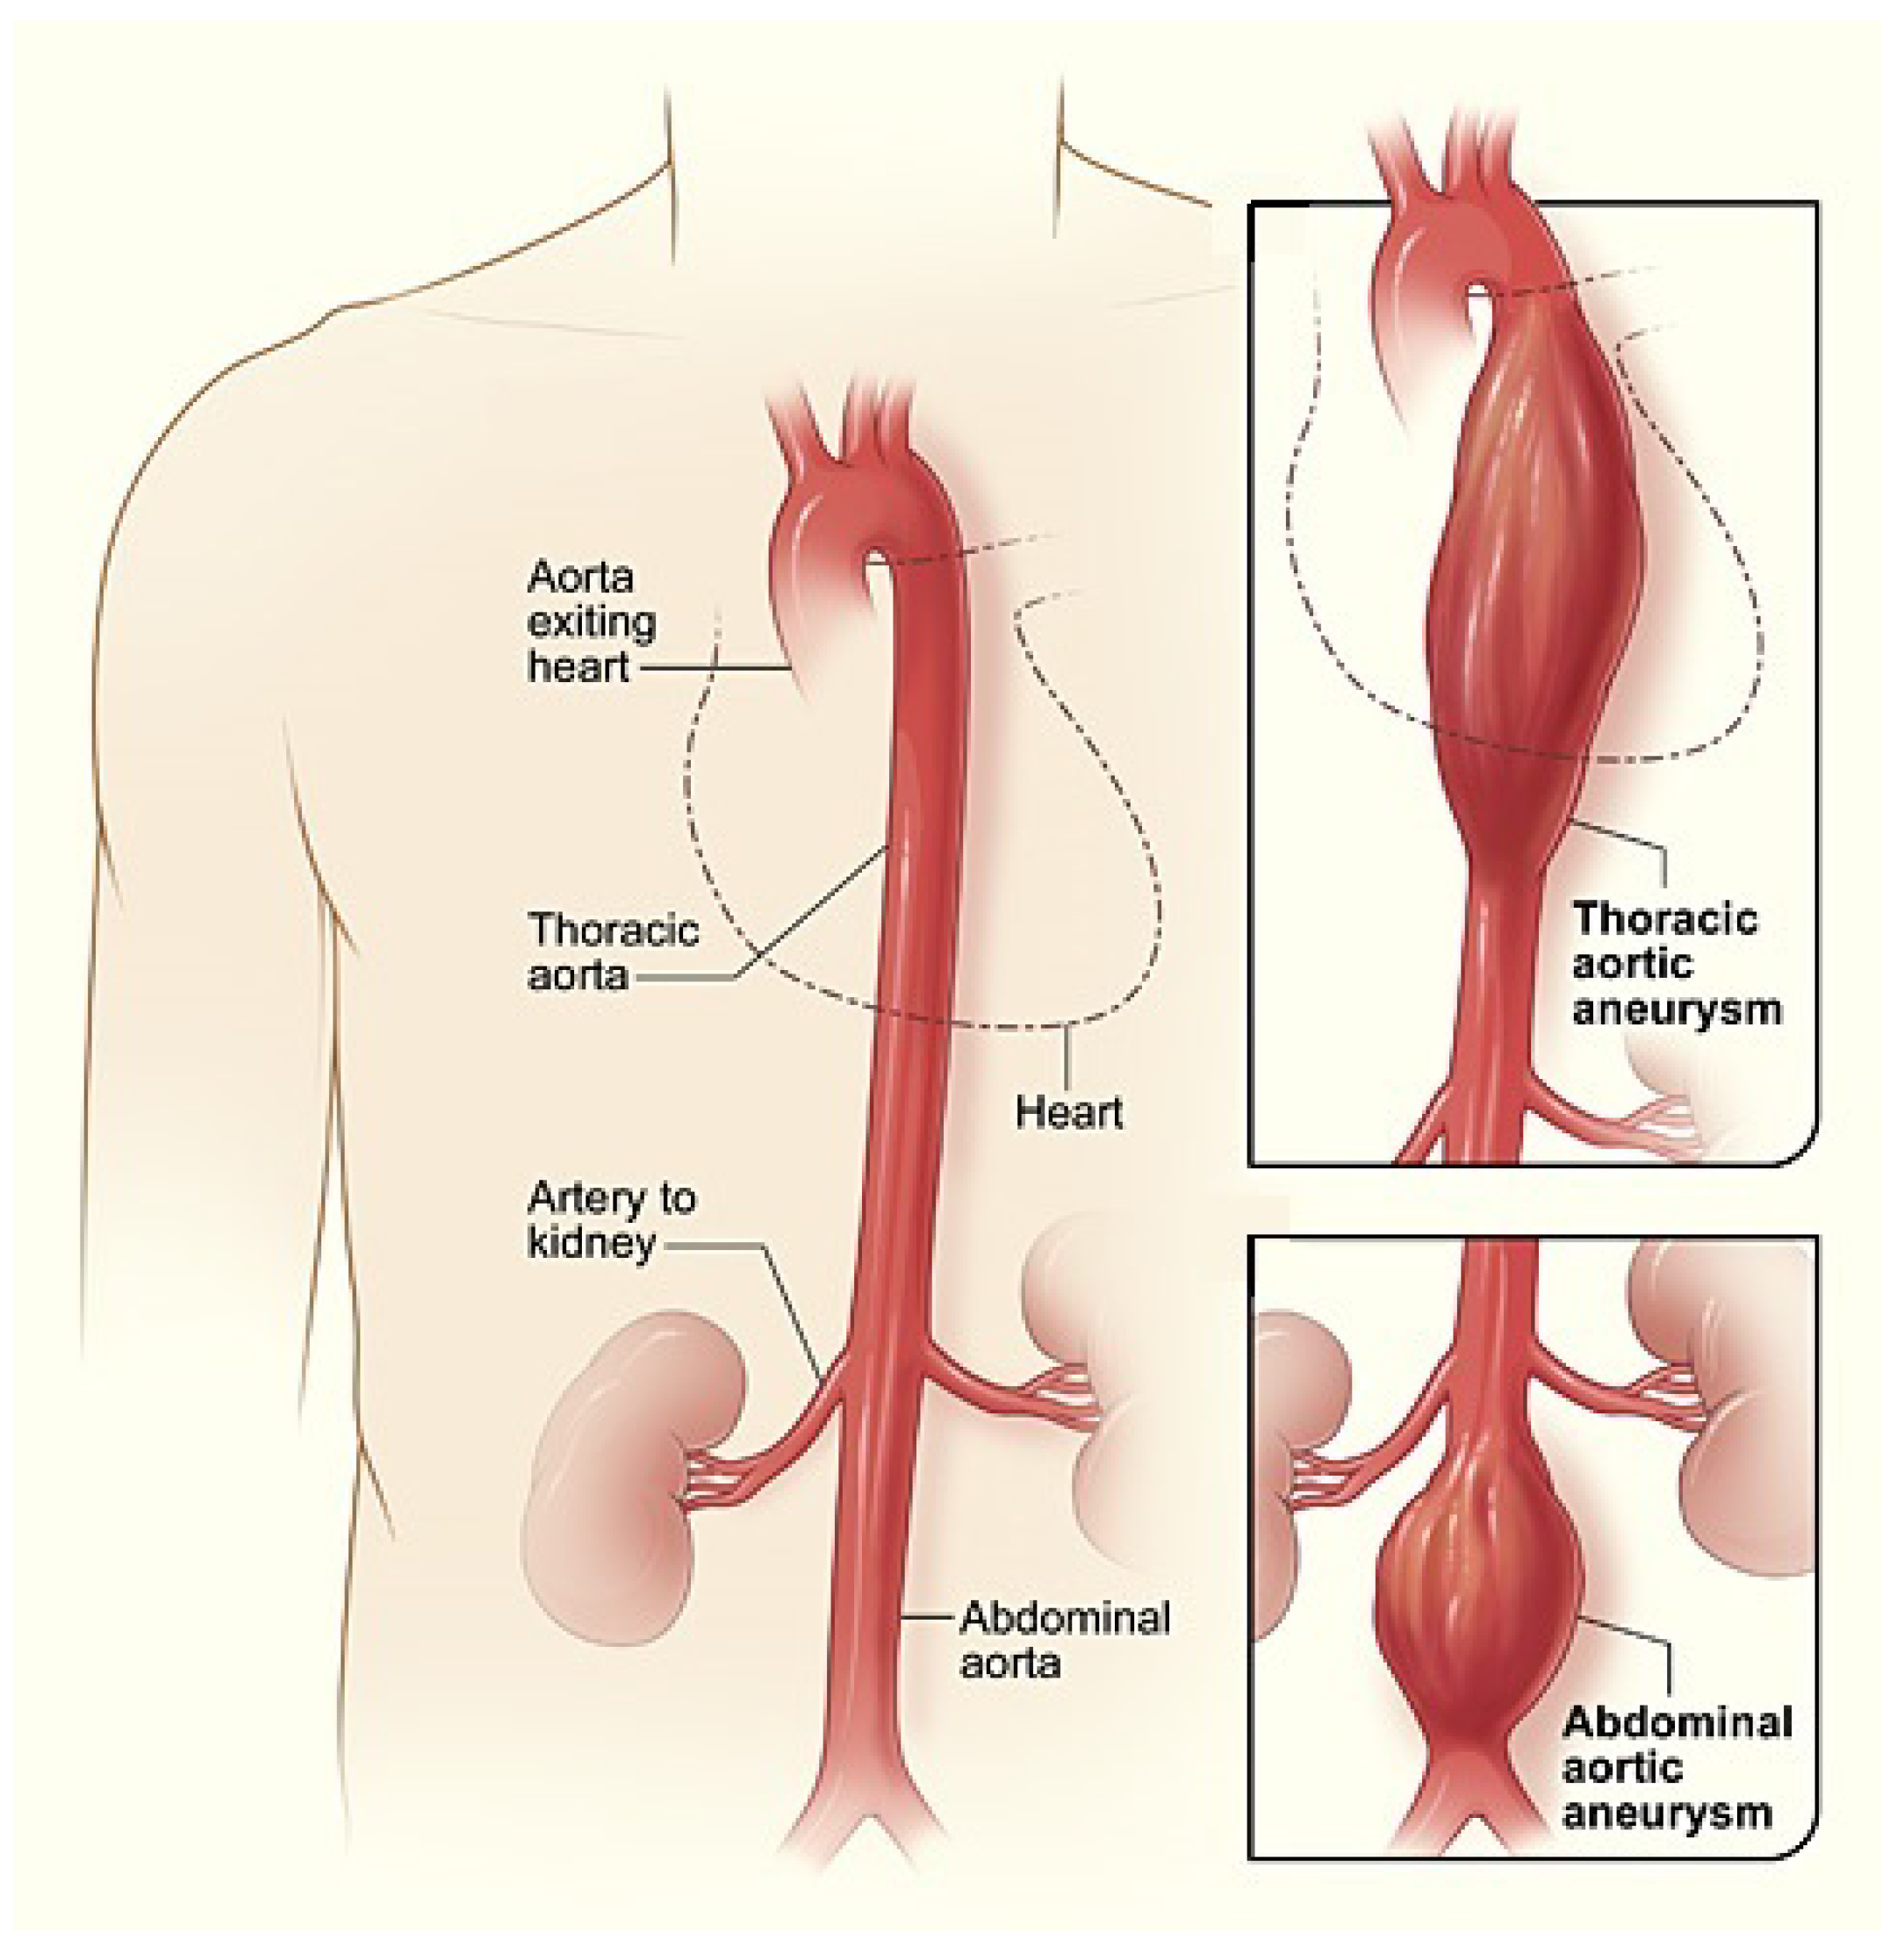
1]. It is defined as a dilation of the artery whose diameter exceeds at least 50% that of the same vessel in normal conditions. Our study is focused on the aorta artery that is the main and largest artery of the human body, originating from the top of the left ventricle and extending down to the abdomen, where it splits into two smaller arteries (the common iliac arteries). Aneurysms are mainly distinguished into thoracic aortic aneurysms (AATs), involving the aorta in the chest, and abdominal aortic aneurysms (AAAs), which involve the aorta in the abdomen areas and which are the ones analyzed in the present study (
Figure 1).
One of the main causes of aneurysmatic dilation is the weakness of the arterial walls. In the worst cases, this dilation can cause the rupture of the vessel, leading to frequently fatal bleeding. For the diagnosis of aneurysmal pathologies, computed tomography (CT) is considered the gold standard procedure. Since blood often does not flow through the entire aneurysmatic area but on a more restricted part, due to the formation of a thrombosed zone within the vessel lumen, for the doctor’s diagnosis it is important not only to identify the diameter of the aneurysmal area but also the patency of the aortic vessel, i.e., the area where the blood actually flows. Moreover, the arteries, vessels and blood having a low level of radiopacity which makes them not visible to the naked eye on a CT exam, the insertion of the contrast medium is necessary, in order to identify the vascular district of interest.
The above diagnosis is done through the so called
CT angiography which is a diagnostic procedure used to emphasize blood vessels, with particular interest in the arteries and veins. However, the main inconvenience is connected with the contrast medium, whose injection has to be avoided for patients with severe kidney diseases or important allergic problems, due to the presence of iodine (a nephrotoxic substance) [
2].
On the basis of a first preliminary analysis ([
3]), the main objective of this paper is to describe an original study carried out on 13677 images from 15 patients which foresees, starting from basal CT image sequences, the extraction of the patent lumen of the vessel with suitable digital image processing (DIP) algorithms, see, e.g., Refs. [
4,
5].
At first, slices that are outside the aneurysmal tract are excluded, then a square region of interest (ROI) including the aorta is selected and binary masks are created to define the circular region representing the aorta. The basal ROIs and those with the contrast medium (in the arterial phase), together with the respective masks, are processed by an algorithm implemented in PHP language in a portal, namely ImageLab, located at the Department of Mathematics and Computer Science of the University of Perugia. The algorithm developed in the portal foresees the application of the sampling Kantorovich (SK) algorithm for processing the basal ROI, on which is then applied a wavelet filter in order to extract the so called “residual component” of the image [
6,
7]. Then, the extraction of the patent lumen of the vessel by means of an adaptive thresholding is preceded by the application of normalization and equalization algorithms.
In this work, the entire procedure has been applied to the cases under examination and has been tested through a series of error indexes, also implemented in the portal, see, e.g., Refs. [
3,
8,
9,
10,
11,
12]. The present study is also accompanied by a clinical evaluation, showing a good agreement between the numerical results and the patient reports examined.
A crucial role in the whole procedure is played by the SK algorithm, i.e., the implementation of the family of sampling Kantorovich operators [
13,
14], described in
Section 2, which is revealed to be a suitable mathematical tool for the reconstruction and enhancement of images, as it acts both as a low-pass filter and as a rescaling algorithm, increasing the information content of images. For these operators were provided both approximation results in the space of continuous and uniformly continuous functions, as well as in the setting of
spaces and, more generally, in the setting of Orlicz spaces (see, e.g., Refs. [
13,
14,
15,
16,
17,
18]). Moreover, we remark that the performance of the SK algorithm in image rescaling, in terms of PSNR and CPU time, in comparison with some interpolation and quasi-interpolation methods, has been evaluated in [
19]. Thanks to this implementation, several satisfactory results have been obtained, both in the biomedical and engineering fields (see, e.g., Refs. [
20,
21]).
The images involved in this study have been obtained thanks to the development of the CARE project: “A regional information system for Heart Failure and Vascular Disorder”, carried out, on the part of vascular disorder, through a collaboration between the Department of Mathematics and Computer Science, the Division of Diagnostic Imaging of the Department of Medicine and Surgery of the University of Perugia and the Perugia Hospital. It should be noted that the Bioethics University Committee of the University of Perugia has granted the use of the images under study for research purposes.
The paper is organized as follows: in
Section 2 we describe the theory of sampling Kantorovich operators and the main approximation results which lead to the development of the SK algorithm. The latter, which plays a crucial role in the extraction of the patent lumen of the vessel of the aorta artery, is described in
Section 3, together with some DIP algorithms, useful for the segmentation procedure, and the definition of the error indices. The Care portal, a platform recently created for the development of the CARE Project with the scope of making a connection between doctors and mathematicians (the latter later called ”operators”), is analyzed in
Section 4. In
Section 5 and
Section 6, we provide the experimental data and show the numerical results of the present large scale analysis. Finally, in
Section 7 we discuss the above results, making some final remarks.
2. Approximation by Means of Sampling Kantorovich Operators
In order to apply the SK algorithm, we need to recall some preliminary notions which are useful for the mathematical definition of the family of sampling Kantorovich operators. Let , where each is a strictly monotone increasing sequence of real numbers with such that . We denote it by We say that a function is a kernel if it possesses the following properties:
- ()
and it is bounded in a neighborhood of the origin of ;
- ()
, for every ;
- ()
for some
, the discrete absolute moment of order
of
is finite, i.e.,
where
is the Euclidean norm.
There are many examples of kernels satisfying the above assumptions, see, e.g., Refs. [
22,
23].
Let
and
.
We define the multidimensional version of the sampling Kantorovich operators introduced in [
14] as
where
is a locally integrable function such that the above series is convergent for each
.
The one-dimensional version of these operators has been introduced in [
13] in order to extend the generalized sampling operators ([
24,
25]) to the general setting of Orlicz spaces [
17,
18].
The following approximation results represent the basis of the application of the mathematical model of the sampling Kantorovich operators to digital images. Indeed, the implementation of the following results allows an effective reconstruction and improvement of the images we dealt with in this study and constitutes one of the fundamental steps of the entire procedure used for the extraction of the patent lumen of the aortic vessel.
Namely, we have the following:
Theorem 1 ([
14])
. Let be a continuous and bounded function. Then, for every ,In particular, if f is uniformly continuous and bounded, then where denotes the usual uniform norm.
Here follows the
convergence result for
([
14]) which allows not necessarily continuous signal/images to be reconstructed.
Theorem 2. For every , , the following estimate holds where denotes the usual norm.
Note that in case
for every
, we have
and the above inequality becomes
For other results concerning the sampling Kantorovich operators see [
15,
16,
26].
Now, we provide a list of some classes of kernels which satisfy the assumptions
and that can be used in order to implement the family (
1) of sampling Kantorovich operators (see [
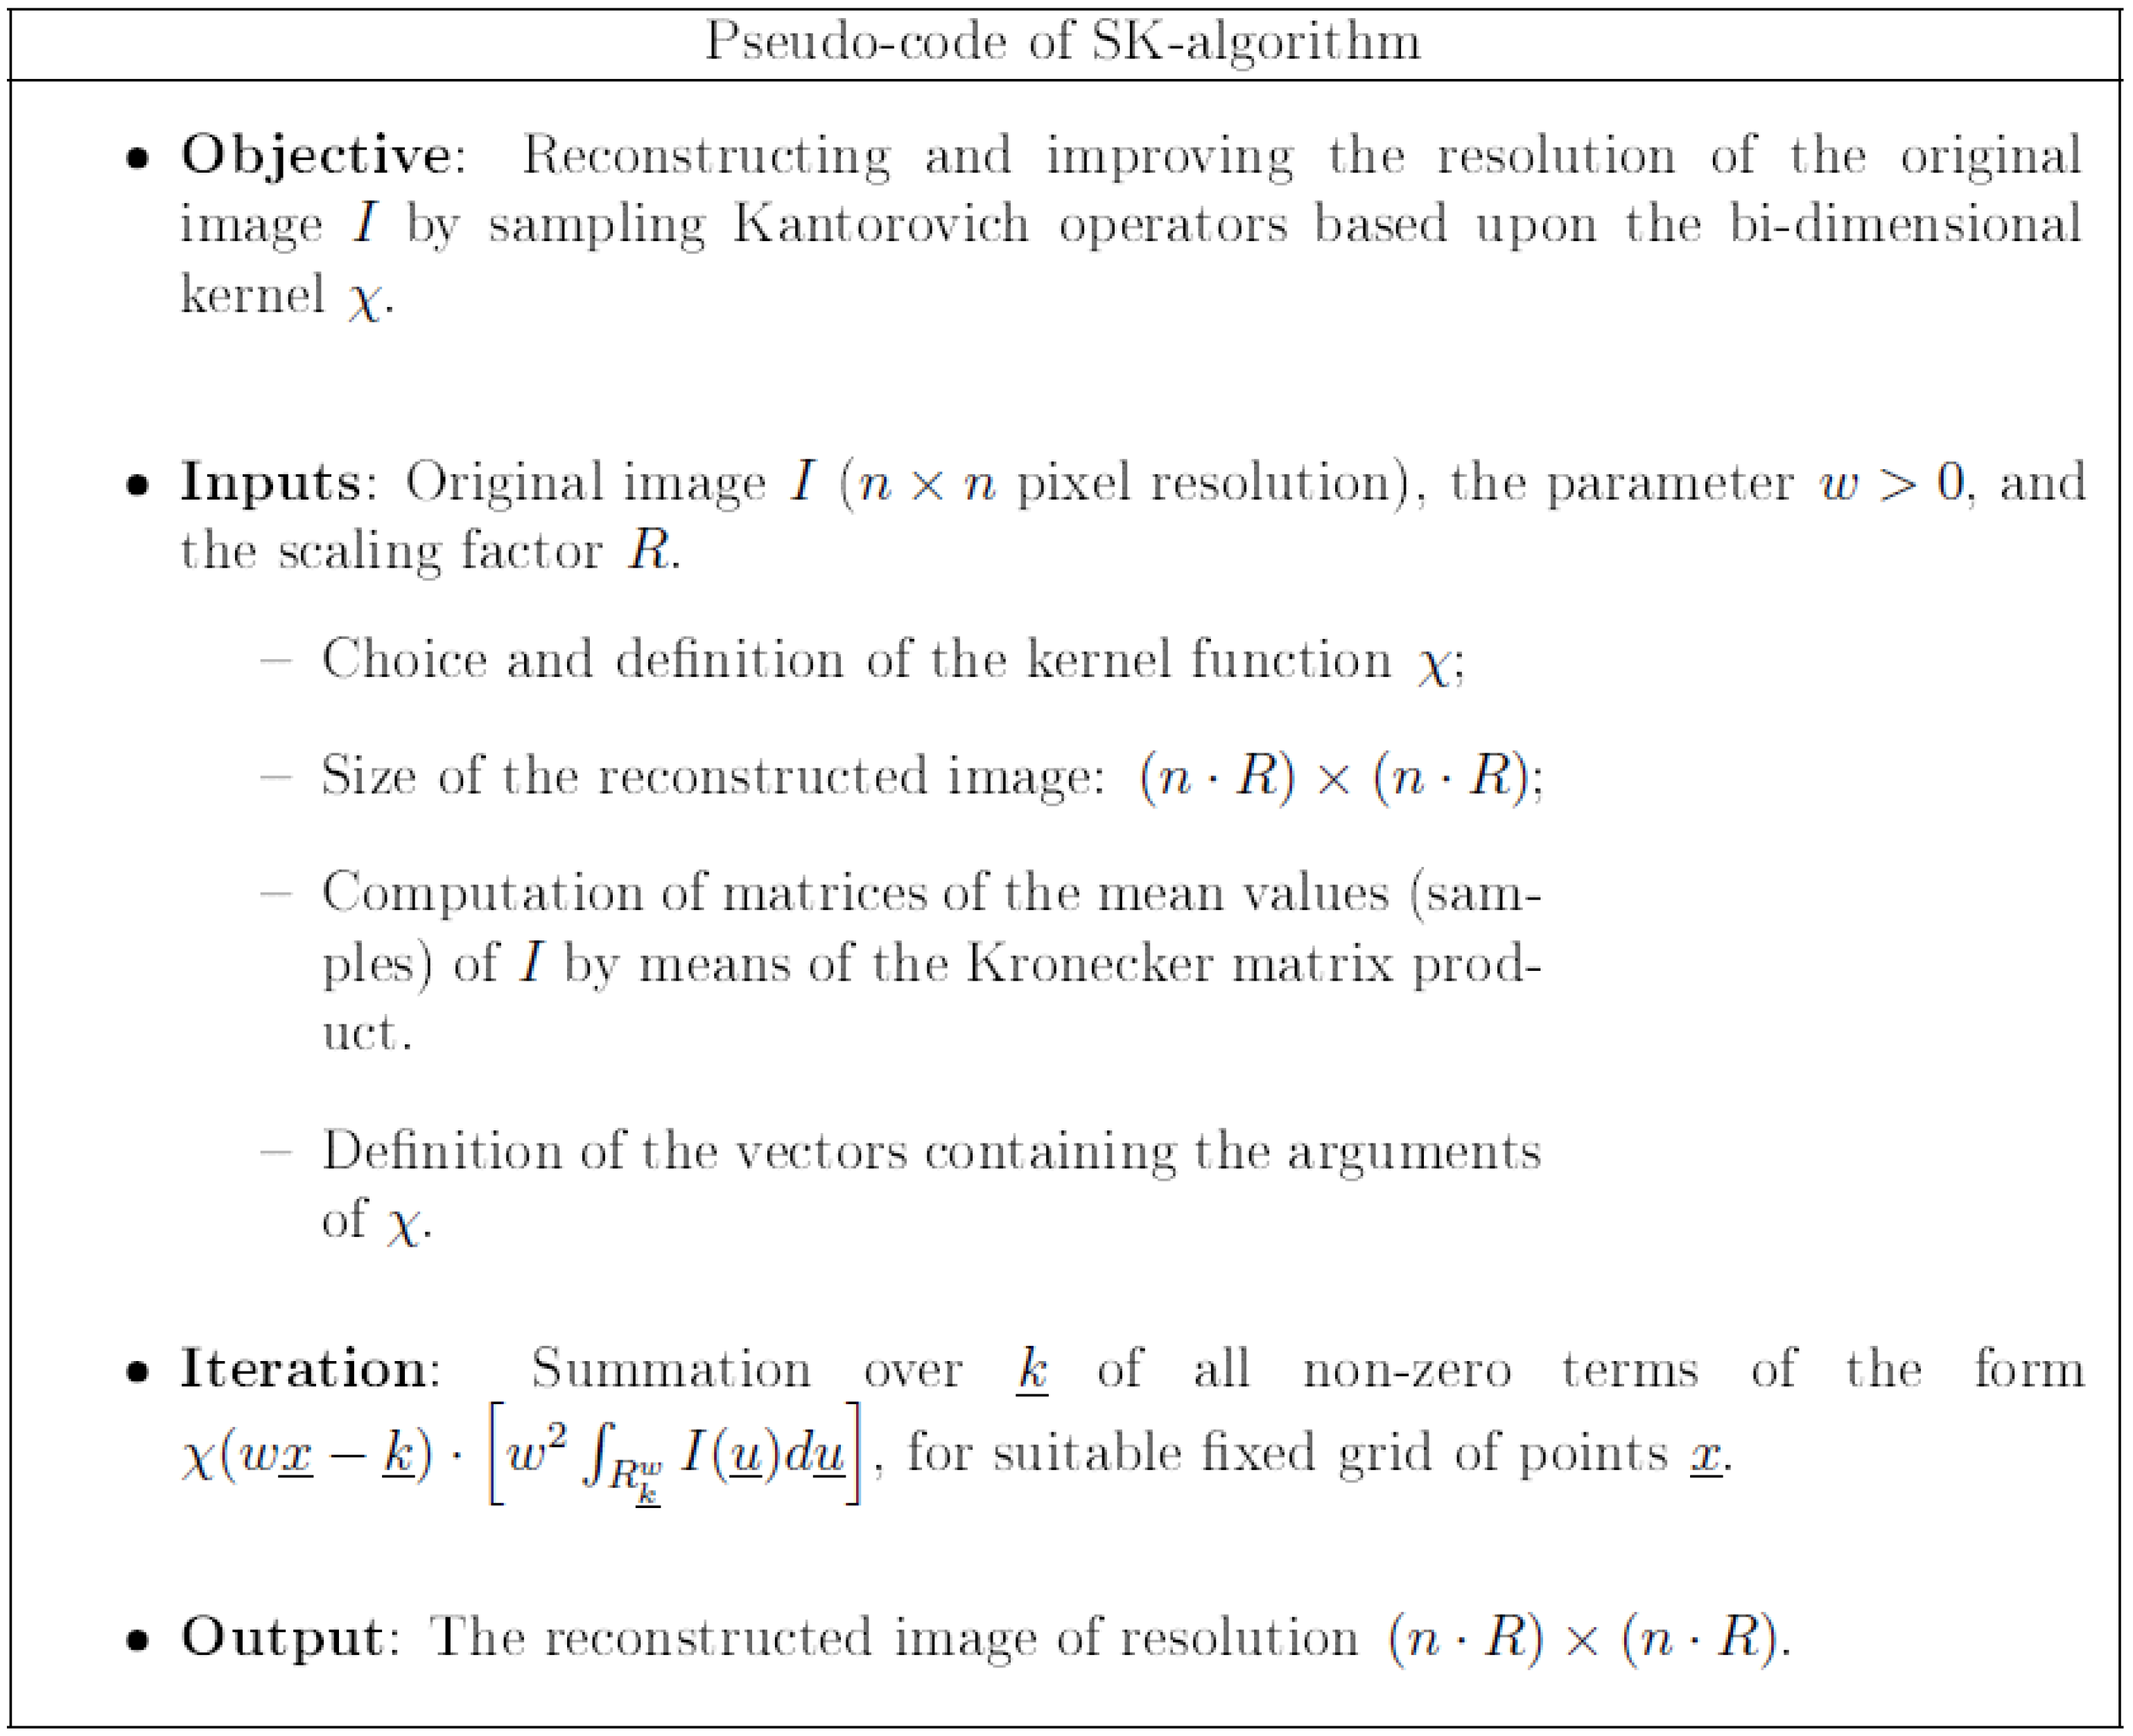
3]). For the sake of completeness, we report in
Figure 2 the pseudo-code of the SK algorithm.
For instance, we could consider the one-dimensional central B-spline of order r (see, e.g., Refs. [
13,
23]):
where the function
denotes the positive part of
.
Its multidimensional version can be defined as the following tensor product,
Another useful class of kernels, which has been chosen for the segmentation process of the pervious zone of the aorta artery (see
Section 3), is given by the so called
Jackson-type kernels:
where the one-dimensional Jackson-type kernels are defined by:
with
,
,
, and where
is a non-zero normalization coefficient given by
Finally, there are also examples of kernels which are not of the product type. An example of such a kernel can be given by the Bochner–Riesz kernel which is of radial type and is defined by:
for
, where
,
is the Bessel function of order
and
is the Euler function (see [
22,
23]).
Now, in order to apply the bi-dimensional sampling Kantorovich operators to image reconstruction, it is necessary to recall that a bi-dimensional grayscale image is a matrix
A which can be modeled as:
where
I is a step function,
,
, with compact support and
are the characteristics functions of the sets
,
. The function
I is associated with each pixel
, its corresponding gray level
. Therefore the family of bi-dimensional sampling Kantorovich operators can then be applied to the function
I, by choosing a suitable kernel function
, e.g., among the ones above mentioned. We note that this allows a given image I to be reconstructed with any fixed
w (sampling rate). Obviously, increasing w results in a better reconstruction of the original image. Moreover, the implementation of the SK operators acts also as a rescaling algorithm, so allowing the possibility of enhancing the original image, which is revealed to be very useful for the applications [
3,
19,
20,
21,
27].
3. SK and Segmentation Algorithms
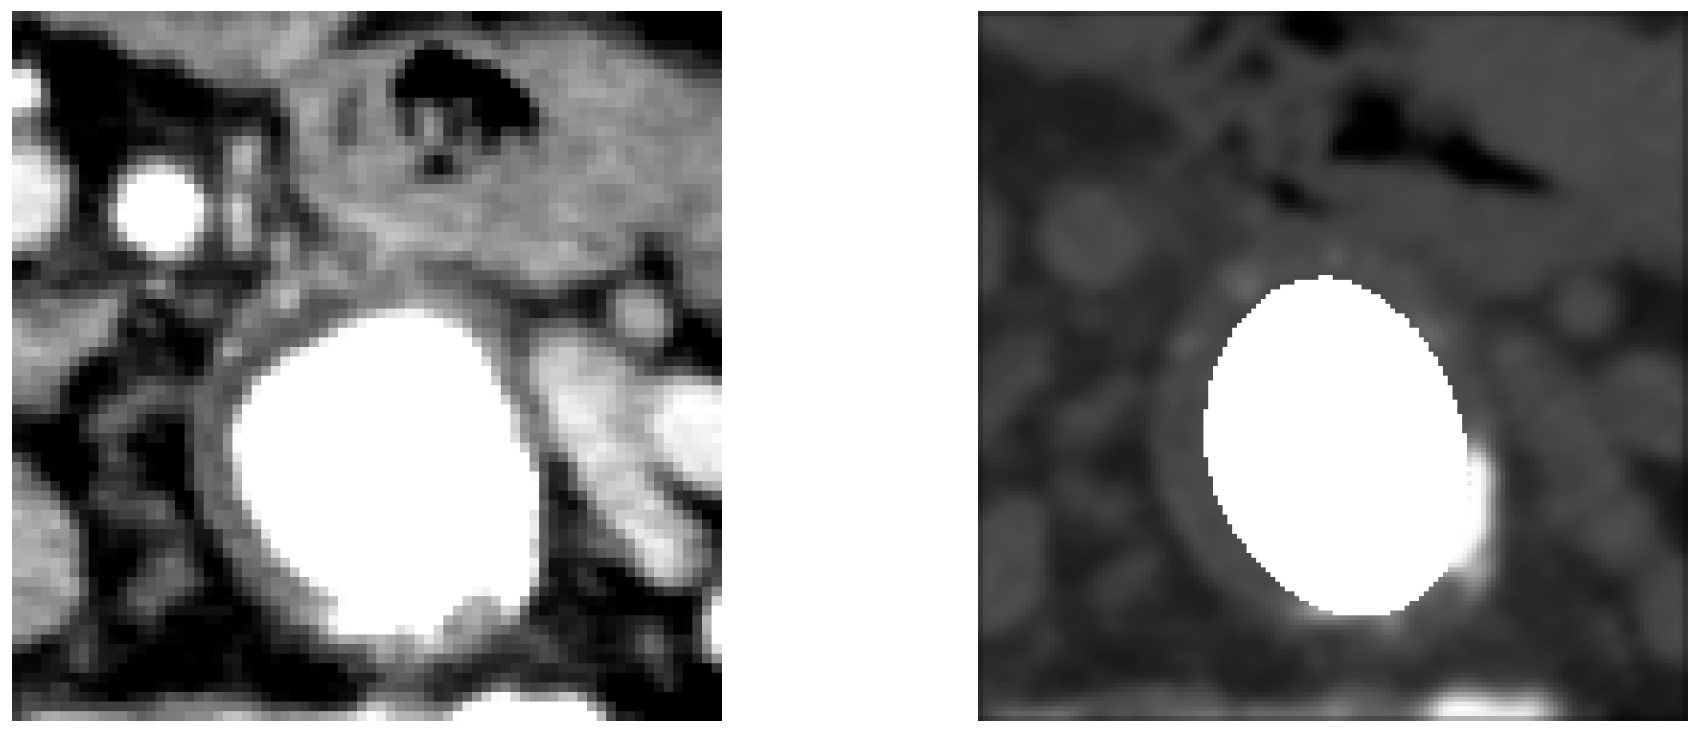
In
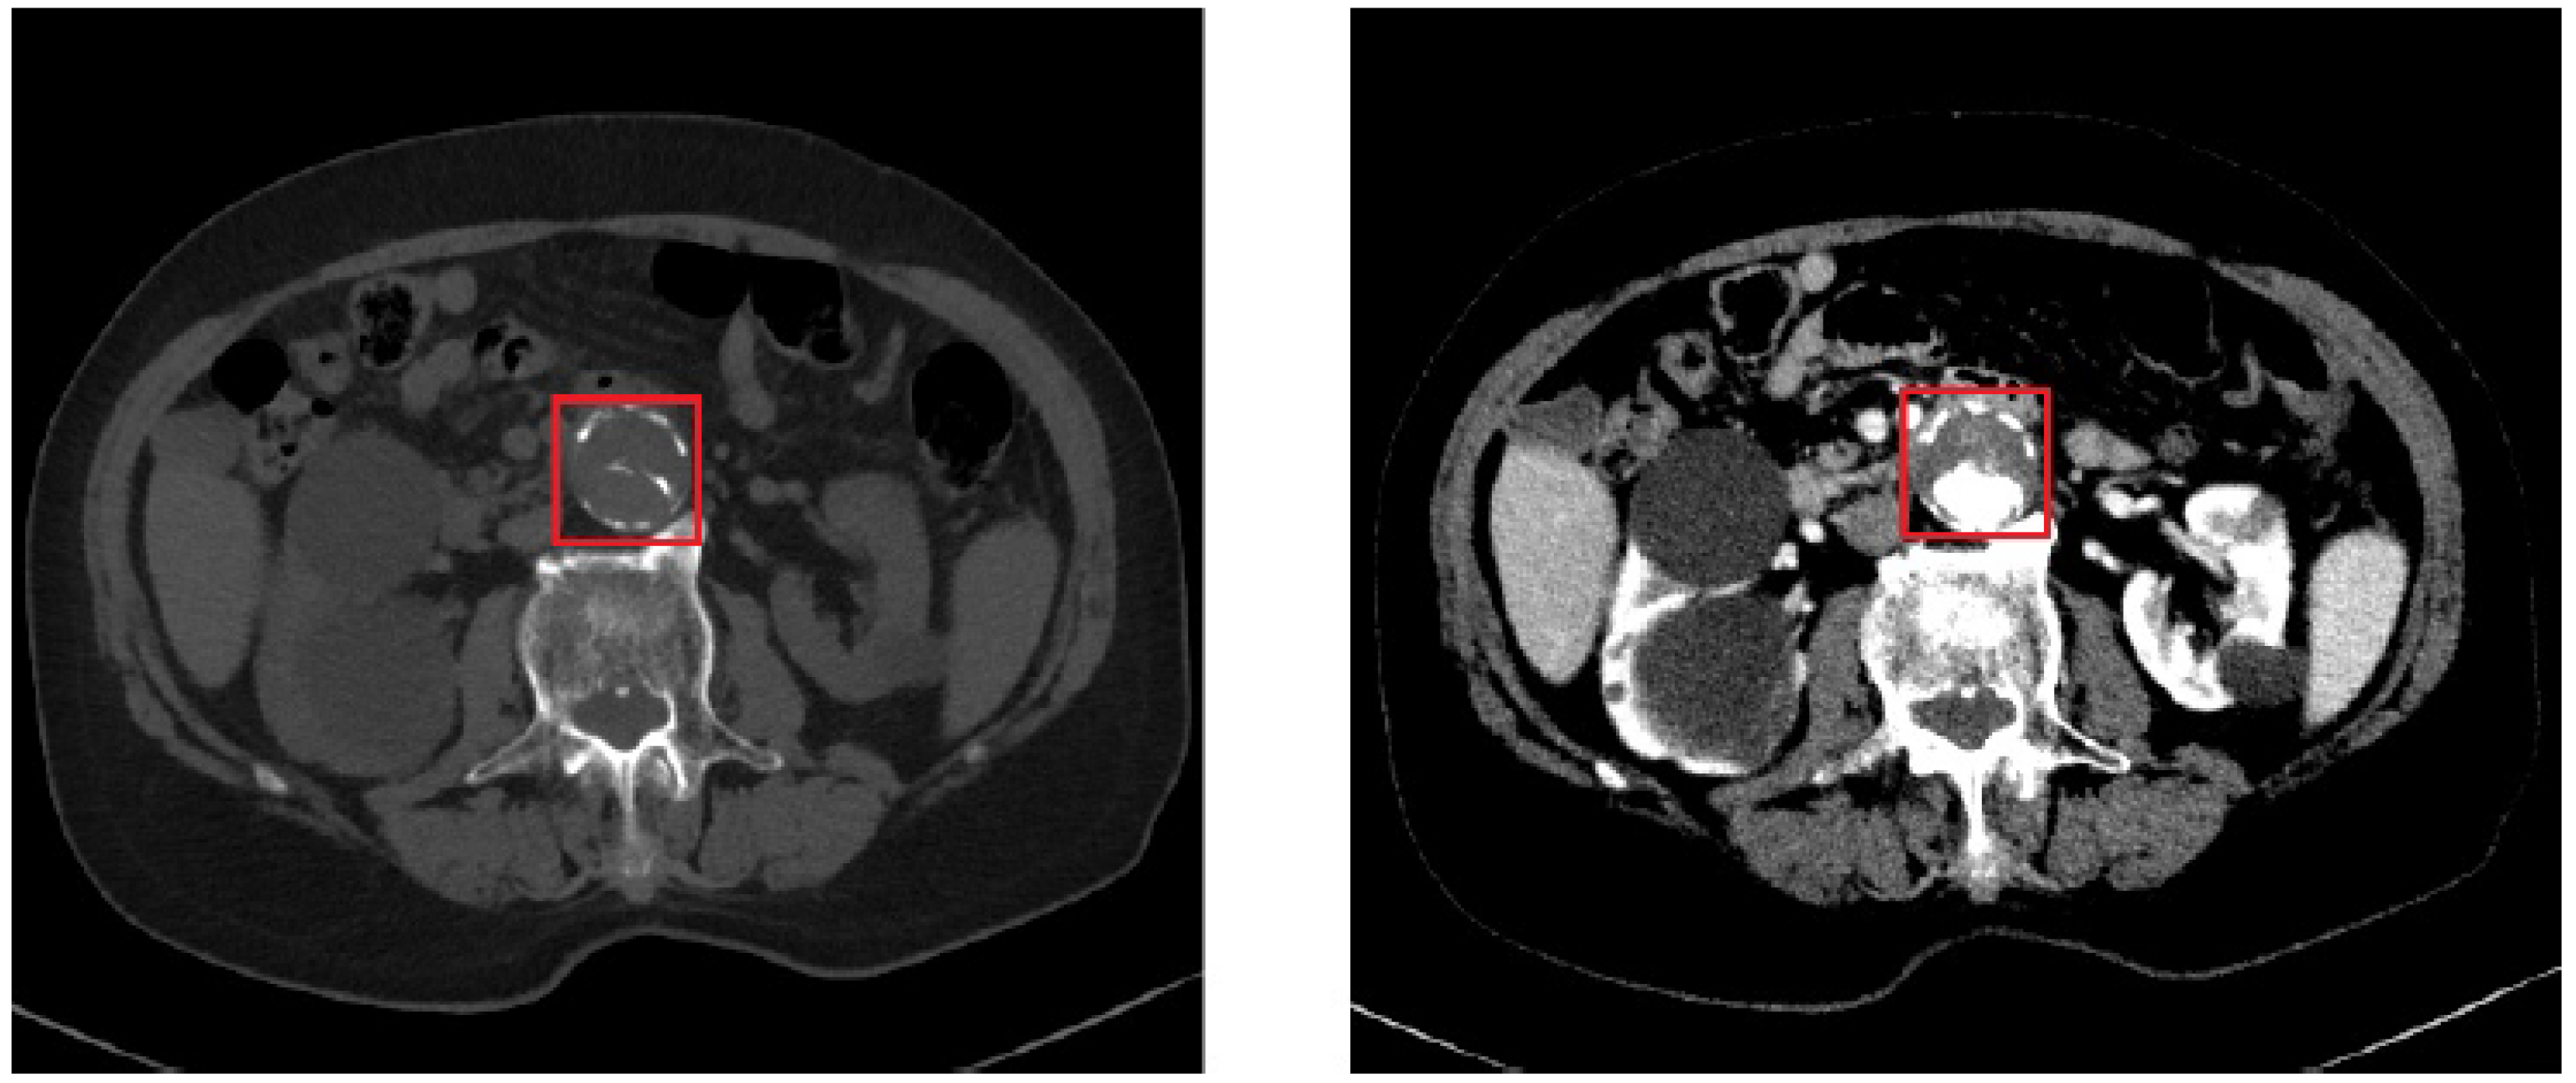
Figure 3, we can see the comparison between a basal CT image (i.e., without contrast medium) and a CT image with contrast medium (in the arterial phase) depicting an AAA. The difference is evident: the image on the left gives us an idea only of the size of the dilation, while the image on the right shows how much the vessel is occluded.
In order to solve the problem, we have applied a series of algorithms to the basal images for the automatic segmentation of the lumen of the vessels, thus avoiding the injection of the contrast medium, which is required by the gold standard diagnostic procedure for detecting the aneurysms of the aorta artery. This procedure has been applied on images of size , with slice thickness equal to 1 mm. The parameters of the windowing of the basal sequence ( and ) have been chosen in such a way that the structure of the aorta was identified. On the other hand, those of the windowing of the contrast medium sequence ( and ) have been chosen in such a way that the contrast agent appeared at full scale with respect to the rest of the image (i.e., completely white).
With the purpose of establishing a direct interaction between the CT exams coming from the hospital and the subsequent processing, a platform, which takes the name of
Care portal (see
Section 4), has been developed. The doctor uploads two packages containing, respectively, the sequence of basal images and the sequence of images with contrast medium, which can be then downloaded and processed. First of all, CT images (both without and with contrast medium) have been converted from DICOM standard to 8 bit and saved in .png format. All sections between the initial and the final part of the aneurysm have been selected and superposed through a registering operation, whenever required. This technique consists of overlapping pairs of images to match as closely as possible, because the identified sections could present some displacements due to the different acquisition times between basal and contrast medium images. Then, these sections have been cropped obtaining images of the square areas, ROI, with dimensions larger than
pixels and smaller than
pixels, depending on the patients under examination. Furthermore, finally, in order to apply the segmentation algorithm, binary masks (i.e., consisting only of black and white pixels) have been generated to detect the vessel. The SK algorithm is applied to the ROI without contrast medium by using the bi-dimensional Jackson type kernel (
2) with
and the scaling factor
(
Figure 2 of
Section 2). The ROI selection is performed, along the axial plane, in such a way that the entire CT scan of the portion where the aorta shows the atheroma is contained in the square boundaries of the selection. The SK algorithm is applied for its double function [
19]:
It acts as a rescaling algorithm, interpolating the basal image to have a higher information content;
It acts as a low pass filter, denoising the image.
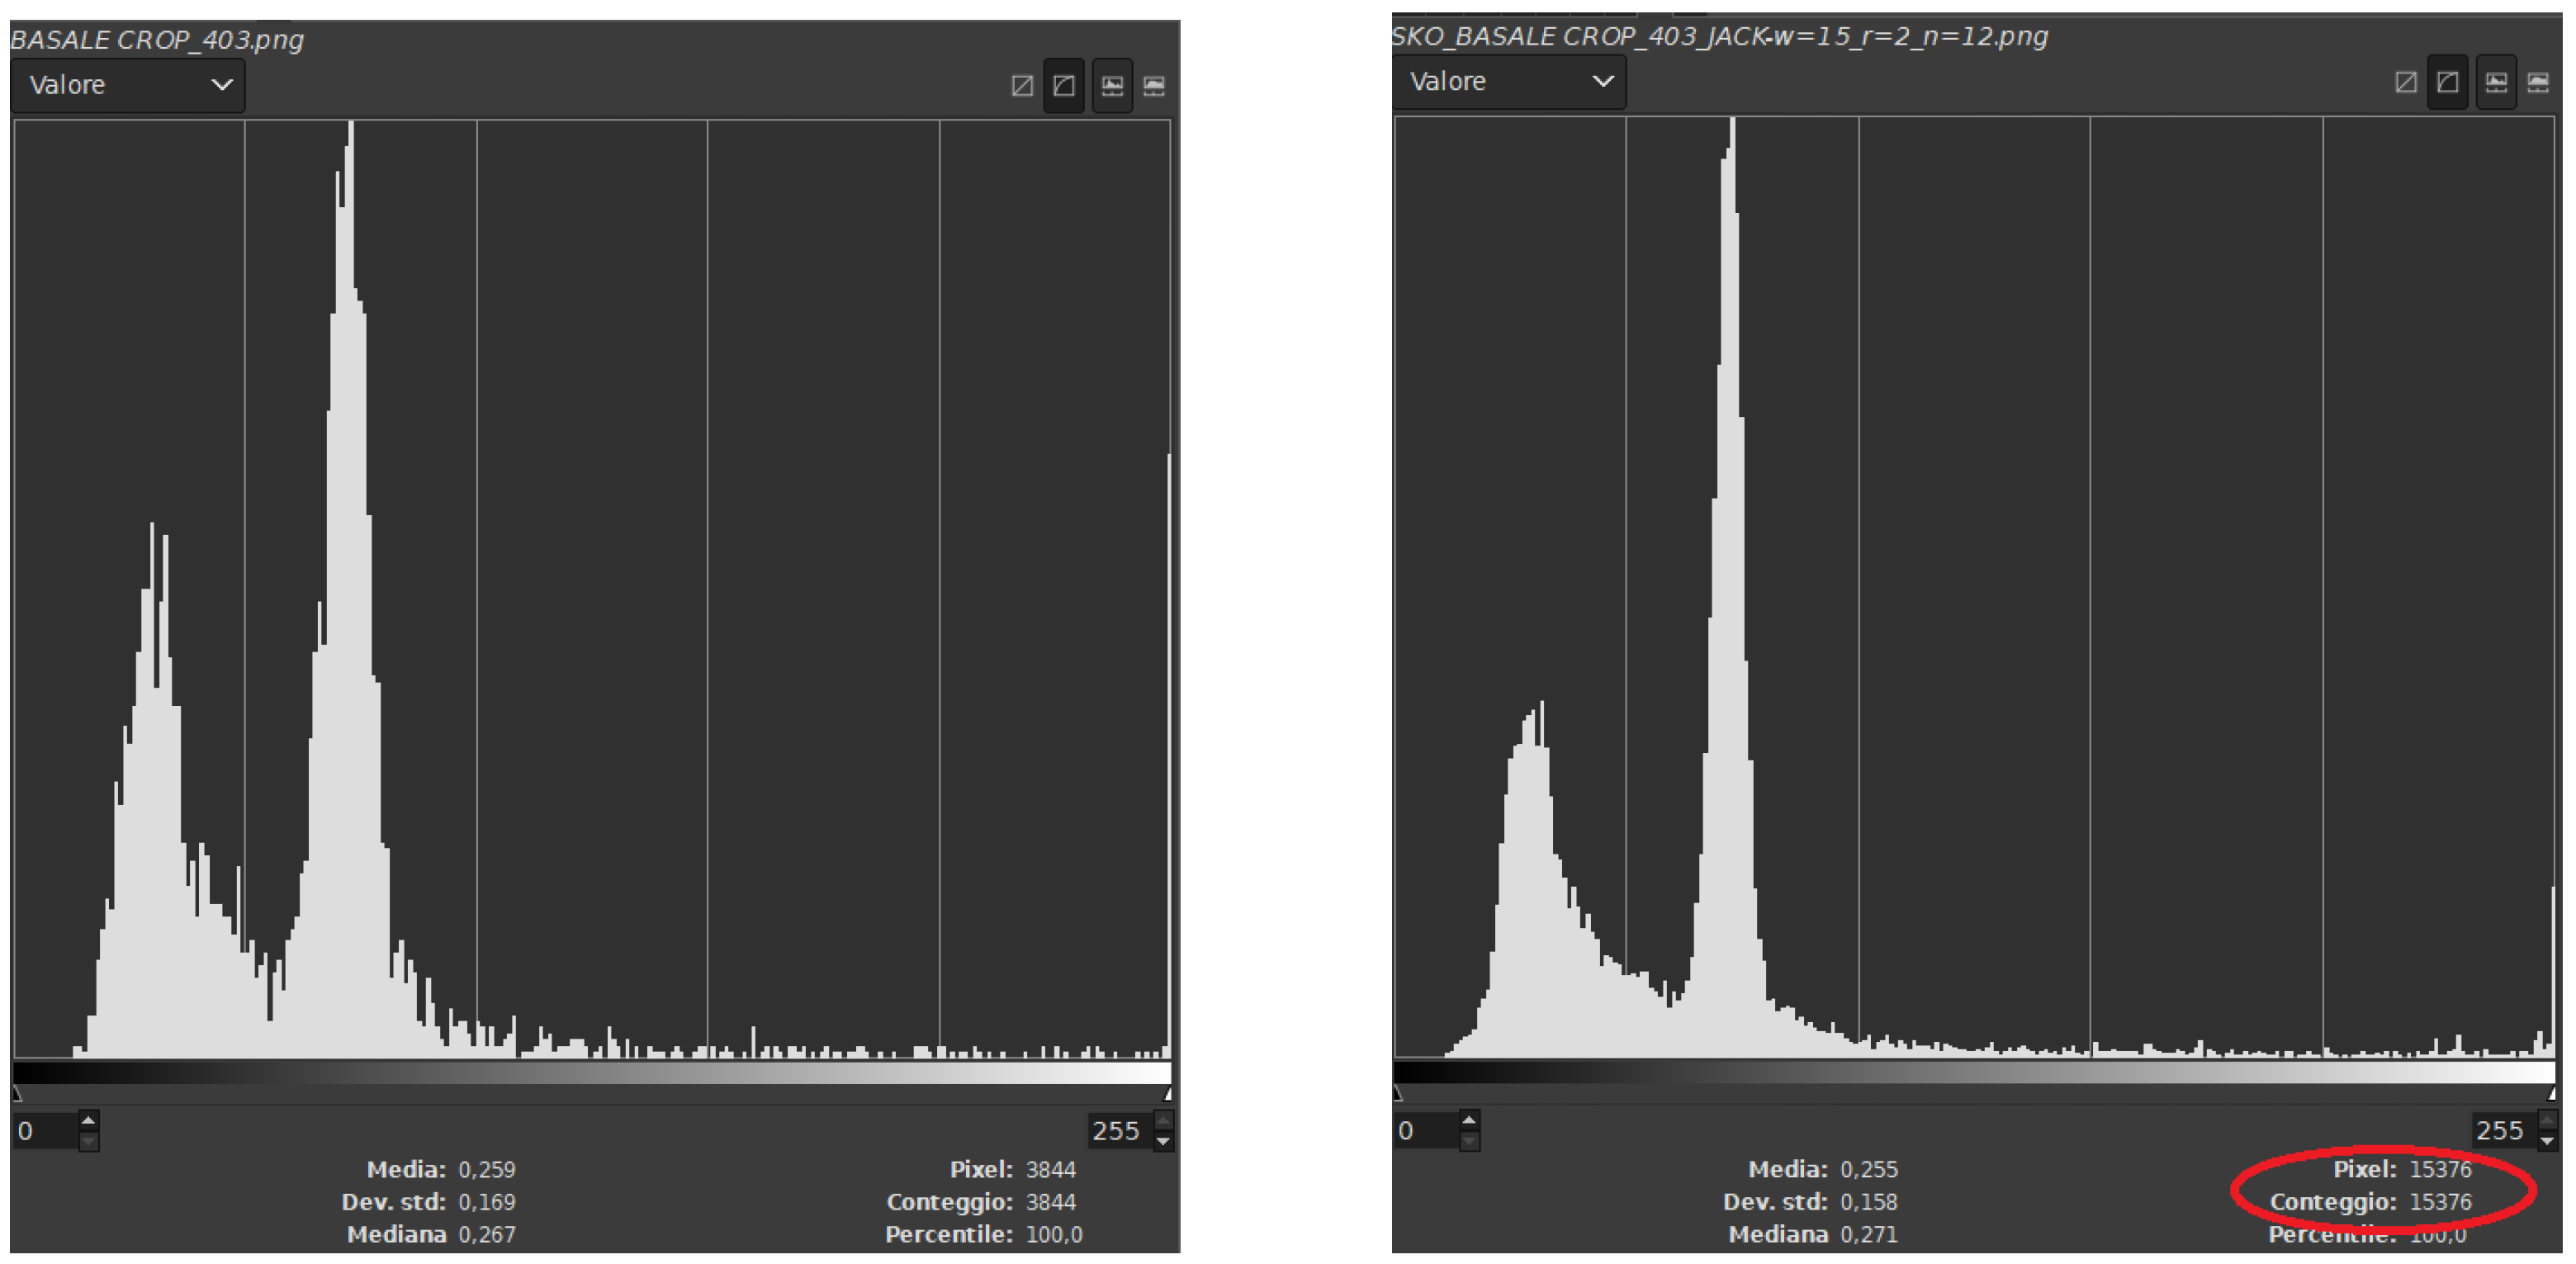
As we can see in the following histograms (
Figure 4), the original ROI used as input image is improved by the reconstruction of the SK operator in terms of increasing the information content and the smoothing effect due to its behavior as a low pass filter, attenuating peaks and ripples in the histogram.
The ROI reconstructed by the SK algorithm is processed by a filter based on the wavelet decomposition [
6,
7]. The algorithm splits the different components of the image into five levels, each one with its own frequencial content, from which we then extract the so called “residual image”, which contains only the low frequency components of the ROI. In order to remove the possible effects of spurious structures, such as plaques of calcium or measurement artifacts, a suitable mask image is used. After that, normalization and equalization procedures are applied to highlight the estimated pervious area in the lumen of the artery. A suitable thresholding procedure is then applied and the image processed by the algorithm is compared, by registration, to the corresponding contrast medium reference image, providing a series of errors (similarity indices) in order to evaluate the accuracy of the proposed method (see [
3]). Among these, we recall the ones that are more meaningful for the numerical analysis of the present study, such as the
Dice Coincidence Index (DCI), the
Jaccard/Tanimoto Index (TI), the
misclassification error and the
bias term . In the following we denote by CM the ROI of the reference image (i.e., with contrast medium) and by
the ROI processed by the SK algorithm and by the subsequent procedures, which lead to the extraction of the patent lumen. The Dice Coincidence Index ([
8]) measures the similarity between two binary sets of points and it is defined as:
where
denotes the number of white pixels in
,
is the number of white pixels in
(i.e., the binary image obtained from CM, applying a suitable threshold) and
is the number of white pixels in both the previous images, denoted by ∧ the logic AND symbol. The Tanimoto Index (TI) [
9], measuring the ratio between the correctly classified pixels and the total number of pixels in the reference and extracted area, is defined as:
The misclassification error indicates the number of misclassified pixels between the extracted zone and the reference set:
where
is the total number of pixels wrongly classified as pervious and wrongly classified as occluded, while the other symbols have the same meaning described above. Thus,
is a representation of the pixels that should be part of the pervious zone and that are considered out of it (they are called
, i.e., false negative), and the ones that should be placed outside the pervious zone and that are wrongly considered inside of it (they are called
, i.e., false positive). We remark that
is a conservative measurement of the error, when compared with the visual clinical diagnosis (
Figure 5).
To evaluate whether the segmentation tends to over- or underestimate the pervious zone, the bias term ([
12]) is used:
where
and
are the numbers of false positives and false negatives, respectively, as explained in the definition of
; similarly,
is the set of true positives. There will be an overestimation of the pervious lumen when
and an underestimation when
.
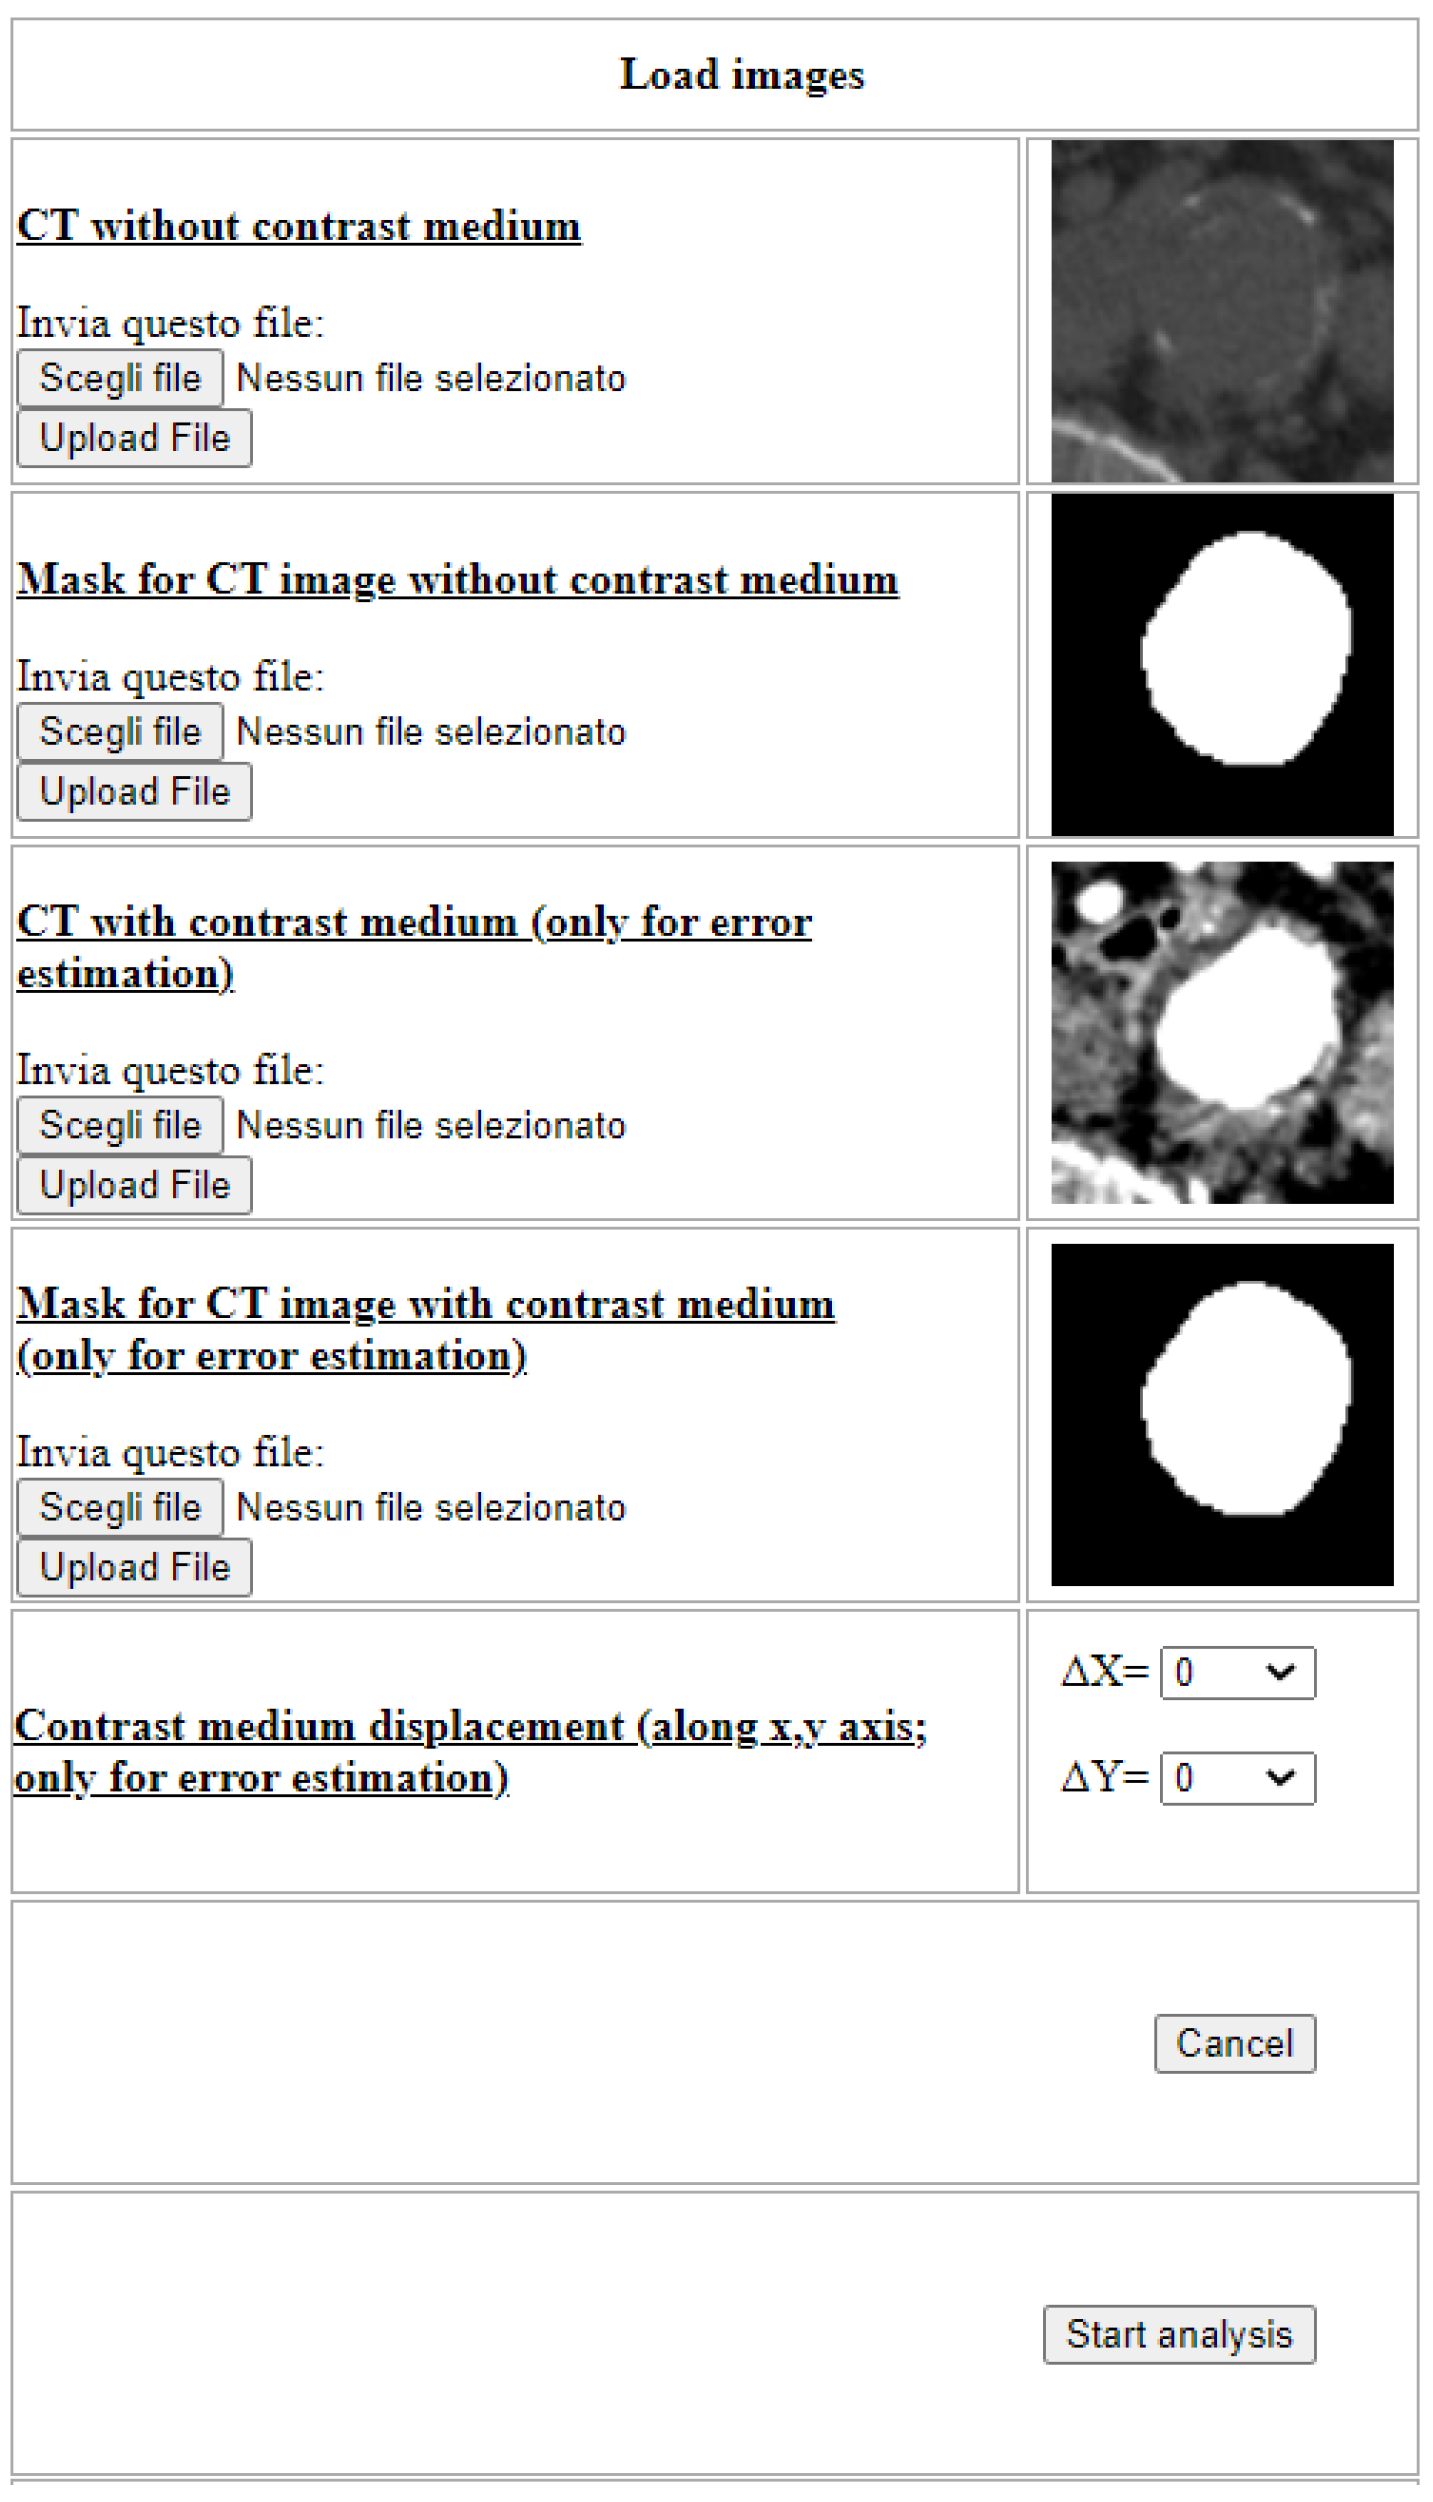
The procedure previously described, together with the error indices, has been automatized and implemented in the PHP language within a web portal, namely
ImageLab, which requires as input the basal ROI and the one with constrast medium, together with their respective masks, as it is shown in
Figure 6.
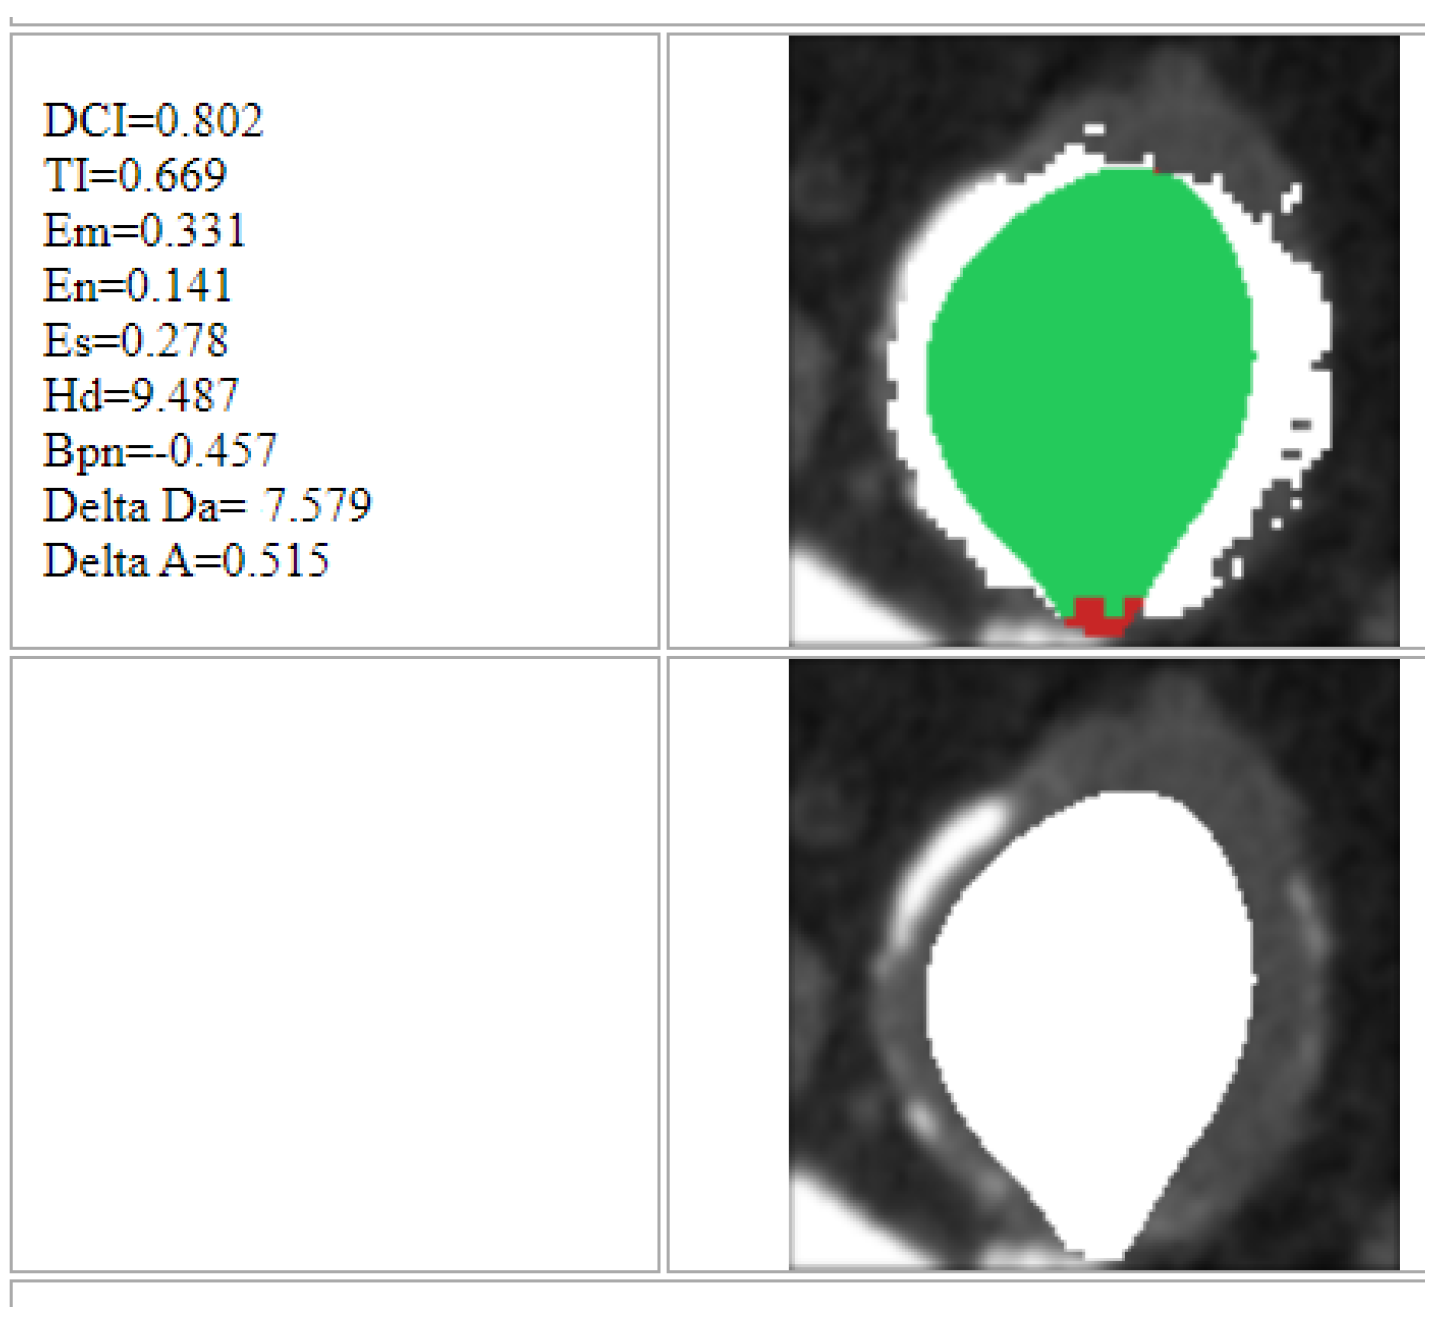
At the end of the process, the platform returns the results for each single image (slice), as shown in
Figure 7. The zone marked by green indicates the area identified by the algorithm which is classified as correct, through comparison with the image with contrast medium. On the other hand, the red zone indicates the area wrongly identified by the algorithm and hence classified as incorrect. Furthermore, finally, the white zone indicates the area highlighted by the contrast medium but which the algorithm was unable to identify.
4. Care Portal
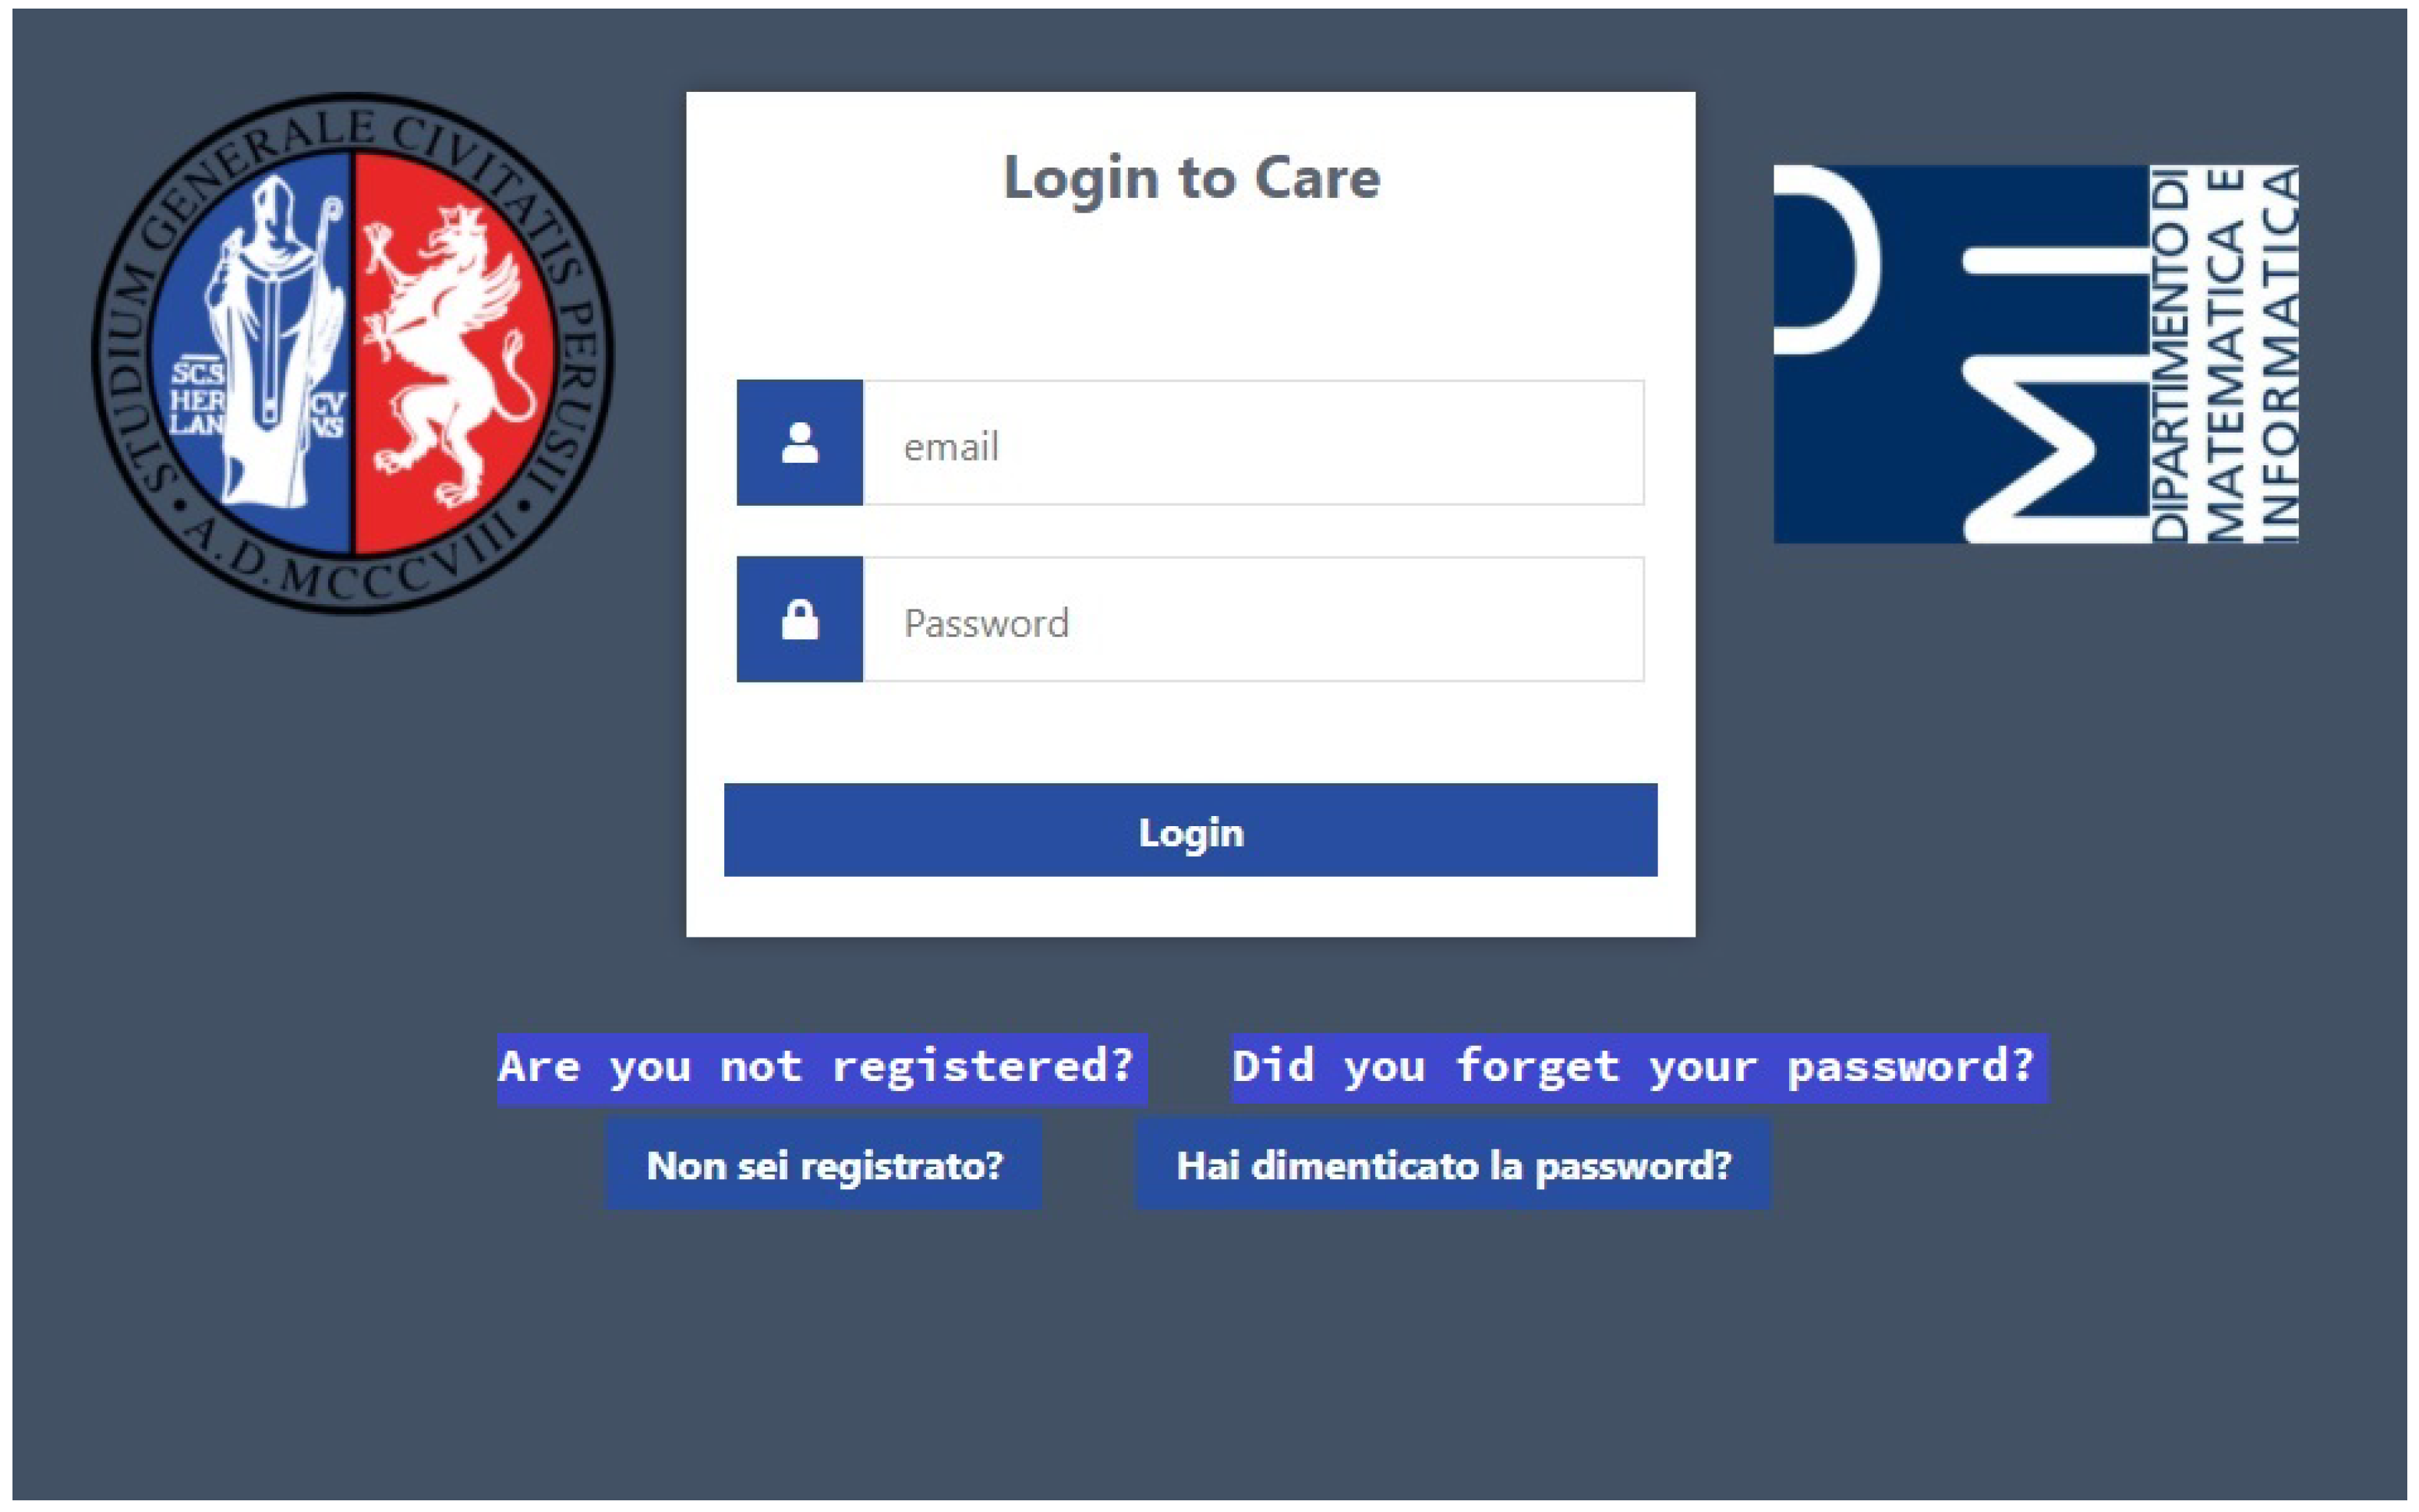
In this section, we briefly describe the Care portal, which allows the interaction between doctors and operators and the work environment, where the images of the patients considered in this study are loaded and processed. This is done precisely to make it clear how this study can practically be useful for an assisted diagnosis of the pathologies examined. The Care portal allows the exams of the patients to be managed before and after the application of the SK algorithm and the whole procedure described above. It allows any user to register, as doctor or operator user (
Figure 8).
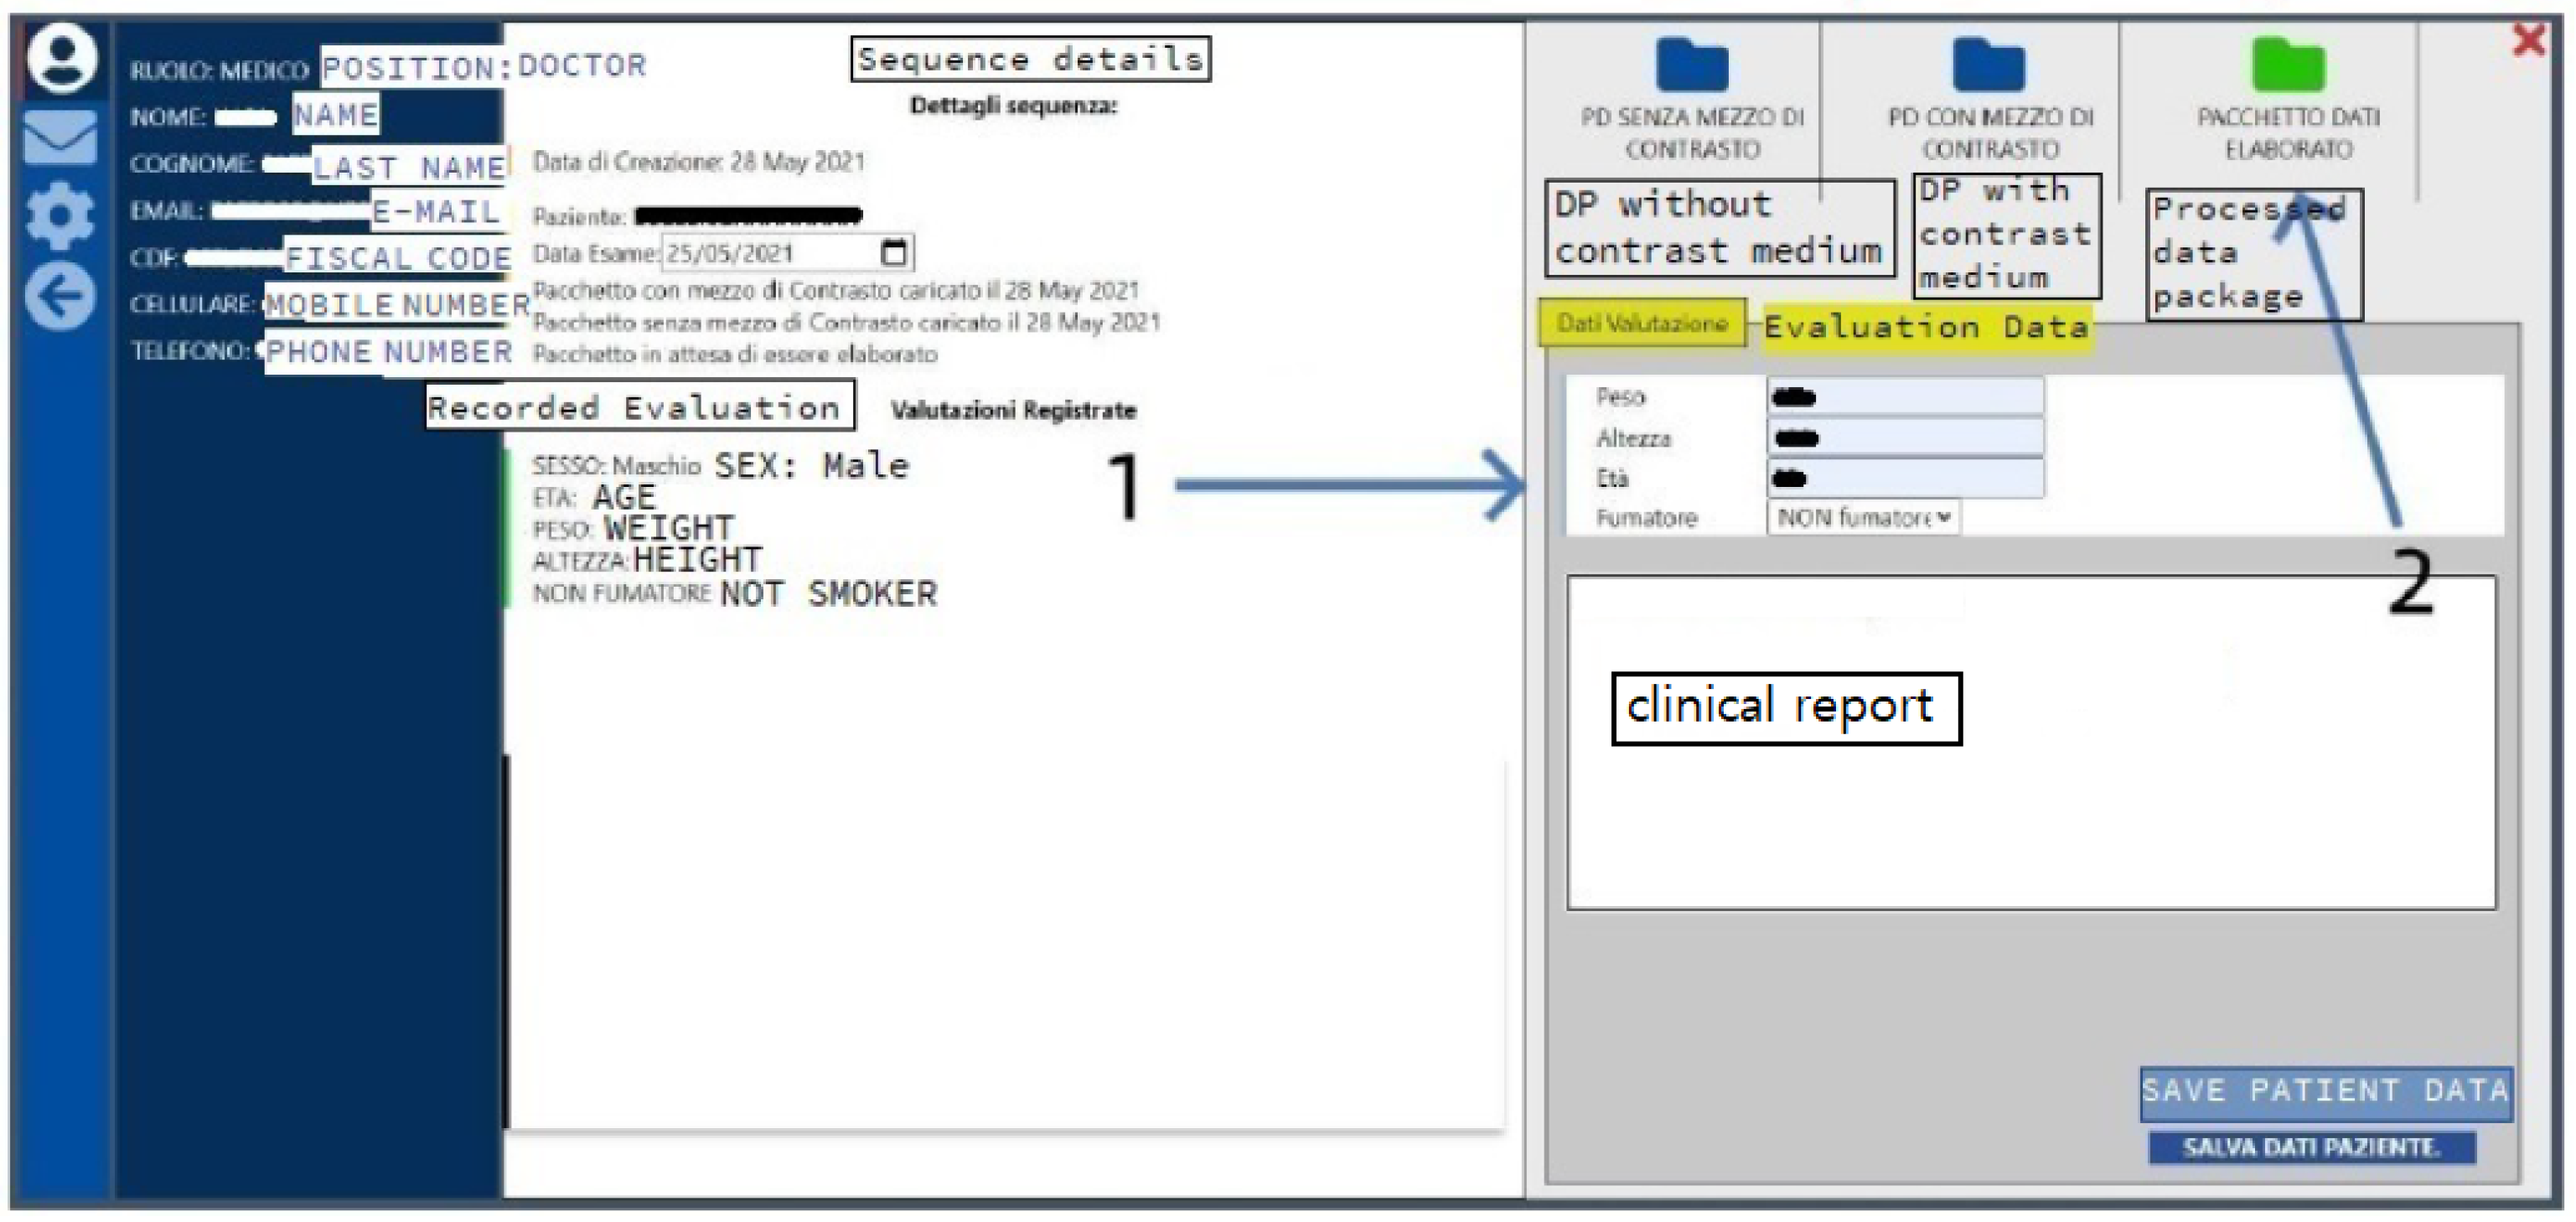
The mutual interaction between doctor and operator begins when the doctor uploads the sequences of images with and without contrast medium, specifying, for each patient, the gender and tax ID code, which will then be anonymized. Once the data packages have been processed by the operator, they are sent back to the doctor user, who can edit some patient data, such as the weight, the height, the age, the smoking habits, and comments about the clinical report (1, in
Figure 9) and can access the processed data, in order to check and evaluate the quality of the reconstructions (2, in
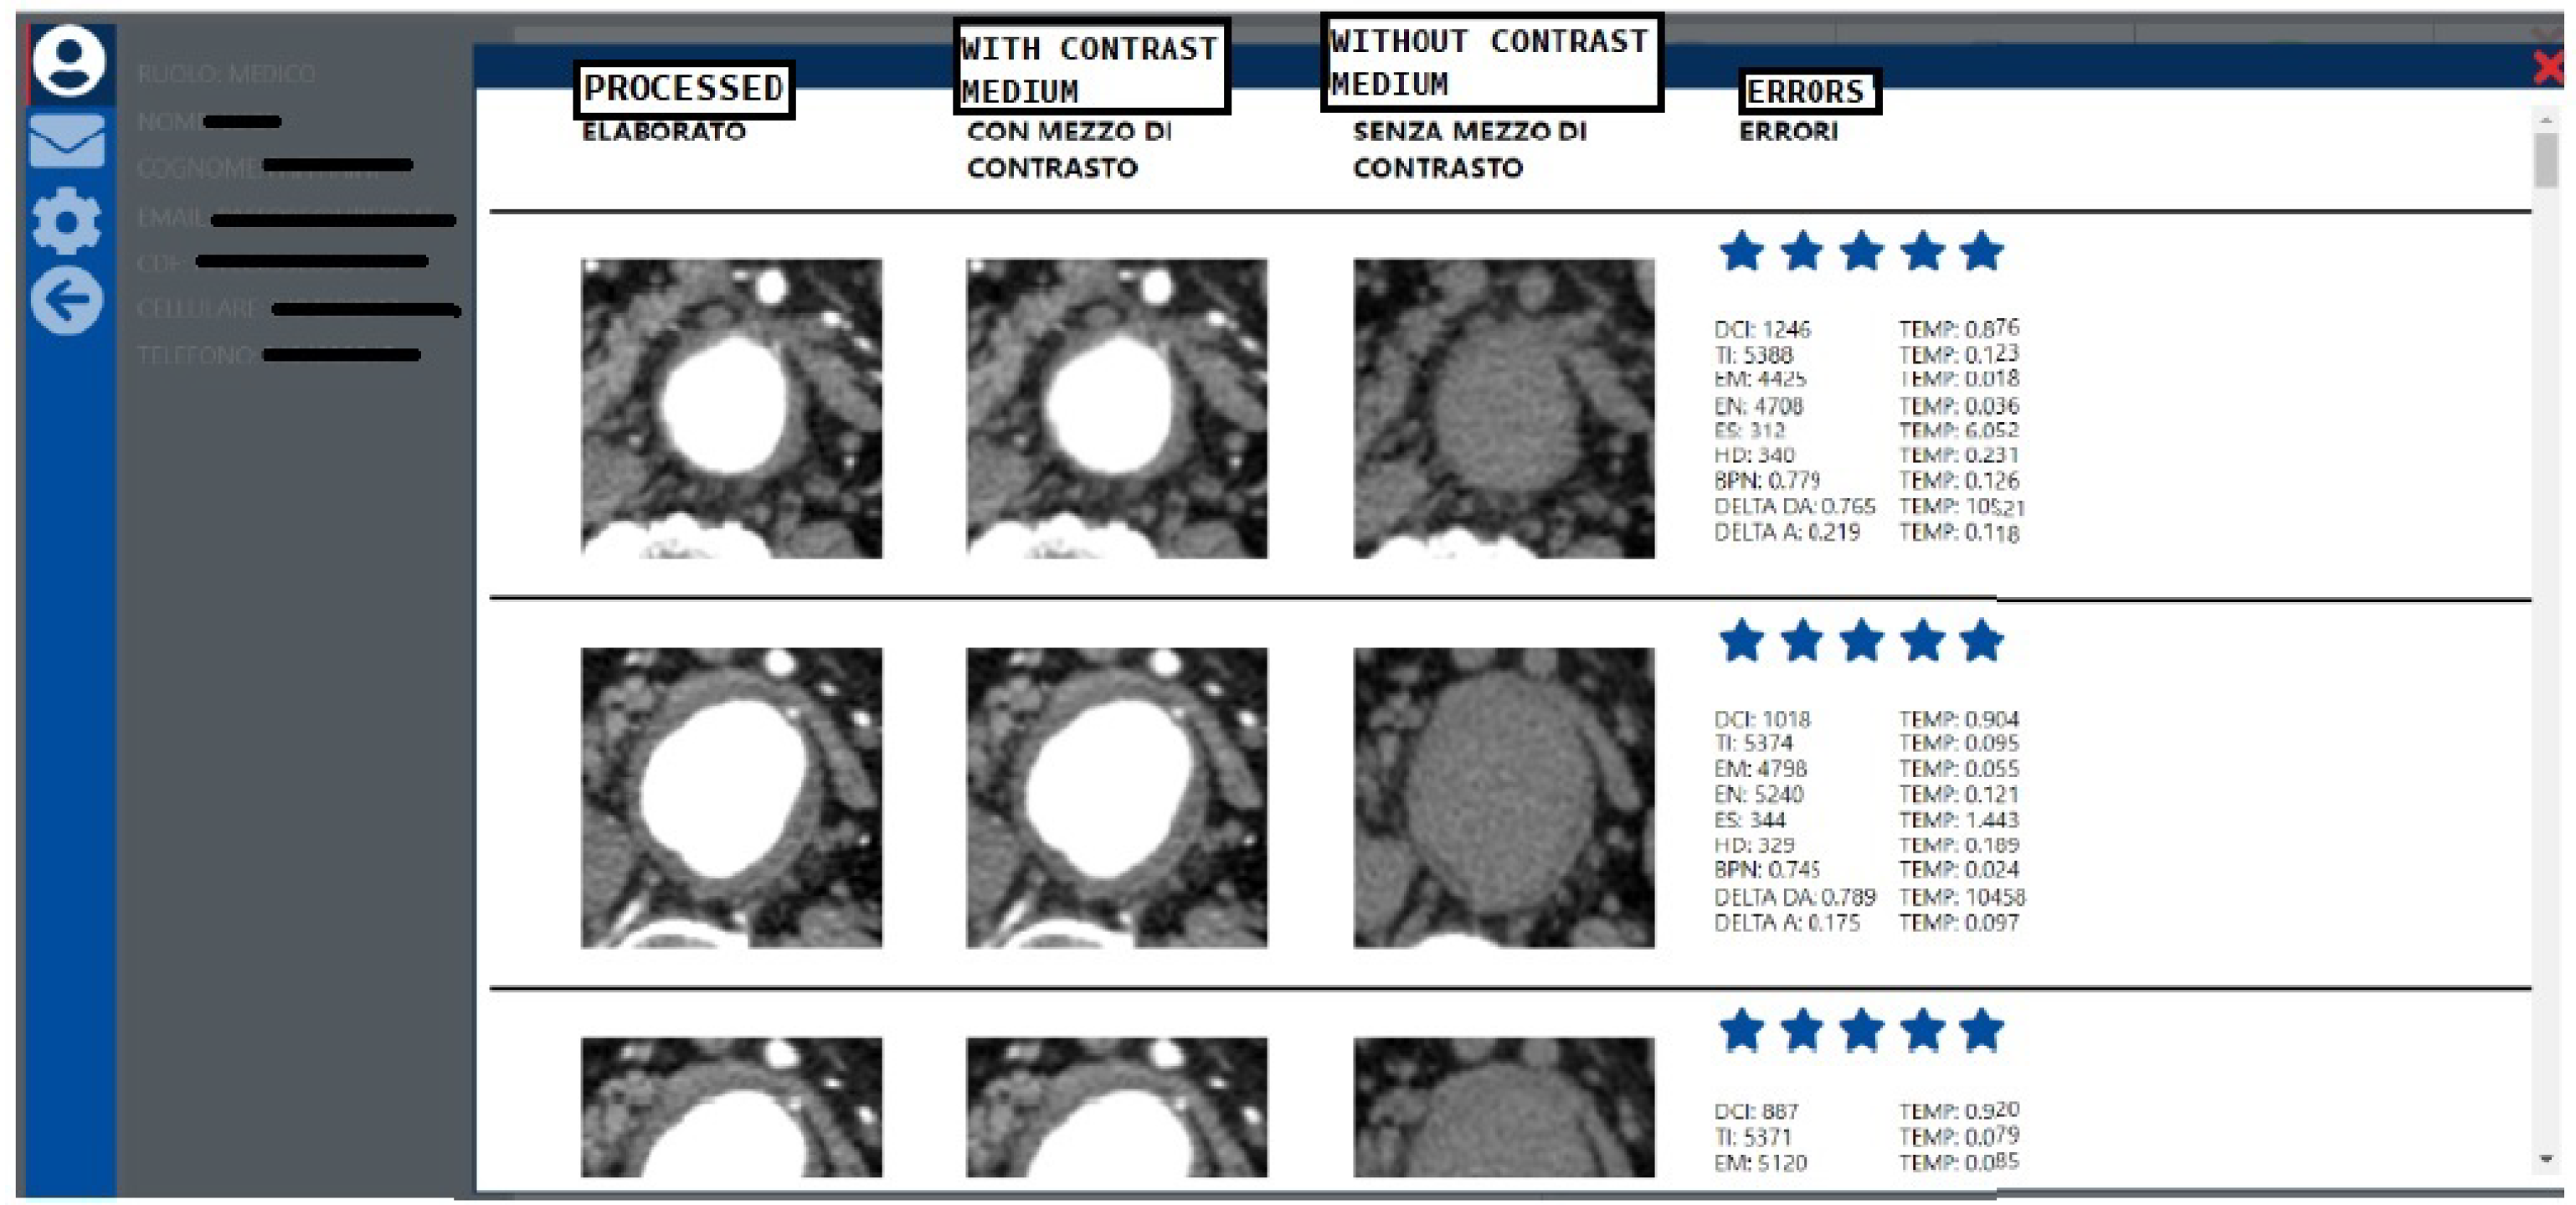
Figure 9) in terms of a clinical diagnostic point of view. The relative interface is shown in
Figure 10, where the doctor can rate (e.g., in terms of stars) the images displayed in each row. The errors, described in
Section 3, are also shown summarizing the quantitative numerical results.
5. Experimental Data
Patients were recruited after signing informed consent and met the following requirements:
Patient with moderate/severe atheromatous disease of the abdominal aortic tract;
Absence of severe renal pathologies, which would have prevented the use of the contrast medium during the examination.
After enrollment, patients underwent a CT exam with the injection of contrast medium, the gold standard procedure for the diagnosis of vascular disease. The doctors then uploaded to the Care portal the images, with and without contrast medium, resulting from the CT exam.
The study was performed on a large scale, considering 13,677 CT images (total number) from 15 patients. We remark that, for this study, the number of patients is not as important as the number of images to be processed.
In this regard, it should be noted that the images have been totally anonymized during their insertion on the portal, rather than preserving the original file DICOM (.dcm).
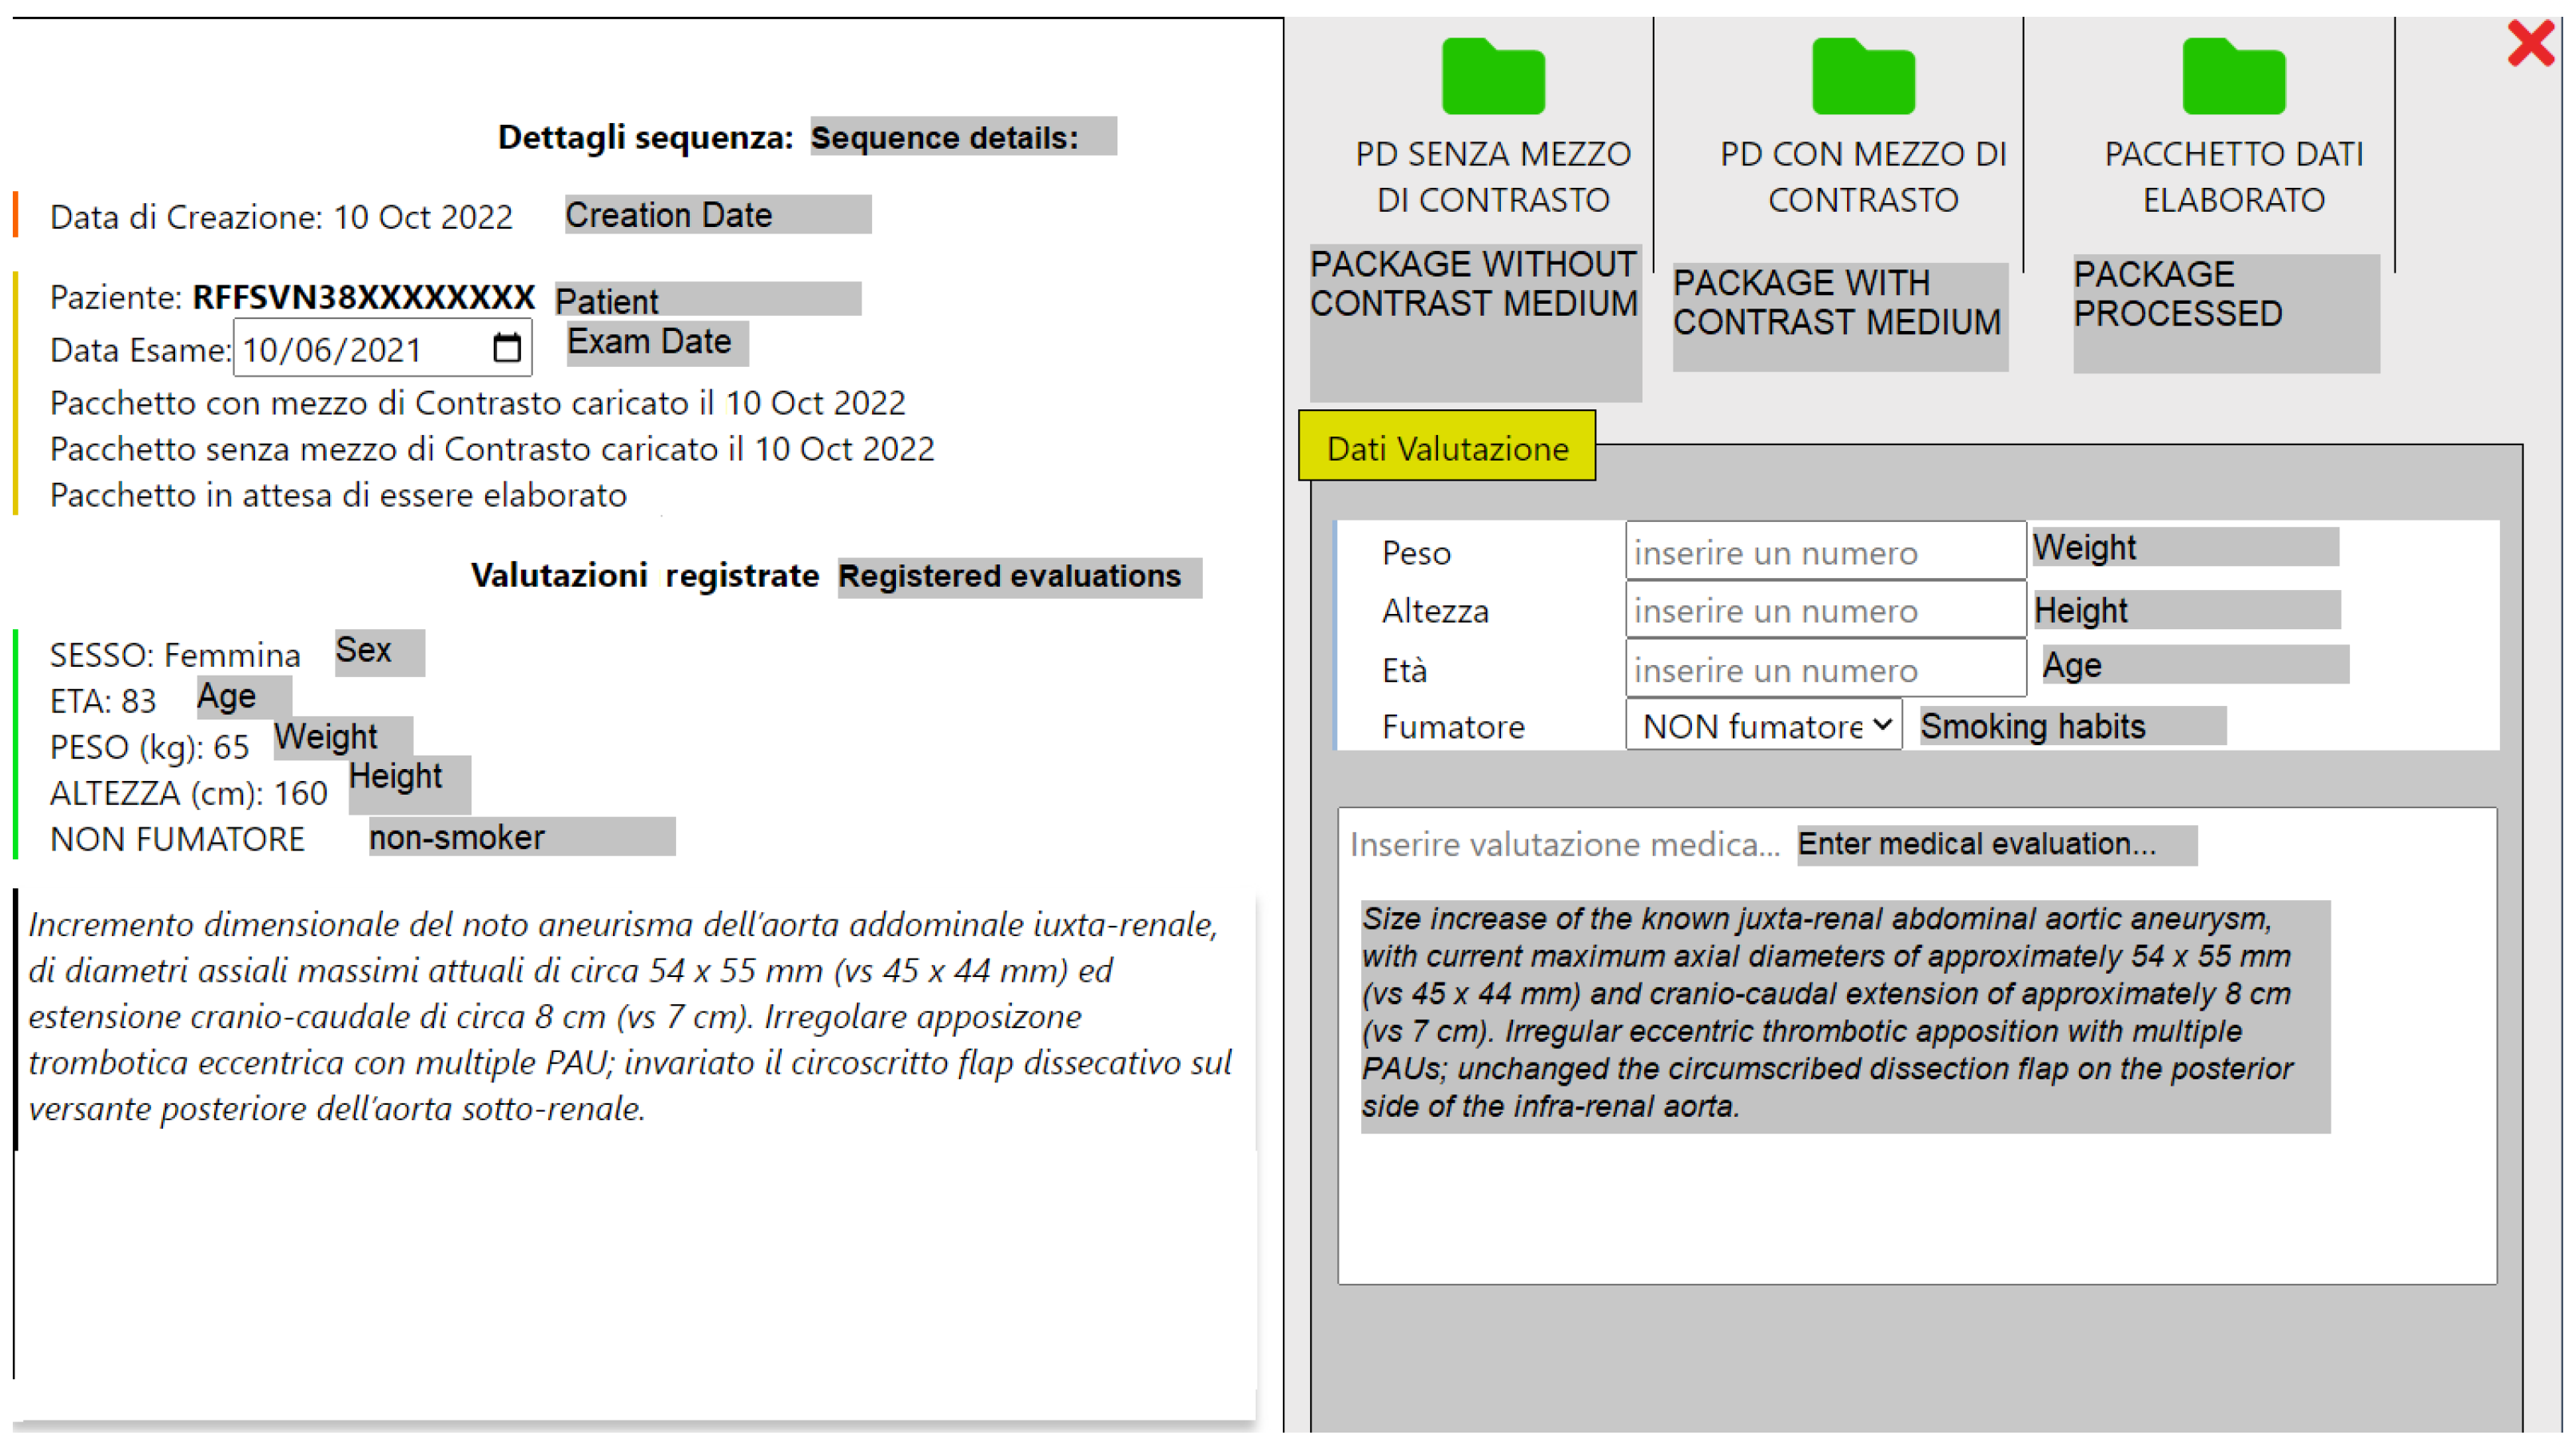
After downloading the images, the operator users proceeded to process them, applying the previously described algorithms, entering the results again on the portal, with the purpose of making them available for clinical evaluation by doctors. In addition to the clinical evaluation, based on a system that provides a rating from a minimum of 1 to a maximum of 5, the doctors edited some patient data, such as the weight, age, height, if smoker or not, and the medical evaluation (report) of the examination, as shown in
Figure 11.
We specify that the slices which do not include the aneurysmal area have been excluded, together with those ones that present some artifacts that would not have been useful from a clinical point of view and would have otherwise affected the outcome of the algorithm.
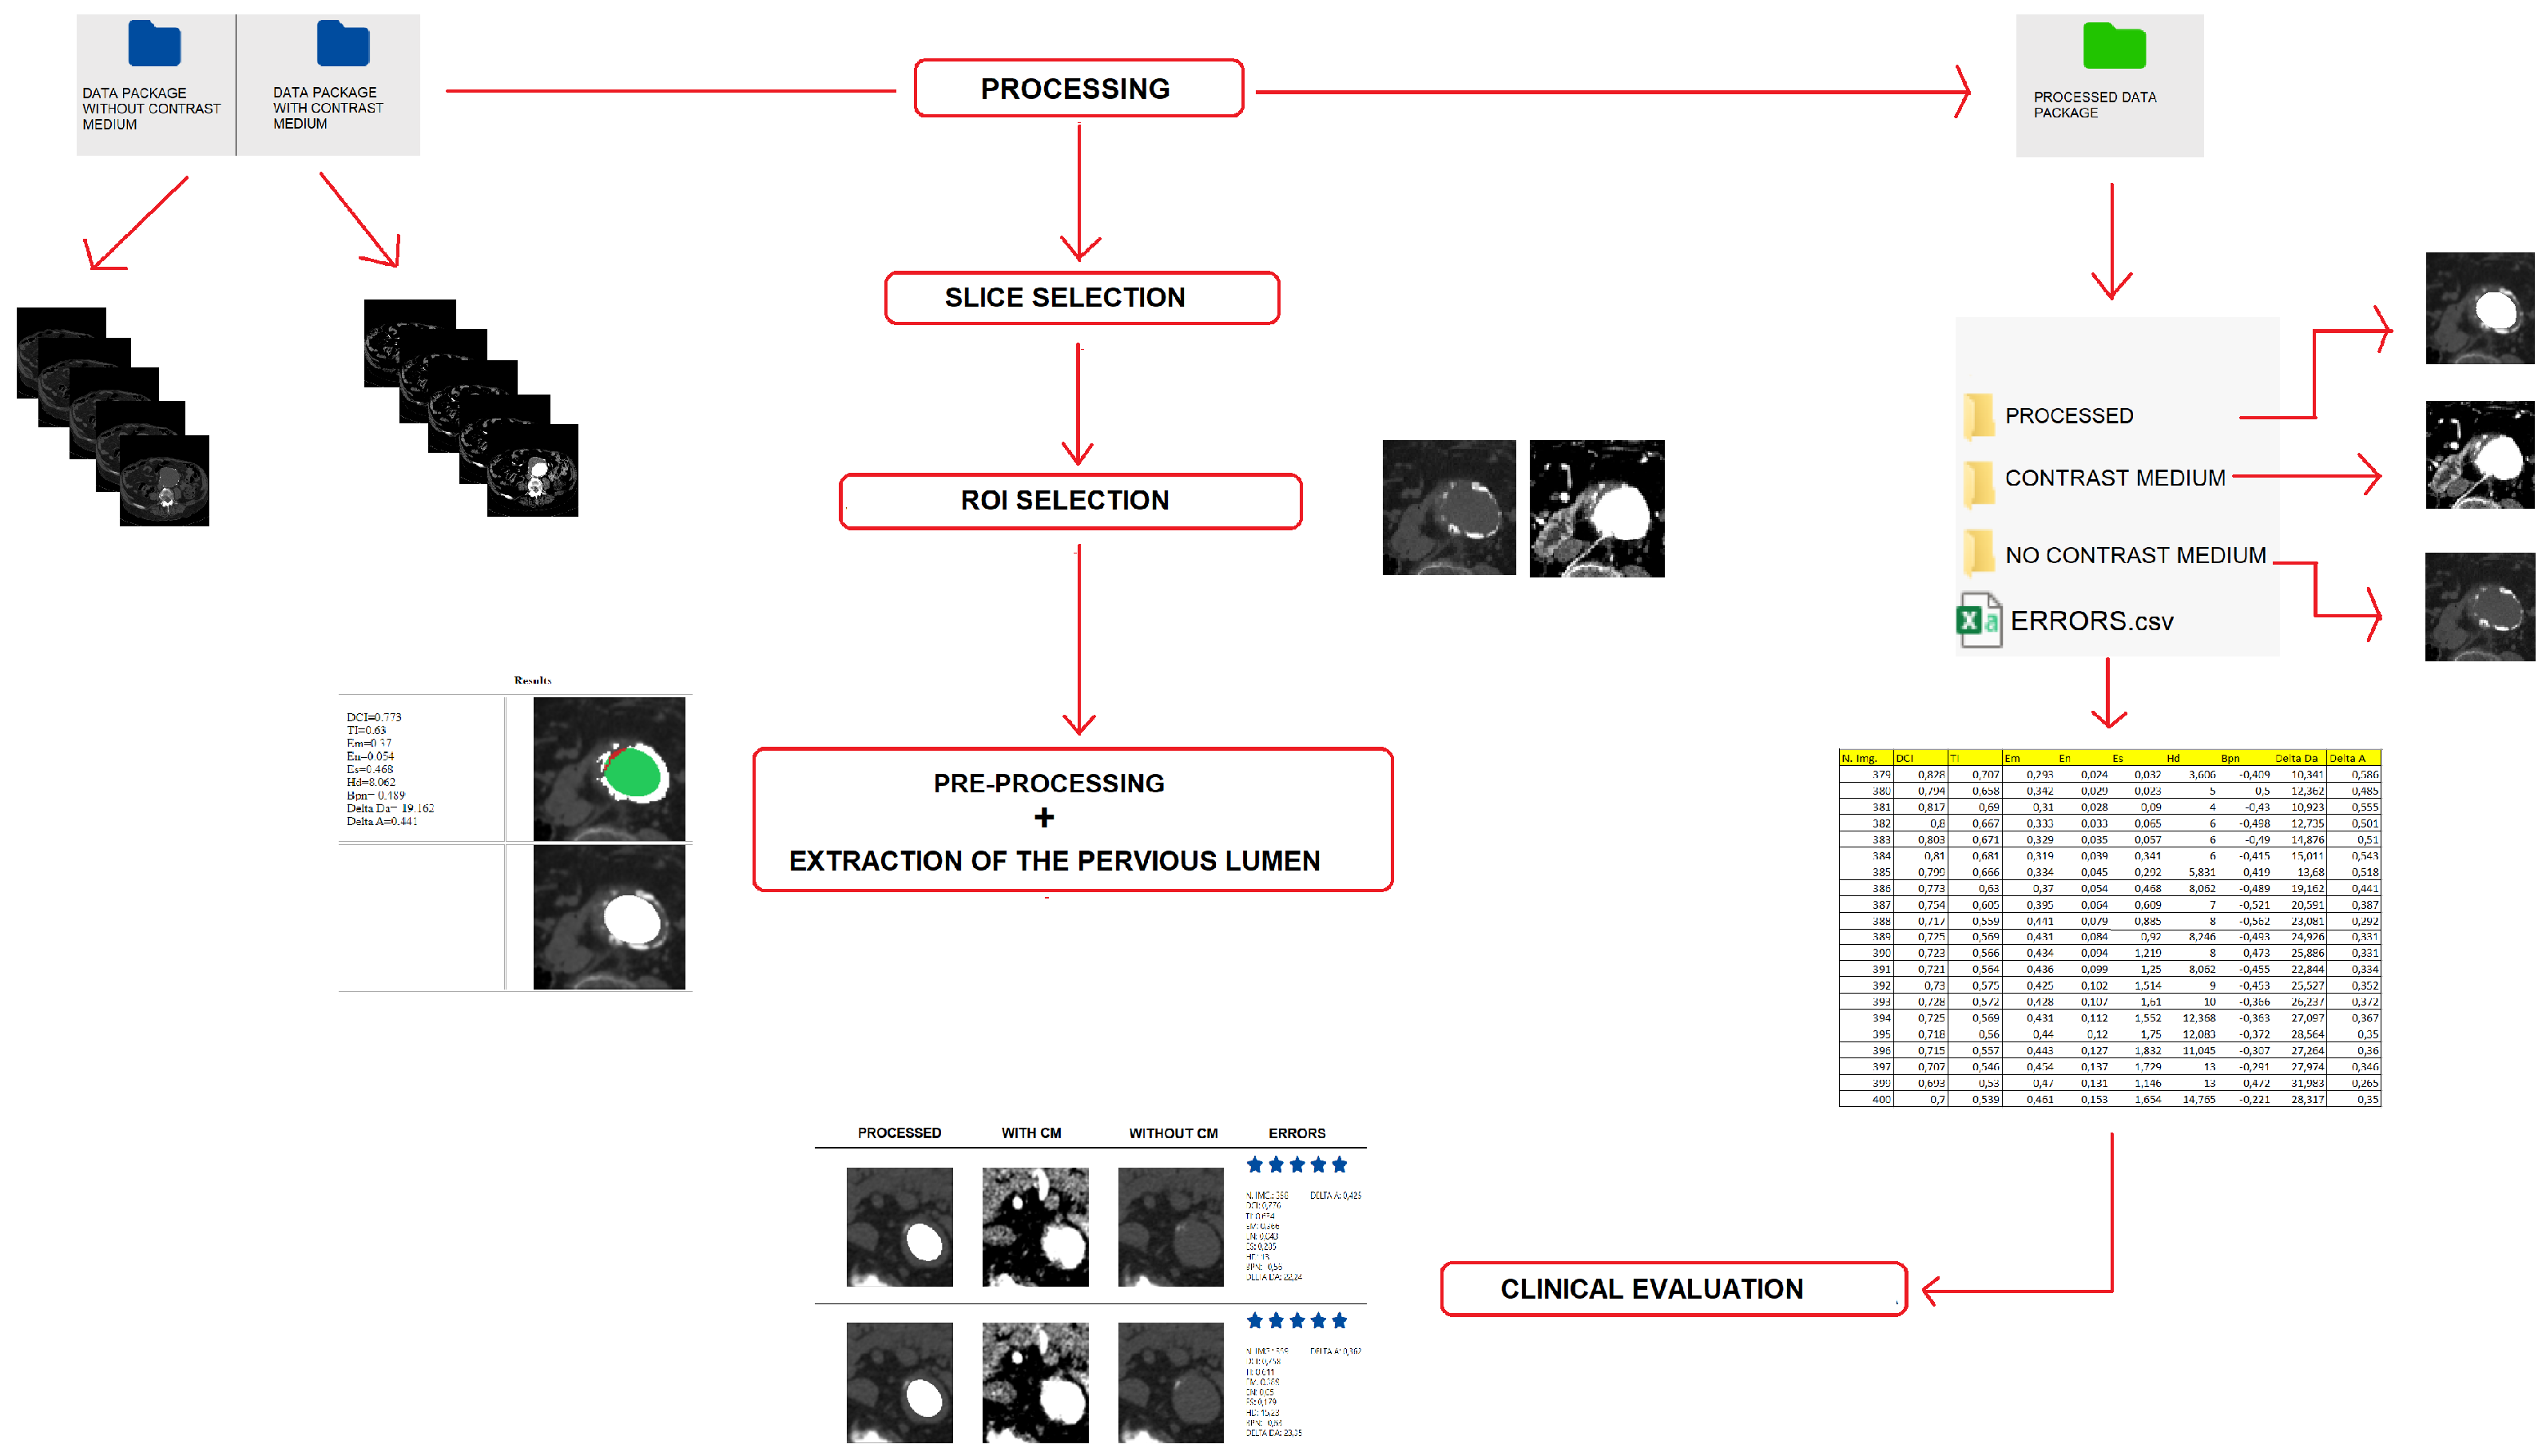
The process related to the procedure and phases of the processing of the CT sequences is illustrated in
Figure 12 and is organized as follows:
The medical user uploads the data packages with and without contrast medium to the Care portal, entering the patient’s anonymous tax ID code, their gender and the date of the exam.
The operator user downloads the data packages entered by the doctor user and selects only the images that represent the aneurysmal area. These images are pre-processed: selection of the ROI through cropping and creation of binary masks that indicate to the algorithm which area to consider.
The processing of the sequences is carried out through the mathematical algorithms developed for the segmentation of the patent lumen of the aortic vessel without the use of the contrast agent, which have been implemented and automated in the platform ImageLab. At the end of the process, the platform returns the results for each single image (slice), as in
Figure 7 of
Section 3.
The operator user uploads the results of the processing to the Care portal in a zip folder containing the processed images, the images with contrast medium, those without contrast medium and the excel file with the errors related to each processed slice.
The medical user downloads the processed data package and evaluates each slice with a score from 1 to 5, and can then edit the patient record, entering other data, such as age, height, weight, if smoker, in addition to medical evaluation of the examination.
6. Numerical Results
In this section, we analyze the numerical results of the present study. Each of the 15 exams considered required a large amount of data, since the CT images ranged from a minimum of 230 up to a maximum of 721 images, both for basal sequences (NO CM) and for those with contrast medium (CM).
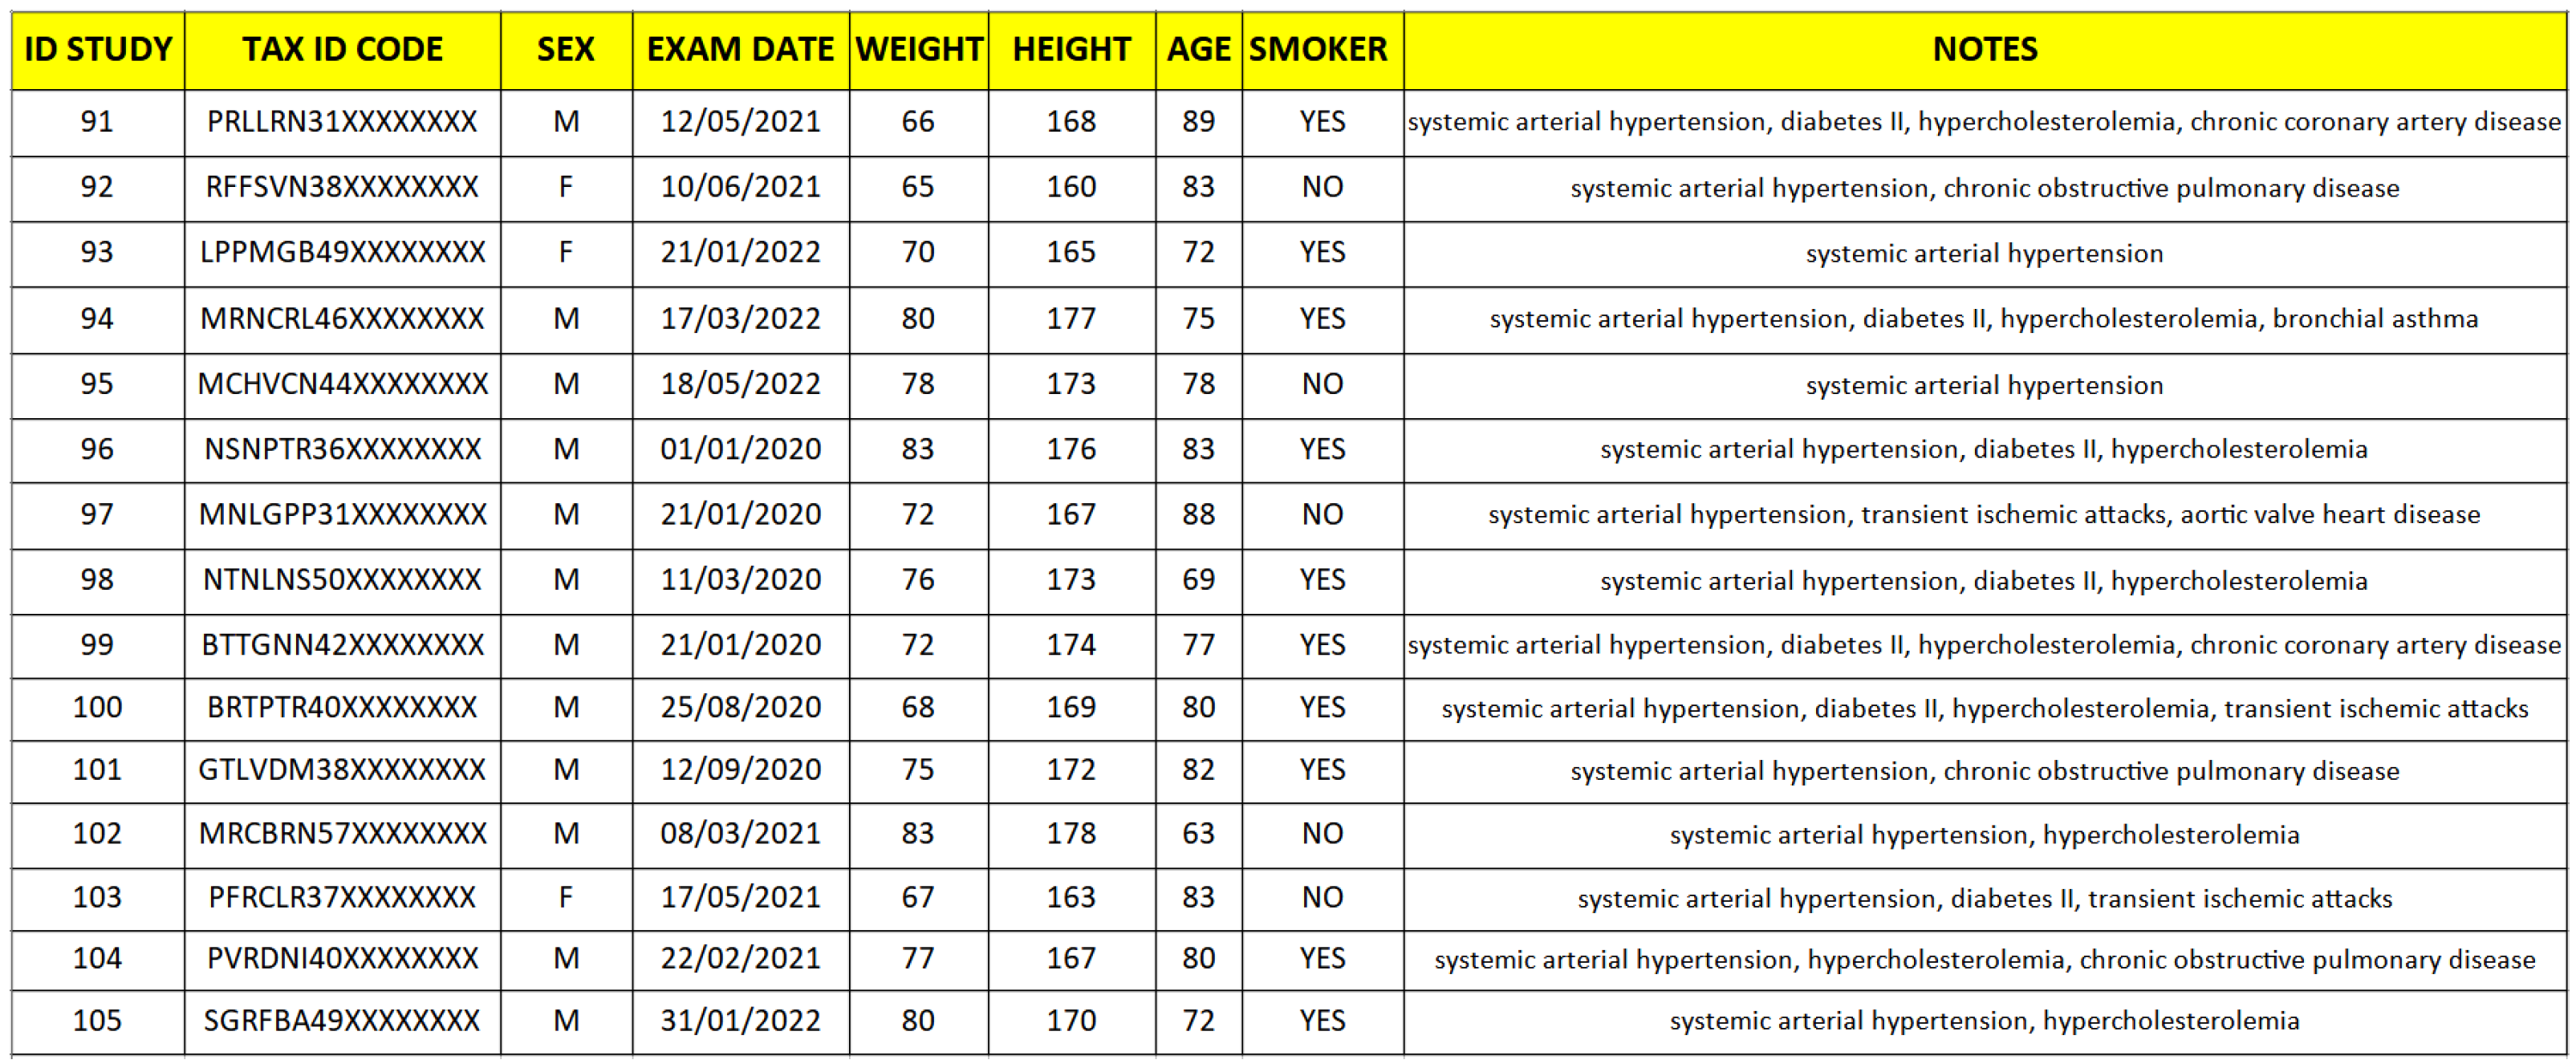
The patients who were the subject of this trial, as can be seen from
Figure 13, were both male and female, aged between 65 and 83 years and characterized by a history of systemic arterial hypertension, diabetes, hypercholesterolemia, chronic obstructive pulmonary disease, chronic ischemic coronary artery disease, aortic valve heart disease, transient ischemic attack or bronchial asthma. It should be pointed out that the male sex is more subject to the pathology studied and this explains the numerical difference between the two sexes in the cases taken into consideration. These are the only clinical data needed, as most of the fundamental data for the study is represented by the images to be processed.
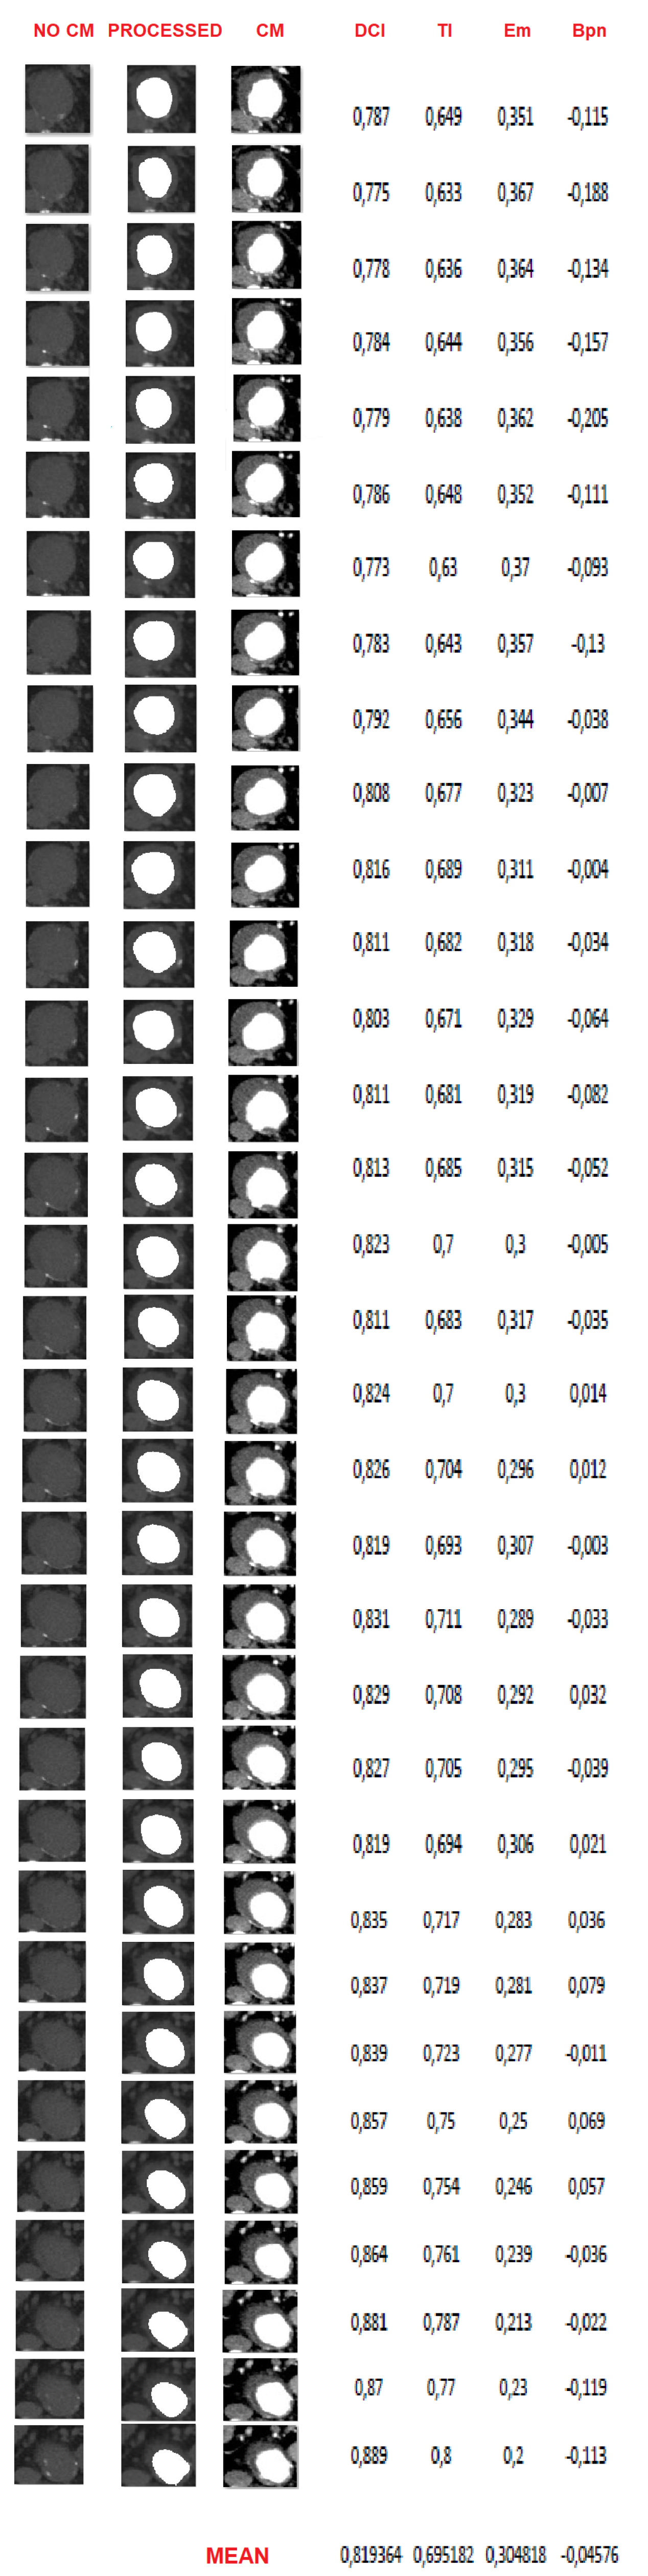
As an example, in
Figure 14, there are the results of the processing of one of the 15 patients. On the left there is the basal image after the cropping process; only the aortic vessel needed to be highlighted, from which the patent lumen is to be extracted. At the center, instead, we have the reconstruction of the vessel using the SK and subsequent segmentation algorithms. Finally, on the right there are the related images with contrast medium, as reference. As can be seen, visually the algorithm is able to extract the patent area, with a fairly good degree of accuracy compared with the reference image. This is also confirmed by the trend of the error rates. In particular, the Dice Index (DCI), which measures the white pixels correctly classified by the algorithm, is on average greater than 0.82 (rounded), which indicates that the reference image (with the contrast agent) and the image extracted by the algorithm have a match greater than the 82%. A similar positive trend can be found for the Tanimoto Index (TI), which measures the ratio between correctly classified pixels and the total number of white pixels present both in the image extracted by the algorithm and in the reference one. The misclassification error (
), which gives us a measure of misclassified pixels (occluded ones classified as pervious and vice versa), despite having been implemented in such a way that it conservatively estimates the lack of similarity between the two images, is on average no higher than 0.3 (rounded) and represents the complementary of TI. Finally, the bias index (
) mainly settles on negative values (average lower than −0.04), indicating that the algorithm tends to slightly underestimate the patency area, a characteristic that turns out to be positive from a clinical point of view, as it offers a more pessimistic assessment of the aneurysmal area.
A similar positive trend can be seen from the averages made for the other patients, as visible in
Table 1. For completeness, we report in
Table 2 the average of the four fundamental indices made on all the images of all the patients subjected to the study.
From the reported data it emerges that for all patients the DCI is never lower than 0.74 (rounded) and the TI always remains between 0.6 and 0.7 (rounded). Inverse tendency to TI is seen for the
index, while the
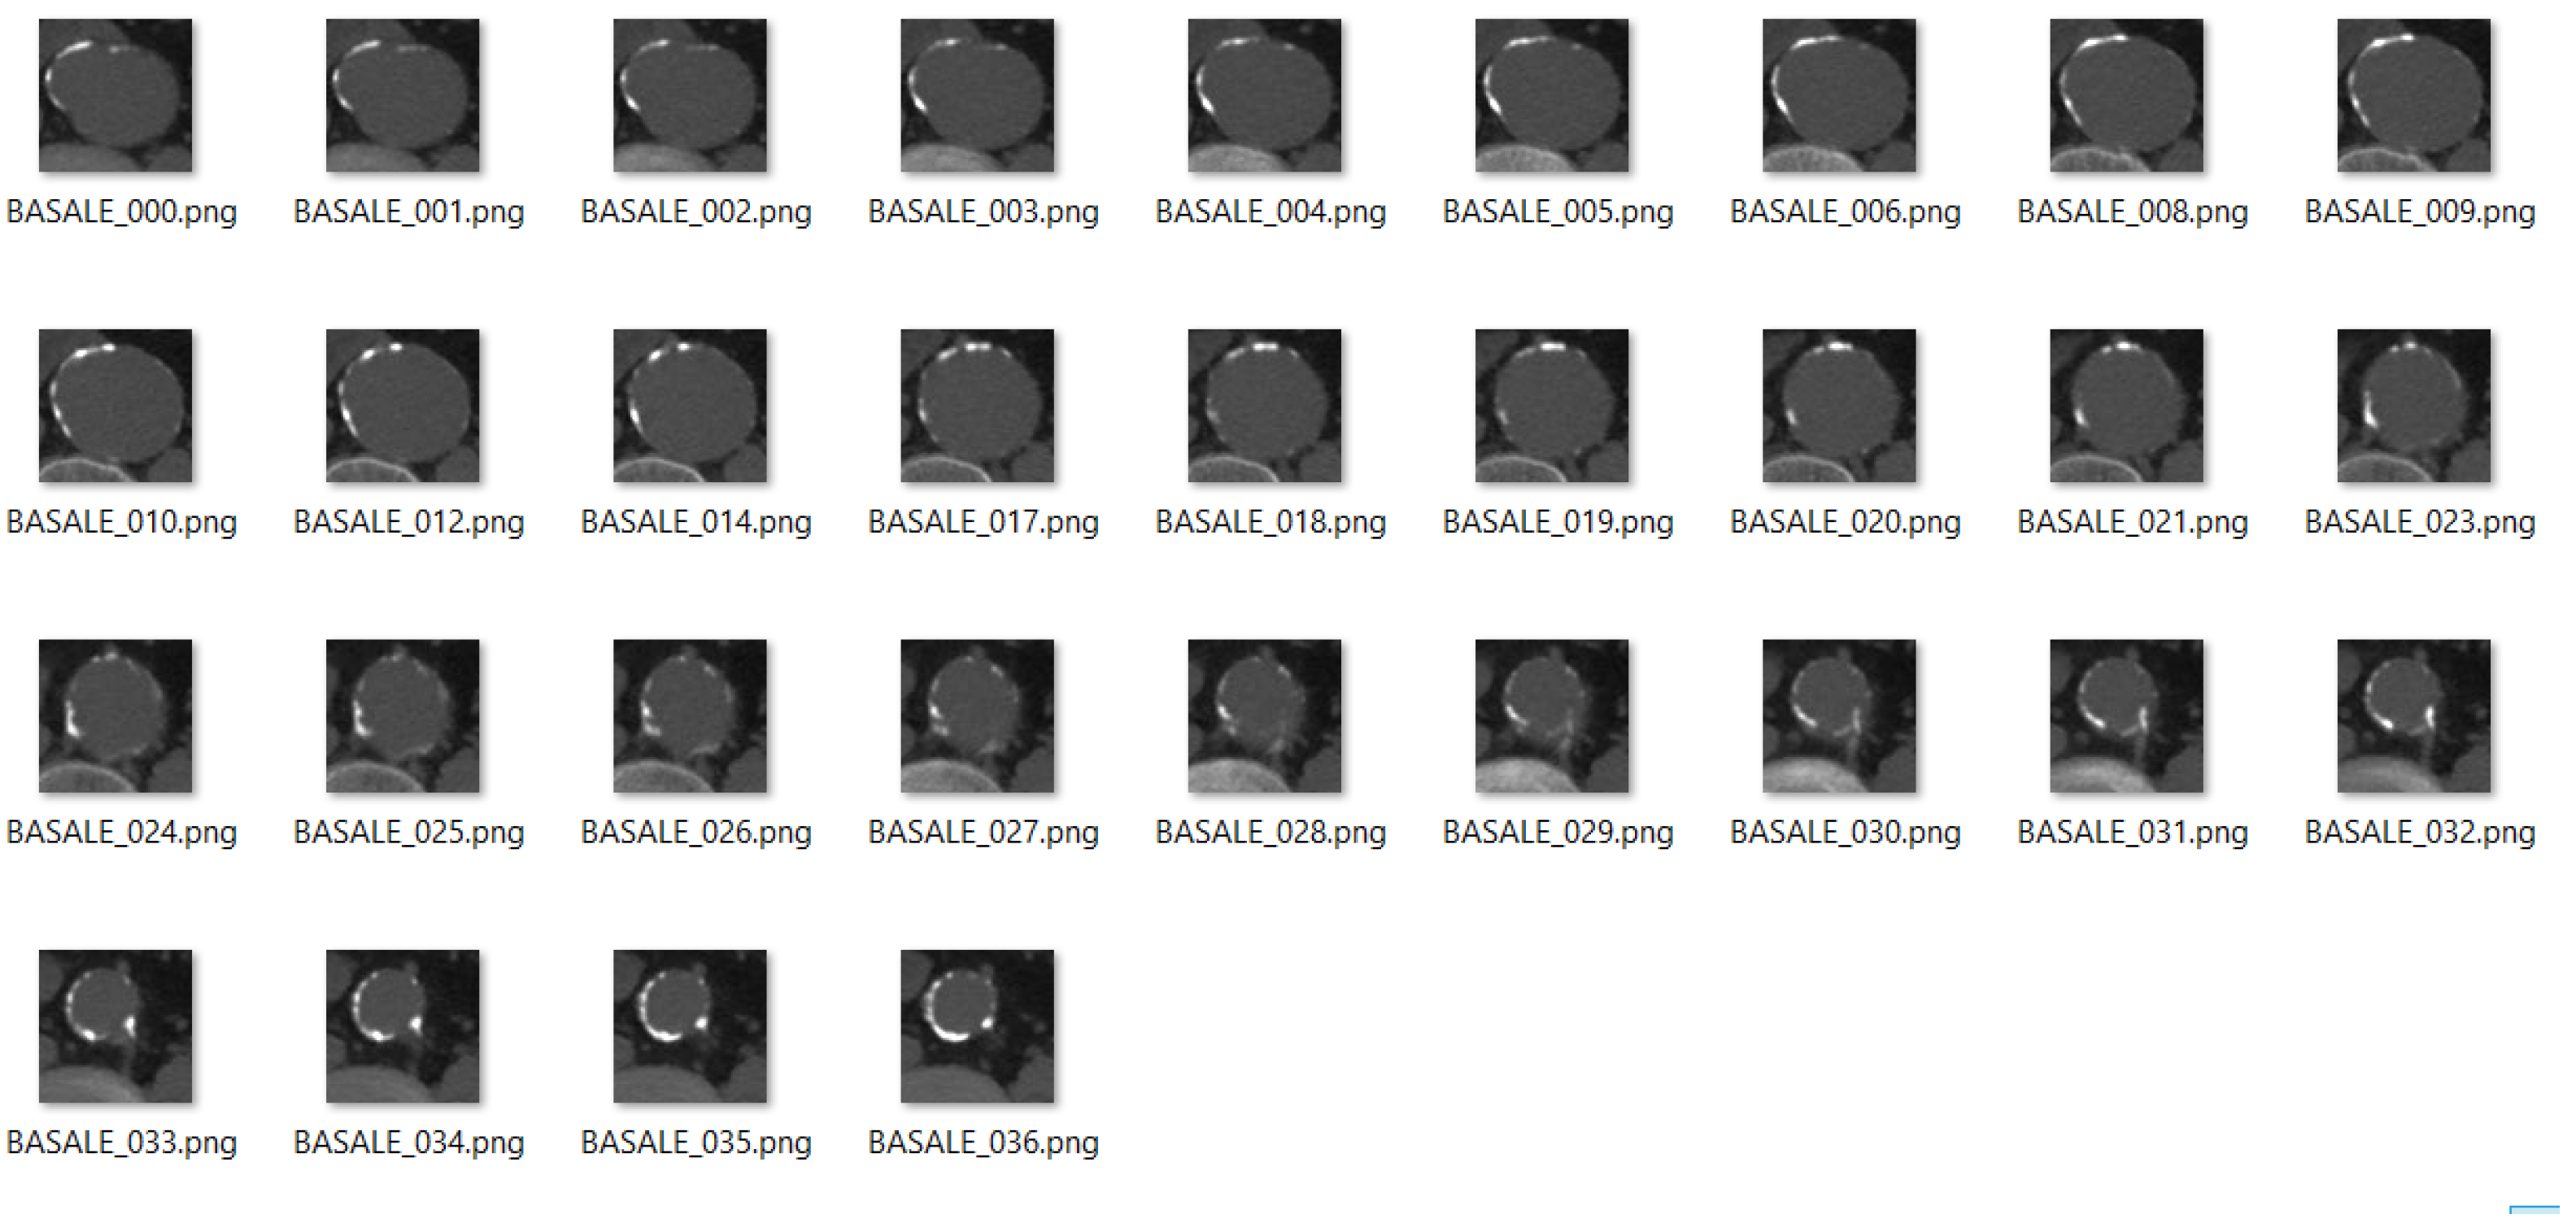
is always negative. In particular, ID 105 has an average
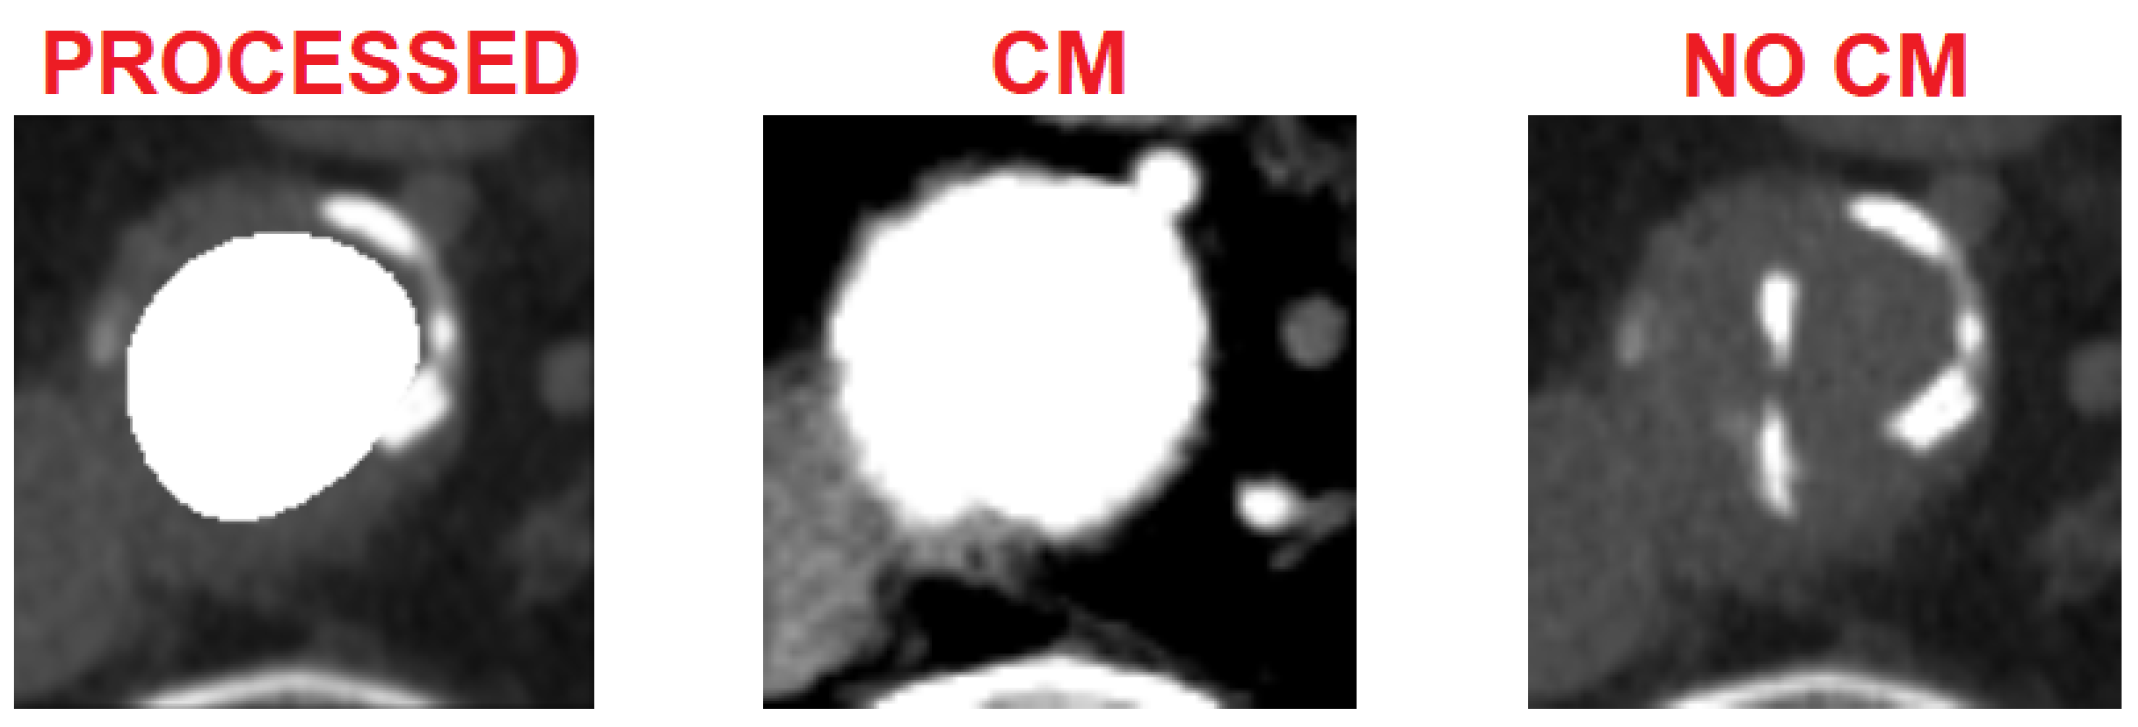
of −0.7, probably due to the presence of severe aortic atheromatous disease, as evidenced by the localized and consistent calcium plaques that can be seen in the basal images (
Figure 15). Indeed, in this case, the algorithm tends to underestimate the pervious area because, by isolating the calcium plaques, it identifies a circular area delimited by them (
Figure 16).
Furthermore, it must be considered that the case under examination is particularly interesting, since the lumen of the aortic vessel is completely patent, as visible from the CT images with contrast medium (
Figure 17), and, this being an unusual case, it is important for testing the mathematical algorithm.
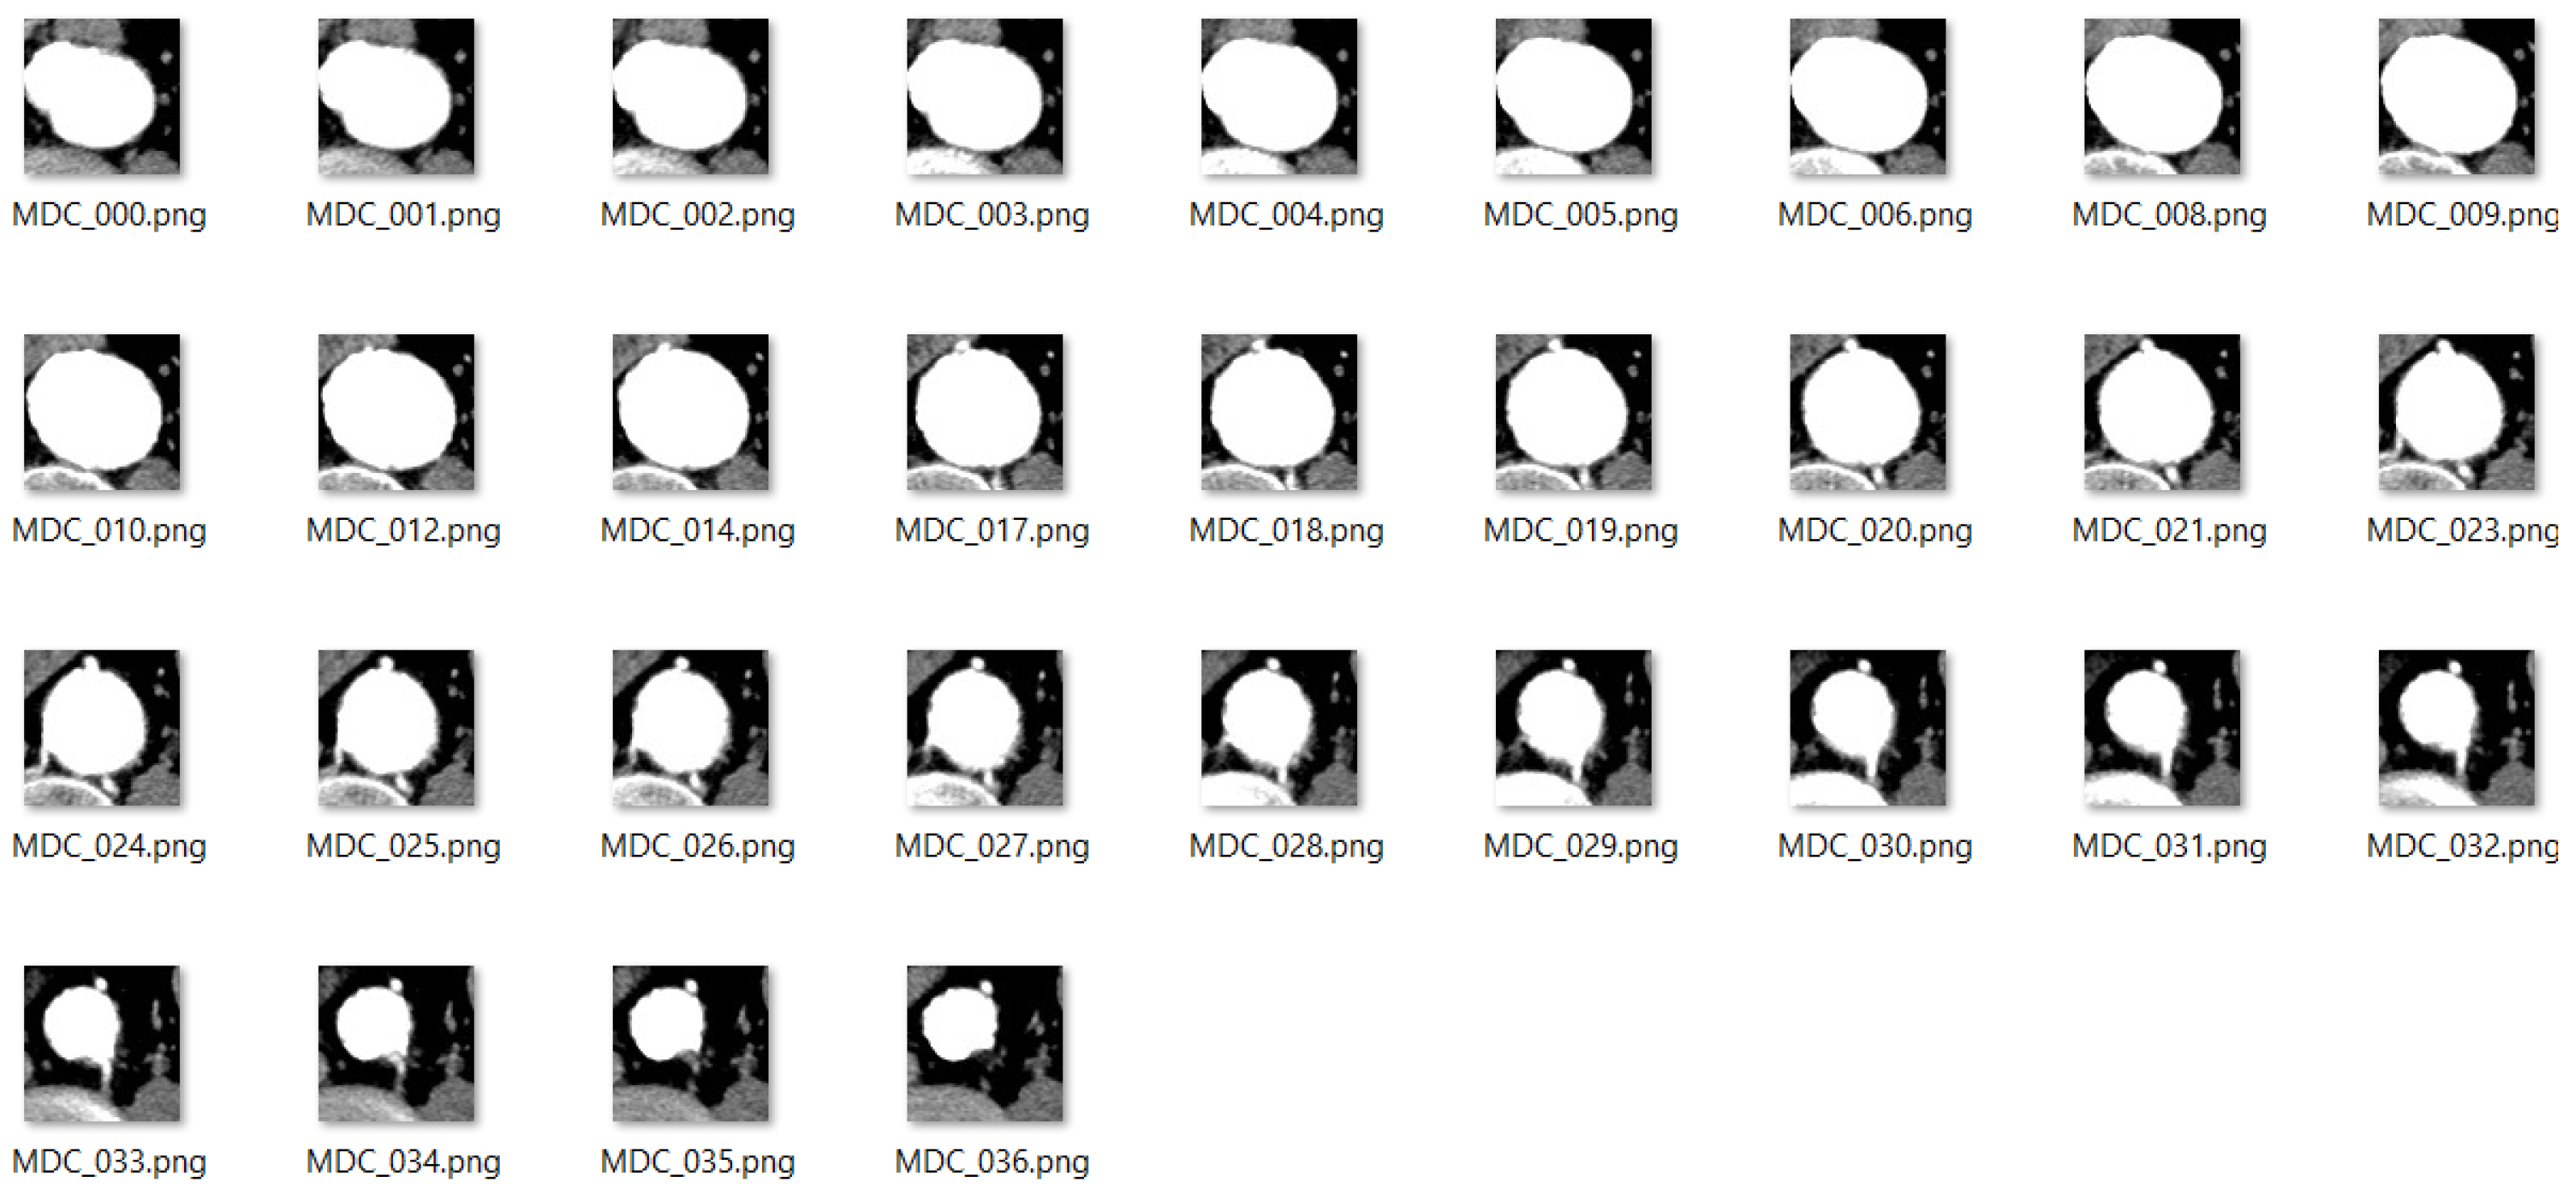
During the study, it was noted that the algorithm correctly processes the images representing vessels with floating thrombi, allowing the extraction of the patent part (
Figure 18).
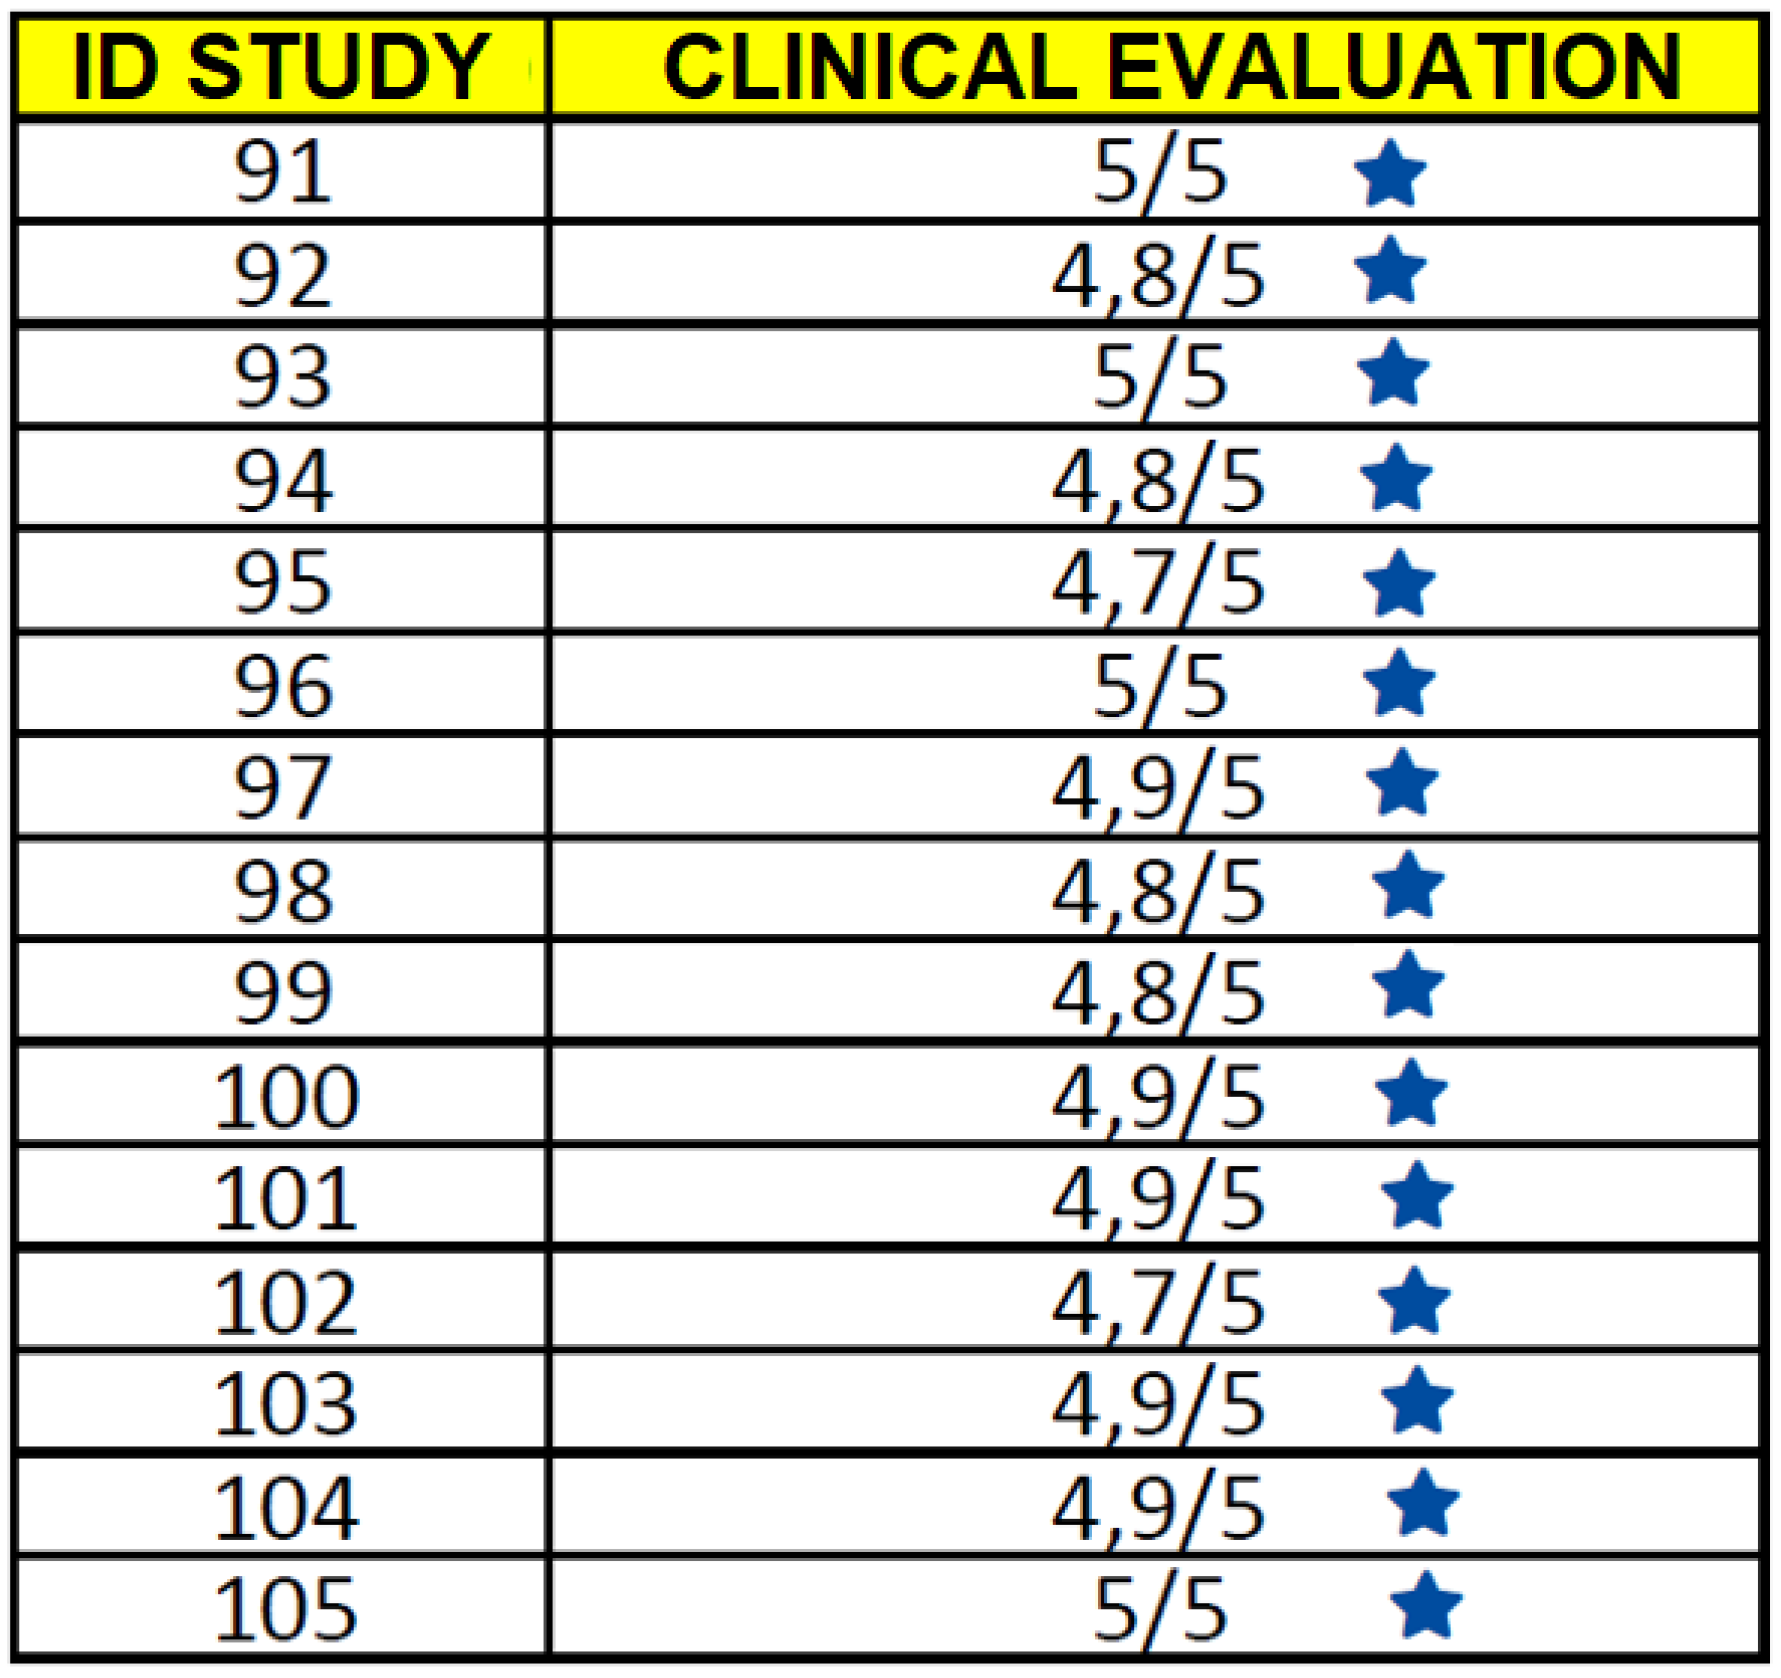
Finally, concerning the clinical evaluation, we point out that it has been carried out by the doctor comparing the basal images, which do not reveal meaningful information on the patency of the aortic vessel, with those processed by the algorithm. Indeed, the results were very satisfactory, as in most cases the evaluation on the single slice was 5/5 points, as shown by the averages on the sequences of each patient in
Figure 19.
7. Conclusions
The reconstruction properties of sampling Kantorovich operators were revealed to be very useful for digital image processing and enhancement. Their contribution to the study of vascular pathologies has provided new opportunities in the medical field. Indeed, the segmentation procedure made up by specific DIP algorithms, applied to images processed by the SK algorithm, allows the pervious lumen of the aortic vessel to be extracted from basal CT images.
From a medical point of view, the possibility of avoiding the use of the contrast medium represents a significant improvement in vascular diagnoses. Indeed, this proposed method overcomes the inability of doctors to detect a vascular disease by using basal CT images, since CT images with contrast medium still represent the gold standard procedure to diagnose an AAA.
The initial step of the proposed method, i.e., the application of the SK algorithm, turns out to be essential for the aim of this study. Indeed, the implementation of the SK algorithm, together with the other DIP techniques, allows a more accurate separation to be obtained between the pervious lumen of the aorta artery and the vessel itself, with respect to the one obtained from the original not reconstructed image [
3].
After the ROI selection, the whole procedure is not operator-dependent, since it is automatized both in extraction and in the calculation of errors. Furthermore, the proposed method manages to exclude calcium plaques from the basal image, which remain instead visible on the contrast medium image, which would prevent the separation of the pervious part. As we have highlighted, the procedure is also effective in the presence of floating thrombi, which in no way affect the extraction of the patent area. Moreover, despite the algorithm slightly underestimate the patent lumen, the clinical analysis of the doctor user has shown that this can be translated into an advantage from a diagnostic point of view, because in fact there is a more conservative estimation (underestimation) of the aneurysmal area. However, what has been observed above could also pave the way for an improvement in the numerical indices of the algorithm, even if, from the point of view of the extraction of the vessel’s patent lumen, useful for clinical diagnosis, it would have no effect.
In conclusion, the application of the entire procedure (based both on the implementation of the results on SK operators and on DIP algorithms) to the significant number of CT images considered, constitutes a validation of the algorithm, leading both to good numerical (through error indexes) and diagnostic (according to the evaluations made by the doctors involved in the study) results.
The present study therefore paves the way for an assisted diagnosis of aneurysmal vascular pathologies without the use of contrast medium.
Author Contributions
Conceptualization, A.T. and G.V.; methodology, G.V.; software, A.T.; validation, G.B.S. and G.V.; data curation, G.B.S., A.T. and G.V.; writing—review and editing, A.T. and G.V.; visualization, M.S.; supervision, G.V. All authors have read and agreed to the published version of the manuscript.
Funding
A. Travaglini and G. Vinti have been partially supported within the 2022 GNAMPA-INdAM Project “Enhancement e segmentazione di immagini mediante operatori di tipo campionamento e metodi variazionali per lo studio di applicazioni biomediche” and G. Vinti within the projects: (1) Ricerca di Base 2019 dell’Università degli Studi di Perugia—“Integrazione, Approssimazione, Analisi Nonlineare e loro Applicazioni”, and (2) CARE PROJECT, “A regional information system for Heart Failure and Vascular Disorder”, PRJ Project-1507 Action 2.3.1 POR FESR 2014-2020, 2020.
Institutional Review Board Statement
The study was conducted in accordance with the Declaration of Helsinki and the protocol was approved by the Bioethics Committee of the University of Perugia (PRJ Project-1507 Action 2.3.1 POR FESR 2014-2020).
Informed Consent Statement
All subjects involved gave their informed consent for inclusion before they participated in the study. All the images used, except
Figure 1 which is a free-license image, are completely anonymized and it is not possible to trace the patients from the data mentioned in the paper.
Acknowledgments
The authors wish to thank Marco Seracini for the portal’s implementation. Moreover, A. Travaglini and G. Vinti are members of the Gruppo Nazionale per l’Analisi Matematica, la Probabilità e le loro Applicazioni (GNAMPA) of the Istituto Nazionale di Alta Matematica (INdAM), of the network RITA (Research ITalian network on Approximation) and of the UMI group “Teoria dell’Approssimazione e Applicazioni”.
Conflicts of Interest
The authors declare that they have no conflict of interest.
Abbreviations
The following abbreviations are used in this manuscript:
| CT | Computed Tomography |
| AAA | Abdominal Aortic Aneursysm |
| AAT | Thoracic Aortic Aneurysm |
| DIP | Digital Image Processing |
| ROI | Region Of Interest |
| SK | Sampling Kantorovich |
| PSNR | Peak Signal To Noise Ratio |
| CM | Contrast Medium |
| DCI | Dice Coincidence Index |
| TI | Tanimoto Index |
| CPU | Central Processing Unit |
| PHP | Hypertext Preprocessor |
References
- Doweidar, M.H. Advances in Biomechanics and Tissue Regeneration, 1st ed.; Academic Press: Cambridge, MA, USA, 2019; p. 398. [Google Scholar]
- Fukushima, Y.; Miyazawa, H.; Nakamura, J.; TaketomiTakahashi, A.; Suto, T.; Tsushima, Y. Contrast-induced nephropathy (CIN) of patients with renal dysfunction in CT examination. Jpn. J. Radiol. 2017, 35, 427–431. [Google Scholar] [CrossRef] [PubMed]
- Costarelli, D.; Seracini, M.; Vinti, G. A segmentation procedure of the pervious area of the aorta artery from CT images without contrast medium. Math. Methods Appl. Sci. 2020, 43, 114–133. [Google Scholar] [CrossRef]
- Gonzales, R.; Woods, R. Digital Image Processing; Prentice-Hall: Hoboken, NJ, USA, 2002; p. 793. [Google Scholar]
- Natterer, F.; Wubbeling, F. Mathematical Methods in Image Reconstruction; SIAM: Philadelphia, PA, USA, 2001; p. 225. [Google Scholar]
- Dutilleux, P. An Implementation of the “Algorithme á trous” to Compute the Wavelet Transform, 1st ed.; Springer: Berlin/Heidelberg, Germany, 1989; pp. 298–304. [Google Scholar]
- Ganapathy Ram, B.; Manimegalai, D.; Mary Sugantharathnam, D. Wavelets and ridgelets for biomedical image denoising. WSEAS Trans. Syst. 2013, 12, 165–178. [Google Scholar]
- Dice, L.R. Measures of the amount of ecologic association between species. Ecology 1945, 26, 297–302. [Google Scholar] [CrossRef]
- Duda, R.; Hart, P. Pattern Classification and Scene Analysis, 1st ed.; John Willey & Sons: New York, NY, USA, 1973; p. 482. [Google Scholar]
- Jaccard, P. Nouvelles recherches sur la distribution florale. Bull. De La Soc. Vaud. Des Sci. Nat. 1908, 44, 223–270. [Google Scholar]
- Olson, E. Particle shape factors and their use in image analysis-part 1: Theory. J. GXP Compliance 2011, 15, 85–96. [Google Scholar]
- Xie, Y.; Padgett, J.; Biancardi, A.; Reeves, A. Automated aorta segmentation in low-dose chest CT images. Int J. Comput. Assist. Radiol. Surg. 2014, 9, 211–219. [Google Scholar] [CrossRef] [PubMed]
- Bardaro, C.; Butzer, P.L.; Stens, R.L.; Vinti, G. Kantorovich-Type Generalized Sampling Series in the Setting of Orlicz Spaces. Sampl. Theory Signal Image Process. 2007, 6, 29–52. [Google Scholar] [CrossRef]
- Costarelli, D.; Vinti, G. Approximation by Multivariate Generalized Sampling Kantorovich Operators in the Setting of Orlicz Spaces. Boll. Unione Mat. Ital. 2011, 9, 445–468. [Google Scholar]
- Costarelli, D.; Vinti, G. Saturation by the Fourier transform method for the sampling Kantorovich series based on bandlimited kernels. Anal. Math. Phys. 2019, 9, 2263–2280. [Google Scholar] [CrossRef]
- Costarelli, D.; Vinti, G. Approximation properties of the sampling Kantorovich operators: Regularization, saturation, inverse results and Favard classes in Lp-spaces. J. Fourier Anal. Appl. 2022, 28, 49. [Google Scholar] [CrossRef]
- Musielak, J. Orlicz Spaces and Modular Spaces, 1st ed.; Lecture Notes in Mathematic; Springer: Berlin/Heidelberg, Germany, 1983; p. 226. [Google Scholar]
- Rao, M.M.; Ren, Z.D. Theory of Orlicz Spaces; Dekker Inc.: New York, NY, USA, 1991. [Google Scholar]
- Costarelli, D.; Seracini, M.; Vinti, G. A comparison between the sampling Kantorovich algorithm for digital image processing with some interpolation and quasi-interpolation methods. Appl. Math. Comput. 2020, 374, 125046. [Google Scholar] [CrossRef]
- Asdrubali, F.; Baldinelli, G.; Bianchi, F.; Costarelli, D.; D’Alessandro, F.; Scrucca, F.; Seracini, M.; Vinti, G. Mathematical models for the improvement of detection techniques of industrial noise sources from acoustic images. Math. Methods Appl. Sci. 2021, 44, 10448–10459. [Google Scholar] [CrossRef]
- Cluni, F.; Gusella, V.; Vinti, G. Masonry elastic characteristics assessment by thermographic images. Meccanica 2019, 54, 1339–1349. [Google Scholar] [CrossRef] [Green Version]
- Butzer, P.L.; Fischer, A.; Stens, R.L. Generalized sampling approximation of multivariate signals; theory and some applications. Note Mat. 1990, 10, 173–191. [Google Scholar]
- Butzer, P.L.; Nessel, R.J. Fourier Analysis and Approximation I, 1st ed.; Academic Press: New York, NY, USA, 1971; p. 572. [Google Scholar]
- Butzer, P.L. A survey of the Whittaker-Shannon sampling theorem and some of its extensions. J. Math. Res. Expo. 1983, 3, 185–212. [Google Scholar]
- Ries, S.; Stens, R.L. Approximation by generalized sampling series. Constr. Theory Funct. 1984, 746–756. [Google Scholar]
- Orlova, O.; Tamberg, G. On approximation properties of generalized Kantorovich-type sampling operators. J. Approx. Theory 2016, 201, 73–86. [Google Scholar] [CrossRef]
- Thackray, B.D.; Nelson, A.C. Semi-automatic segmentation of vascular network images using a rotating structuring element (ROSE) with mathematical morphology and dual feature thresholding. IEEE Trans. Med. Imaging 1993, 12, 385–392. [Google Scholar] [CrossRef] [PubMed]
Figure 1.
Anatomy of the aorta.
Figure 1.
Anatomy of the aorta.
Figure 2.
Pseudo-code of the SK algorithm.
Figure 2.
Pseudo-code of the SK algorithm.
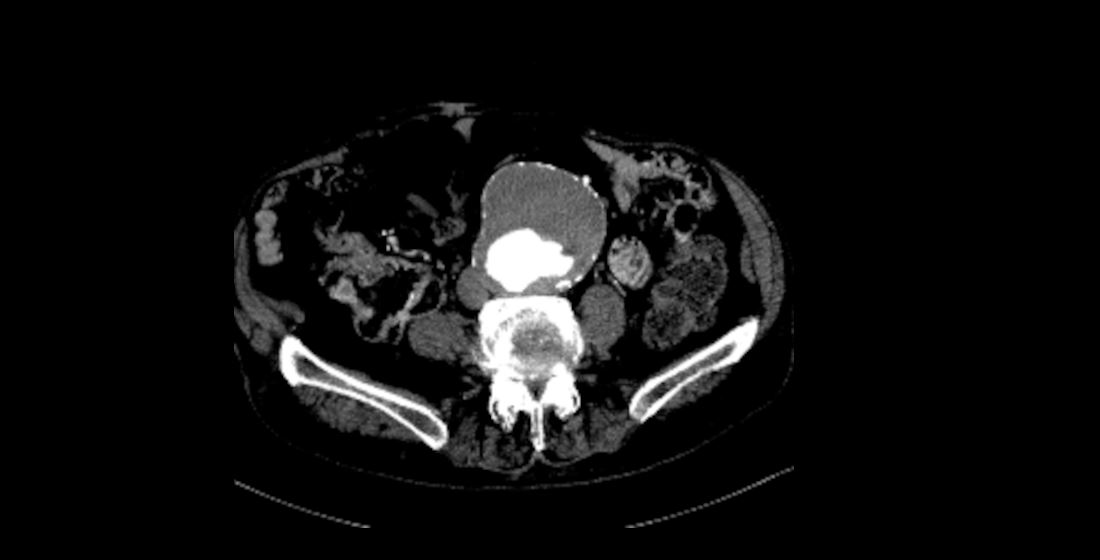
Figure 3.
On the left, basal CT image in the presence of an AAA. In the red square (the so called region of interest, ROI) is depicted the aorta artery. On the right, CT image with contrast medium, corresponding to the same CT section shown on the left.
Figure 3.
On the left, basal CT image in the presence of an AAA. In the red square (the so called region of interest, ROI) is depicted the aorta artery. On the right, CT image with contrast medium, corresponding to the same CT section shown on the left.
Figure 4.
On the left, the histogram of the original ROI; on the right, the histogram of the ROI processed by the SK algorithm. The red circle highlights the increasing of the information content, in terms of number of pixels.
Figure 4.
On the left, the histogram of the original ROI; on the right, the histogram of the ROI processed by the SK algorithm. The red circle highlights the increasing of the information content, in terms of number of pixels.
Figure 5.
On the left, the reference image; on the right, the image extracted by the algorithm. For the above slice .
Figure 5.
On the left, the reference image; on the right, the image extracted by the algorithm. For the above slice .
Figure 6.
Interface of the web portal ImageLab.
Figure 6.
Interface of the web portal ImageLab.
Figure 7.
Results of the entire procedure.
Figure 7.
Results of the entire procedure.
Figure 8.
The homepage of the Care portal.
Figure 8.
The homepage of the Care portal.
Figure 9.
Interface of the doctor user for editing the patient data (1) and accessing the processed data (2).
Figure 9.
Interface of the doctor user for editing the patient data (1) and accessing the processed data (2).
Figure 10.
Doctor user interface for the results evaluations.
Figure 10.
Doctor user interface for the results evaluations.
Figure 11.
Interface for editing patient data by the medical user.
Figure 11.
Interface for editing patient data by the medical user.
Figure 12.
Entire procedure and phases of the processing of the CT sequences.
Figure 12.
Entire procedure and phases of the processing of the CT sequences.
Figure 13.
Data of the patients undergoing the study.
Figure 13.
Data of the patients undergoing the study.
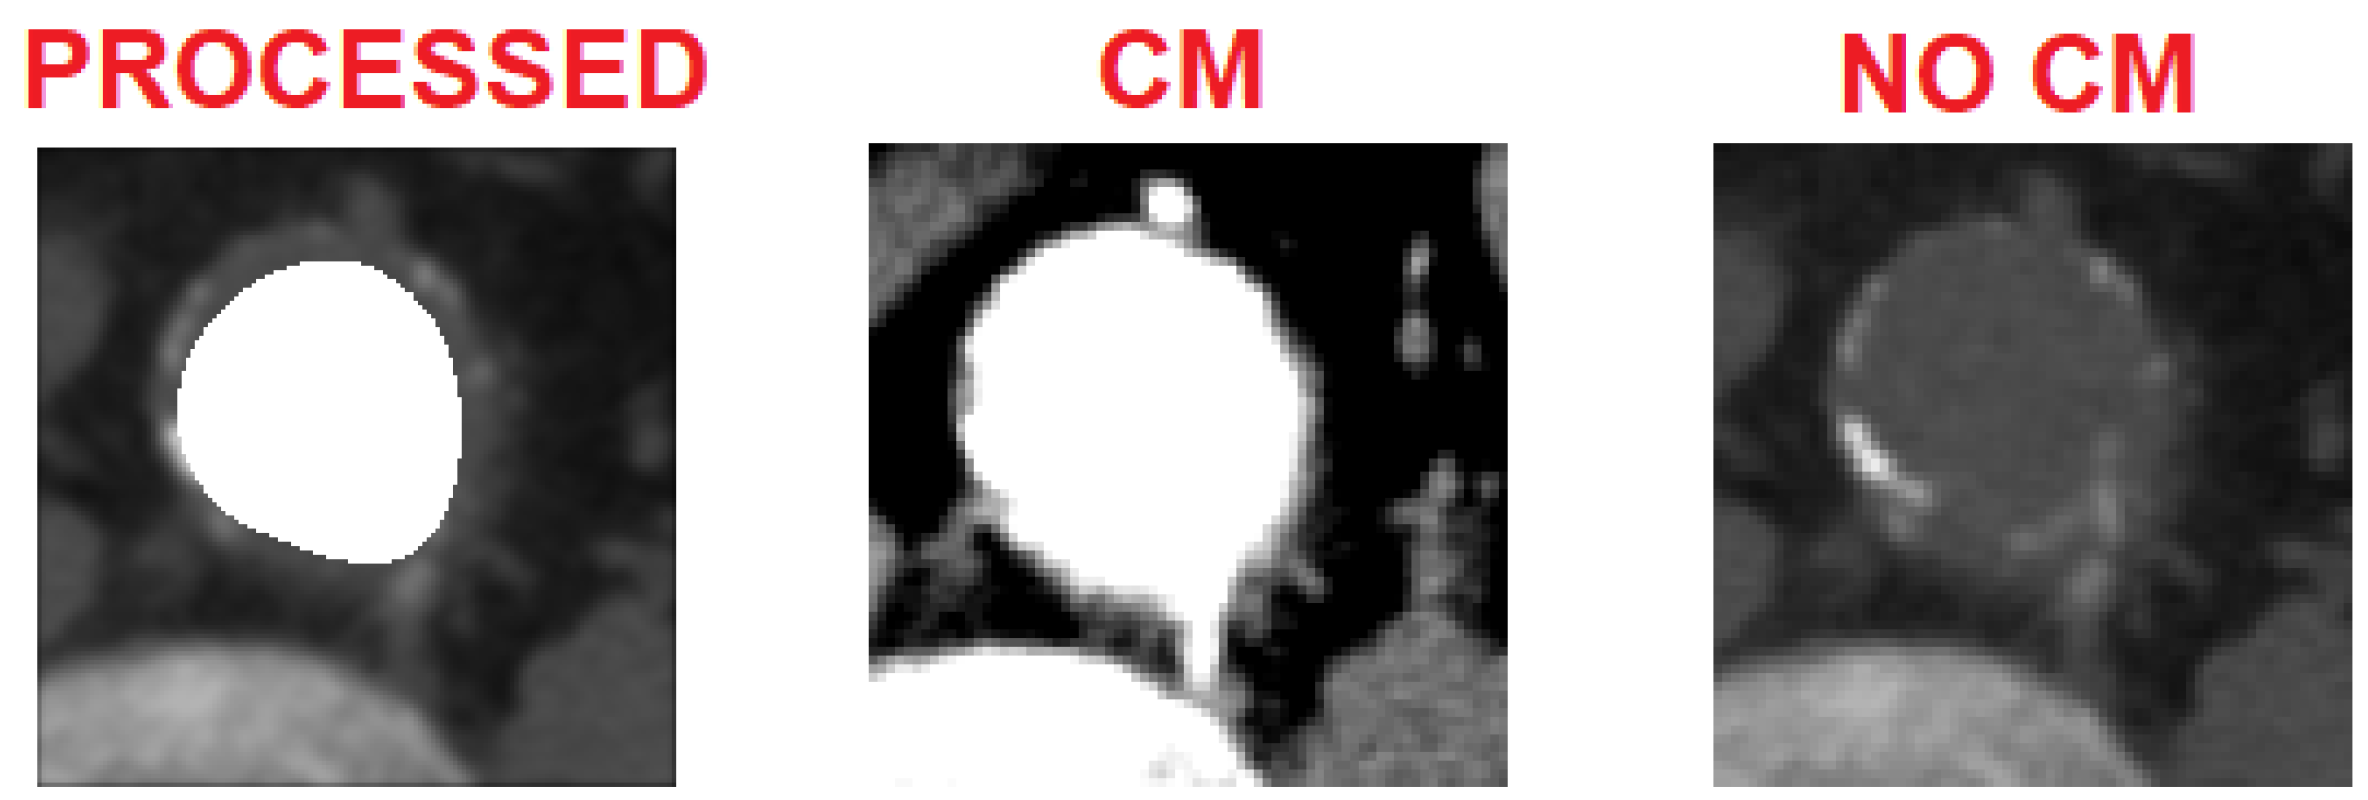
Figure 14.
Results of the entire sequence of one of the 15 patients processed. On the left, the basal CT images of the vessel (NO CM), on the right, the CT images of the vessel with the contrast medium (CM), in the center, the reconstructions with the extraction of the patent lumen (i.e., the processed image, ). Next to each slice, we report some of the most significant errors (Dice Coincidence Index, Tanimoto Index, misclassification error and bias index).
Figure 15.
Basal image sequence for patient ID 105.
Figure 15.
Basal image sequence for patient ID 105.
Figure 16.
Case of underestimation of the extraction procedure.
Figure 16.
Case of underestimation of the extraction procedure.
Figure 17.
Sequence of images with contrast medium relating to patient ID 105.
Figure 17.
Sequence of images with contrast medium relating to patient ID 105.
Figure 18.
Case of floating thrombus that does not affect the functioning of the algorithm, which manages to extract the patent part.
Figure 18.
Case of floating thrombus that does not affect the functioning of the algorithm, which manages to extract the patent part.
Figure 19.
Average of the clinical evaluations (e.g., in terms of stars) on the slices of the CT sequence of each patient.
Figure 19.
Average of the clinical evaluations (e.g., in terms of stars) on the slices of the CT sequence of each patient.
Table 1.
Average of the error indices on the slices of each of the 15 patients analyzed.
Table 1.
Average of the error indices on the slices of each of the 15 patients analyzed.
| ID STUDY | DCI | TI | | |
|---|
| 91 | 0.751 | 0.604 | 0.396 | −0.429 |
| 92 | 0.817 | 0.693 | 0.307 | −0.056 |
| 93 | 0.761 | 0.615 | 0.385 | −0.571 |
| 94 | 0.801 | 0.67 | 0.330 | −0.472 |
| 95 | 0.803 | 0.674 | 0.326 | −0.180 |
| 96 | 0.765 | 0.620 | 0.380 | −0.419 |
| 97 | 0.818 | 0.694 | 0.306 | −0.256 |
| 98 | 0.819 | 0.695 | 0.305 | −0.046 |
| 99 | 0.747 | 0.597 | 0.403 | −0.517 |
| 100 | 0.787 | 0.651 | 0.349 | −0.404 |
| 101 | 0.759 | 0.612 | 0.388 | −0.517 |
| 102 | 0.743 | 0.593 | 0.407 | −0.640 |
| 103 | 0.781 | 0.642 | 0.358 | −0.428 |
| 104 | 0.736 | 0.583 | 0.417 | −0.462 |
| 105 | 0.740 | 0.588 | 0.412 | −0.703 |
Table 2.
Average of the error indices on the slices of all the CT exams of the patients taking part in the study.
Table 2.
Average of the error indices on the slices of all the CT exams of the patients taking part in the study.
| | DCI | TI | | |
|---|
| MEAN | 0.781 | 0.644 | 0.356 | −0.376 |
| Disclaimer/Publisher’s Note: The statements, opinions and data contained in all publications are solely those of the individual author(s) and contributor(s) and not of MDPI and/or the editor(s). MDPI and/or the editor(s) disclaim responsibility for any injury to people or property resulting from any ideas, methods, instructions or products referred to in the content. |
© 2023 by the authors. Licensee MDPI, Basel, Switzerland. This article is an open access article distributed under the terms and conditions of the Creative Commons Attribution (CC BY) license (https://creativecommons.org/licenses/by/4.0/).


