Article

Comprehensive Analysis of Multi-Objective Optimization Algorithms for Sustainable Hybrid Electric Vehicle Charging Systems

by
Nahar F. Alshammari
1,*,
Mohamed Mahmoud Samy
2 and
Shimaa Barakat
2
1
Department of Electrical Engineering, Faculty of Engineering, Jouf University, Sakaka 72388, Saudi Arabia
2
Department of Electrical Engineering, Faculty of Engineering, Beni-Suef University, Beni-Suef 2722165, Egypt
*
Author to whom correspondence should be addressed.
Mathematics 2023, 11(7), 1741; https://doi.org/10.3390/math11071741
Submission received: 4 March 2023 / Revised: 29 March 2023 / Accepted: 3 April 2023 / Published: 5 April 2023
(This article belongs to the Special Issue Multi-Objective Optimization and Decision Support Systems)

Abstract

:
This study presents a multi-objective optimization approach for designing hybrid renewable energy systems for electric vehicle (EV) charging stations that considers both economic and reliability factors as well as seasonal variations in energy production and consumption. Four algorithms, MOPSO, NSGA-II, NSGA-III, and MOEA/D, were evaluated in terms of their convergence, diversity, efficiency, and robustness. Unlike previous studies that focused on single-objective optimization or ignored seasonal variations, our approach results in a more comprehensive and sustainable design for EV charging systems. The proposed system includes a 223-kW photovoltaic system, an 80-kW wind turbine, and seven Lithium-Ion battery banks, achieving a total net present cost of USD 564,846, a levelized cost of electricity of 0.2521 USD/kWh, and a loss of power supply probability of 1.21%. NSGA-II outperforms the other algorithms in terms of convergence and diversity, while NSGA-III is the most efficient, and MOEA/D has the highest robustness. The findings contribute to the development of efficient and reliable renewable energy systems for urban areas, emphasizing the importance of considering both economic and reliability factors in the design process. Our study represents a significant advance in the field of hybrid renewable energy systems for EV charging stations.

1. Introduction

Electric vehicles (EVs) are considered a promising technology to reduce the environmental impact and greenhouse gas emissions of the transportation sector. EVs have several advantages over conventional vehicles that run on fossil fuels, such as lower operating costs, higher energy efficiency, and zero tailpipe emissions. However, EVs also require adequate charging infrastructure to meet their energy demand and ensure their reliability. Electric vehicle charging stations (EVCSs) are facilities that provide electricity to charge EV batteries. There are different types of EVCSs based on their power level, power flow direction, converter topology, and charging control strategy [1]. They can be categorized into three main levels: Level 1, Level 2, and Level 3. Level 1 chargers are the slowest and use regular wall outlets with AC power. They have a power output of 1.3 kW to 2.4 kW, and it can take up to 20 h to charge an EV battery overnight. Level 2 chargers are faster and use higher-voltage AC power. They have a power output of up to 19 kW and can charge an EV battery five- to seven-times faster than a Level 1 charger. Level 3 chargers are the fastest and use DC (direct current) power. They have a power output of up to 350 kW and can charge an EV battery up to 80% in about an hour [2,3,4].
The widespread use of EVs requires adequate charging infrastructure, which can be either grid-connected or off-grid [5,6]. Grid-connected charging stations have some drawbacks, such as: These devices can cause power quality issues, such as voltage fluctuations, harmonics, and reactive power consumption [7,8]. The peak load demand on the grid can be increased by such stations, especially during evening hours when EVs are plugged in after work [9,10]. Costly new power plants or transmission lines can be required by these devices to meet the increased load and maintain reliability. Grid disturbances, such as faults, frequency deviations, and blackouts, can affect such stations [11,12].
Off-grid EV charging stations are standalone devices that use renewable energy sources, such as solar and wind, to charge EVs without relying on the grid. These stations have some advantages over grid-connected stations, such as: reducing the load and emissions of the grid, enhancing the reliability and resilience of the charging service, and expanding the access to remote areas where grid infrastructure is unavailable or costly [13,14]. However, off-grid EV charging stations also face some challenges, such as: high initial investment and maintenance costs, intermittent and variable power supply from renewable sources, limited storage capacity and scalability, and lack of standardization and regulation [15].
However, designing an off-grid hybrid system consisting of several RES for EVCS is not a trivial task. It involves finding an optimal combination of system components and operating strategies that can satisfy the load demand while minimizing the cost and maximizing the performance and reliability of the system [16,17,18,19]. This is a complex optimization problem that requires suitable methods to solve it efficiently and effectively. Optimization methods can be classified into single-objective and multi-objective methods [20]. Single-objective methods aim to optimize one objective function (such as cost or emissions) while satisfying some constraints (such as load demand or battery state of charge) [21].
Multi-objective optimization (MOO) is a field of optimization that deals with problems that involve optimizing multiple objective functions simultaneously. These objectives may be conflicting or competing, which means that enhancing one objective may negatively affect another [22]. As a result, there is often no single best solution to these problems but rather a set of solutions that are equally satisfactory in terms of balancing objectives [23]. This group of solutions is known as the Pareto optimal set or Pareto front [24]. MOO issues can be solved using a variety of techniques and algorithms, which can be divided into two main categories: traditional methods and evolutionary methods [25].
Traditional methods are based on mathematical programming techniques that transform the multi-objective problem into a single-objective problem by using some preference information from the decision maker [26]. This preference information can be given before, during, or after the optimization process. Some common traditional methods are the Weighted Sum Method, the ε-Constraint Method, and Goal Programming. The Weighted Sum Method adds objectives together with weights that show the importance of each objective [27]. The ε-Constraint Method changes the multi-objective problem into a single-objective problem by choosing one objective as the main objective and making the other objectives constraints [28]. Goal Programming sets targets for each objective and tries to reduce the difference from these targets [29].
Evolutionary methods are algorithms inspired by natural evolution that use population-based techniques to simulate selection and variation processes. These methods do not require any input from the decision maker beforehand and can generate a diverse set of solutions that approximate the Pareto front without reducing the multi-objective problem into a single-objective one [30,31]. Genetic Algorithms (GAs), Particle Swarm Optimization (PSO), Differential Evolution (DE), and Multi-Objective Evolutionary Algorithms (MOEAs) are some common examples of evolutionary methods. GA uses selection, crossover, and mutation to create new solutions from a population [32]. PSO mimics the movement of particles in a search space [33]. DE generates new solutions using mutation, crossover, and selection [34,35]. MOEA is a specific type of evolutionary algorithm designed for multi-objective optimization and utilizes specialized operators and algorithms to handle multiple objectives simultaneously [36,37].
Each method has its own advantages and disadvantages that depend on various factors, such as the problem’s complexity, the characteristics of the objectives, and the availability of preference information. Therefore, selecting the right method for each problem is crucial to achieve efficient and effective optimization.
In this paper, the feasibility of utilizing wind and solar energy to power off-grid EVCSs is investigated as a potential solution for the lack of effective and affordable charging options in areas without grid power access. The utilization of wind and solar energy is proposed as a cost-effective and sustainable solution for powering off-grid EV charging stations. The study explores the optimization of hybrid power systems (HPSs) through various algorithms to enhance technical performance, economic feasibility, and environmental impact. A multi-objective optimization algorithm was employed to account for the inherent trade-offs that come with the design of a hybrid charging system. Specifically, this algorithm incorporated four optimization techniques, namely, Multi-Objective Particle Swarm Optimization (MOPSO), Non-dominated Sorting Genetic Algorithm (NSGA-II), Non-dominated Sorting Genetic Algorithm III (NSGA-III), and Multi-Objective Evolutionary Algorithm Based on Decomposition (MOEA/D), to appraise the technical performance and economic feasibility of the system. Moreover, a model was formulated to gauge the convergence, diversity, efficiency, and robustness of the optimization algorithms.
The choice of MOPSO, NSGA-II, NSGA-III, and MOEA/D algorithms in this manuscript is justified due to their effectiveness in solving complex optimization problems with multiple objectives and constraints [38,39]. These heuristic algorithms are widely used in the literature and have been shown to provide good solutions to similar problems. MOPSO is a multi-objective optimization algorithm that combines the particle swarm optimization and multi-objective optimization algorithms, making it well-suited for problems with multiple objectives [40]. NSGA-II is a widely used genetic algorithm that uses Pareto dominance and crowding distance to select the best solutions [41]. NSGA-III is an extension of NSGA-II that uses reference points to achieve better convergence and diversity [42]. MOEA/D is a decomposition-based algorithm that decomposes the problem into several subproblems and solves them independently [43].
These algorithms were chosen because of their ability to handle the multi-objective nature of the problem and produce a set of Pareto optimal solutions that balance the total net present cost and loss of power supply probability objectives. Moreover, the selection of these algorithms was based on their well-established performance in solving multi-objective optimization problems. They offer distinct optimization approaches, such as swarm intelligence, genetic algorithms, and decomposition-based methods, to explore the solution space effectively. By employing multiple algorithms, a comprehensive evaluation of the hybrid system can be achieved, allowing for a better understanding of the trade-offs between conflicting objectives.

Contribution

This paper proposes an optimization model to determine the Pareto optimal configuration of a Photovoltaic–Wind Turbine–Battery/Electric Vehicle Charging Station (PVWB/EVCS) system. The aim is to minimize both the total net present cost (TNPC) and the loss of power supply probability (LPSP) objectives. Multi-objective algorithms, such as MOPSO, NSGA-II, NSGA-III, and MOEA/D, are used to determine the Pareto optimal solution, which is then selected through the utilization of the Pareto method. Sensitivity analysis is performed to investigate the effects of various factors on the optimal configuration.
The major contributions of this research are as follows:
  • Development of a bi-objective optimization model that balances TNPC and LPSP objectives.
  • Evaluation of four multi-objective algorithms based on criteria, such as convergence, diversity, efficiency, scalability, and robustness, to determine the most suitable algorithm for attaining the Pareto optimal solution for the PVWB/EVCS system.
  • Utilization of the Pareto method for selecting the Pareto optimal solution.
  • Investigation of sensitivity analysis by considering various factors, such as cost of Lithium-Ion batteries, PV system, and WT.
The paper is organized as follows: Section 1 introduces the research topic and its significance. Then, Section 2 reviews the relevant literature to situate the proposed system. Section 3 presents the mathematical modeling of each component of the proposed system. After that, Section 4 describes the optimization framework in detail. Furthermore, Section 5 explains the optimization algorithms and evaluates their performance using various metrics. Section 6 reports the results and discusses the findings. Finally, Section 7 summarizes the main findings and suggests directions for future research. The adopted research methodology’s framework is shown in Figure 1.

2. Literature Review

2.1. Review of Hybrid EVCS System

A proposal for an off-grid EVCS in Denmark that relies on renewable energy sources was analyzed using HOMER software. The study found that biomass fuel and additional renewable energy systems could increase the renewable energy penetration to 100%, but this may also raise the project cost [44]. Meanwhile, an EVCS in Bangladesh that utilized solar PV and biogas was found to be economically viable and offered low-cost and low-carbon charging stations. The EVCS could save up to USD 12–USD 18 per month for EV recharging, which could benefit EV owners and ensure energy security in Bangladesh [45]. In another study, an optimum configuration for EVCS HRES was developed using weighted multicriteria and experimental validation, proving HRES’s applicability for the EVCS [46].
The authors evaluated the feasibility of an Off-Grid Hybrid EVCS system using PV-battery technology in Saudi Arabia, analyzing the technical and economic results with HOMER software. The proposed system has a 50% renewable energy penetration, lower cost of energy than the standard electricity price, and potential to reduce emissions from power generation and transportation sectors [47]. Verma, A. and Singh, B. presented, in [48], a three-phase EVCS with a solar PV array, a storage battery and a convex combined APSA to enhance grid power quality. The algorithm converged fast and had low error, making it suitable for an EVCS with changing charging current. The EVCS worked well in standalone and grid-connected modes, generating good-quality voltage and balanced grid currents. The controller managed power flow balance at transients. The removal of the PV array’s dc-dc converter did not affect the EVCS performance, and the PV power was maximized under all conditions. The authors in [49] investigated the feasibility of Off-Grid Hybrid EVCS Systems in Delhi, India, presenting three hybrid energy system configurations analyzed with meta-heuristic techniques to reduce net present cost and levelized cost of energy. The grid-connected solar PV-based EVCS is found to offer significant cost savings.
The integration of Photovoltaic–Battery Energy Storage Systems (PV-BESS) in EV charging stations has garnered significant attention in recent years to mitigate the negative impacts of EVs on power distribution networks. Several studies have been conducted to explore the potential benefits and challenges of PV-BESS systems in EV charging applications. A modular on-grid PV-BESS solution for fast EV charging stations in Brazil is proposed in [50]. The installed PV power is designed to be adapted according to the anticipated load demand between 2020 and 2030. The impact of EVs on the power grid is analyzed by comparing the installed PV power to the grid utilization over this period. It is shown by the results of the study that a higher installed PV power is required when there is an increase in load demand, which reduces grid utilization. Additionally, it is found that setting an area constraint on PV system installation leads to a greater reliance on power from the grid.

2.2. Review the Optimization Methods

Various approaches have been proposed in the literature to optimize the system components and operating strategies of hybrid renewable energy systems that can satisfy the load demand while minimizing the cost and maximizing the performance and reliability of the system. These approaches can be classified into two main categories: optimization algorithms and software applications. Some examples of software applications are HOMER [44,45,46], RETScreen [51], and System Advisor Model (SAM) [52,53].
The HOMER software tool is used to evaluate the feasibility of a solar-energy-based EVCS in Shenzhen, China. This proposed strategy aims to address the grid-power-related issues by integrating SPV and to meet the expected demand for EVs [54]. A standalone renewable-based charging station for different locations and conditions in Qatar is optimized using HOMER software in [55]. A comprehensive economic criterion is used to compare the optimal solution with a grid extension option. A hybrid system of wind turbine, CPV/T system, electrolyzer, bio-generator, H2 and NH3 fuel cells, chemical storage tank, Li-ion battery storage, and converter is the optimal configuration. The applicability of the proposed optimization methodology to any location is shown by the study, and useful insights into designing off-grid hybrid EVCS systems are provided. An optimal size of a standalone hybrid PV/wind/battery system was obtained, and the effect of EV presence was investigated in Saudi Arabia [56]. Two cases were considered to minimize costs and maintain reliability. MATLAB computer code and mathematical models were used for hourly based optimization studies. The results showed that smaller and larger hybrid system sizes and costs were needed in locations with high and low solar and wind potentials, respectively. The hybrid system sizes and costs also increased with the daily travelled distance.
Various optimization algorithms have been developed for the analysis of hybrid power systems (HPSs) in the context of EV applications. These algorithms are employed to optimize different aspects of HPS design, including technical performance, economic feasibility, and environmental impact. In a particular investigation, the optimization of HPS was achieved through the utilization of a multi-criteria rank-weighted-rank (RWR) decision algorithm. This approach demonstrated that HPS outperformed Grid-connected systems in terms of power self-sufficiency (60.8%) and energy self-sufficiency (74.7%). Moreover, the implementation of HPS resulted in a significant reduction in power losses (95.7%) and a decrease in voltage fluctuations [57]. Another study, conducted on a university campus in India, explored the possibility of augmenting the renewable fraction (RF) through the implementation of vehicle-to-grid (V2G) technology. By utilizing artificial bee colony (ABC) and particle swarm optimization (PSO) algorithms, it was determined that the RF could be increased by up to 87% [14]. Additionally, the application of Virus Colony Search Optimization (VCS) in conjunction with demand response algorithms resulted in a 4% reduction in the average cost of smart parking for EVs [58]. It is also possible to potentially decrease the operational cost of a microgrid with a probabilistic supply–demand profile by up to 4.5%, through the implementation of Monte Carlo simulation and a Lightning Search Algorithm (LSA) based on the determined Demand Response Participation (DRP) [59].
To promote the rising use of EVs, quick charging stations where EVs may be charged in around 15 min must be expanded [60]. Given the limited driving range and extended charging times of EVs, it is crucial to establish sufficient charging stations in convenient locations to meet the demand for charging. The expansion of charging stations requires electric utilities to have the capacity to meet the increased demand for charging [61,62]. As the number of EVs on the road grows, the number of charging stations must also increase to reduce the transportation industry’s reliance on fossil fuels.
This study addresses the research problem of developing a comprehensive and systematic methodology for evaluating multi-objective optimization algorithms in hybrid renewable energy system design. A literature review reveals that different meta-heuristic algorithms have been applied to predict the sizes of hybrid renewable EVCSs in previous studies, but no consensus has been reached on the optimal optimization method. Moreover, most previous studies have not justified their choice of algorithm and have only focused on finding the best solutions for specific cases. The main gap in the literature that this study fills is the lack of a comprehensive evaluation model that accounts for multiple criteria, such as convergence, diversity, efficiency, and robustness. This study proposes a Performance Evaluation model of Multi-Objective Optimization Algorithms that aims to provide a systematic methodology for assessing and comparing different optimization techniques, helping researchers select the most suitable one for their problem. This approach is expected to assist researchers who have potential ideas for RES-based systems but lack the expertise to choose a better optimization technique to perform the optimality of the proposed problem.

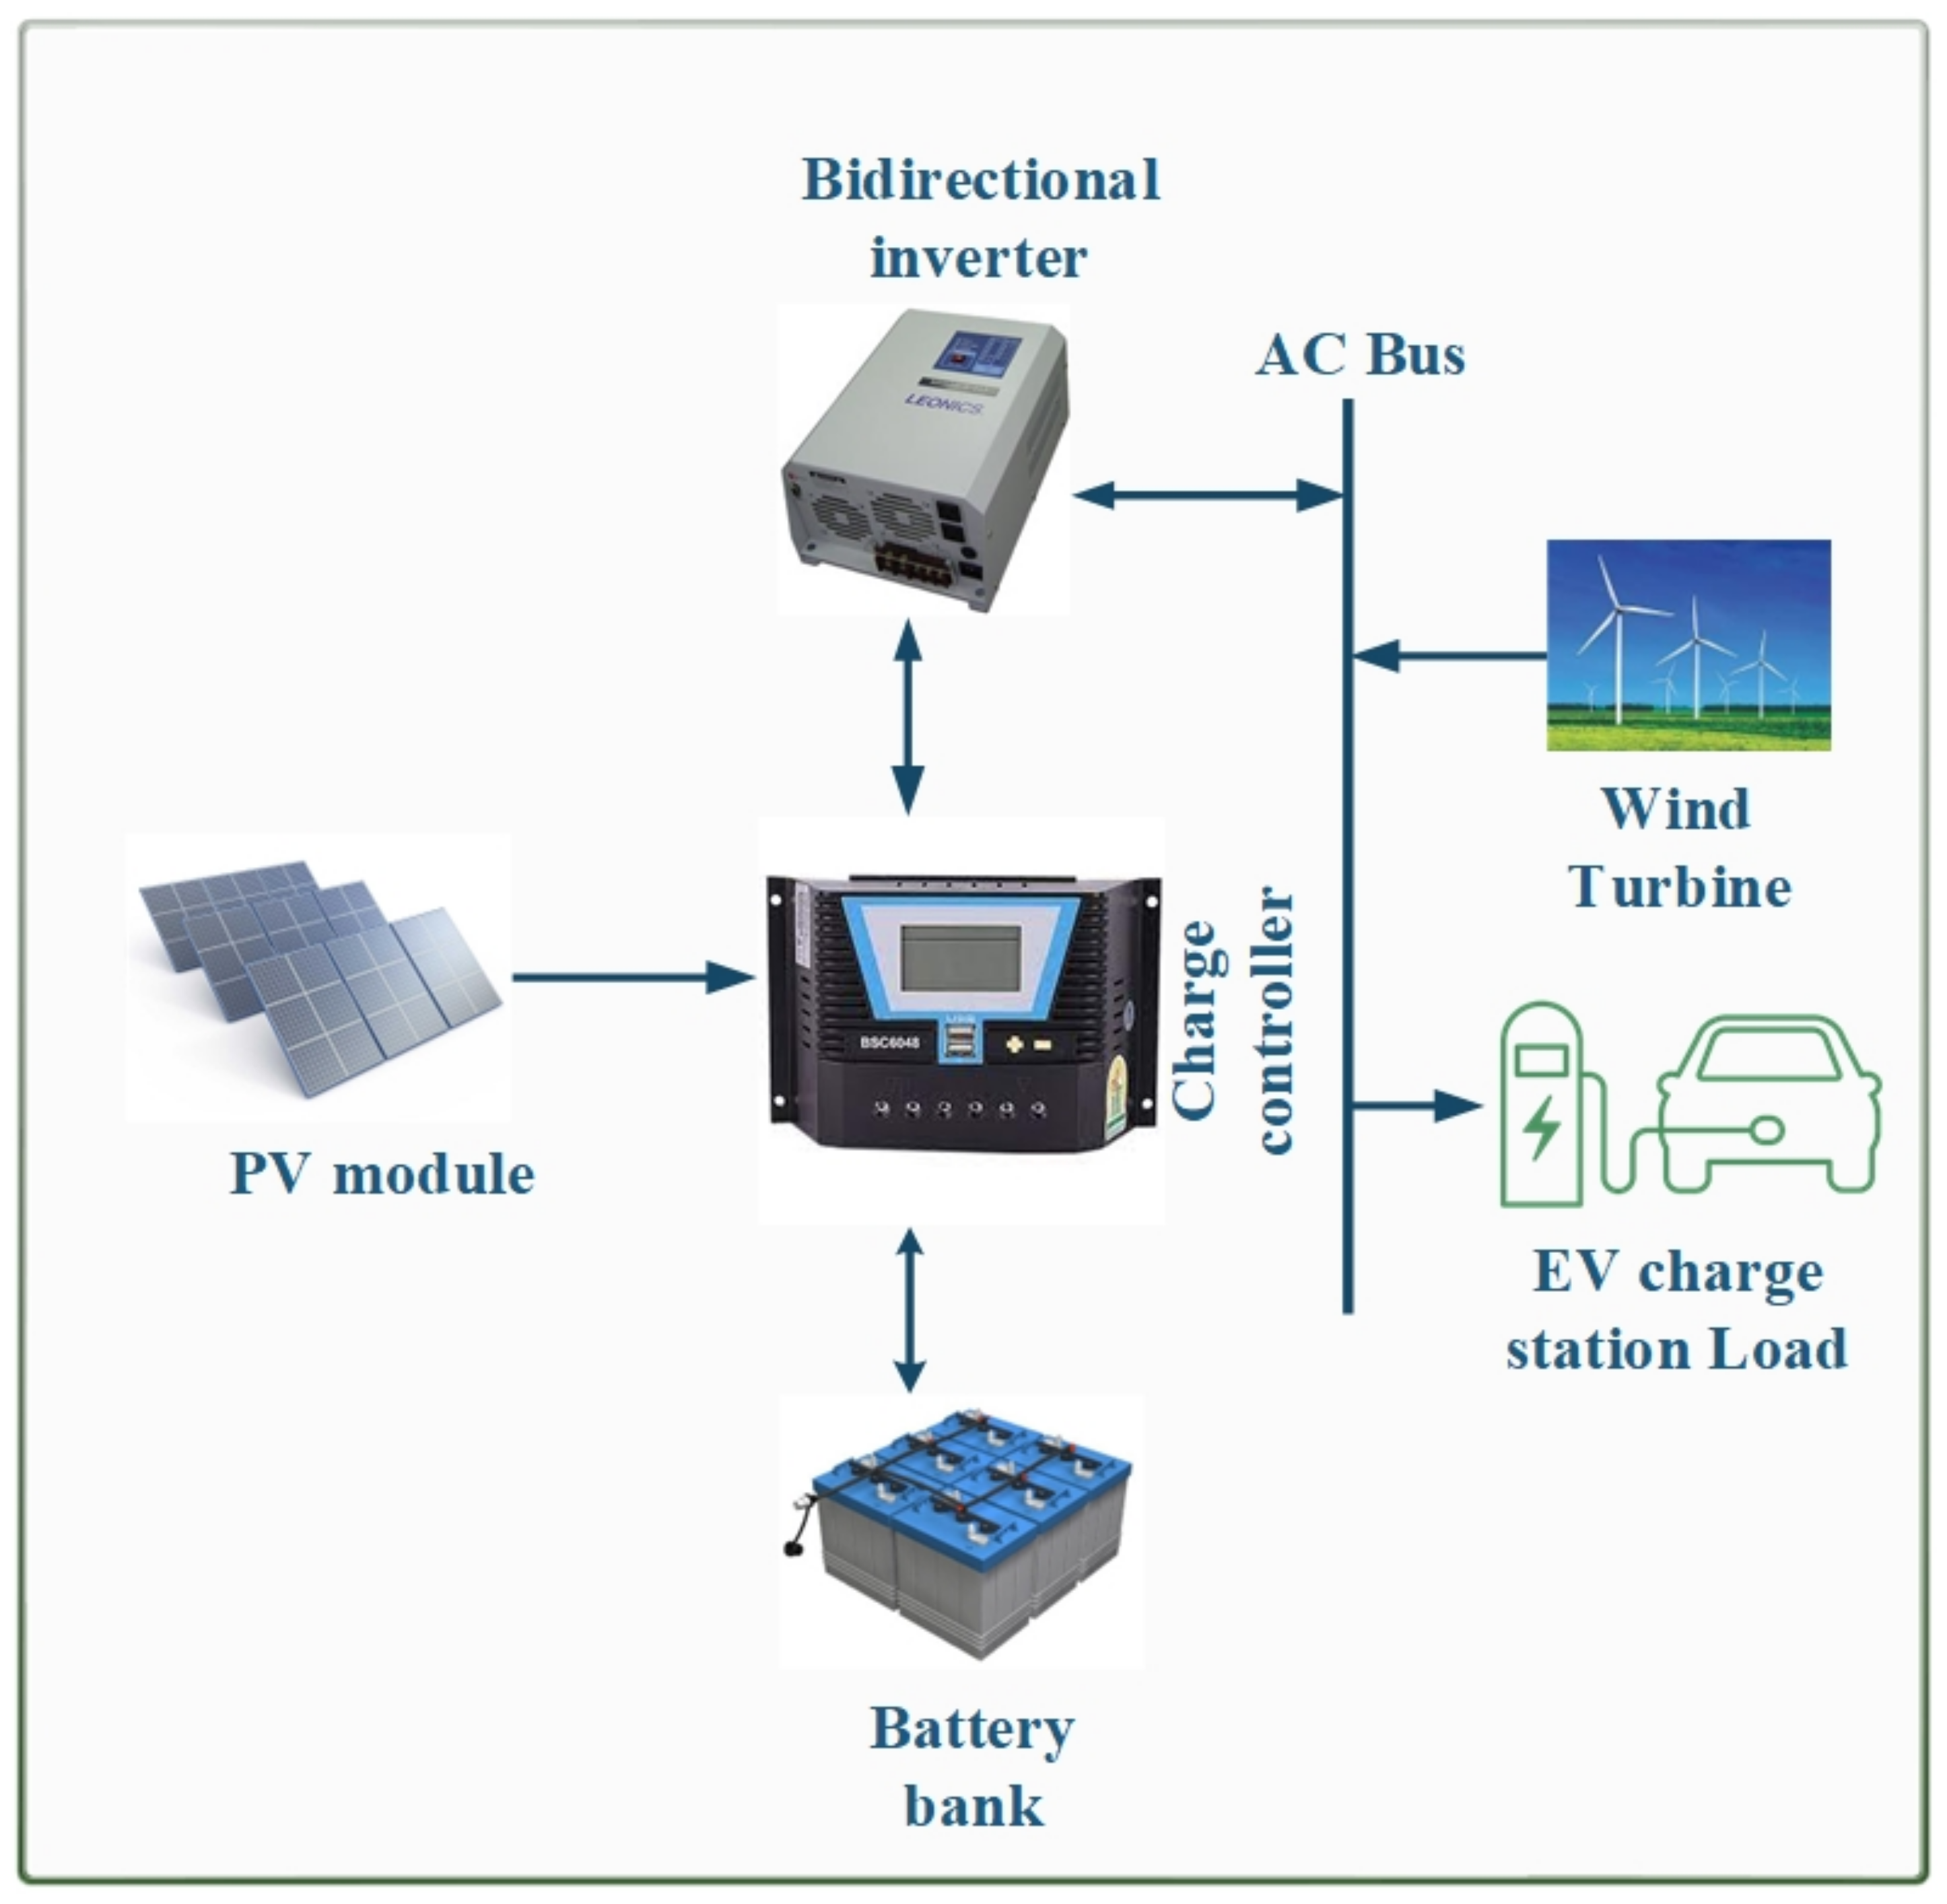
3. Mathematical Modeling of RE System Components

In this section, a mathematical model will be provided to represent the hybrid system’s many components, including solar panels, wind turbines, battery storage, and a charging station for EVs. Figure 2 is a schematic diagram of the suggested system.

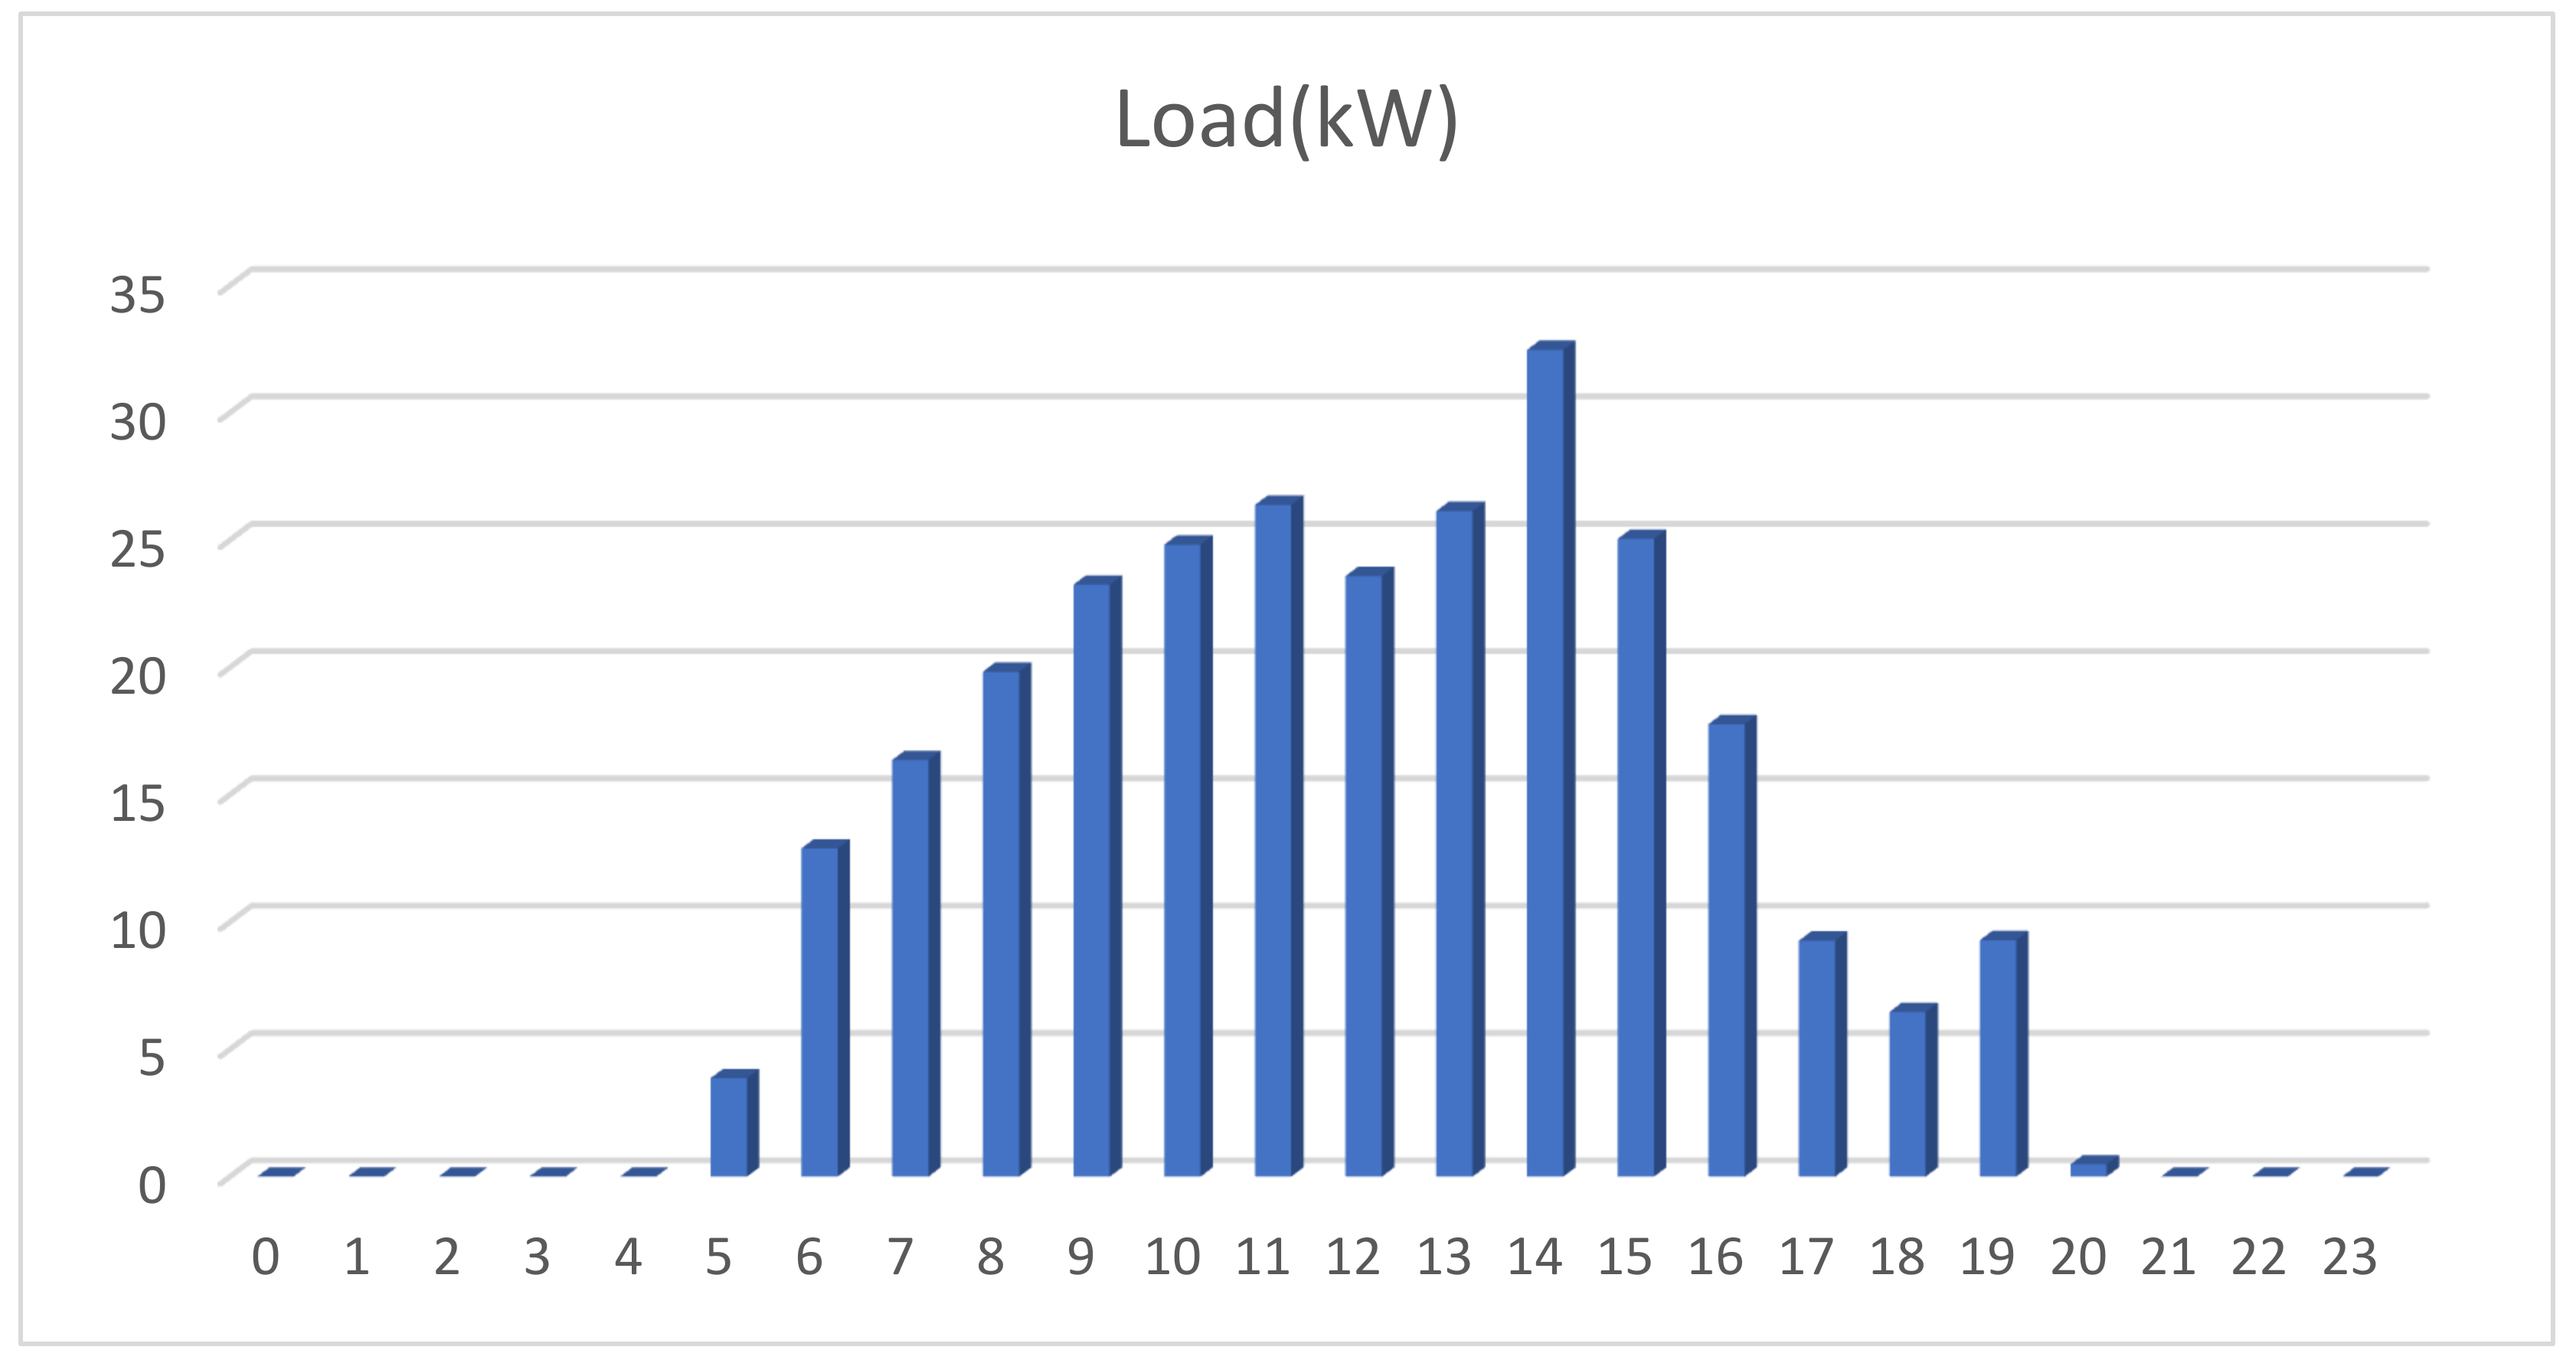
3.1. EV Charging Station Load Model

The present study considers the operational characteristics of a PVWB/EVCS. To simulate the EVCS’s charging demand, the hourly arrival rate of vehicles throughout the day was assumed. The operational period of the PVWB/EVCS is from 5.00 a.m. to 7.00 p.m. The load profile was generated based on four commercial EVs, namely Volkswagen e-Golf, Mercedes EQA 250, Fiat 500e Hatchback, and BMW i3. Each EV’s Battery Capacity (kWh), Charging Time (min), and Proportion of EV population (%) are provided in Table 1. Ten EV chargers, each with a capacity of 70 kW, were installed at the station. Variability was incorporated using HOMER Grid, with levels of 20% for charge duration variability, 10% for day-to-day variability, and 6% for variability in each time step. The number of EV visits per hour is shown in Figure 3.
A mathematical optimization model was developed using the anticipated demand profile and the availability of RES. The resulting daily profile of the EVCS is presented in Figure 4. The average load was found to be 276 kWh/day, with a peak of 91.5 kW and a load factor of 0.13.

3.2. PV Model

Solar technology is rapidly expanding due to its popularity in providing energy services in most regions. Despite solar energy generation’s small fraction of global energy consumption, its environmental and social benefits, combined with declining costs and supportive government policies, make it a promising energy source [65].
The output power of the PV generator over a period of one year can be expressed as follows [66]:
P p v t = P P V r × N p v × D F p v × S F p v × D E G F p v G t G b a s e 1 + K T T a m b t + G t × N O C T 20 800 * 1000 T b a s e
The proposed model calculates the hourly output power of a solar system using ambient temperature and global irradiance. The model applies derating factor, degradation, and shading factors of 96%, 98%, and 80%, respectively.

3.3. Wind Turbine Model

Wind energy has the potential to significantly reduce greenhouse gas (GHG) emissions. Technological developments in the field of wind energy have enabled the successful deployment of grid-connected wind turbines onshore and offshore. Despite the fluctuating nature of wind speeds, most regions possess a sufficient technical capacity for the implementation of wind energy. To further facilitate the adoption of this form of energy, policy measures may need to be considered. In addition, ongoing advancements in wind energy technology could lead to a reduction in cost, thus increasing its potential for GHG reduction [67].
The following method was used to calculate a wind turbine’s yearly power output. This calculation comprises determining the average wind speed at the turbine’s location and using that information to calculate the amount of energy that can be generated yearly [68]:
P W T t = N W T × η w × P W T r × V t 3 V c i 3 V r 3 V c i 3 ,         V c i   V V r N W T × η w × P W T r ,                                                         V r V V c o         0 ,                                                                                         V c o V   o r   V V c i
where V(t) is the upgraded wind speed in (m/s) at the hub height.
V t = V r H W T H r α .  
where H W T is the wind turbine hub height,   H r . is the reference height, and α is the friction coefficient that usually has a value of (1/7) for low roughness, surface, and well-exposed site [69,70].

3.4. Battery Storage System Model

A battery system plays a crucial role in a hybrid system, as it is responsible for storing surplus energy generated by renewable sources and releasing it back into the system as necessary. The selection and design of the battery system must be carefully considered to ensure that it can adapt to the dynamic energy demands of the hybrid system [71].
The following restrictions apply to the battery system used for energy storage:
C B a t , m i n C B a t t   C B a t , m a x
C B a t , m a x = C B a t , c a p
C B a t , m i n = C B a t , m a x 1 D O D
According to [72], the charging and discharging states of the battery are determined using Equations (7) and (8), respectively:
C t = C t 1 1 σ + s u r p l u s   p o w e r η b
C t = C t 1 1 σ d e f i c i t   p o w e r
It is important to note that throughout the discharging process, the battery discharge efficiency is considered to be equal to one [73].

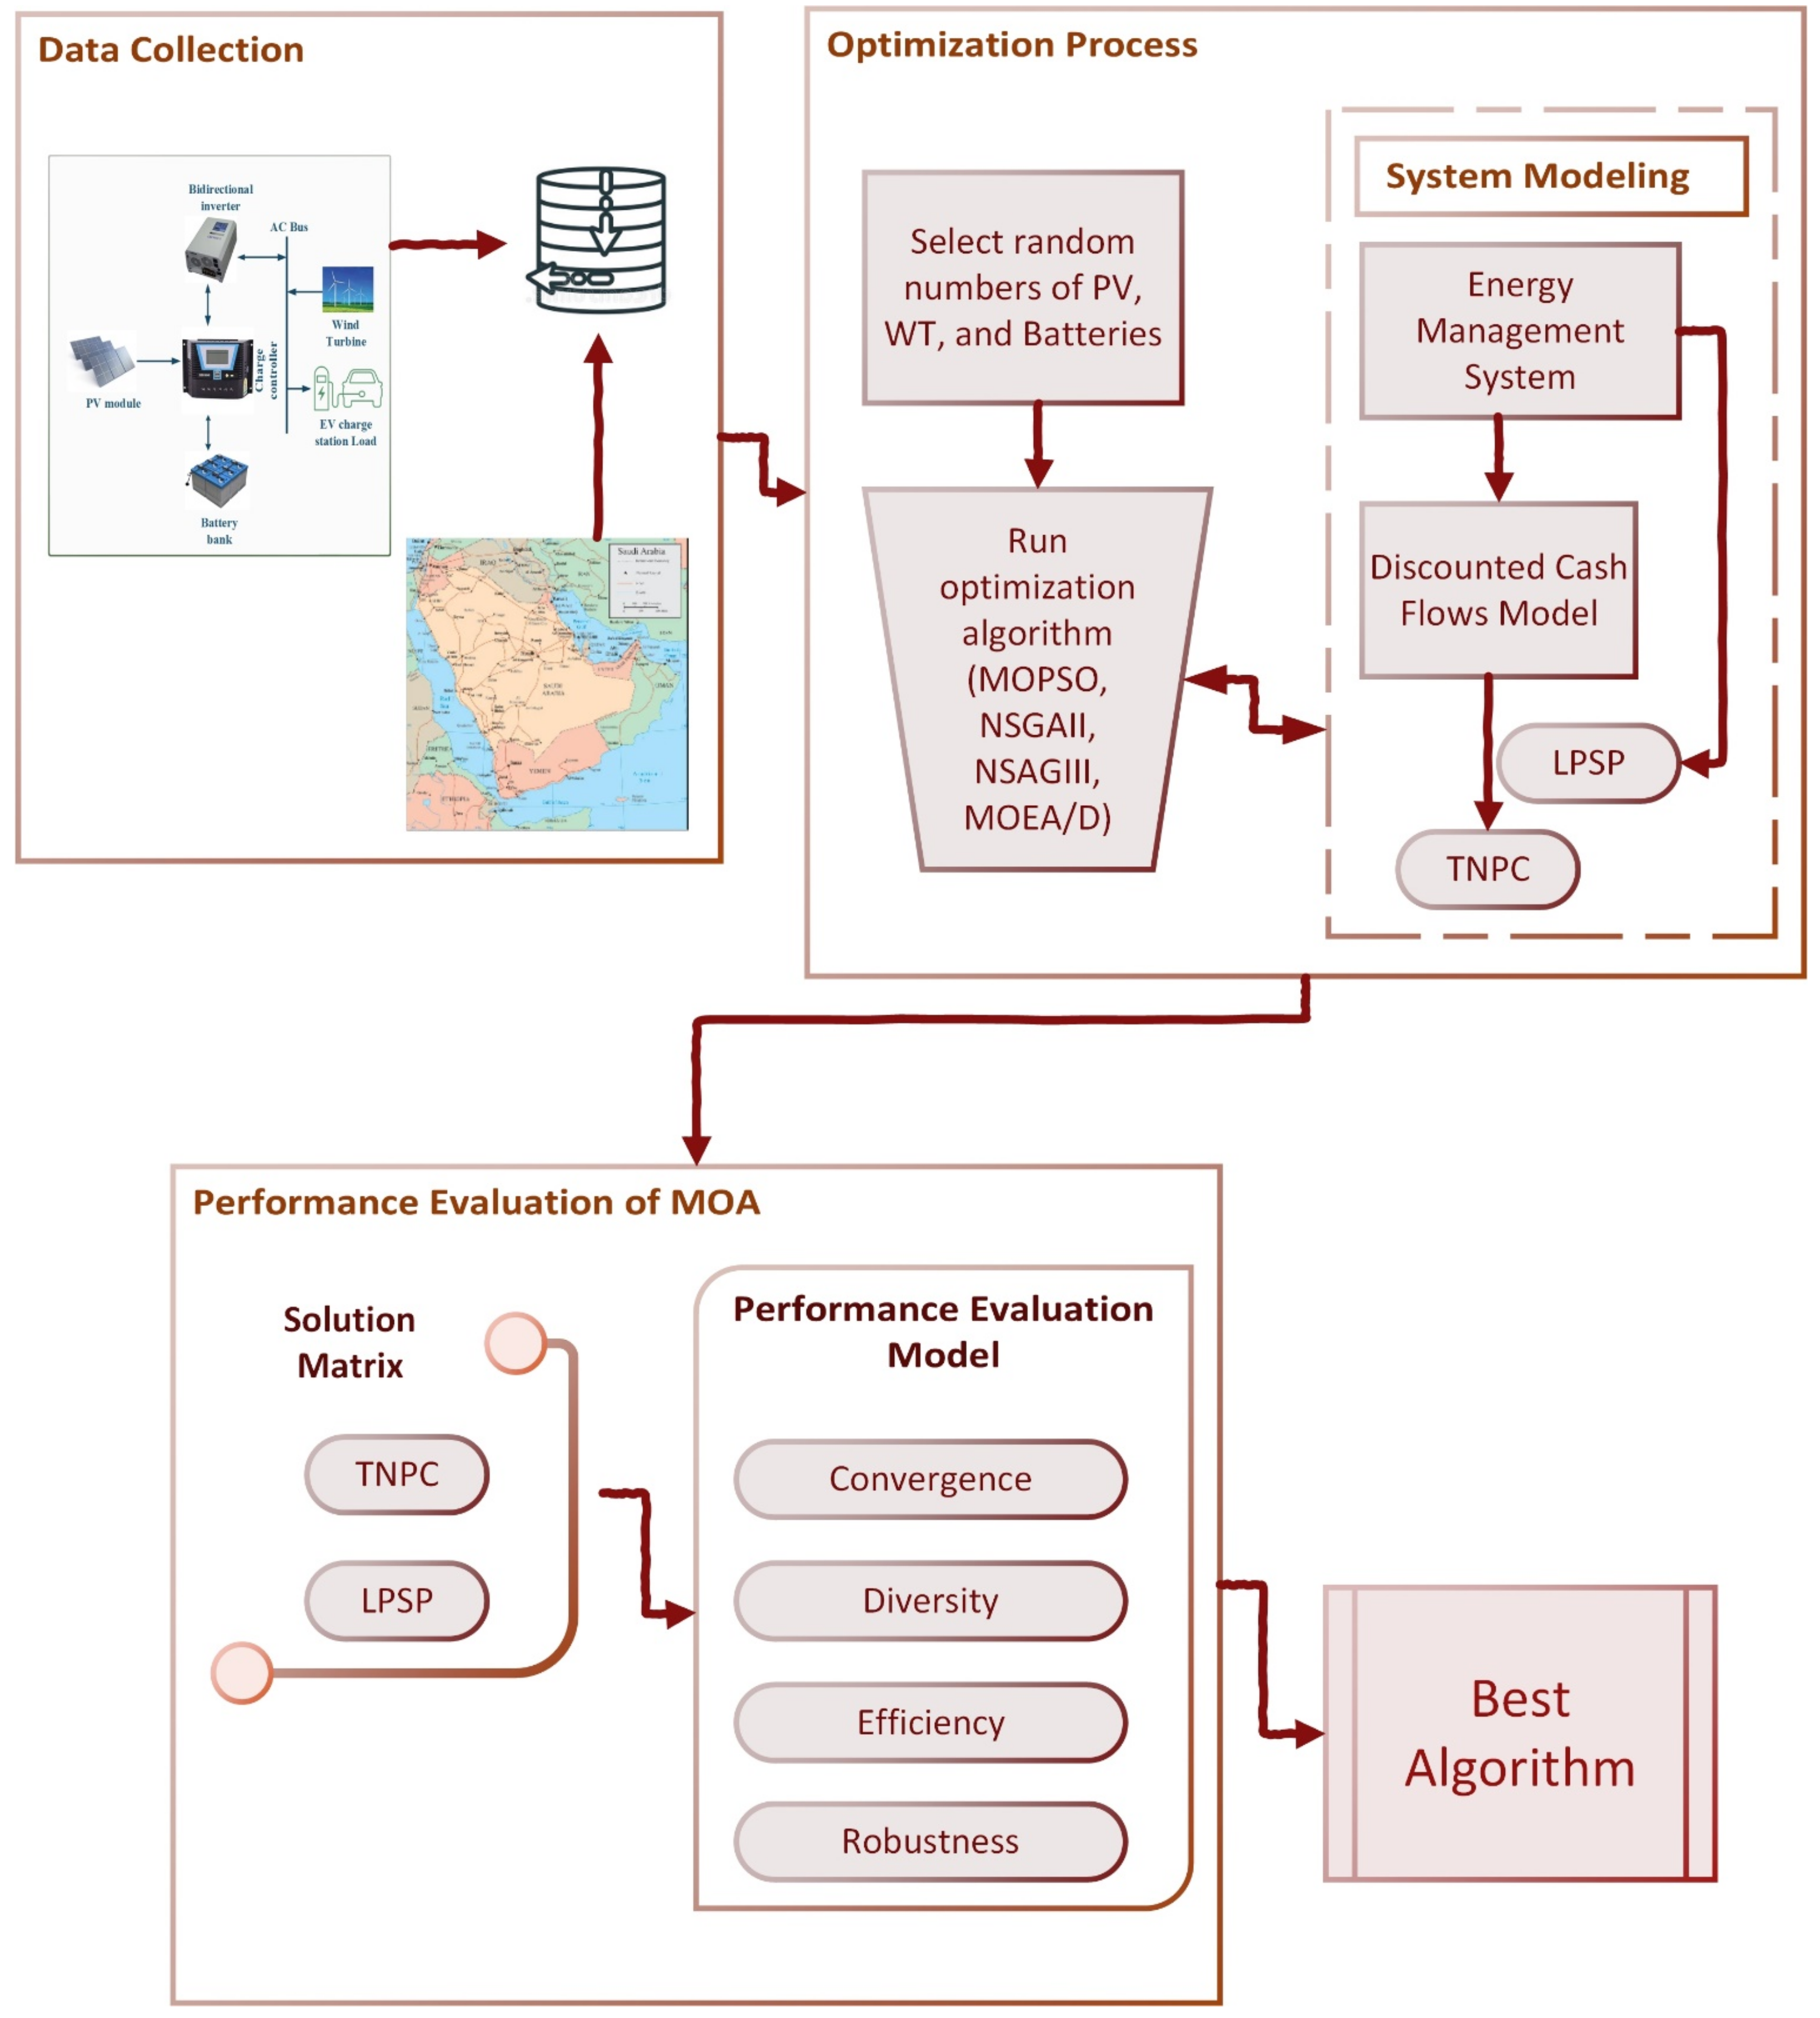
4. The Optimization Framework

The optimization model proposed in this research aims to determine the optimal number of wind turbines (WTs), PV panels, and batteries for the optimal configuration of a PVWB/EVCS system. To achieve this, the model performs a balancing process to minimize both the TNPC and the LPSP objectives.
The model utilizes four multi-objective optimization algorithms to address this complicated optimization problem: MOPSO, NSGAII, NSGAIII, and MOEA/D. These algorithms allow the model to concurrently examine several goals while accounting for their trade-offs.
However, the model demonstrates that there is a trade-off between the two goals, with LPSP minimization increasing total system cost. Therefore, from the Pareto optimal set of solutions generated by the model, designers should select a final solution that best suits their specific use case and preferences. This procedure of rigorous balancing is necessary to ensure that the proposed system is cost-effective and dependable, fulfilling the energy demands of the system’s users without compromising the system’s overall efficiency.
Objective functions can be represented as:
O b j 1 = M i n T N P C
O b j 2 = M i n L P S P
Subject   to :   N x m i n N x N x m a x ,   x P V , W T , B A T P p v t + P W T t ± C B a t t × T i m e   s t e p P E V C S t × T i m e s t e p η i n v C B a t , m i n C B a t t   C B a t , m a x

4.1. Total Net Present Cost

The minimization of TNPC holds significant importance in establishing the financial feasibility and viability of the proposed hybrid system. TNPC accounts for the initial expenses incurred during equipment acquisition, installation, upkeep, and decommissioning. Apart from its financial significance, reducing TNPC can also serve as a significant stride toward achieving sustainability goals. Lowering the costs of renewable energy systems can encourage wider acceptance and boost the integration of clean energy into the global energy portfolio.
The following equations are utilized in determining the TNPC:
T N P C = x C I + C R + C O & M S
C N P C = n = 0 N p r o j C I ( n ) + C R ( n ) + C O & M ( n ) S ( n ) × 1 1 + I r n
C I = N P V C I P V + N b a t C I b a t + N W T C I W T
C R = N P V C R P V + N b a t C R b a t + N W T C R W T
C O & M = N P V C O & M P V + N b a t C O & M b a t + N W T C O & M W T
S T = N P V S P V + N b a t S b a t + N W T S W T
The real interest rate reflects the impact of inflation on the costs and benefits of the proposed hybrid system over time. Fisher’s formula is applied in determining the real interest rate.
I r = i i f 1 + i f  
The salvage value (Sx) of each component of the proposed hybrid system is the system’s anticipated worth at the end of its useful life. The following equation is used to calculate Sx:
S x = C R N c o m p N p r o j N c o m p × I N T N p r o j N c o m p N c o m p
The levelized Cost of Energy (LCOE) provides a comprehensive view of the whole cost of energy generation. By calculating the LCOE, it is possible to evaluate the economic viability of different energy-producing systems and make informed decisions on which system is the most cost-effective and sustainable over time. The LCOE is also significant for energy providers since it specifies the energy price that must be paid for the system to be economically viable.
L C O E = C N P C E s e r v e d × i   1 + i + I f 1 + I f R p r o j   1 + i + I f 1 + I f R p r o j   1

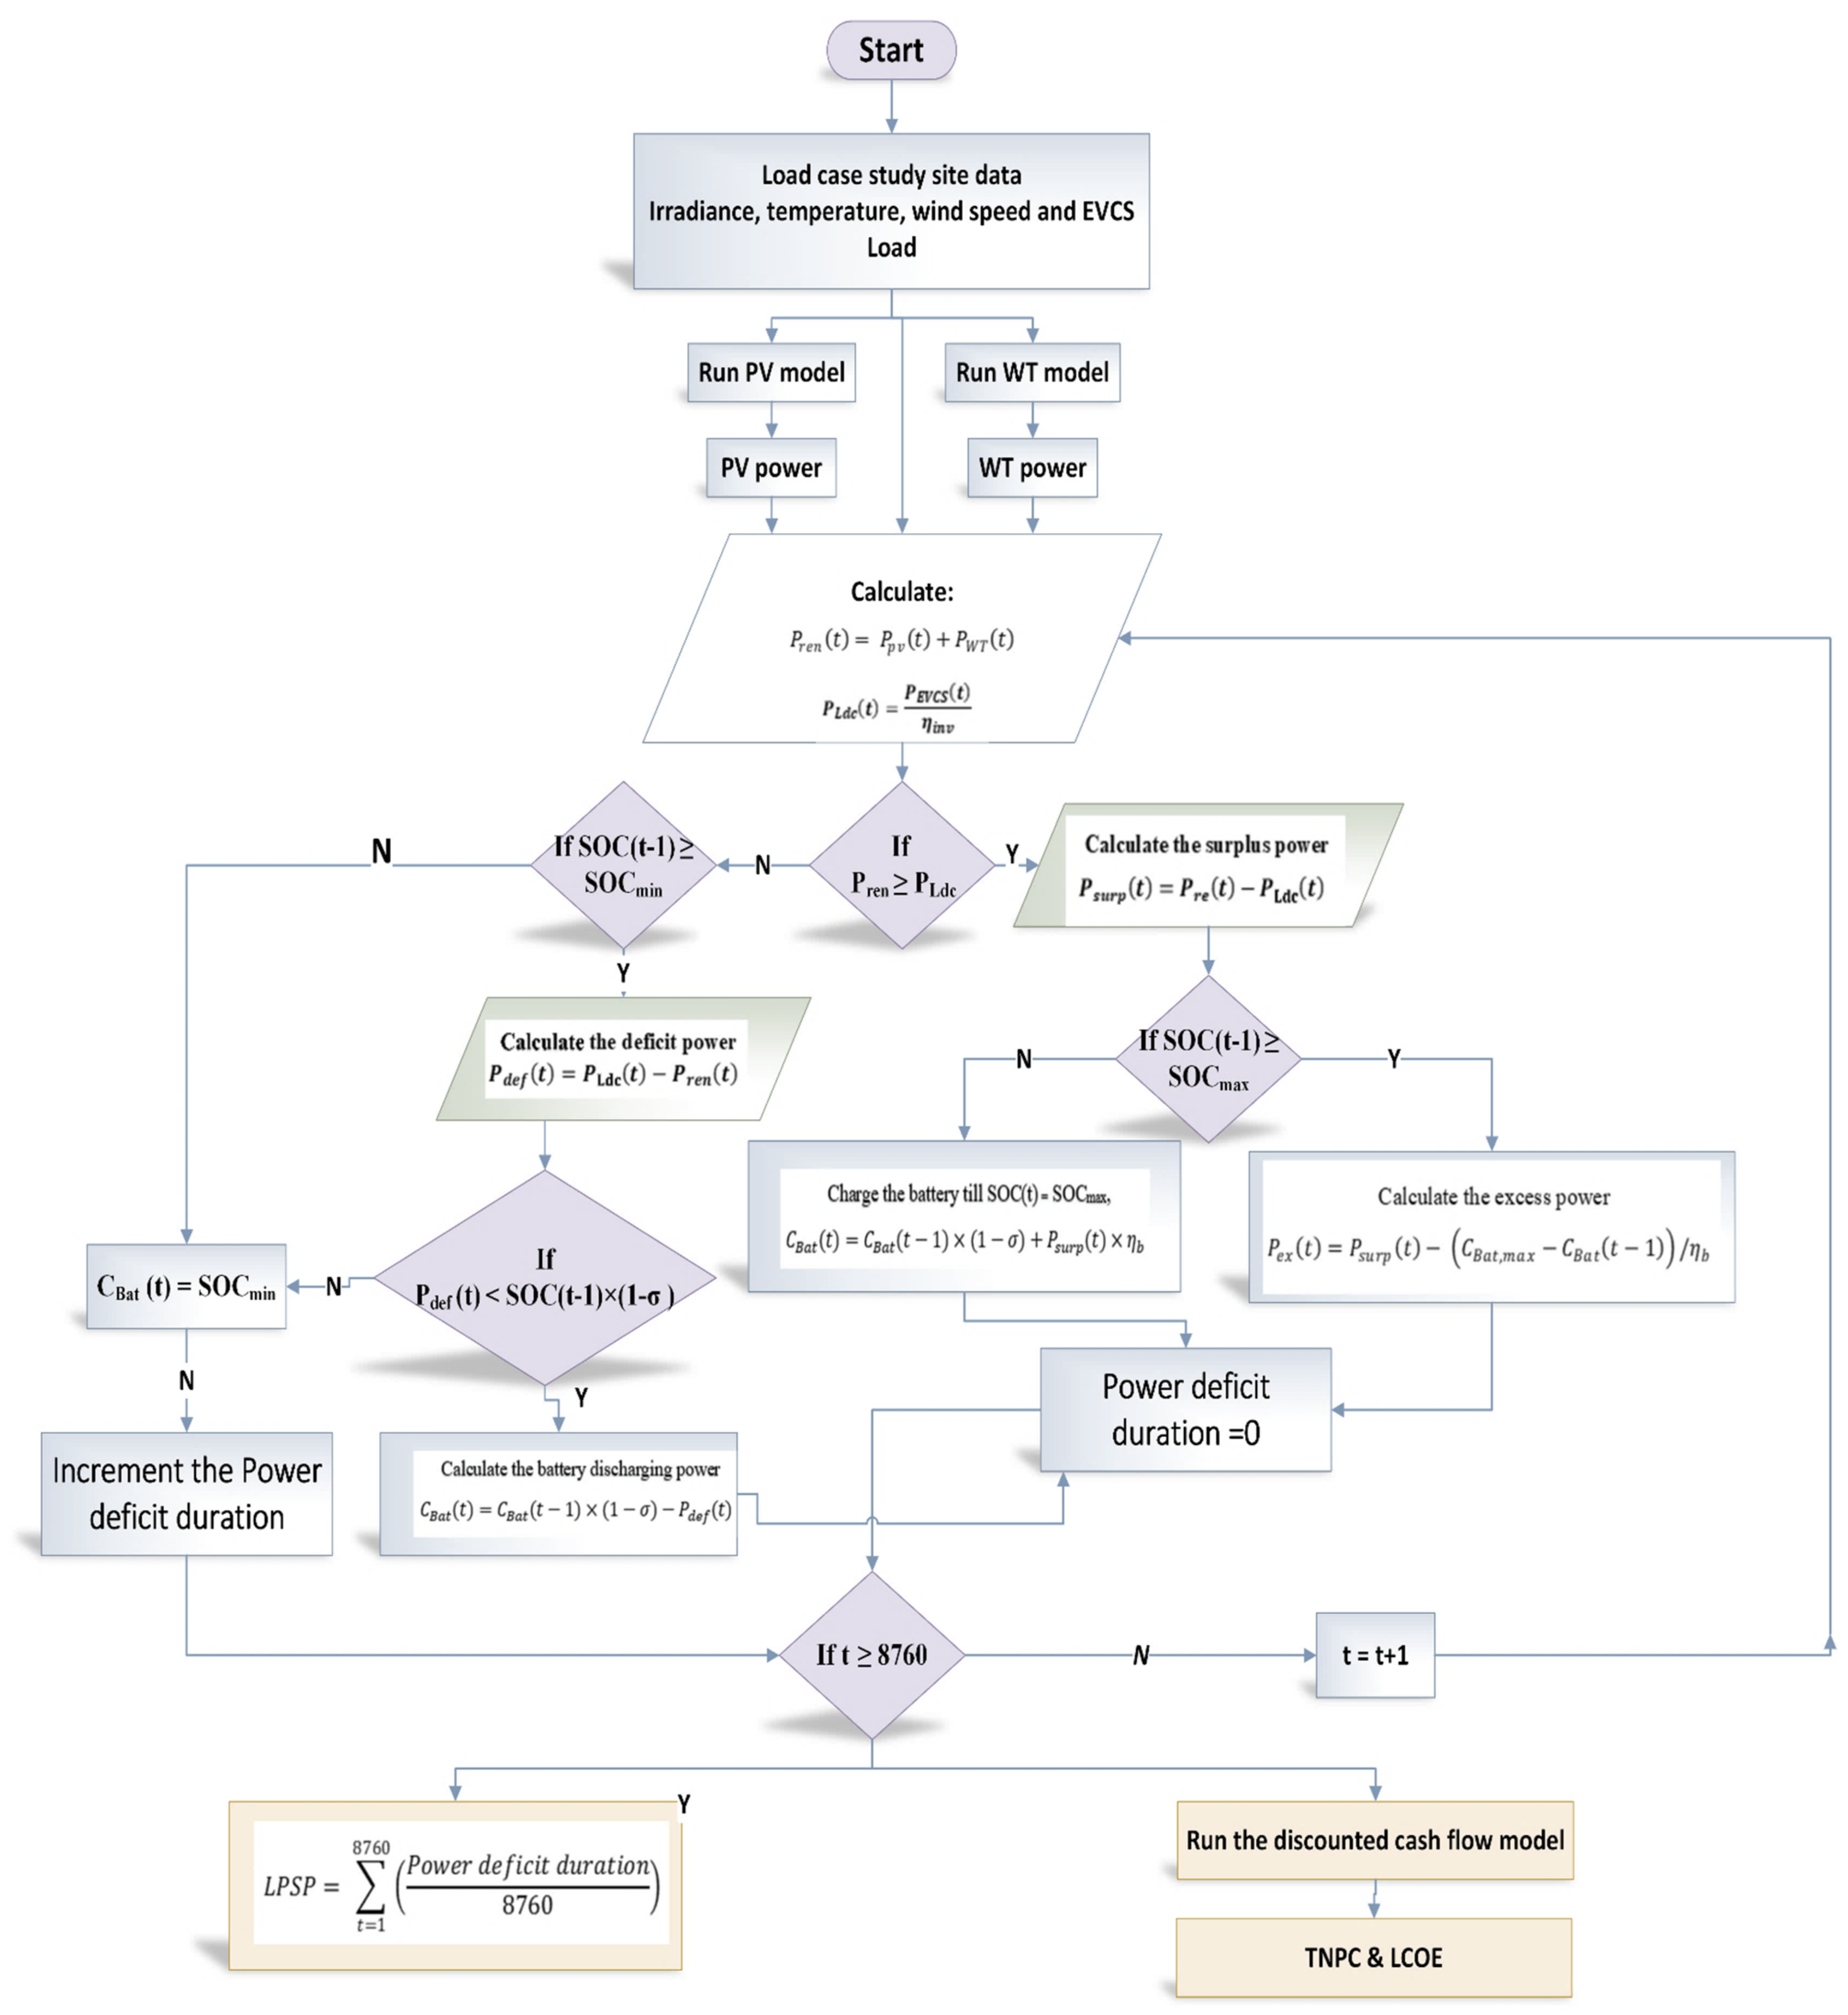
4.2. Loss of Power Supply Probability

Calculating LPSP provides insight into the system’s reliability and safety. The LPSP is the possibility that the energy supply system will be unable to meet the load demand. It may take on values between 0 and 1, with 1 indicating that the system will not be able to fulfill the load demand and 0 implying that the system will always be able to meet the demand. The calculation of LPSP helps in optimizing the system’s design to ensure an optimal balance between energy generation, energy storage, and energy demand.
LPSP is commonly used in the literature to assess the system’s reliability [16,18,74,75,76]. LPSP is computed by dividing the entire time the system is unable to satisfy the demand by the whole time of the period under consideration [77].
L P S P = t = 1 8760 u n i t y P p v t + P W T t + C t < P E V C S 8760

4.3. The Proposed System’s Energy Management Technique

The proposed PVWB/EVCS system employs an advanced energy management technology to deliver a dependable and sustainable power supply. The system is designed to optimally allocate its energy resources by considering various possibilities during operation. If the total power generated by renewable sources is more than the power demand, the load demand is met and the battery is fully charged, while any surplus energy is left unused. On the other hand, if the total power generated falls short of the demand, the battery storage bank is used to supplement the shortfall, ensuring that the minimum state of charge is maintained. If the combined energy from renewable sources and the battery storage is still insufficient to meet the load demand, it is considered a loss of load supply, which is calculated using a specific equation by the energy management algorithm. This approach enhances the system’s efficiency and effectiveness, ensuring optimal energy allocation.
Figure 5 illustrates a flowchart diagram of the energy management system proposed in the study. The flowchart diagram illustrates various scenarios considered during the system’s operation and the corresponding actions performed to effectively allocate energy resources. This refined energy management system aims to provide a reliable and sustainable power supply, which is critical for the successful implementation of renewable energy systems.

5. Optimization Algorithms

In this analysis, the optimal capacity configuration and scheduling strategy for the Photovoltaic–Wind Turbine–Battery/Electric Vehicle Charging Station (PVWB/EVCS) system are examined using multi-objective algorithms. The algorithms utilized include MOPSO, NSGAII, NSAGIII, and MOEA/D, which are applied to the bi-objective optimization model to determine the optimal solutions. The selection of the optimal solution is then carried out through the utilization of the Pareto method. To assess the performance of the algorithms, a model was established that evaluated the criteria of convergence, diversity, efficiency, scalability, and robustness. This methodology aims to determine the most suitable algorithm for attaining the Pareto-optimal solution for the PVWB/EVCS system.
Table 2 provides a comprehensive list of the essential parameters employed in the adopted optimization algorithms. These parameters play a pivotal role in achieving a successful and efficient optimization process. The values assigned to each parameter are selected meticulously to guarantee that the algorithms can converge to a Pareto-optimal solution. Moreover, to prevent the algorithms from being trapped in a local optimum, the initialization of each algorithm is restarted every 40 iterations.

5.1. Multi-Objective Particle Swarm Optimization

MOPSO is a meta-heuristic optimization algorithm that is used to solve multi-objective optimization problems. It is based on the concept of PSO, which is a swarm intelligence algorithm that mimics the social behavior of birds in flocks. The MOPSO algorithm extends the PSO algorithm by incorporating a non-dominated sorting mechanism to handle multiple objectives [78,79].
The algorithm for using MOPSO in the optimization of the (PVWB/EVCS) system can be described as follows (Algorithm 1):
Algorithm 1: Multi-objective Particle Swarm Optimization (MOPSO)
1. Initialize population of particles
2. Evaluate objective functions for each particle and calculate their fitness values
3. Identify non-dominated solutions among the particles and store them in a reference set.
4. Repeat steps 4.1 to 4.4 until a stopping criterion is met or for a predefined number of iterations.
  4.1. Update velocity of each particle based on optimal positions of other particles and non-dominated solutions in reference set.
  4.2. Update position of each particle based on updated velocity.
  4.3. Evaluate new objective functions for each updated particle and calculate their fitness values.
  4.4. Update reference set with newly evaluated solutions.
5. Select best solution from reference set based on criteria specified in optimization problem.
6. Return the best solution as the result of the optimization process.

5.2. Non-Dominated Sorting Genetic Algorithm II

NSGA-II is a multi-objective optimization algorithm that combines a non-dominated sorting approach with a genetic algorithm. NSGA-II is one of the most widely used algorithms for solving multi-objective optimization problems due to its efficiency and effectiveness [41,80]. The algorithm for using NSGA-II in the optimization of the (PVWB/EVCS) system can be described as follows (Algorithm 2):
Algorithm 2: Non-dominated Sorting Genetic Algorithm (NSGA-II)
1. Problem Definition
  a. Define the objective function to be optimized.
  b. Define the constraints that must be satisfied.
2. Initialization
  a. Generate a set of initial solutions.
  b. Evaluate the solutions using the objective function and constraints.
  c. Create an initial non-dominated set using the evaluated solutions.
3. Fast Non-dominated Sorting
  a. Sort the solutions into non-domination levels to create a front of non-dominated
    solutions.
  b. Assign a crowding distance to each solution in each front.
4. Create the Offspring Population
  a. Select solutions from the current front to generate offspring solutions through
    genetic operators (crossover and mutation).
  b. Evaluate the offspring solutions using the objective function and constraints.
5. Merge the Parent and Offspring Populations
  a. Combine the parent and offspring solutions into a single set.
6. Environmental Selection
  a. Select the next generation of solutions from the combined set, based on non-
    domination level and crowding distance.
  b. Solutions with the lowest non-domination level and highest crowding distance are
    preferred.
7. Repeat from Step 3
  a. Repeat the process from Step 3 until a stopping criterion is met (maximum
    number of generations).
8. Return the best solution
  a. Return the solution with the best fitness as the result of the optimization.

5.3. Non-Dominated Sorting Genetic Algorithm III

NSGA-III is a multi-objective optimization algorithm that is used to solve problems with multiple conflicting objectives. The algorithm was introduced in 2002 and is an improvement over its predecessor, NSGA-II. The algorithm sorts the solutions obtained into different non-dominated levels or fronts, and the solutions in the lower fronts are considered to be more optimal [81]. The algorithm for using NSGA-III in the optimization of the (PVWB/EVCS) system can be described as follows (Algorithm 3):
Algorithm 3: Non-dominated Sorting Genetic Algorithm (NSGA-III)
1. Initialization: Generate an initial population of solutions, where each solution represents a candidate design for the (PVWB/EVCS) system.
2. Non-dominated Sorting: Sort the solutions in the initial population based on their non-domination levels. A solution is considered non-dominated if it is not dominated by any other solution in the population.
3. Crowding Distance Calculation: Calculate the crowding distance of each solution. The crowding distance measures the degree of separation between solutions in the population and helps to prevent premature convergence.
4. Selection: Select a set of solutions to form the mating pool for the next generation. The selection process is based on the non-dominated levels and crowding distances of the solutions.
5. Mating: Use genetic operators such as crossover and mutation to generate offspring solutions from the mating pool.
6. Evaluation: Evaluate the fitness of the offspring solutions by calculating their objectives.
7. Non-dominated Sorting and Crowding Distance Calculation: Repeat steps 2 to 3 for the offspring solutions.
8. Replacement: Replace the solutions in the current population with the offspring solutions to form the next generation.
9. Termination: Repeat steps 4 to 8 until a termination criterion is met, such as a maximum number of generations.
10. Result: Return the final set of non-dominated solutions as the result of the optimization process. These solutions represent the best trade-off designs for the (PVWB/EVCS) system based on the objectives used in the optimization process.

5.4. Multi-Objective Evolutionary Algorithm Based on Decomposition

MOEA/D is a popular multi-objective optimization algorithm used in solving problems with multiple conflicting objectives. The main idea behind MOEA/D is to decompose the multi-objective optimization problem into a set of scalar sub-problems, which are then solved using an evolutionary algorithm. The solution to each sub-problem represents a particular trade-off between the conflicting objectives [43].
The following algorithm is involved in using MOEA/D for the optimization of the (PVWB/EVCS) system (Algorithm 4).
Algorithm 4: Multi-Objective Evolutionary Algorithm based on Decomposition (MOEA/D)
Step 1: Initialization
  • Define the number of objectives (m) and decision variables (n).
  • Generate an initial population of N individuals with random solutions.
  • Establish weight vectors (W) for each objective.
Step 2: Scalarization
  • Calculate the scalar value (F) for each individual in the population using weight vectors (W) and objective values (f).
  • Sort the population based on scalar values (F).
Step 3: Mating Selection
  • Select the mating pool using scalar values (F) and crowding distance (d).
  • Generate the offspring population via crossover and mutation operations using the mating pool.
Step 4: Population Update
  • Replace the worst individuals in the population with the offspring.
  • Update weight vectors (W) based on evolution history of the population.
Step 5: Repeat until stopping criterion is met
  • The stopping criterion could be a maximum number of iterations or convergence of the population.
  • Repeat steps 2 to 4 until stopping criterion is reached.
Result: Return the final set of non-dominated solutions as the result of the optimization process. These solutions represent the best trade-off designs for the system based on the objectives used in the optimization process.

5.5. Performance Evaluation of Multi-Objective Optimization Algorithms

The evaluation of the performance of multi-objective optimization algorithms plays a crucial role in selecting the most appropriate method for a given problem. To assess these algorithms, a systematic methodology that considers multiple criteria is widely adopted. This algorithm evaluates the following key aspects: Convergence, Diversity, Efficiency, and Robustness (Algorithm 5).
Algorithm 5: Performance Evaluation of Multi-Objective Optimization Algorithms
INPUT: Set of multi-objective optimization algorithms, problem to be optimized (sizing of the PVWB/EVCS system)
OUTPUT: Best algorithm for sizing the PVWB/EVCS system
1. SELECT a set of multi-objective optimization algorithms to be evaluated, including algorithms such as MOPSO, NSGA-II, NSGA-III, MOEA/D.
2. DEFINE the problem to be optimized, in this case the sizing of the PVWB/EVCS system.
3. FOR each algorithm,
 a. RUN it several times to find a set of solutions.
 b. CALCULATE the performance metrics for each set of solutions (Convergence, Diversity, Efficiency, and Robustness).
4. DISPLAY the performance metrics for each algorithm in a table.
5. Compute the performance score for each algorithm by summing up the performance metrics for each algorithm.
6. COMPARE the algorithms based on the performance metrics and determine the best-performing algorithm.

5.5.1. Convergence Metric

In multi-objective heuristic optimization, convergence is a measure of how well an algorithm can approach the true Pareto front, which consists of all non-dominated solutions. The convergence metric is used to assess the effectiveness of an algorithm in finding solutions that are close to the true Pareto front [82,83].
One popular convergence metric is the hypervolume metric, which measures the volume of the objective space that is dominated by a set of solutions with respect to a reference point [84,85]. A lower hypervolume value indicates a better convergence of the algorithm.
The hypervolume H is defined as the volume of the objective space dominated by a set of solutions S with respect to a reference point r . The reference point is typically set to the point of worst performance among each objective, and it serves as a baseline for measuring the improvement in solution quality.
To compute the hypervolume [86], the solutions need to be sorted in descending order for each objective. Then, for each solution s i in the sorted list, the hypervolume of the space dominated by that solution and all solutions with a higher index (i.e., better performance) is computed. The hypervolume of a solution set S can be calculated as follows:
H V S , r = i = 1 S H S i , r H S i 1 , r
where S i denotes the set of solutions in S with indices less than or equal to i
The hypervolume can be used to compute the convergence metric as a percentage:
Convergence = 100 % × 1 H V S , r m a x H V S , r m i n
where r m a x and r m i n are the reference points corresponding to the maximum and minimum values of each objective, respectively. The convergence metric ranges from 0% to 100%, where a higher value indicates a better convergence of the algorithm to the true Pareto front.

5.5.2. Diversity Metric

Diversity is a measure of the distribution of solutions in the objective space [87,88]. It captures the degree of similarity among solutions and is an important indicator of the robustness and reliability of Multi-Objective Heuristic Optimization algorithms.
Let S be a set of solutions found by a multi-objective optimization algorithm, where each solution is represented by a vector of decision variables x . The diversity metric is calculated as the average distance of each solution in S to the mean of S .
First, the mean and standard deviation of each decision variable in S are calculated as:
μ j = 1 S i = 1 S x i j
and
σ j = 1 S i = 1 S x i j μ j 2
where μ j and σ j are the mean and standard deviation of the j -th decision variable in S , and S is the size of S .
Next, the distance of each solution in S to the mean of S is calculated as:
d i = j = 1 d x i j μ j σ j 2
where d i is the distance of the i -th solution in S to the mean of S , d is the number of decision variables, x i j is the value of the i -th decision variable in the i -th solution, μ j and σ j are the mean and standard deviation of the j -th decision variable in S .
Finally, the diversity metric is calculated as the average of all distances:
d i v e r s i t y = 1 S i = 1 S d i

5.5.3. Efficiency Metric

The efficiency metric measures the ability of an algorithm to generate a set of non-dominated solutions within a given time frame [84]. It is calculated as the hypervolume divided by the product of the number of non-dominated solutions and the time taken by the algorithm.
The number of non-dominated solutions is calculated by performing non-dominated sorting on the solution set. This process identifies the solutions that are not dominated by any other solution in the set. The number of non-dominated solutions is then used to calculate the efficiency of the algorithm.
efficiency = hypervolume × 100 number of non - dominated solutions × time taken by the algorithm

5.5.4. Robustness Metric

Robust multi-objective optimization (MOO) is an important research area that deals with the optimization of complex systems under uncertainty. It involves finding a set of solutions that are not only optimal but also robust and insensitive to changes in the problem parameters, such as decision variables, objective functions, or constraints. Several robustness measures have been proposed in the literature to evaluate the degree of insensitivity and stability of the solutions.
Bertsimas and Sim [89] introduced the concept of robust optimization and proposed the price of robustness as a measure of the cost of ensuring robustness. Ehrgott et al. [90] proposed the minmax robustness measure for multi-objective problems, which evaluates the worst-case performance of a solution set under uncertainty. Eker and Kwakkel [91] proposed an approach to include robustness considerations in the search phase of many-objective robust decision-making problems.
Kasprzyk et al. [92] proposed a many-objective robust decision-making framework for complex environmental systems that undergo change, while Shavazipour et al. [93] proposed a multi-scenario multi-objective robust optimization approach under deep uncertainty. Schöbel and Zhou-Kangas [94] analyzed the price of multi-objective robustness and proposed a methodology to evaluate solution sets to uncertain multi-objective problems.
One widely used approach to calculate the robustness metric is the distance-based method, which considers the distances between all pairs of solutions in the set [95]. The robustness indicator can be calculated as a percentage using the following equation:
Robustness = 1 1 + m a x _ d i s t a n c e
where m a x _ d i s t a n c e is the maximum distance between any two solutions in the set.

6. Results and Discussion

6.1. Case Study

The renewable energy potential of the region surrounding Jouf University in Saudi Arabia was analyzed in this paper through a case study. The study aimed to determine the feasibility of developing a hybrid renewable energy system capable of providing the institution and neighboring communities with a reliable source of sustainable electricity. The annual average global irradiance for solar energy was found to be 5.76, as indicated in Figure 6, while the annual average wind speed was 5.44 m/s, as depicted in Figure 7. These results reveal that the region has significant potential for renewable energy development. The data utilized in this study were obtained from the NASA Prediction of Worldwide Energy Resource (POWER) database [96].
Table 3 lists various parameters of the proposed system components, including capacity, initial cost (IC), replacement cost (RC), annual operation and maintenance cost (O&M), and lifetime.

6.2. Results

The results of the multi-objective optimization of the hybrid charging system were analyzed using four different algorithms, namely MOPSO, NSGA-II, NSGA-III, and MOEA/D. The optimization was based on two objectives, namely TNPC and LPSP.
Figure 8 displays the Pareto front plots of TNPC vs. LPSP for the four suggested optimization algorithms. These plots serve as visual representations of the trade-offs between the two objectives and showcase the Pareto-optimal solutions generated by each algorithm. As evident from the figure, a clear trade-off exists between the two objectives, with a decrease in the LPSP ratio leading to an increase in the TNPC value.
The results of the Performance Evaluation metric are displayed as a radar plot (Figure 9), depicting the values of four distinct metrics, convergence, diversity, efficiency, and robustness, for four widely used multi-objective optimization algorithms, namely MOEA-D, NSGA-II, NSGA-III, and MOPSO. The radar plot reveals that the highest overall performance is achieved by NSGA-II, with the best scores for convergence and diversity. NSGA-III has the highest efficiency score, while MOPSO attains the highest diversity score. However, MOEA-D is observed to have the highest robustness score, indicating its suitability for diverse problem conditions. Overall, the radar plot provides a graphical representation of the strengths and weaknesses of the four algorithms based on the selected metrics, facilitating the selection of an appropriate algorithm for a given multi-objective optimization problem.
In this section, the results of the multi-objective optimization of the proposed PVWB/EVCS system are presented. The Pareto-optimal system outputs obtained from the four proposed MOOAs and the results obtained from HOMER are shown in Table 4. The Pareto-optimal system mix with the least TNPC is found by MOEA-D, which consists of a 223 kW PV system, an 80 kW wind turbine, and seven Lithium-Ion battery banks. The TNPC of the optimum system is USD 564,846, with an LCOE of 0.2521 USD/kWh and an LPSP of 1.21%. Higher TNPC values of USD 596,662, USD 601,519, and USD 643,510 are obtained by MOPSO, NSGA-III, and NSGA-II, respectively. The LPSP values of the systems obtained from the four MOOAs are relatively close, with the system obtained from MOEA-D having the highest value (1.21%).
The results from the HOMER simulation are also included in the table and are found to be in close agreement with the results obtained from the proposed model.
Table 5 compares the LCOE of the proposed PVWB/EVCS system with previous studies on similar or related systems. The LCOE is a standard metric indicating the average cost per unit of electricity produced by a system over its lifespan. It relies on several factors, such as the TNPC, LPSP, system size, configuration, operation, maintenance, and lifespan. A lower LCOE indicates a more competitive and attractive system. The proposed PVWB/EVCS system has an LCOE of 0.2521 USD/kWh, which is lower than all previous studies. This confirms the proposed system’s higher efficiency and cost effectiveness. LCOE values of previous studies range from 0.264 to 0.4417 USD/kWh, with the proposed system having the lowest LCOE value. Thus, the proposed system is a sustainable and feasible solution for power generation and storage, offering a competitive edge in terms of lower costs and a clean and reliable energy supply. This system’s potential could impact the energy sector, specifically in areas with high energy production costs and environmental concerns. The proposed PVWB/EVCS system could significantly contribute to the development of affordable and sustainable energy solutions.
The Discounted Cash Flows in the optimum system are presented in Figure 10. It can be observed that the share of the PV system had the greatest impact. The figure shows the discounted cash flows for each year, where negative values indicate costs and positive values indicate revenue. The initial costs of the system are USD 84,000 for the wind turbine, USD 264,701 for the PV system, and USD 105,000 for the battery bank. The costs decrease gradually over time due to the revenue generated by the system. In the 25th year, the revenue from the system is USD 31,800 for the wind turbine, USD 161,000 for the PV system, and USD 78,524 for the battery bank. The results demonstrate that the optimum system is economically viable and sustainable over its lifetime.
The monthly average energy production from the PV and WT systems in the optimal configuration is illustrated in Figure 11, where it can be observed that the PV system takes the lead. The data suggest that the PV system outperforms the WT system consistently throughout the year. On the other hand, Figure 12 showcases the monthly average battery state of charge (SOC) for the optimum system. The data demonstrate that the SOC fluctuates throughout the year, with the battery bank reaching its lowest level in December at 60.0% and its highest level in July at 96.6%. This information provides valuable insights for designing and implementing sustainable renewable energy systems that consider seasonal variations in energy production and consumption.
The study’s findings suggest that the proposed system performs differently during summer and winter days, as evidenced by the varying WT and PV energy outputs, SOC, and EV demand. These fluctuations indicate that the proposed system can adjust to different energy requirements in different seasons, showcasing its ability to function effectively under diverse weather conditions. Furthermore, the proposed system’s use of wind turbines and discharging of batteries when the PV production is low on the winter day highlights the system’s capacity to prioritize energy sources intelligently to meet the load demand. These results demonstrate the proposed system’s effectiveness in meeting energy demands sustainably and efficiently. Figure 13 shows the performance evaluation of the proposed system on a summer and winter day, respectively.

6.3. Sensitivity Analysis

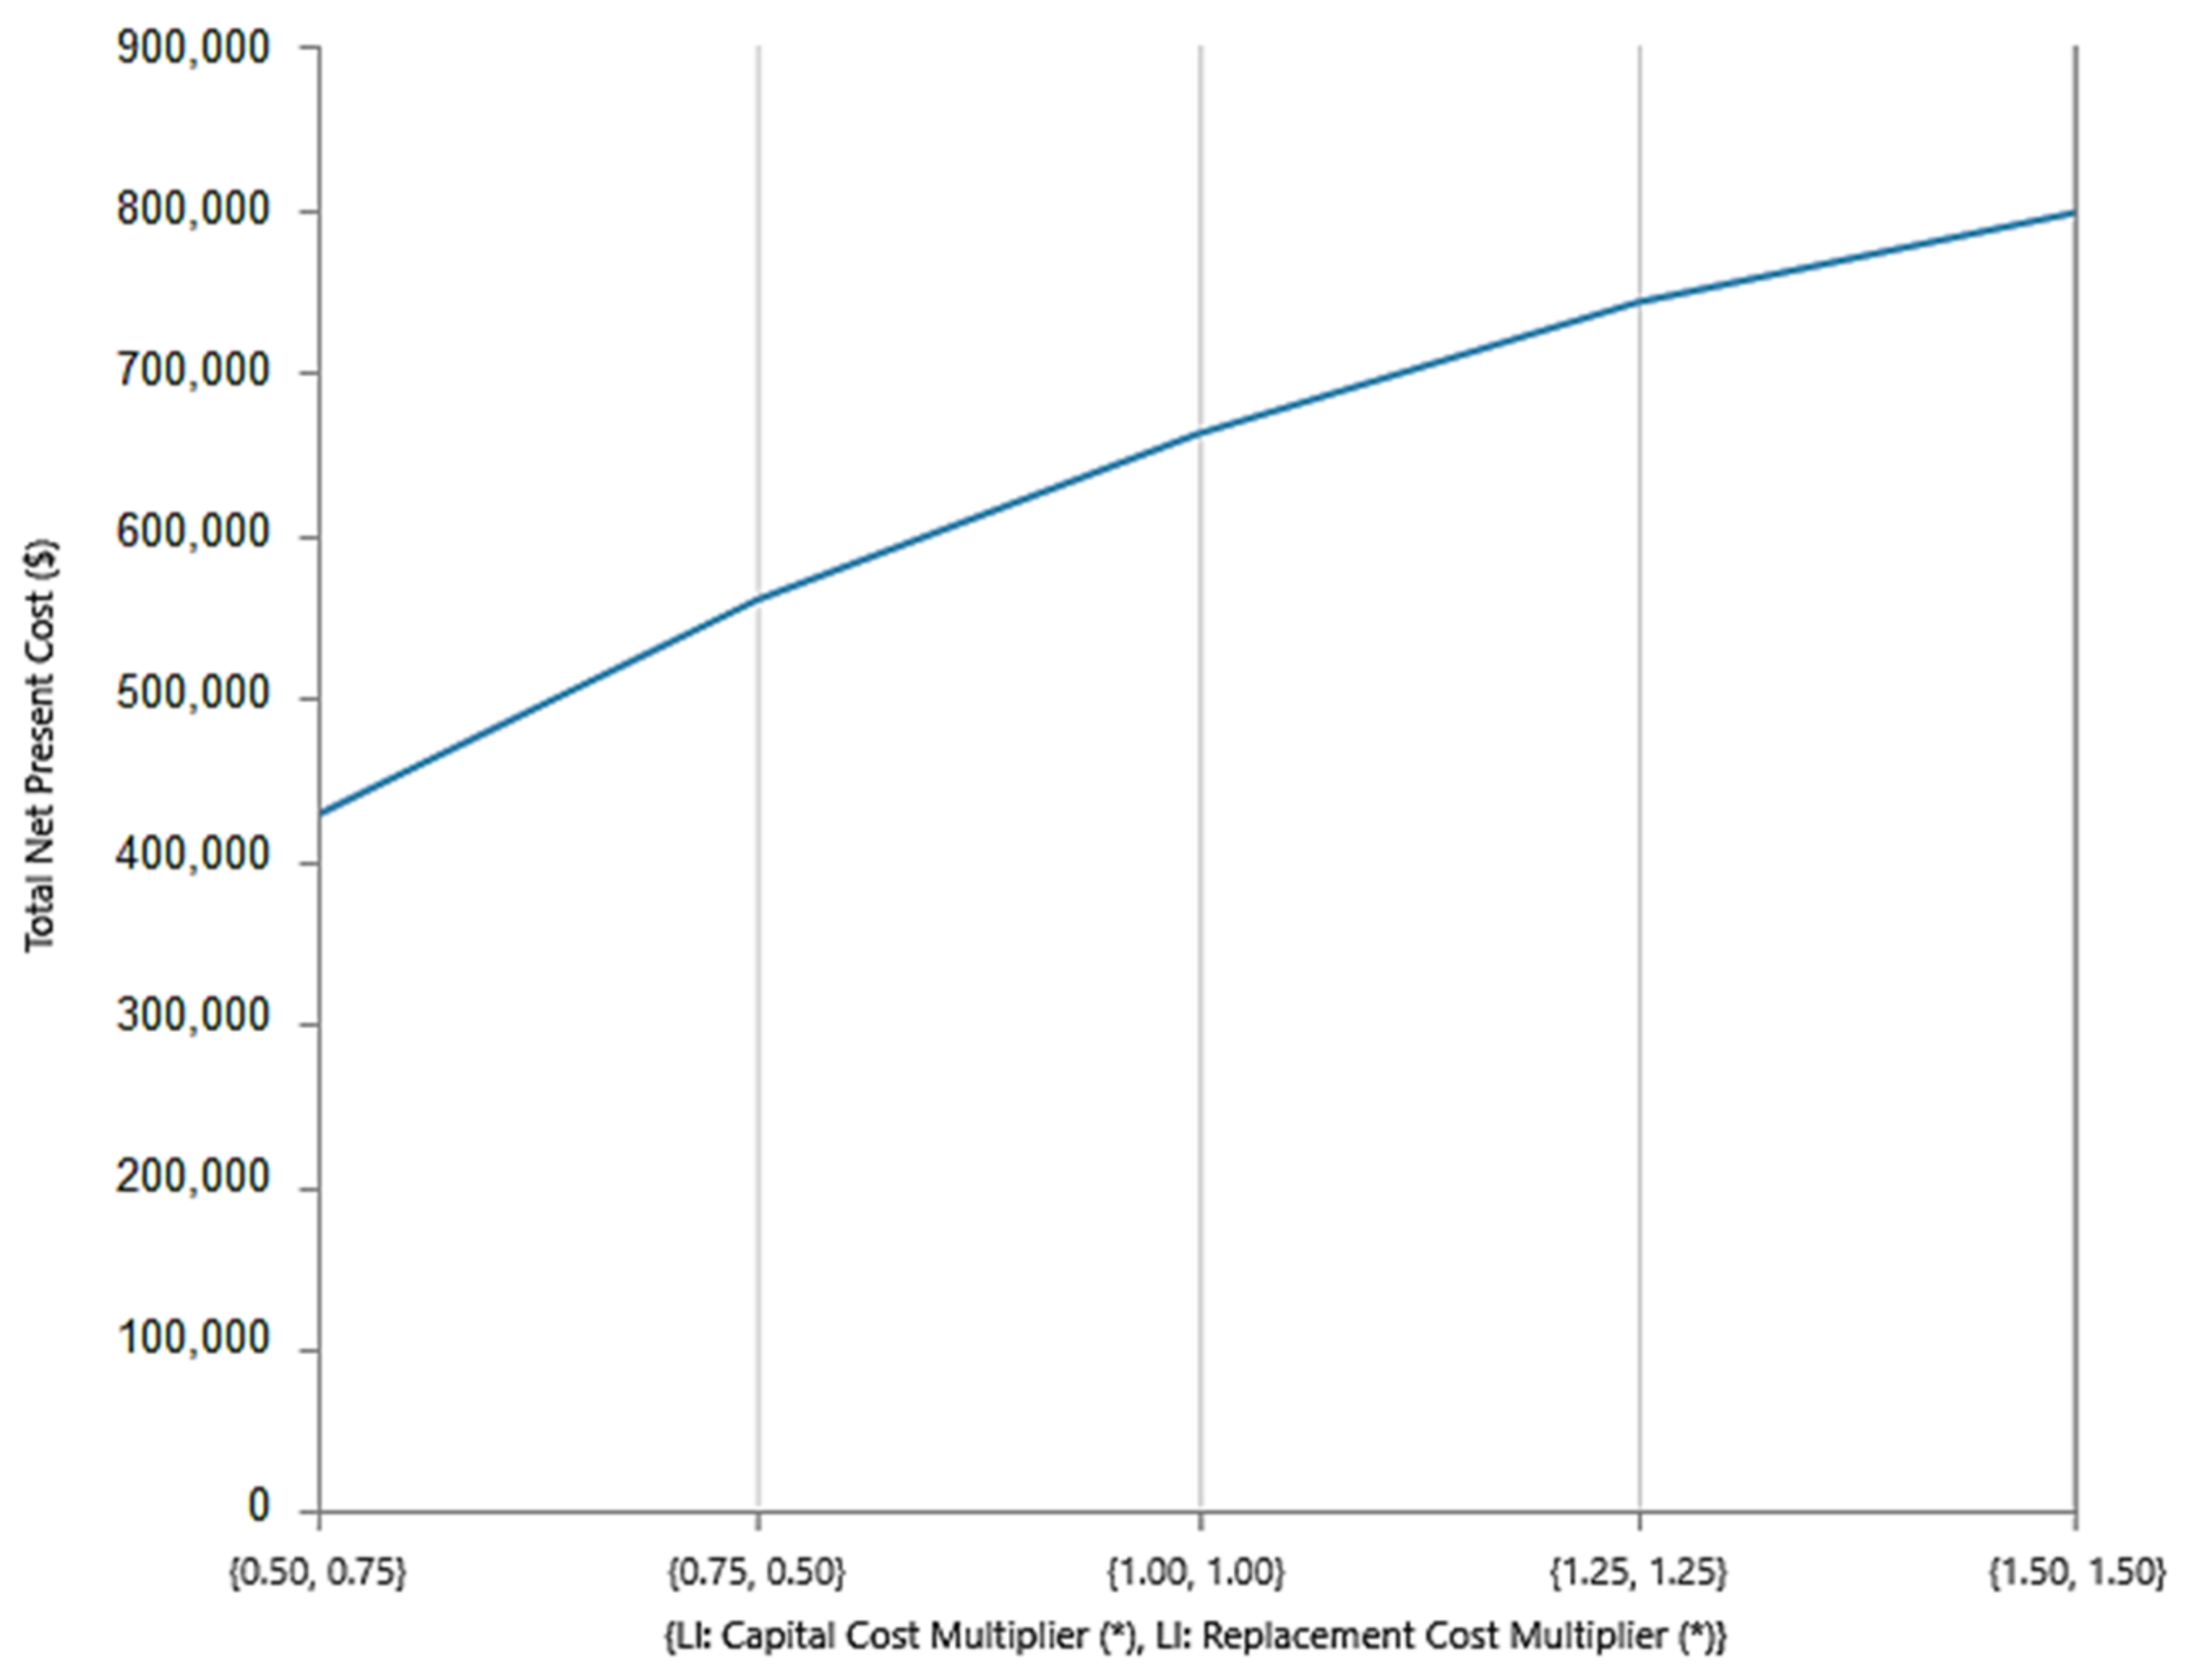
6.3.1. Sensitivity Analysis of Lithium-Ion Cost and Its Implications

As the Lithium-Ion cost increases, it was shown by the sensitivity analysis that the number of Lithium-Ion batteries decreases while the PV (kW) increases. This is expected since fewer batteries can be purchased for the same amount of money when the cost of Lithium-Ion batteries increases, which results in a smaller energy storage capacity. More PVs are needed to meet the same energy demand to compensate for the reduced energy storage capacity.
The TNPC increases as the Lithium-Ion cost increases, as seen in Figure 14. This indicates that the system becomes more expensive when the cost of Lithium-Ion batteries increases, which can have implications for the economic viability of the system.

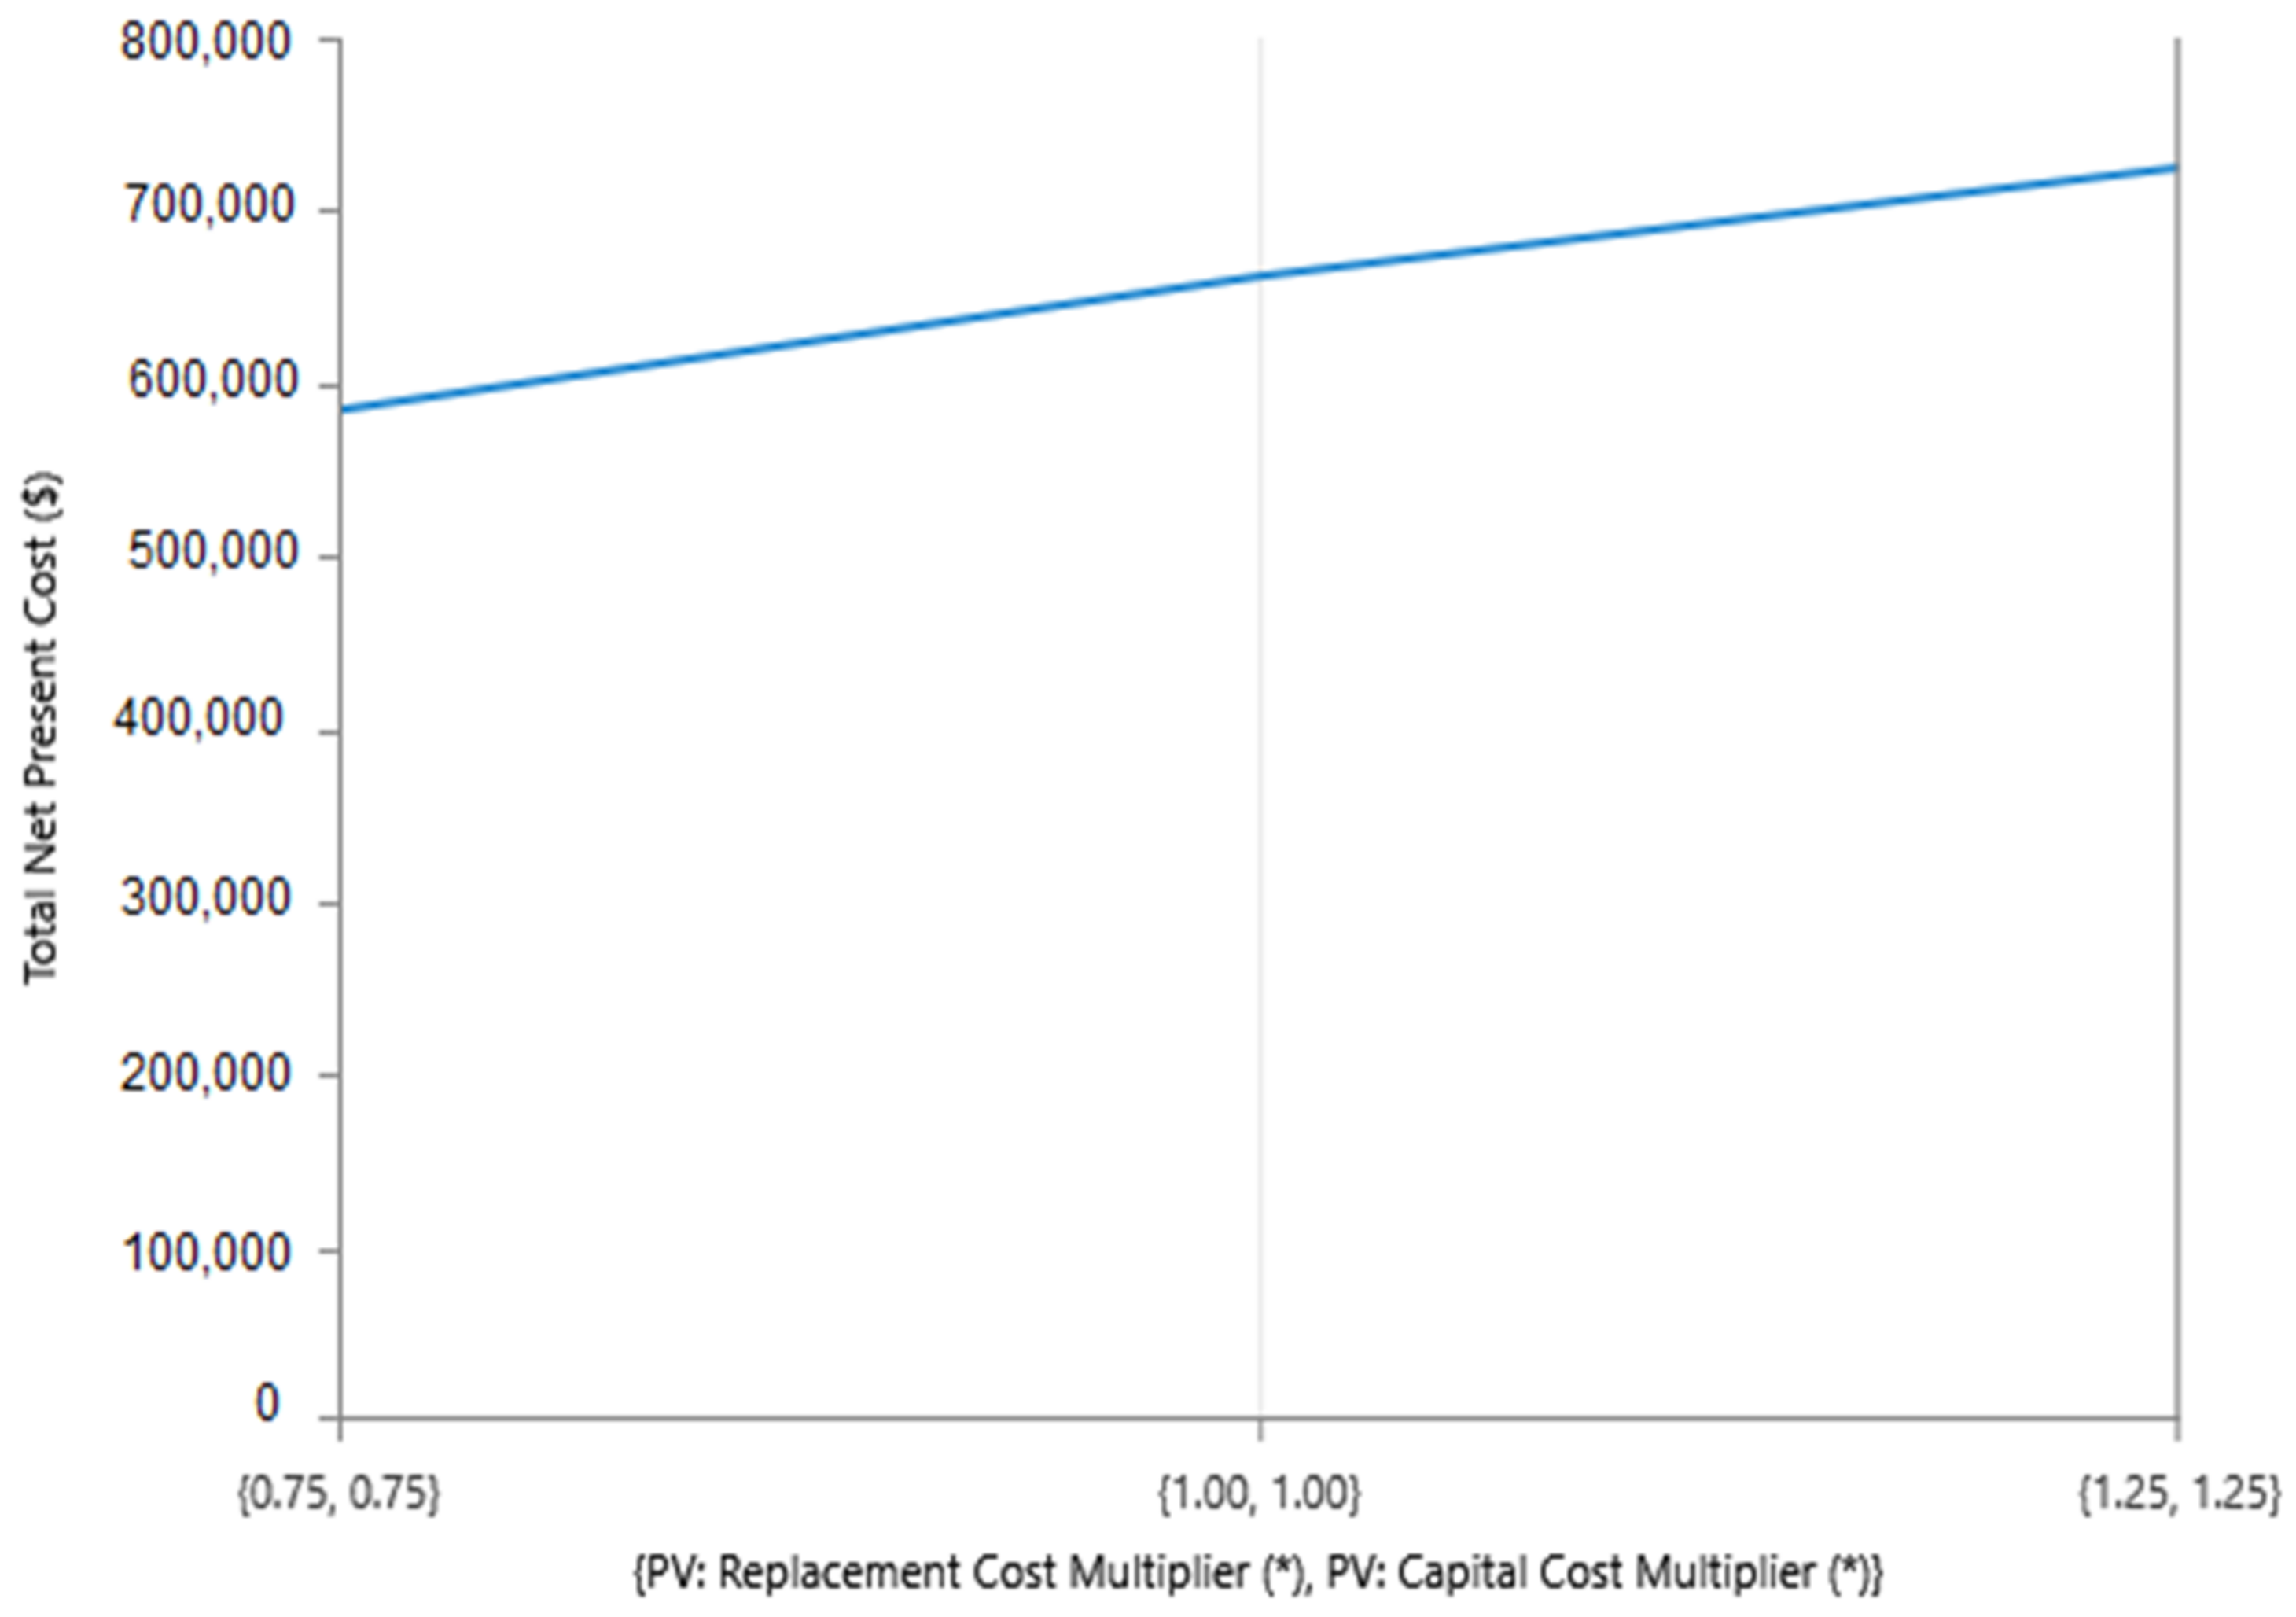
6.3.2. Sensitivity Analysis of PV System Cost and Its Effects

As the PV system capital cost increases, it was shown by the sensitivity analysis that the number of PV panels decreases, while the number of Lithium-Ion batteries increases.
The impact of changing the PV system capital cost on the system TNPC can be observed in Figure 15. The TNPC increases as the PV system capital cost increases. This is because the total system cost is significantly contributed by the cost of PV panels.

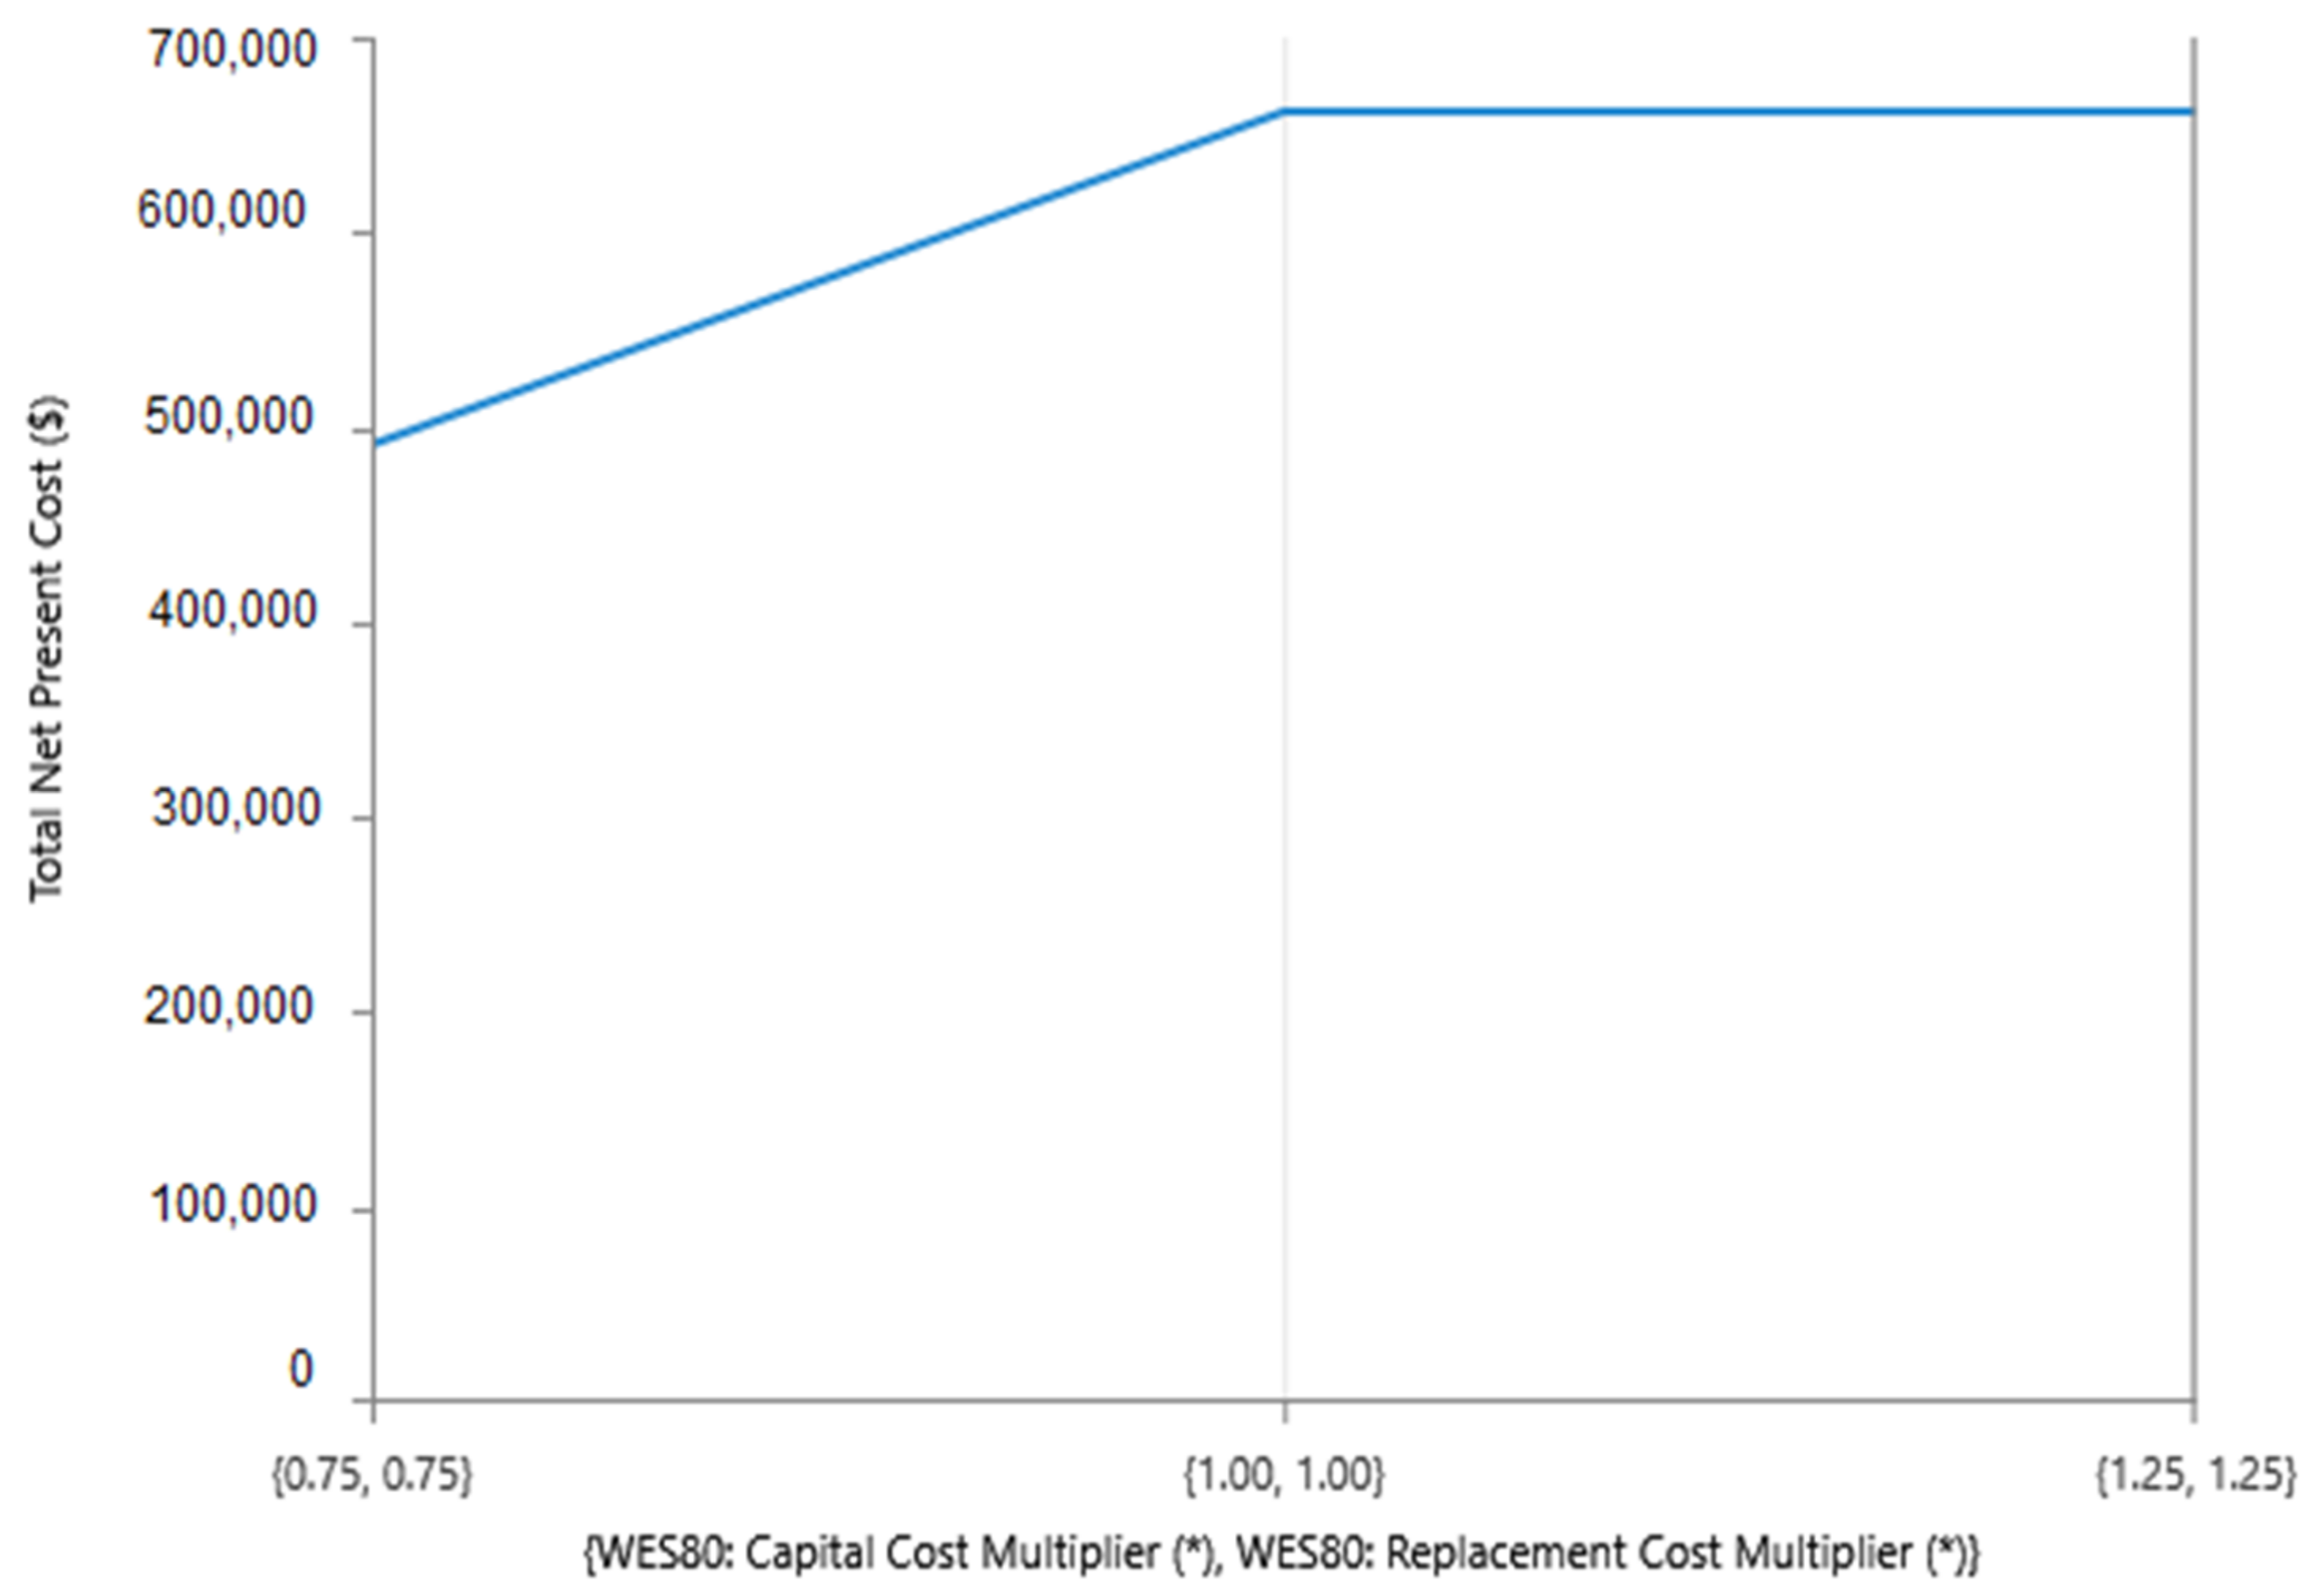
6.3.3. Sensitivity Analysis of Wind Turbine Cost and Its Effects

It was shown through sensitivity analysis that the PV system capacity and the number of lithium-ion batteries were not affected and remained constant as the wind turbine capital cost increased from 100% to 125%. However, both the capacity of the photovoltaic system and the number of lithium-ion batteries decreased when the capitalization of wind turbines decreased from 100% to 75%. The same impact on TNPC of the system can be observed in Figure 16.

7. Conclusions

The study conducted a comprehensive optimization of hybrid electric vehicle (EV) charging systems by considering both technical and economic aspects to achieve a sustainable solution. The study evaluated four different algorithms—MOPSO, NSGA-II, NSGA-III, and MOEA/D—for multi-objective optimization of the hybrid charging system based on two objectives: Total Net Present Cost (TNPC) and loss of power supply probability (LPSP).
The main conclusions are remarked as follows:
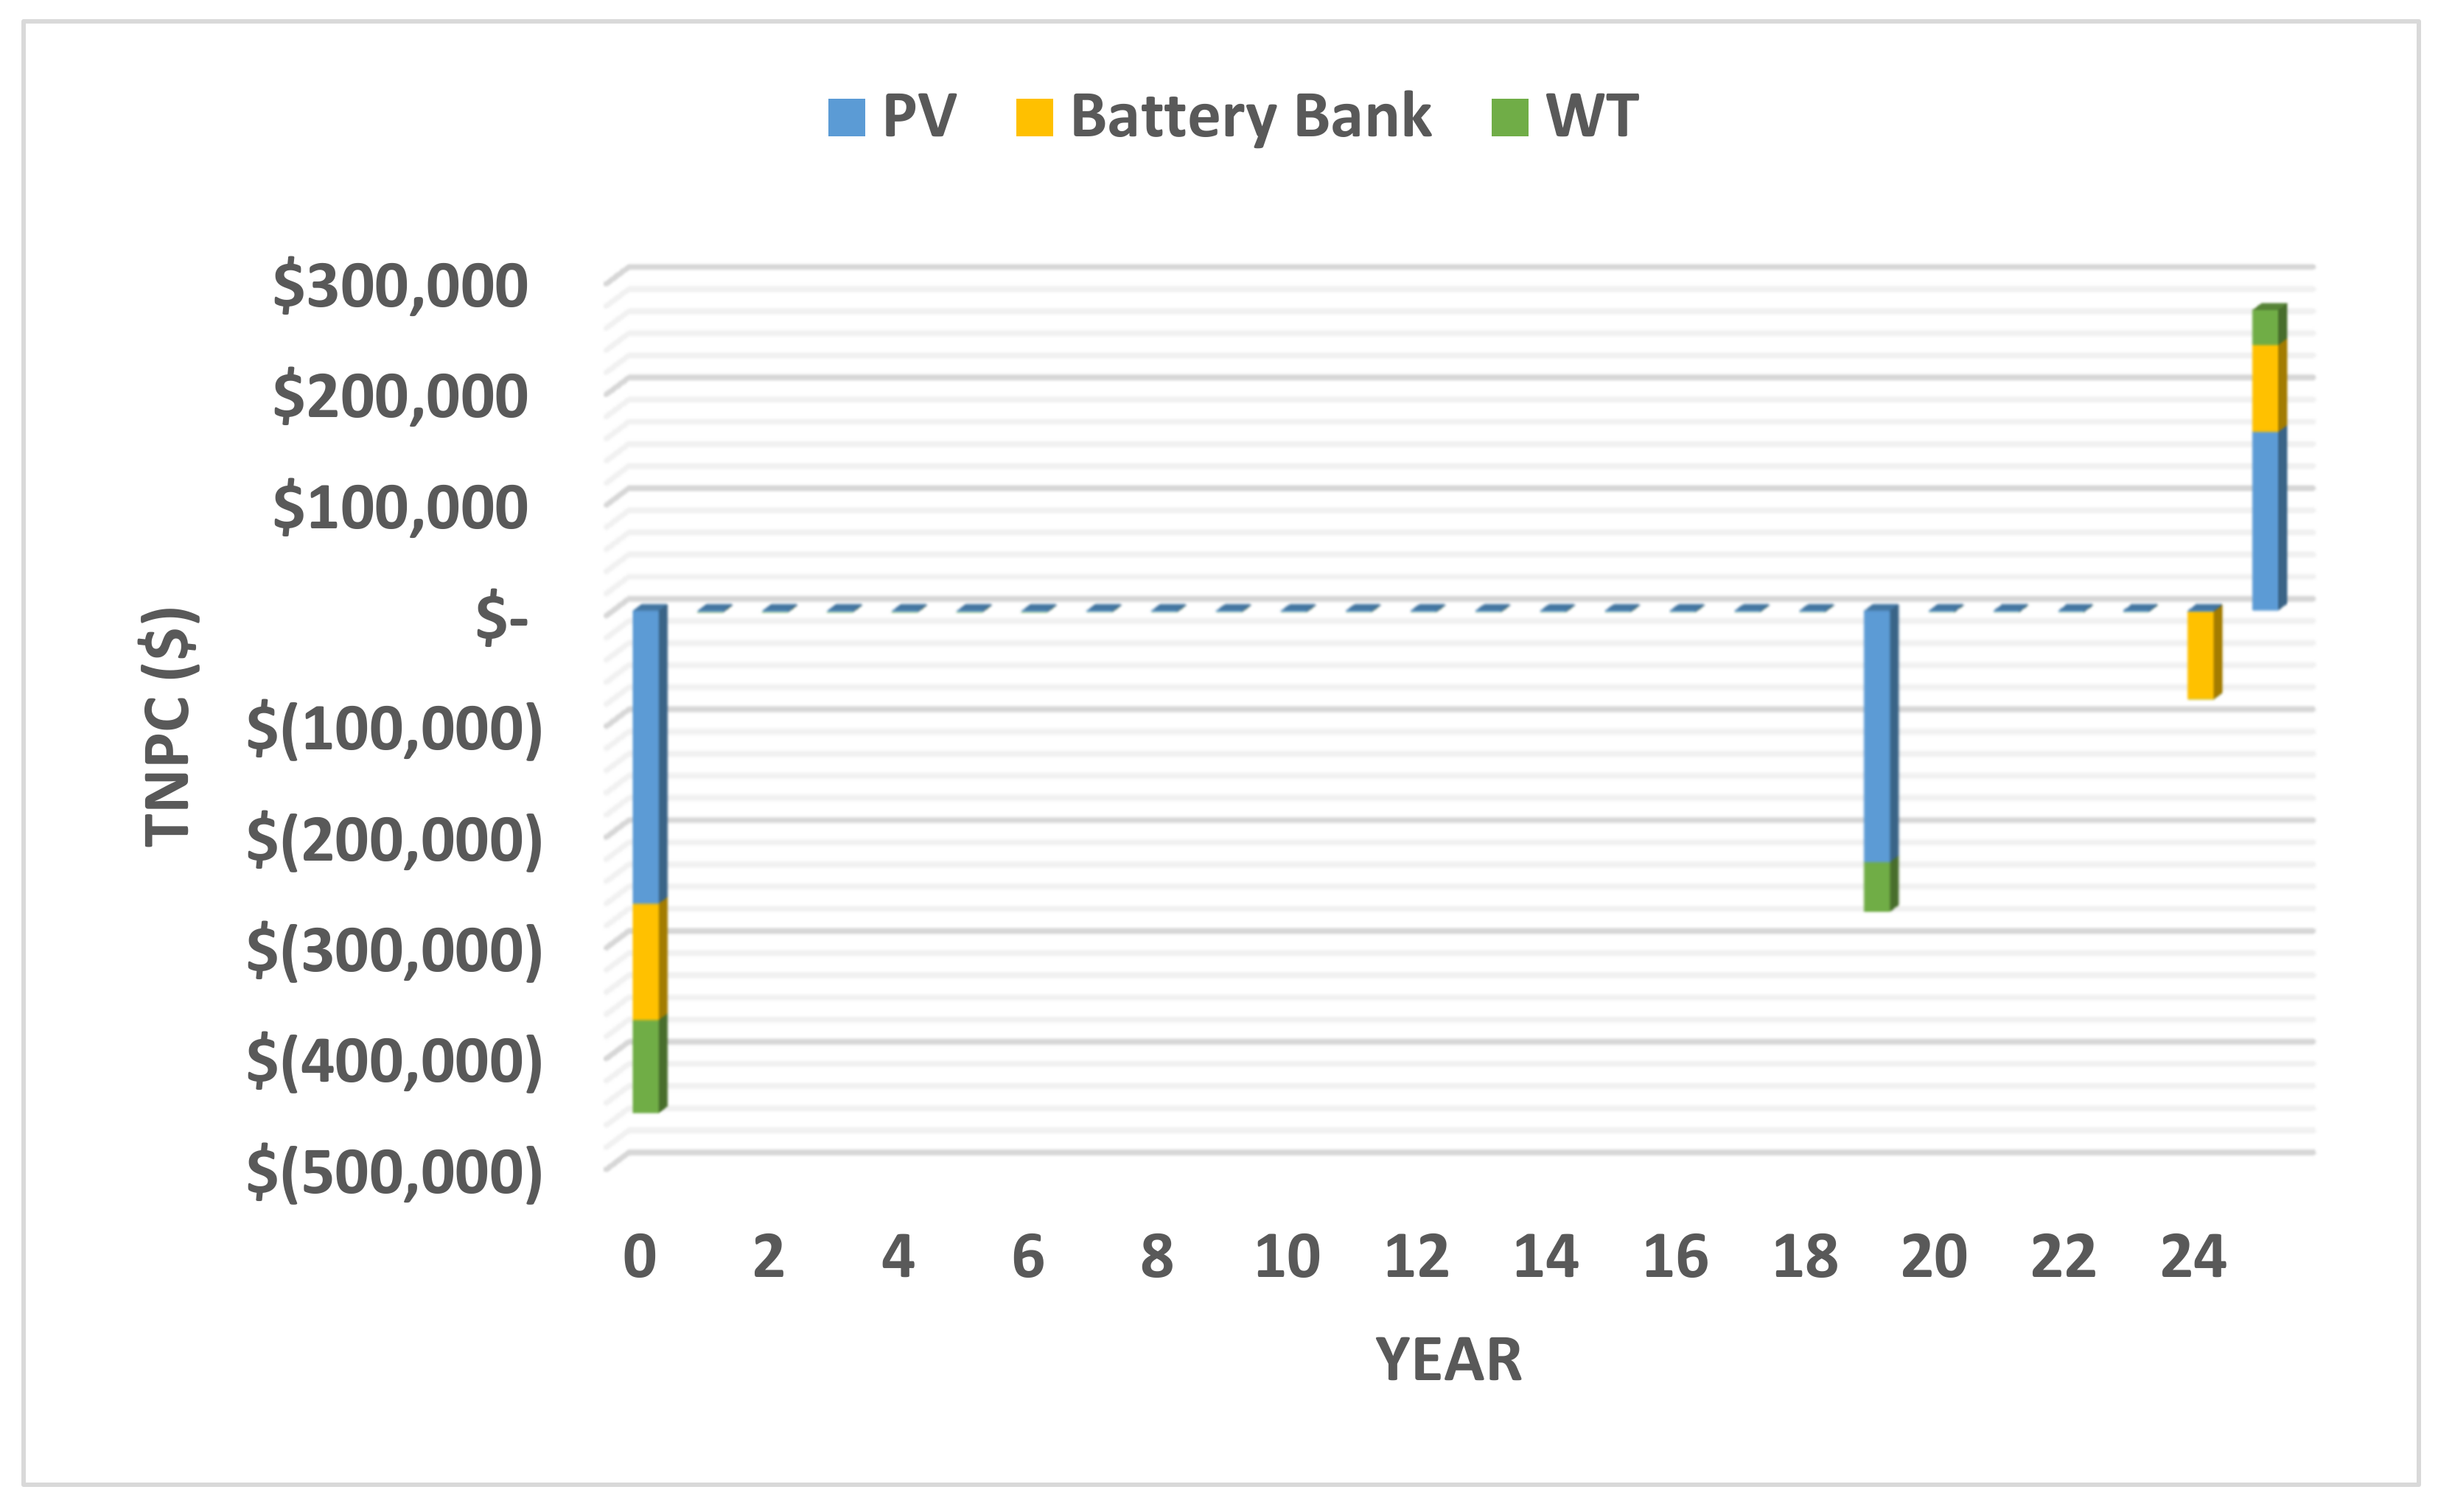
The optimum system consisted of a 223 kW PV system, an 80-kW wind turbine, and seven Lithium-Ion battery banks, with an TNPC of USD 564,846, an LCOE of 0.2521 USD/kWh, and an LPSP of 1.21%.
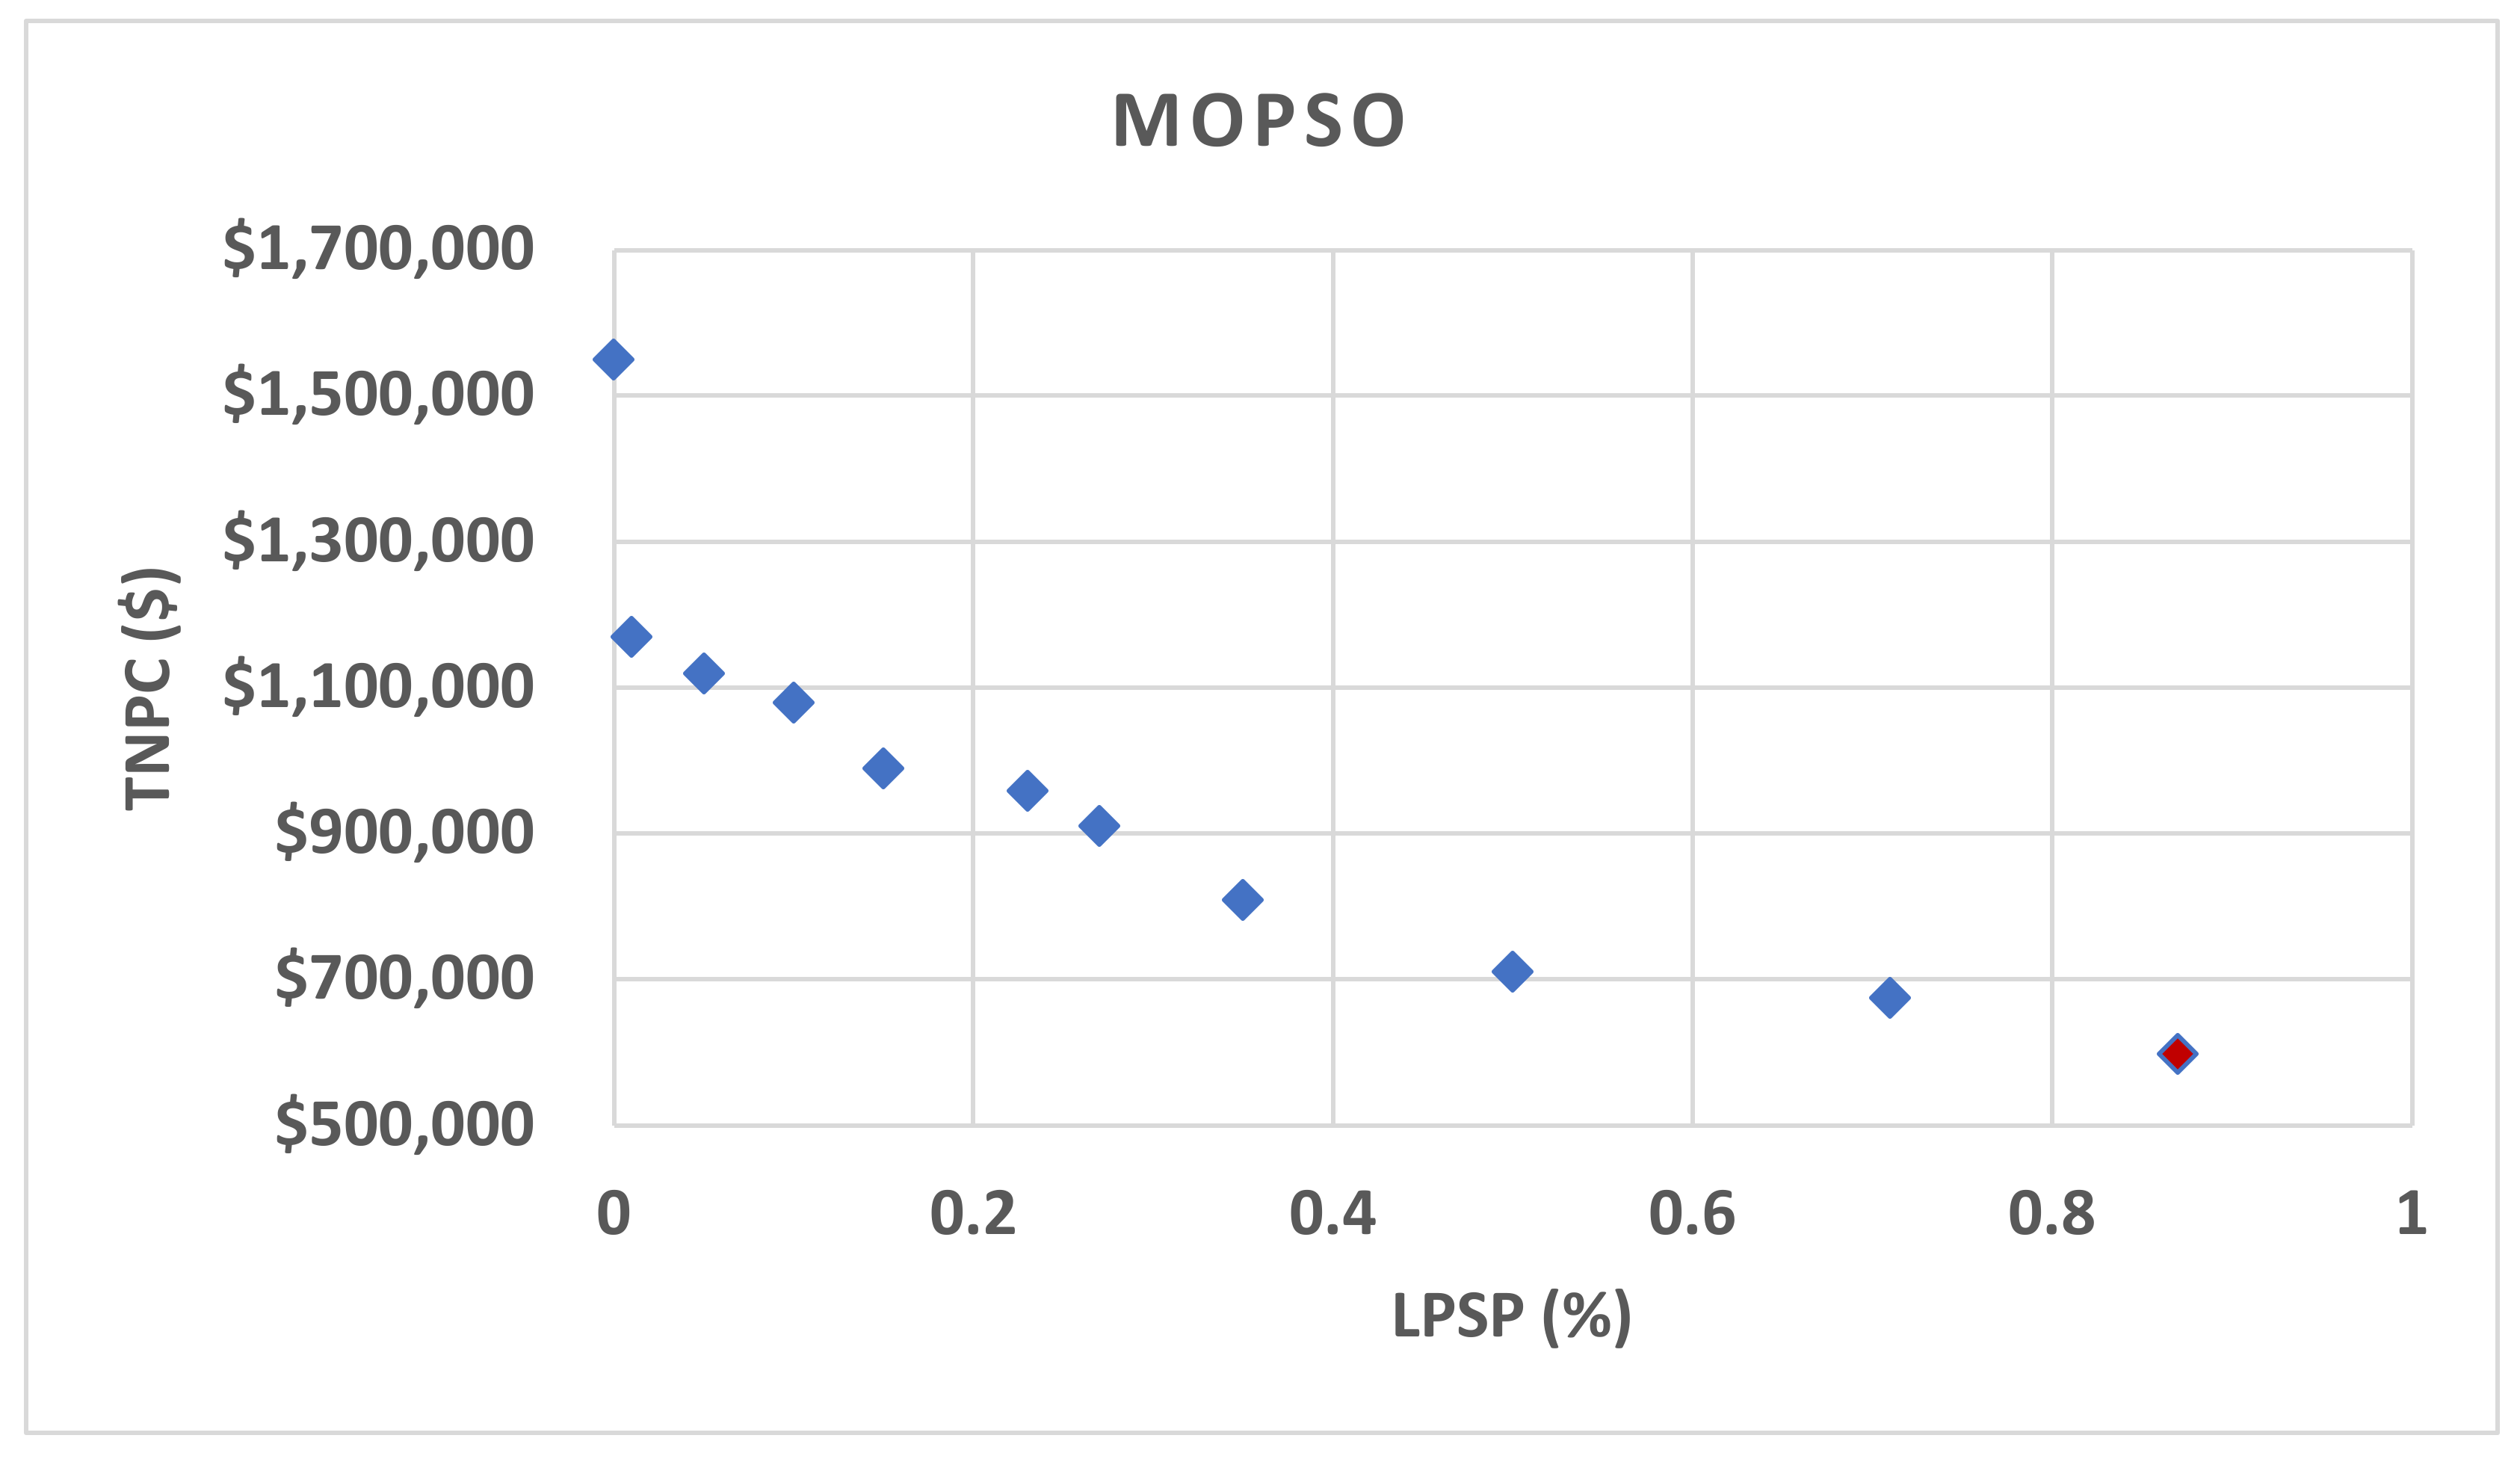
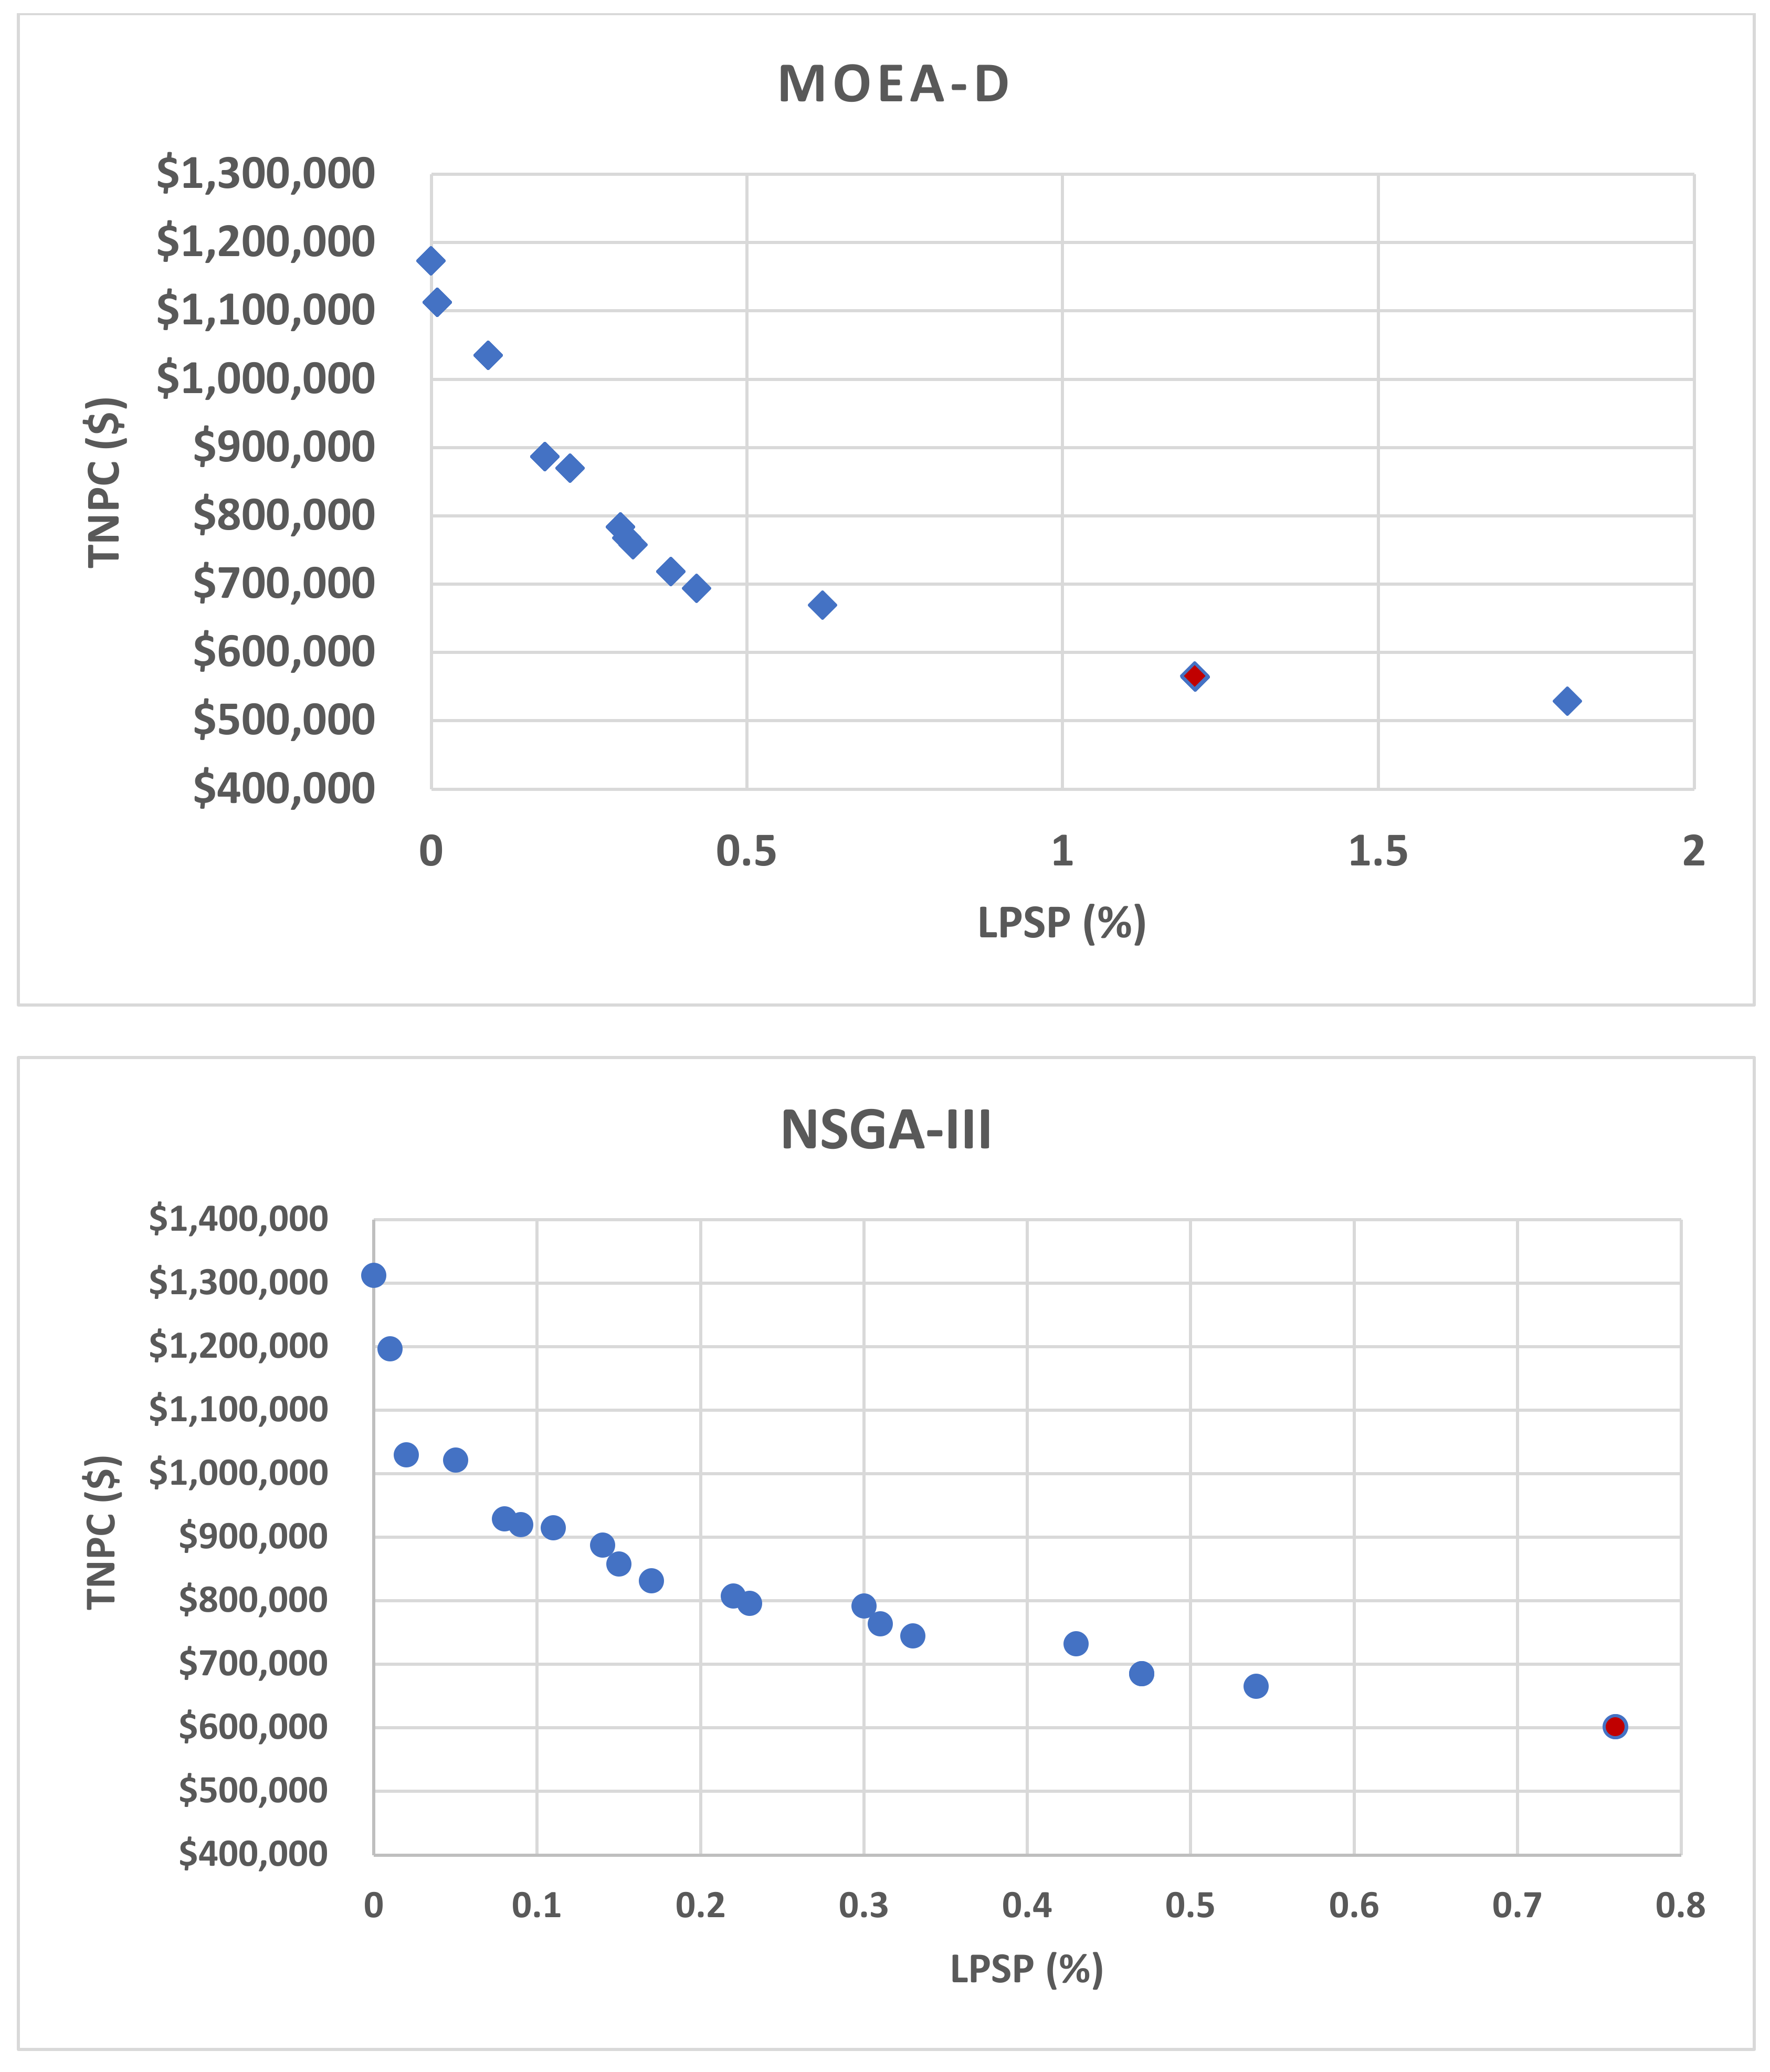
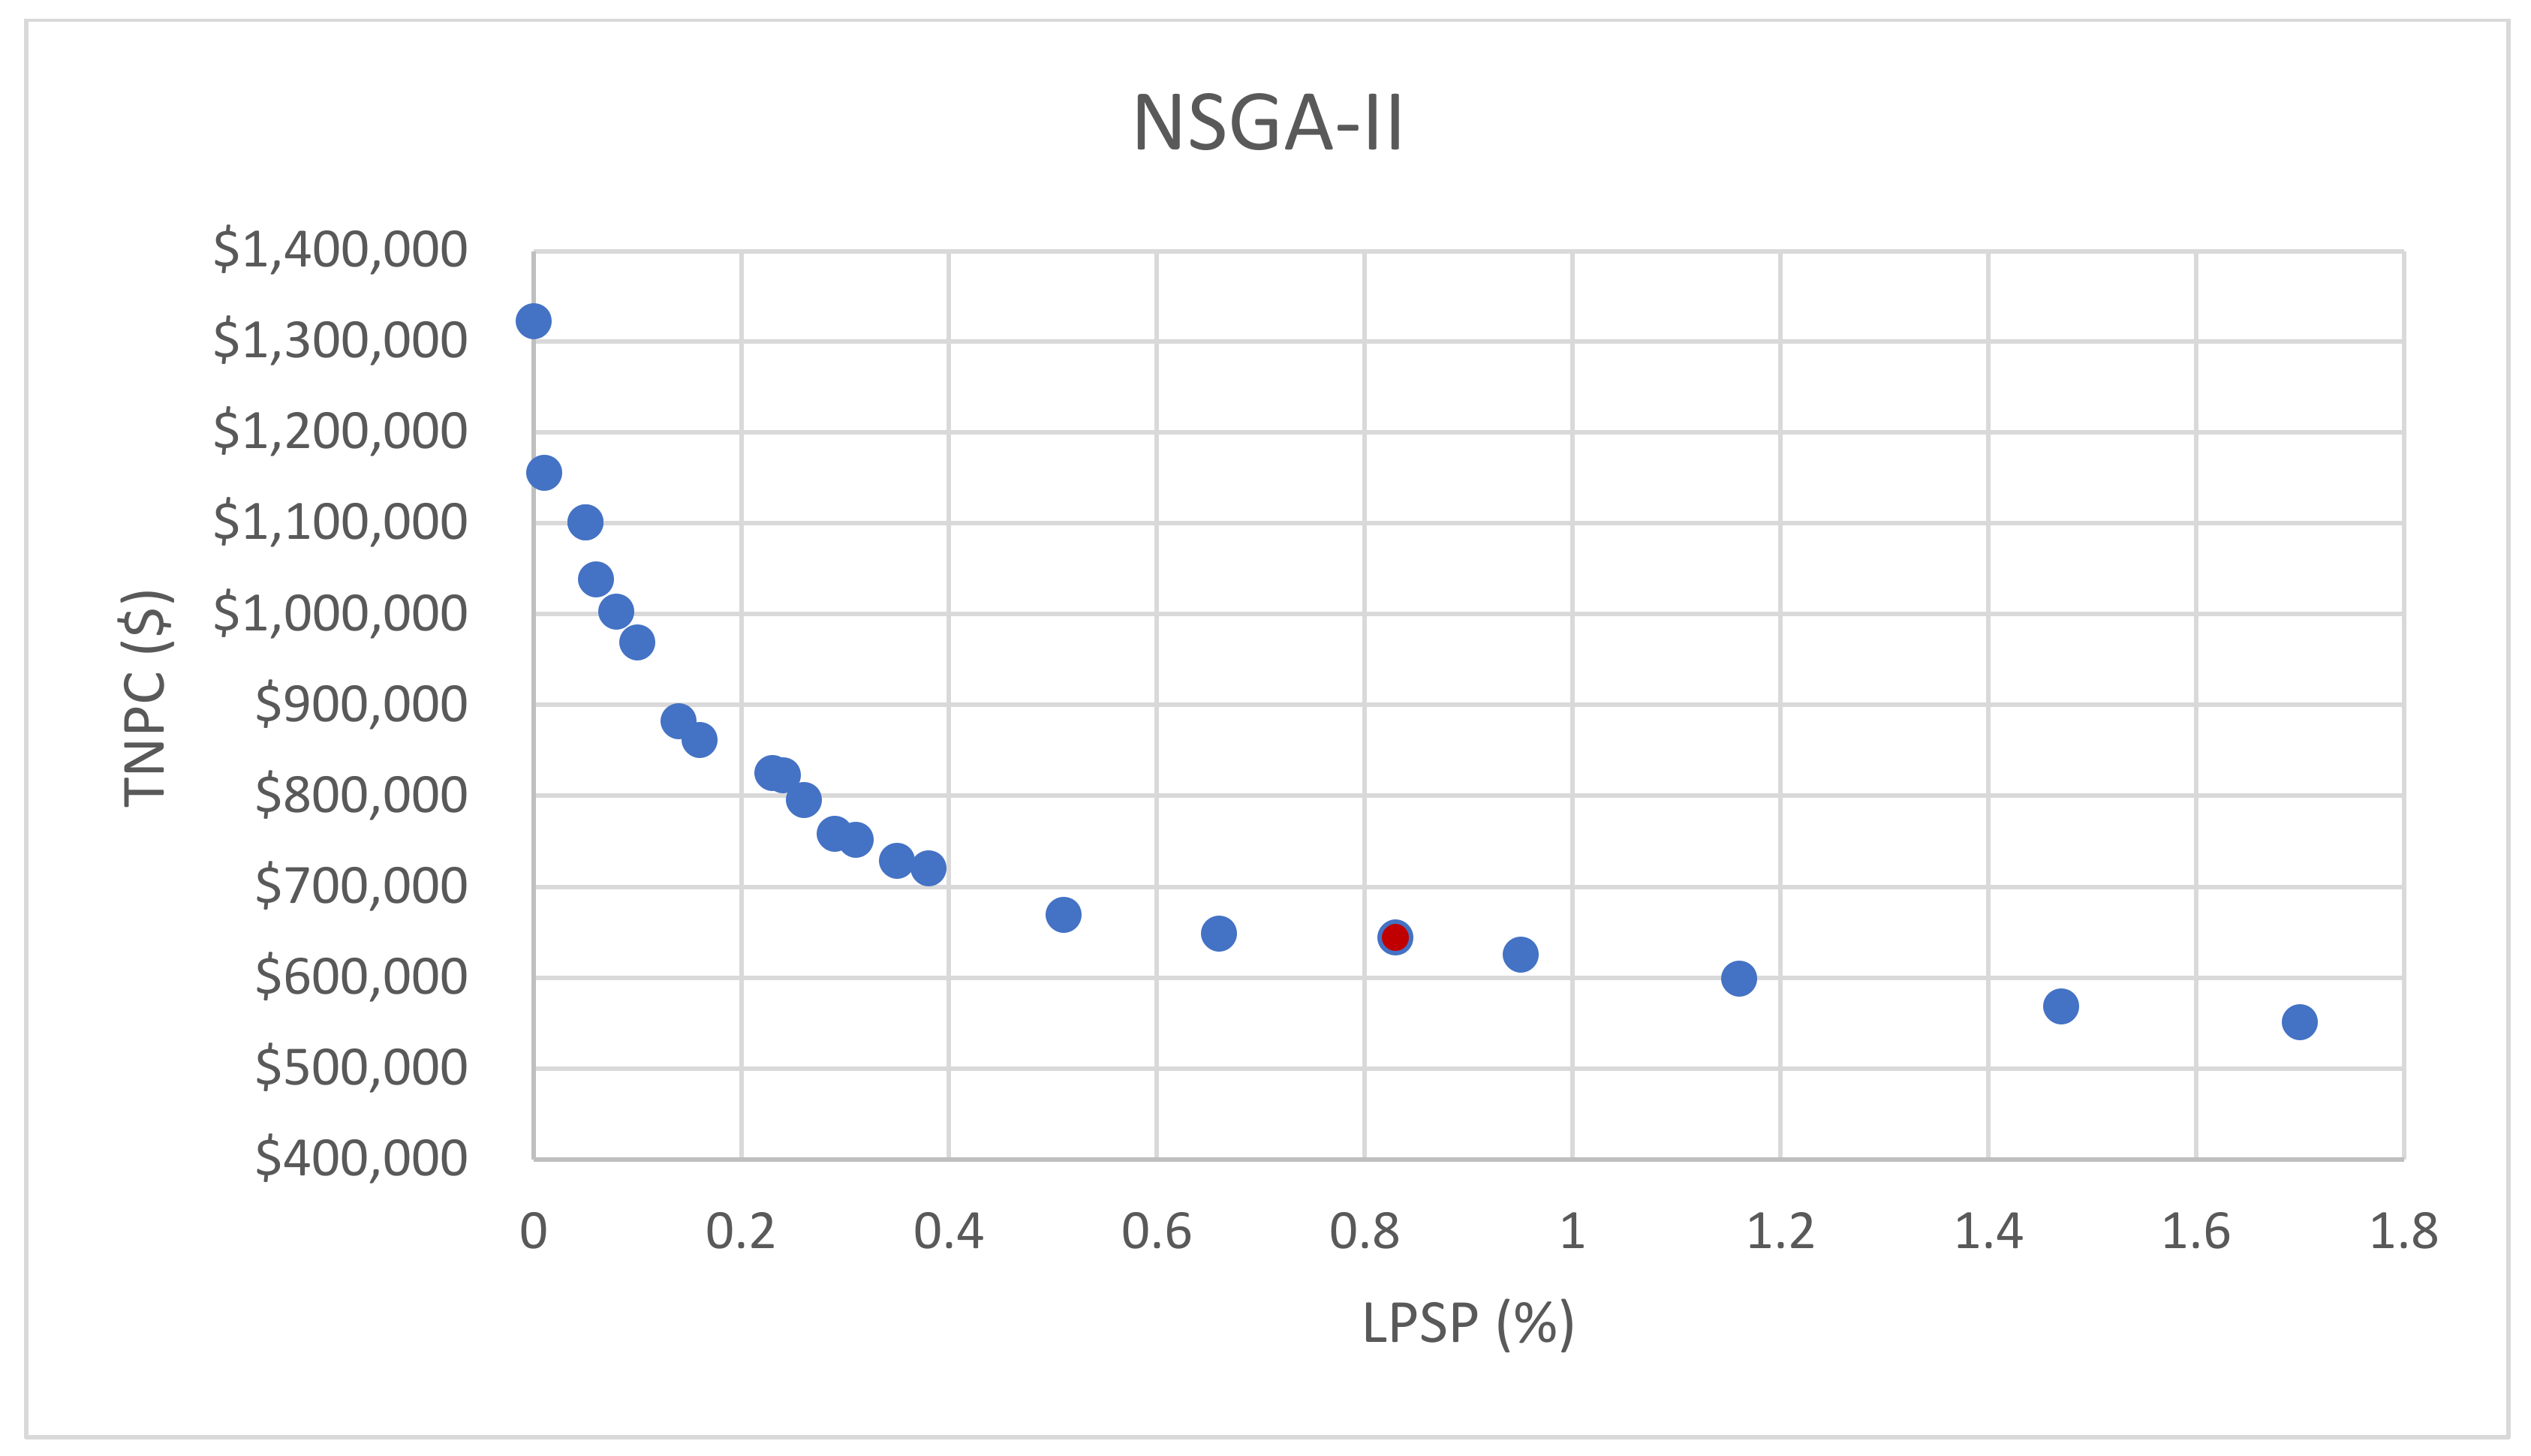
The Pareto front plots of TNPC vs. LPSP for the four suggested optimization algorithms showed a clear trade-off between the two objectives.
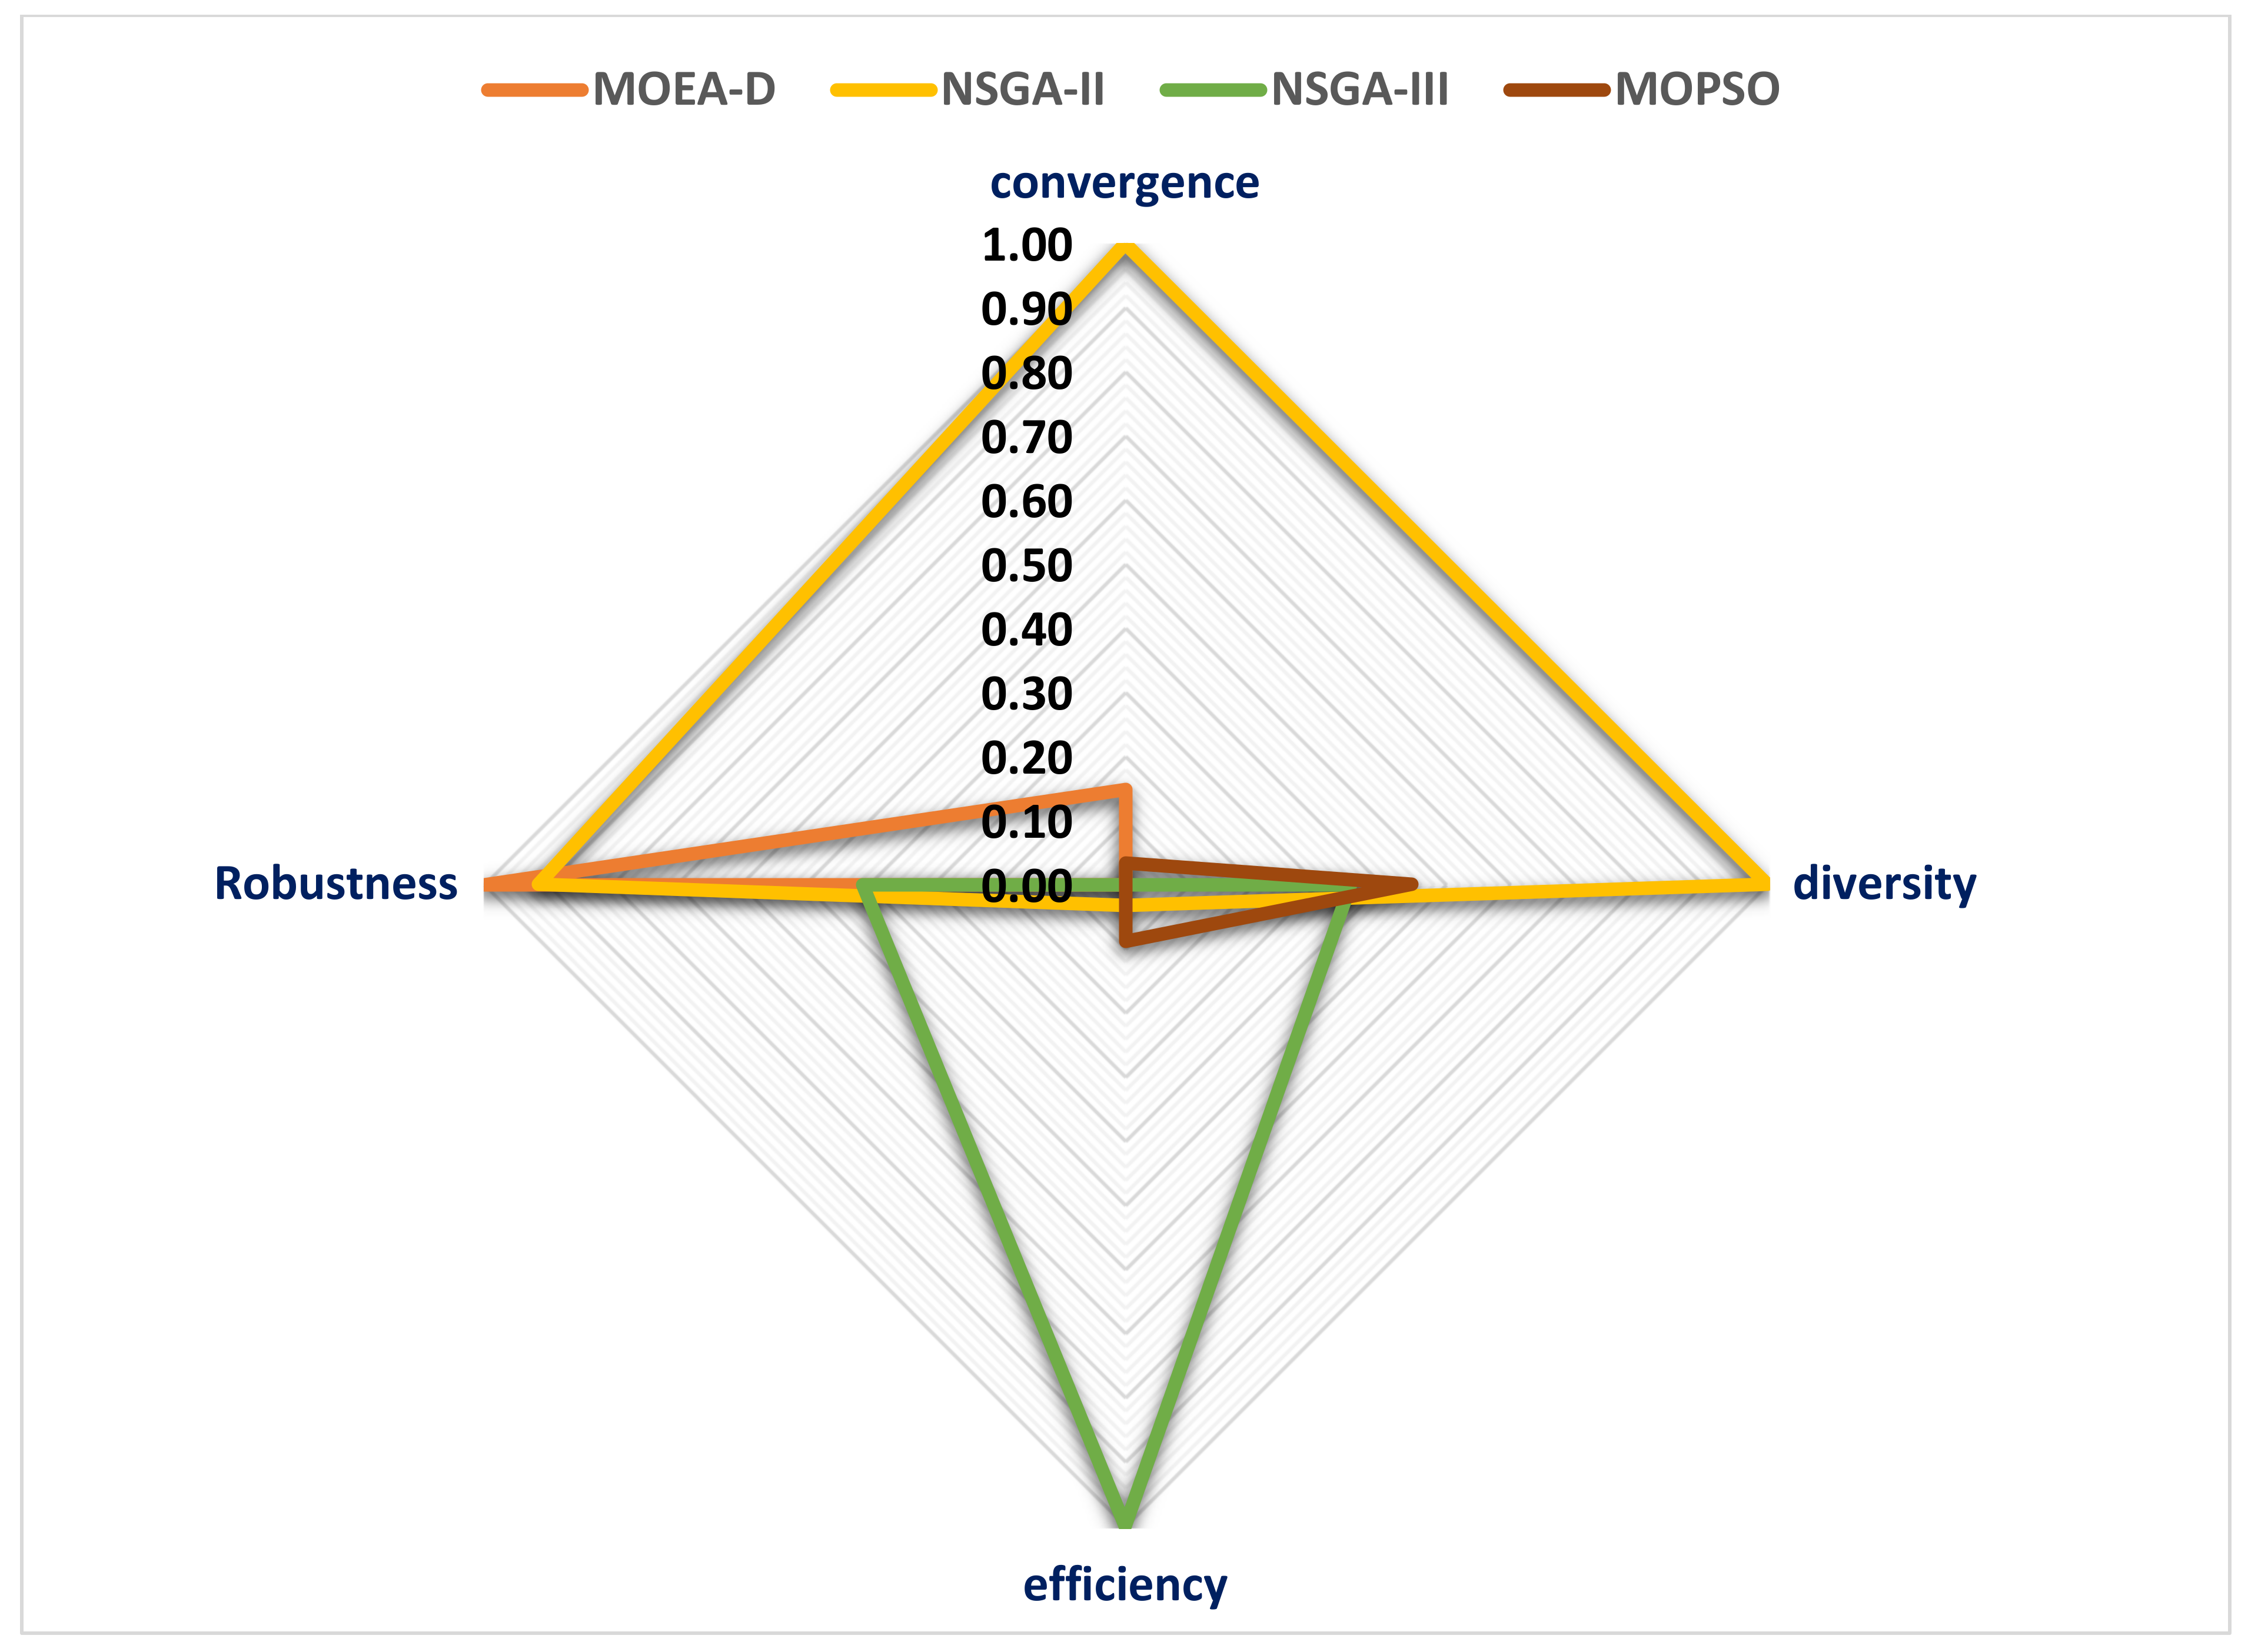
NSGA-II achieved the highest overall performance among the four algorithms, with the best scores for convergence and diversity.
NSGA-III had the highest efficiency score, while MOPSO attained the highest diversity score.
MOEA/D was observed to have the highest robustness score, indicating its suitability for diverse problem conditions.
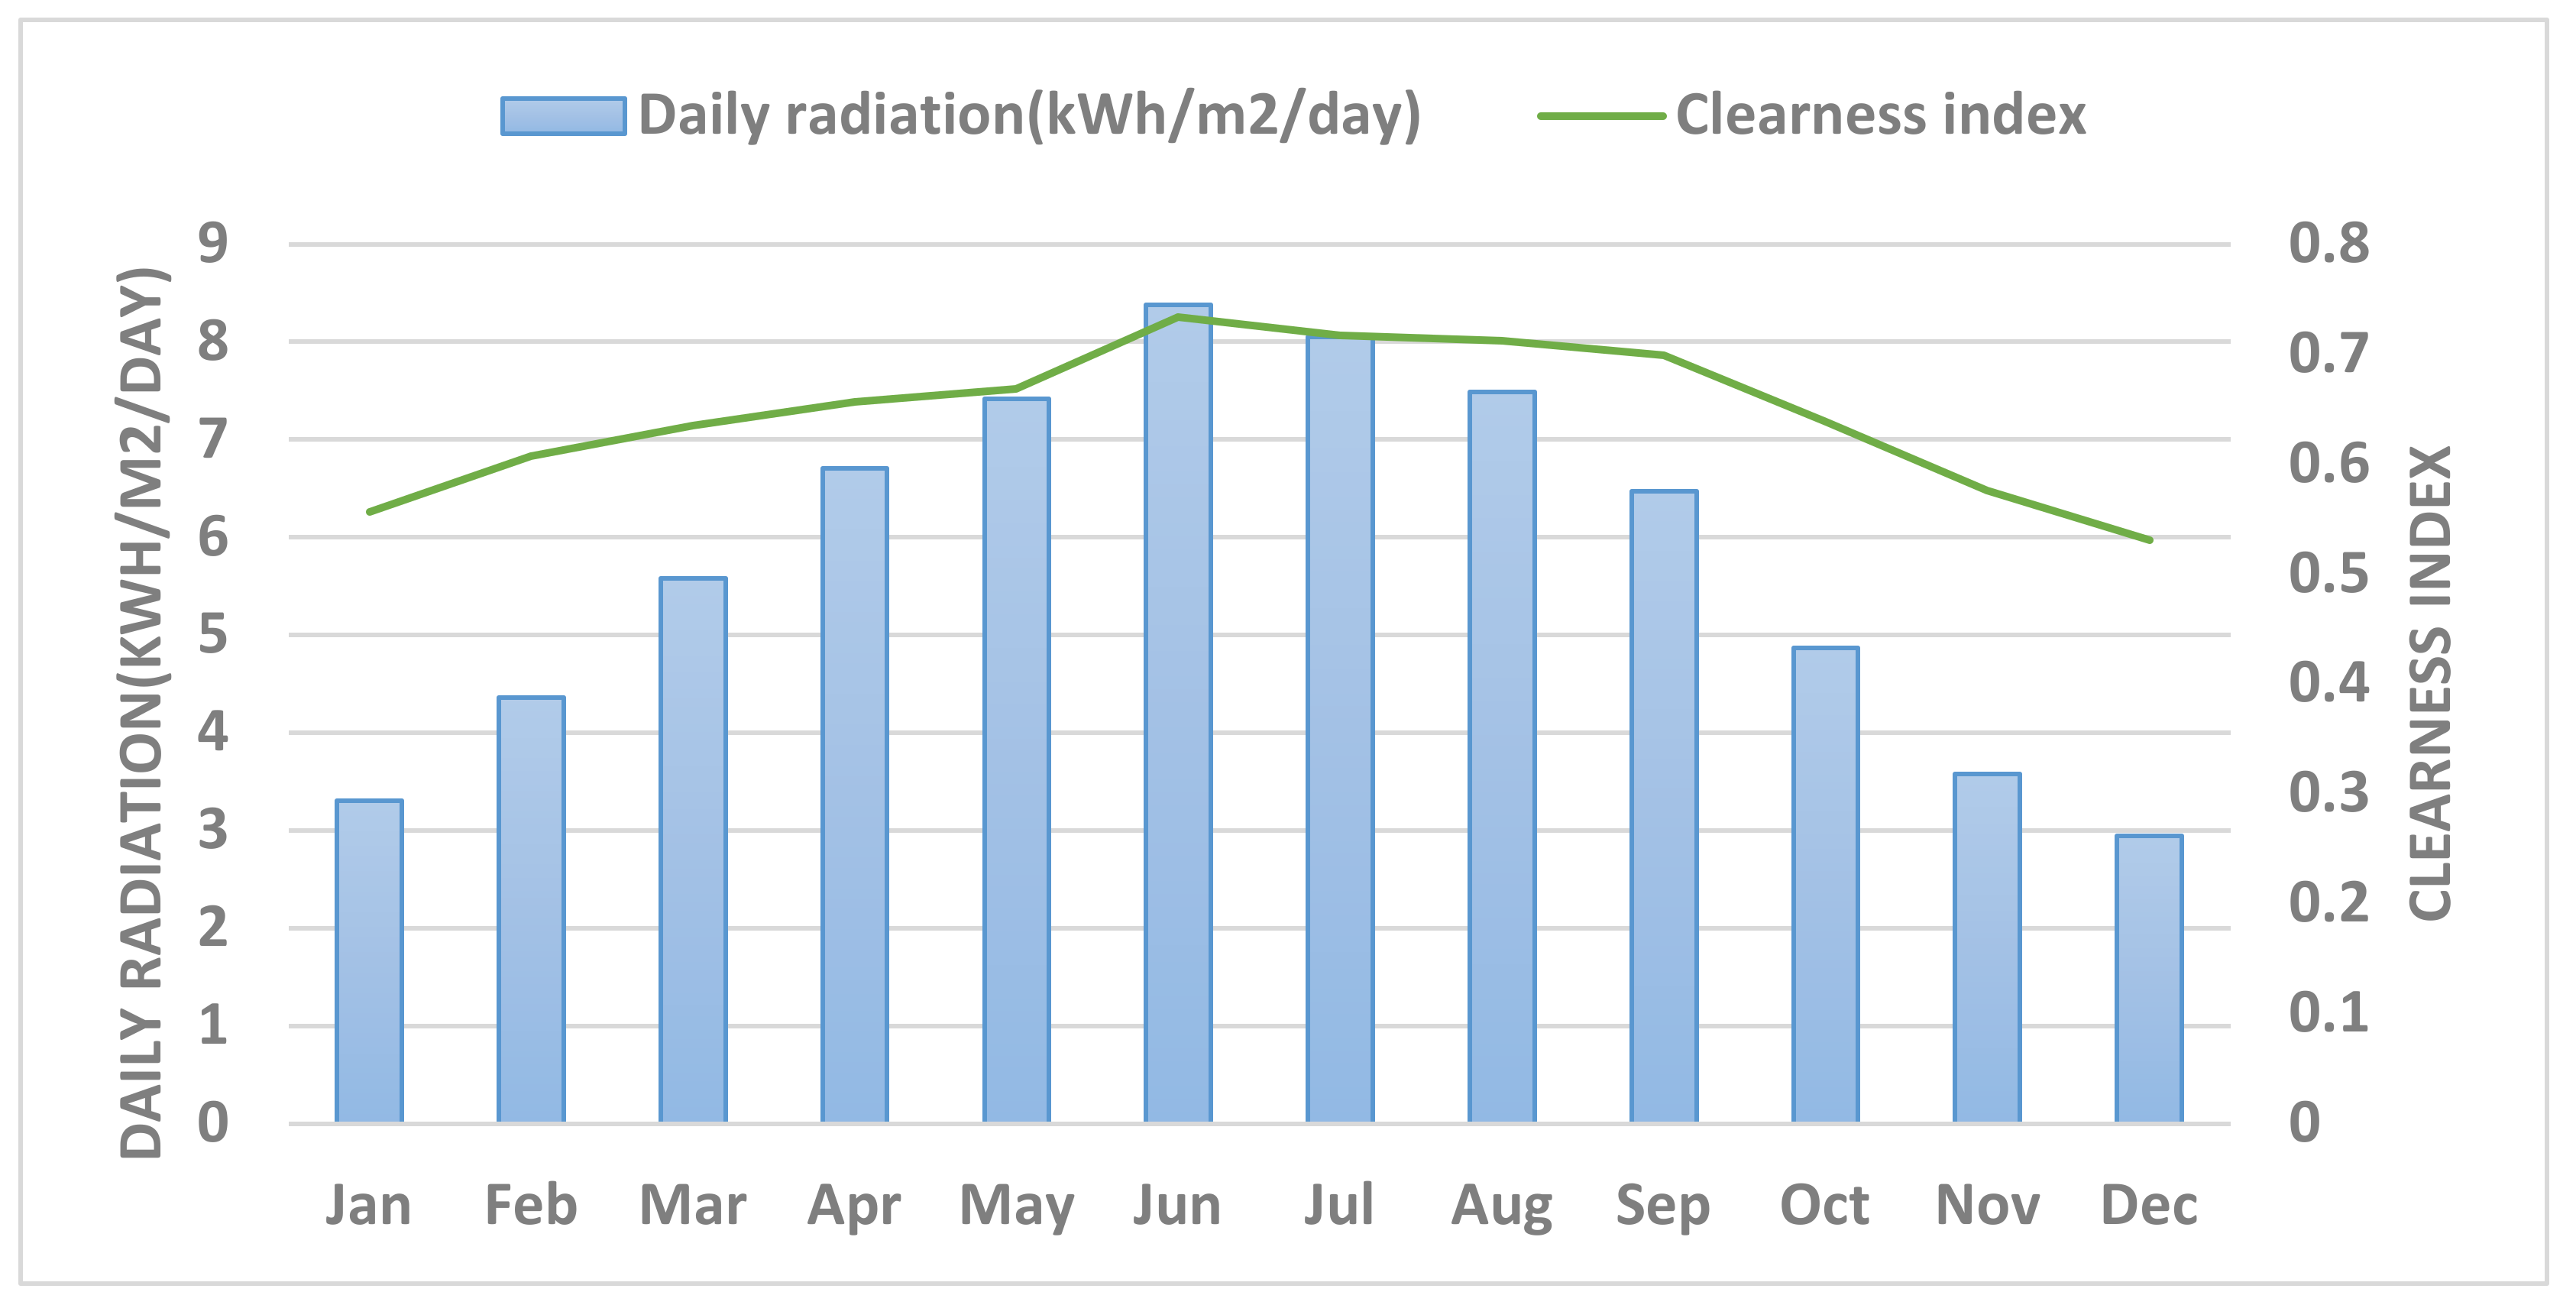
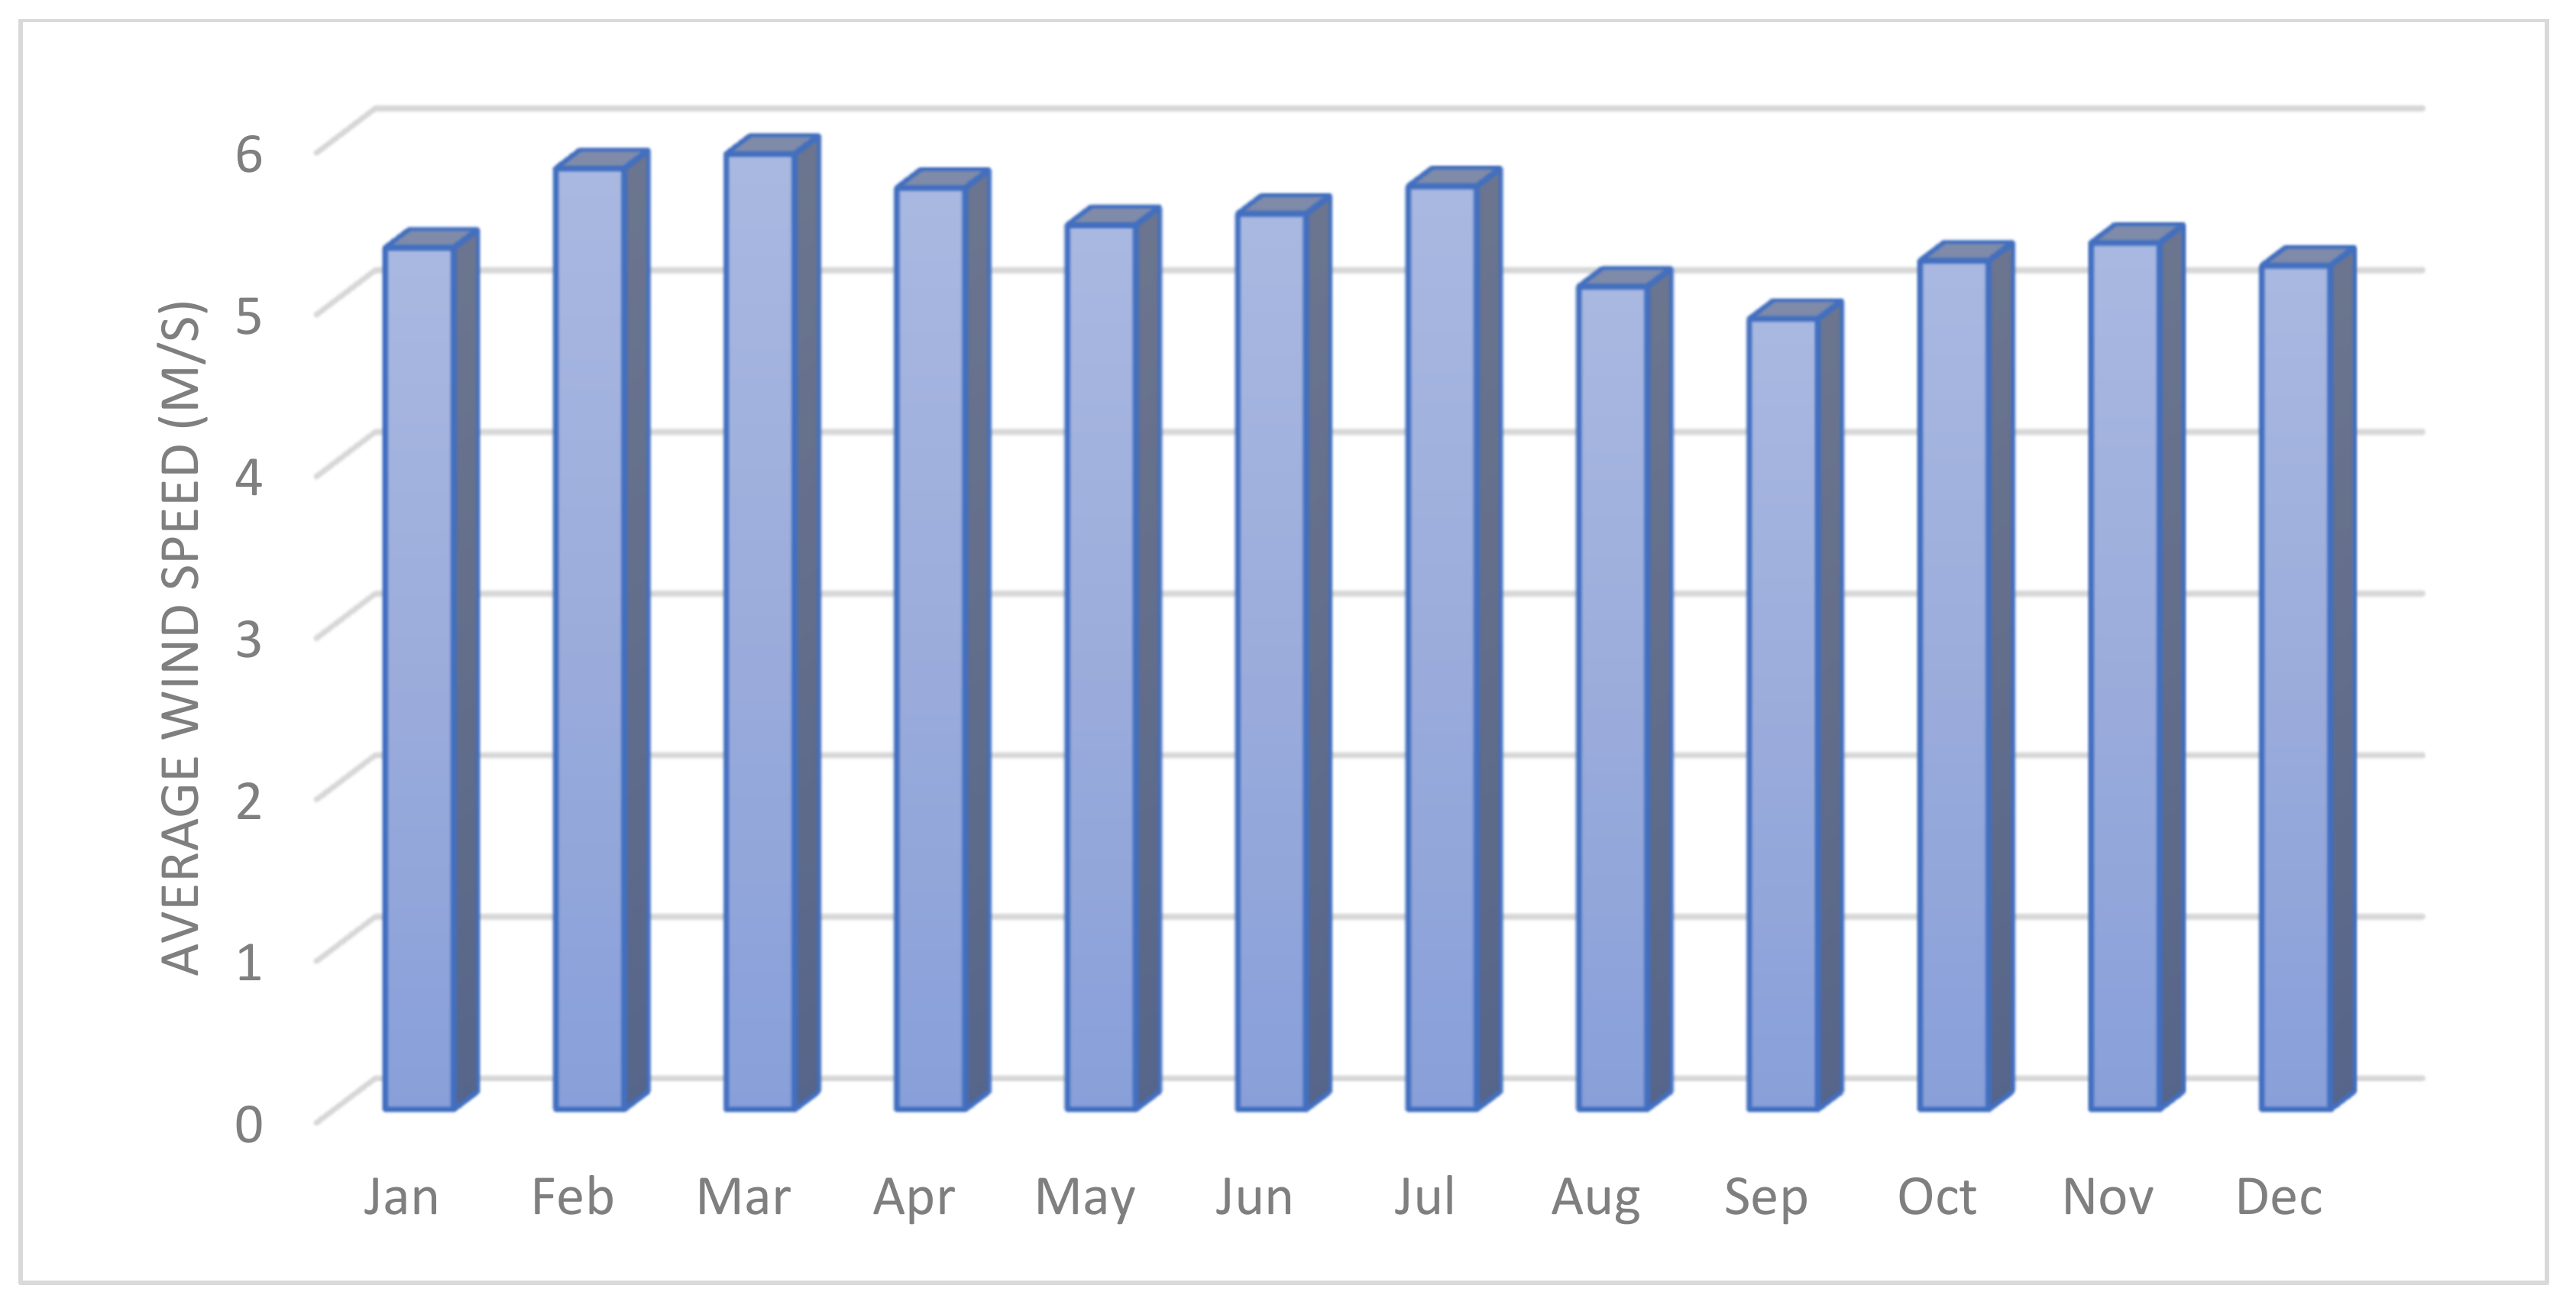
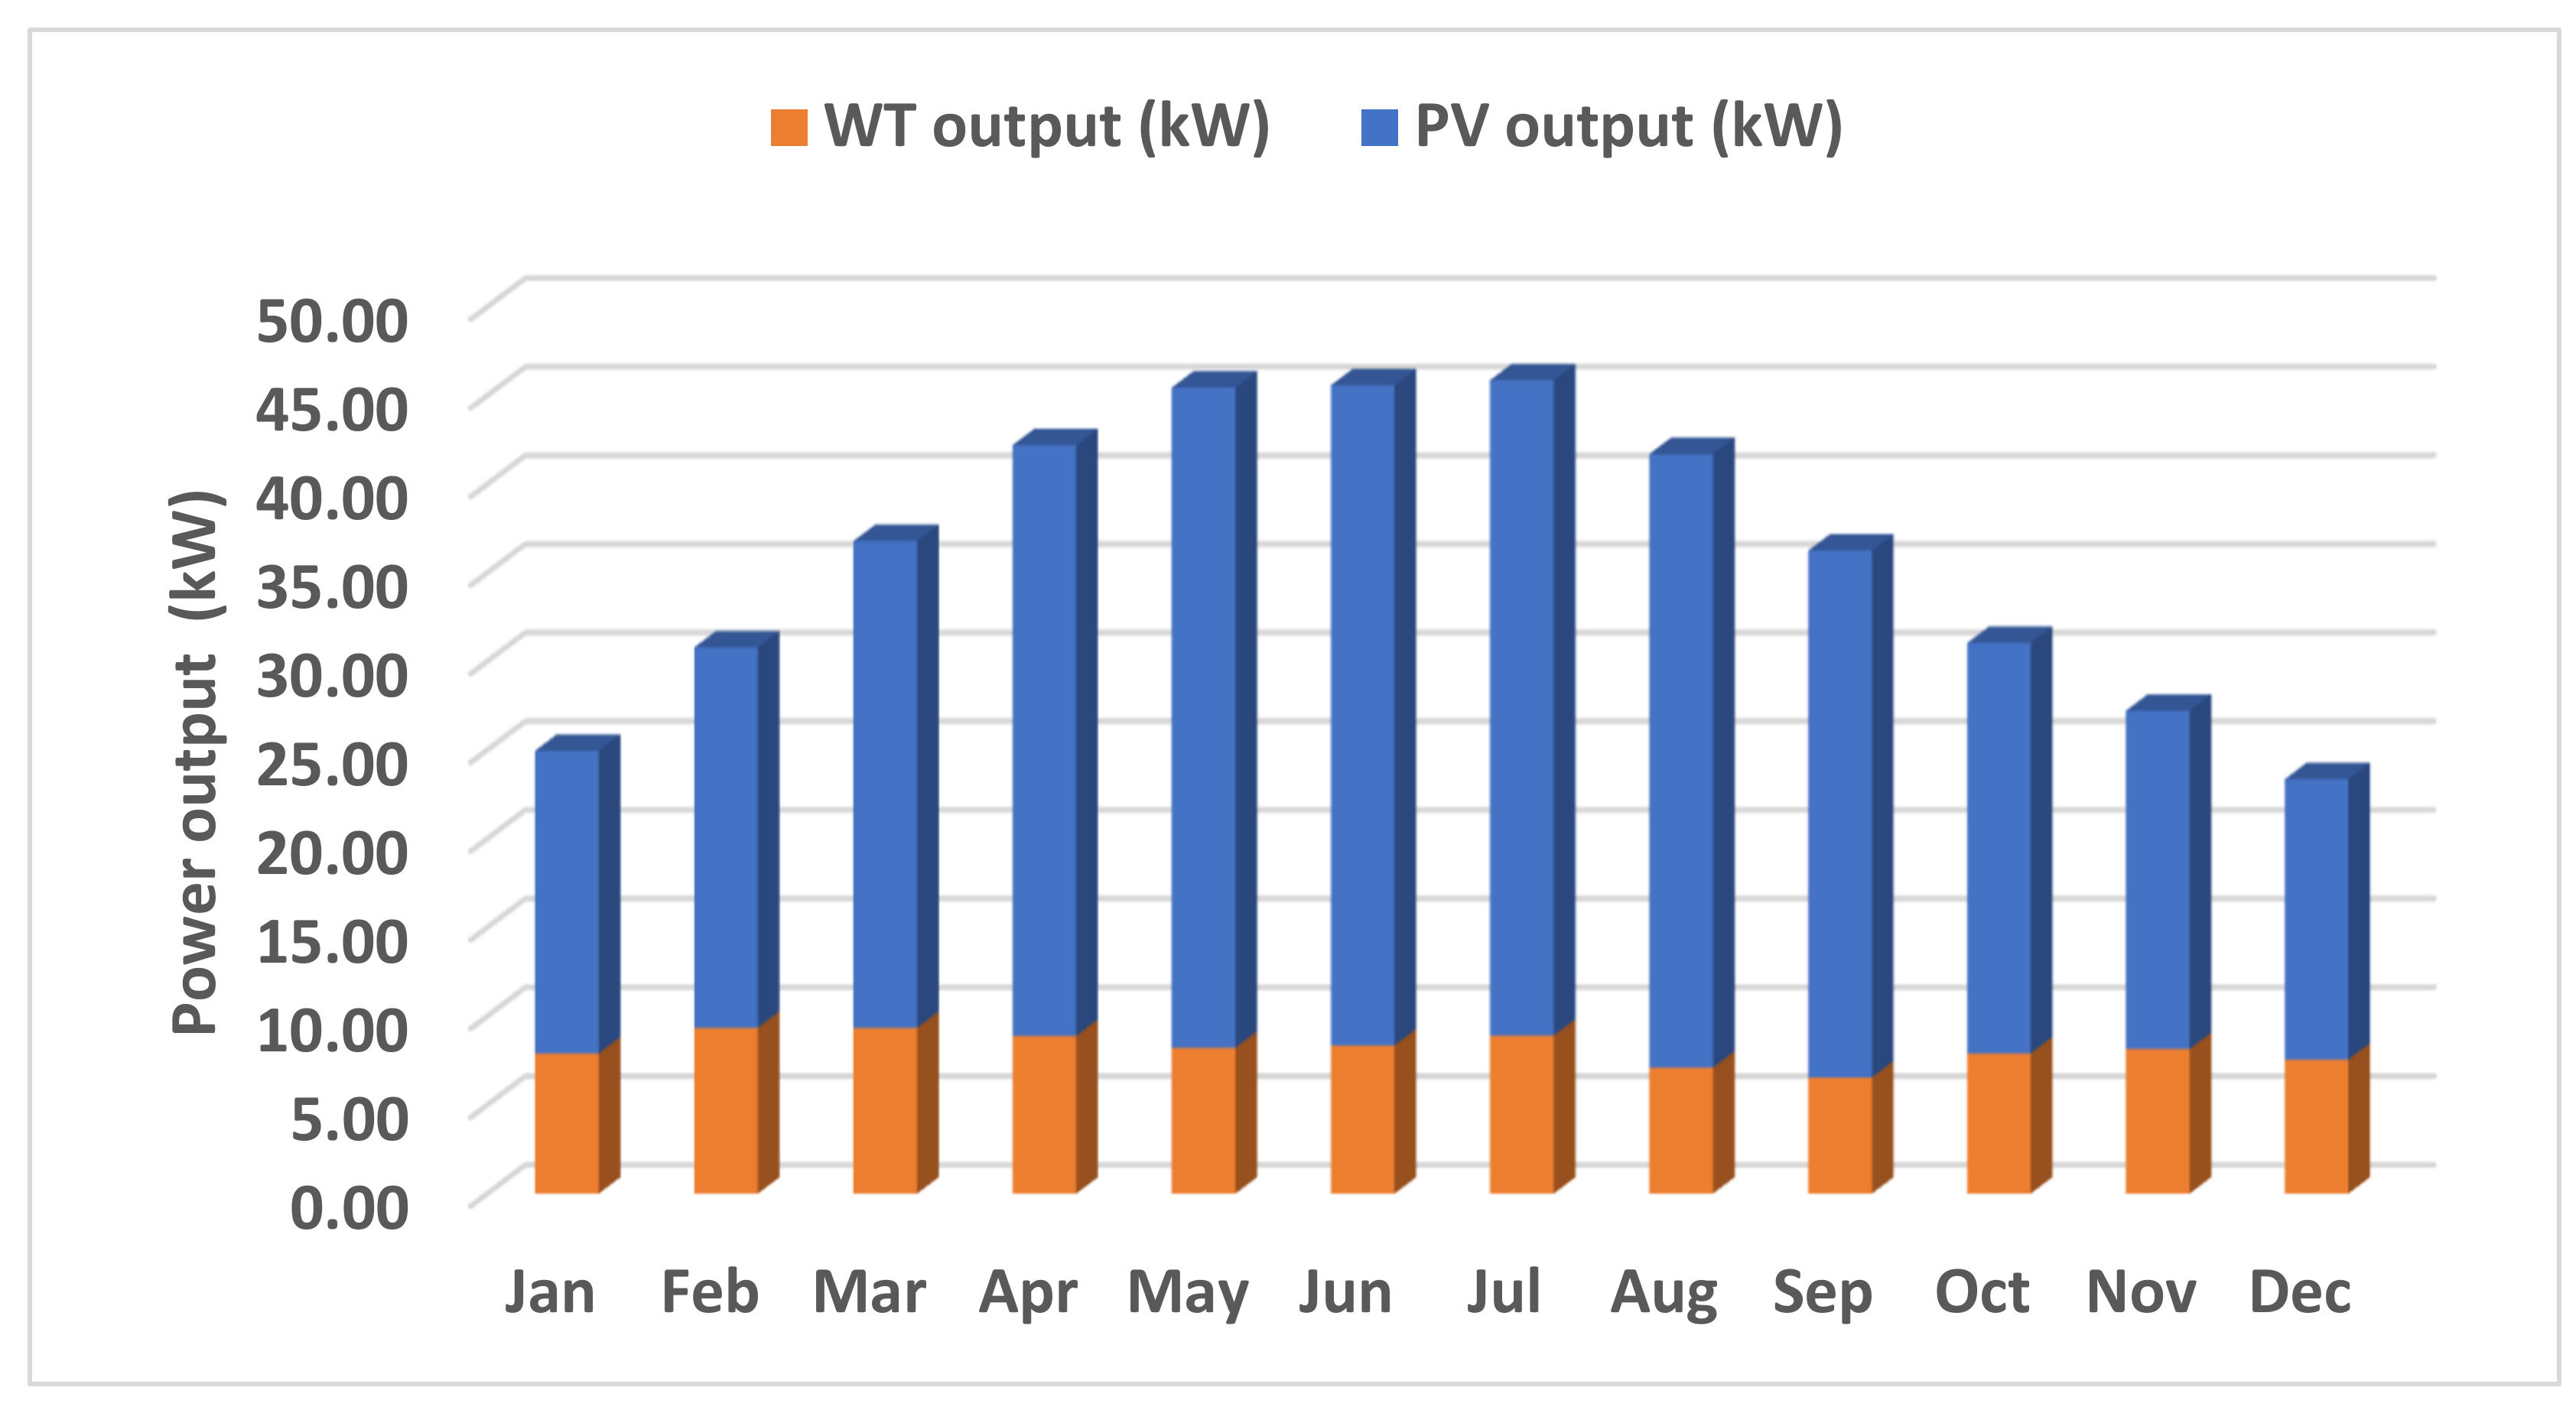
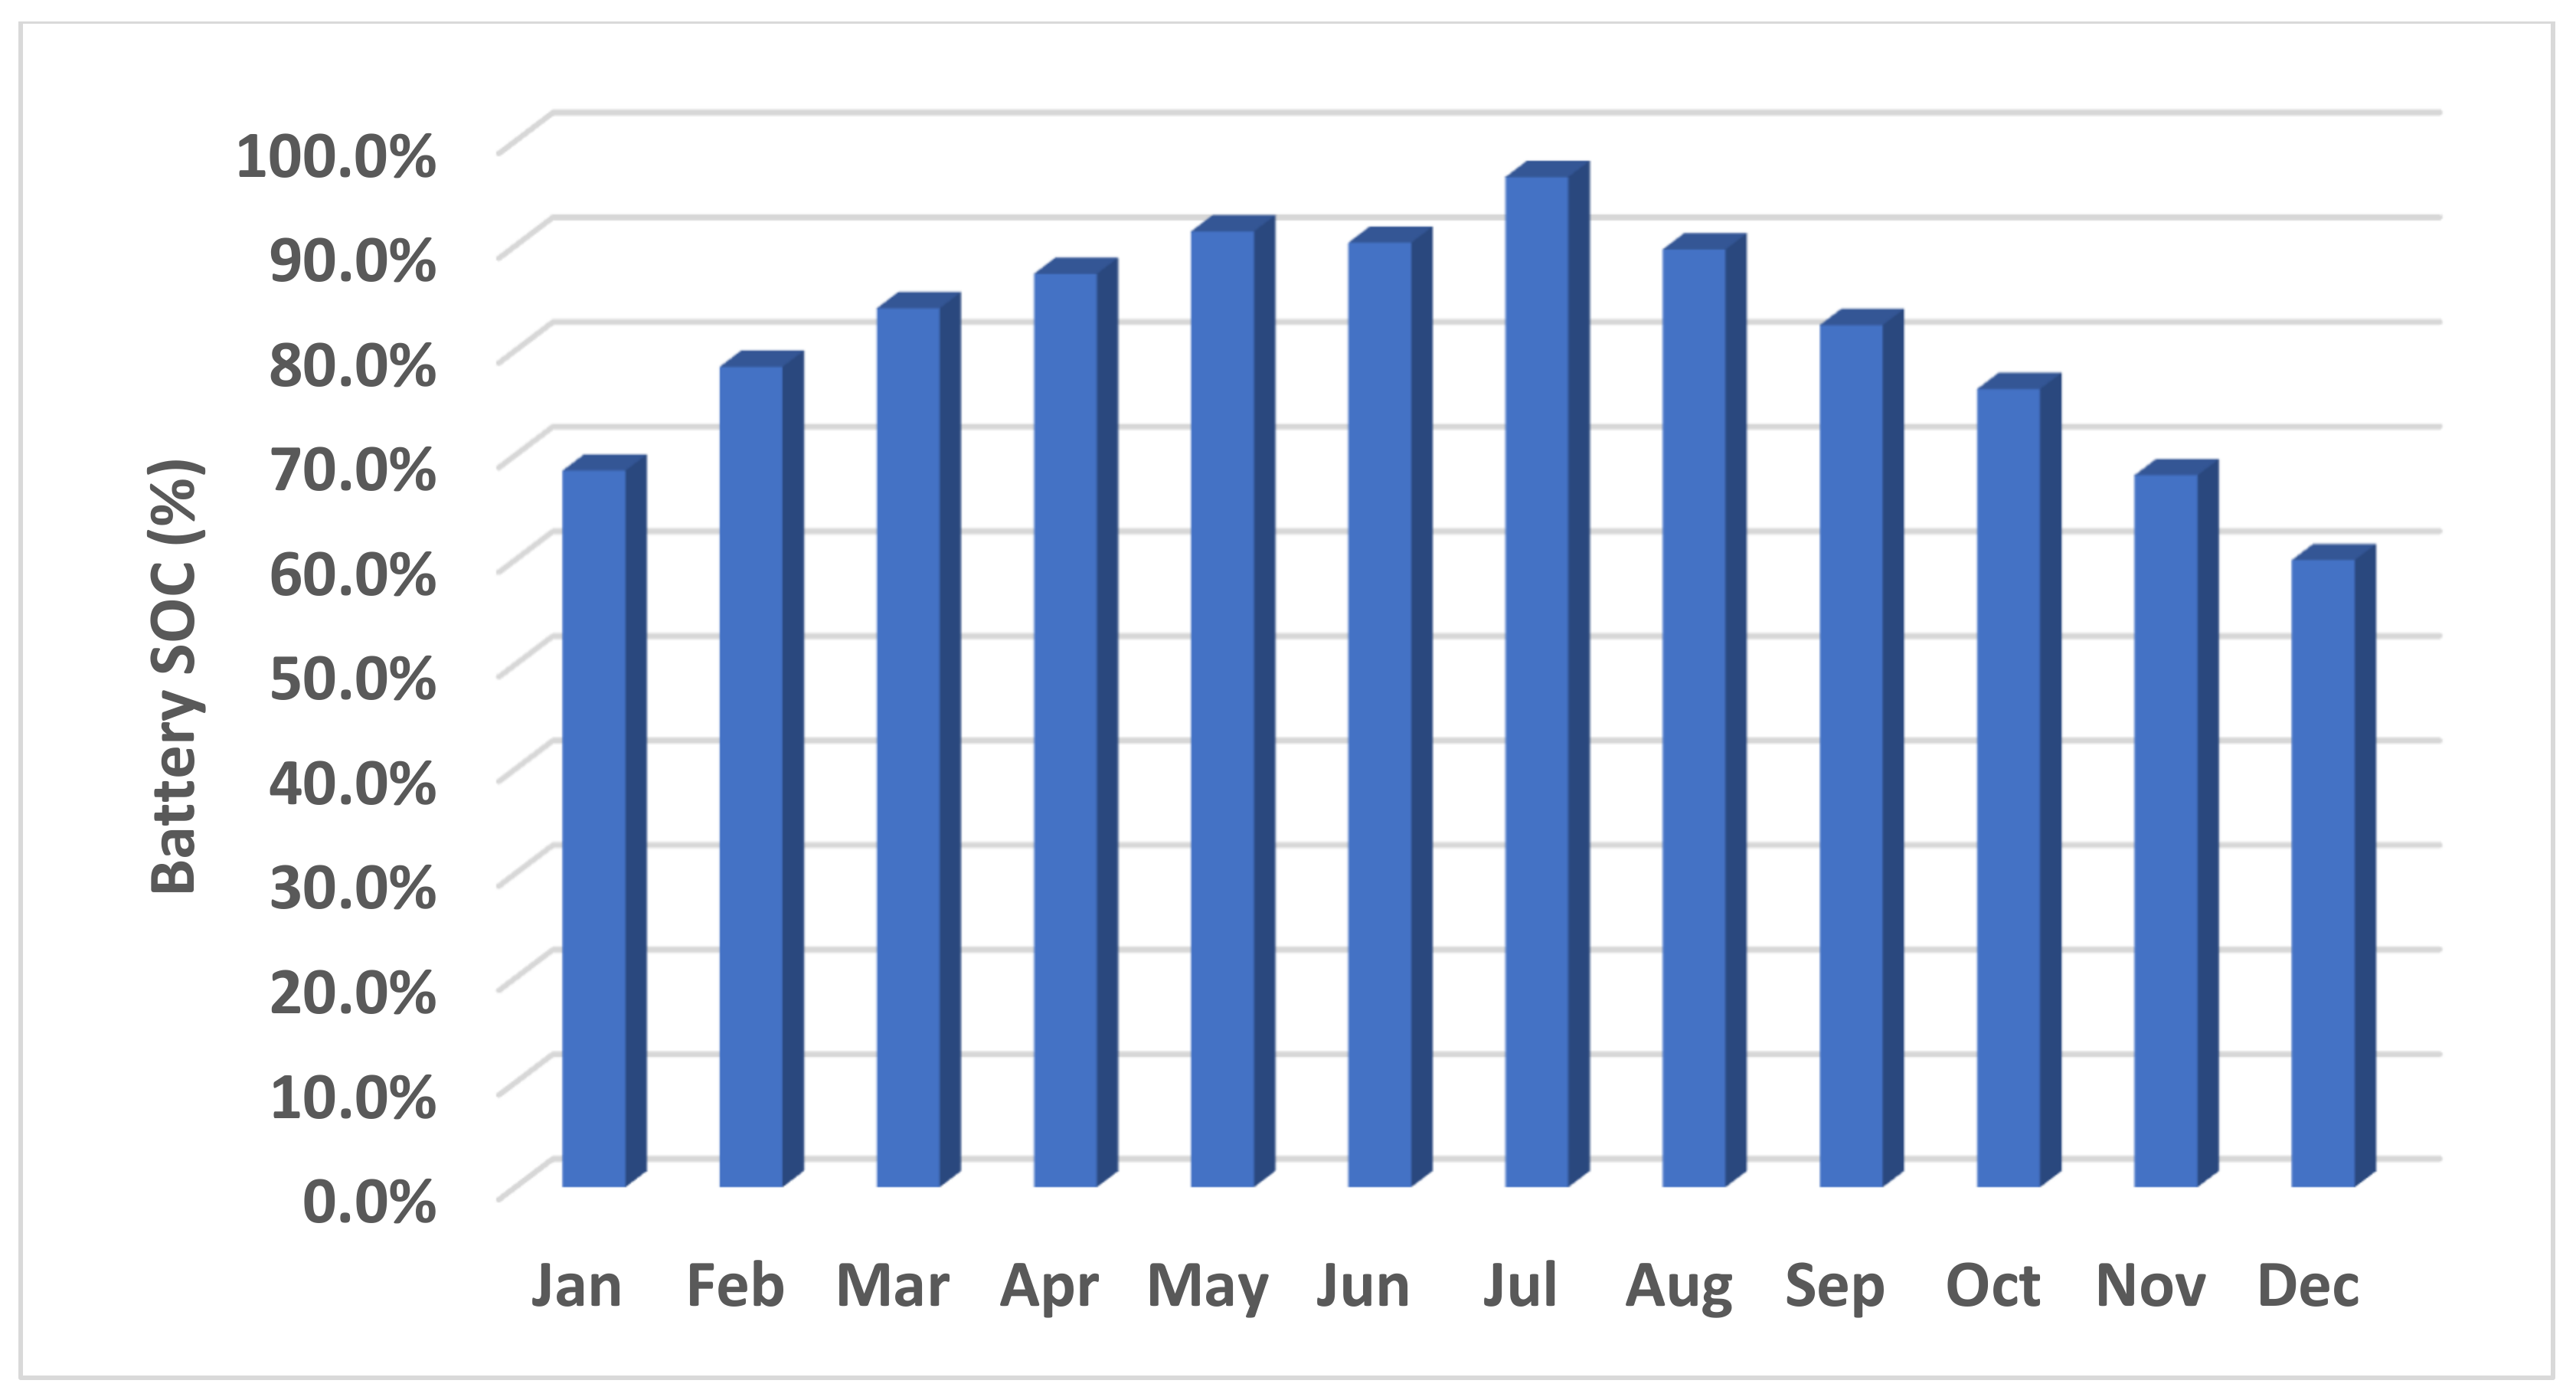
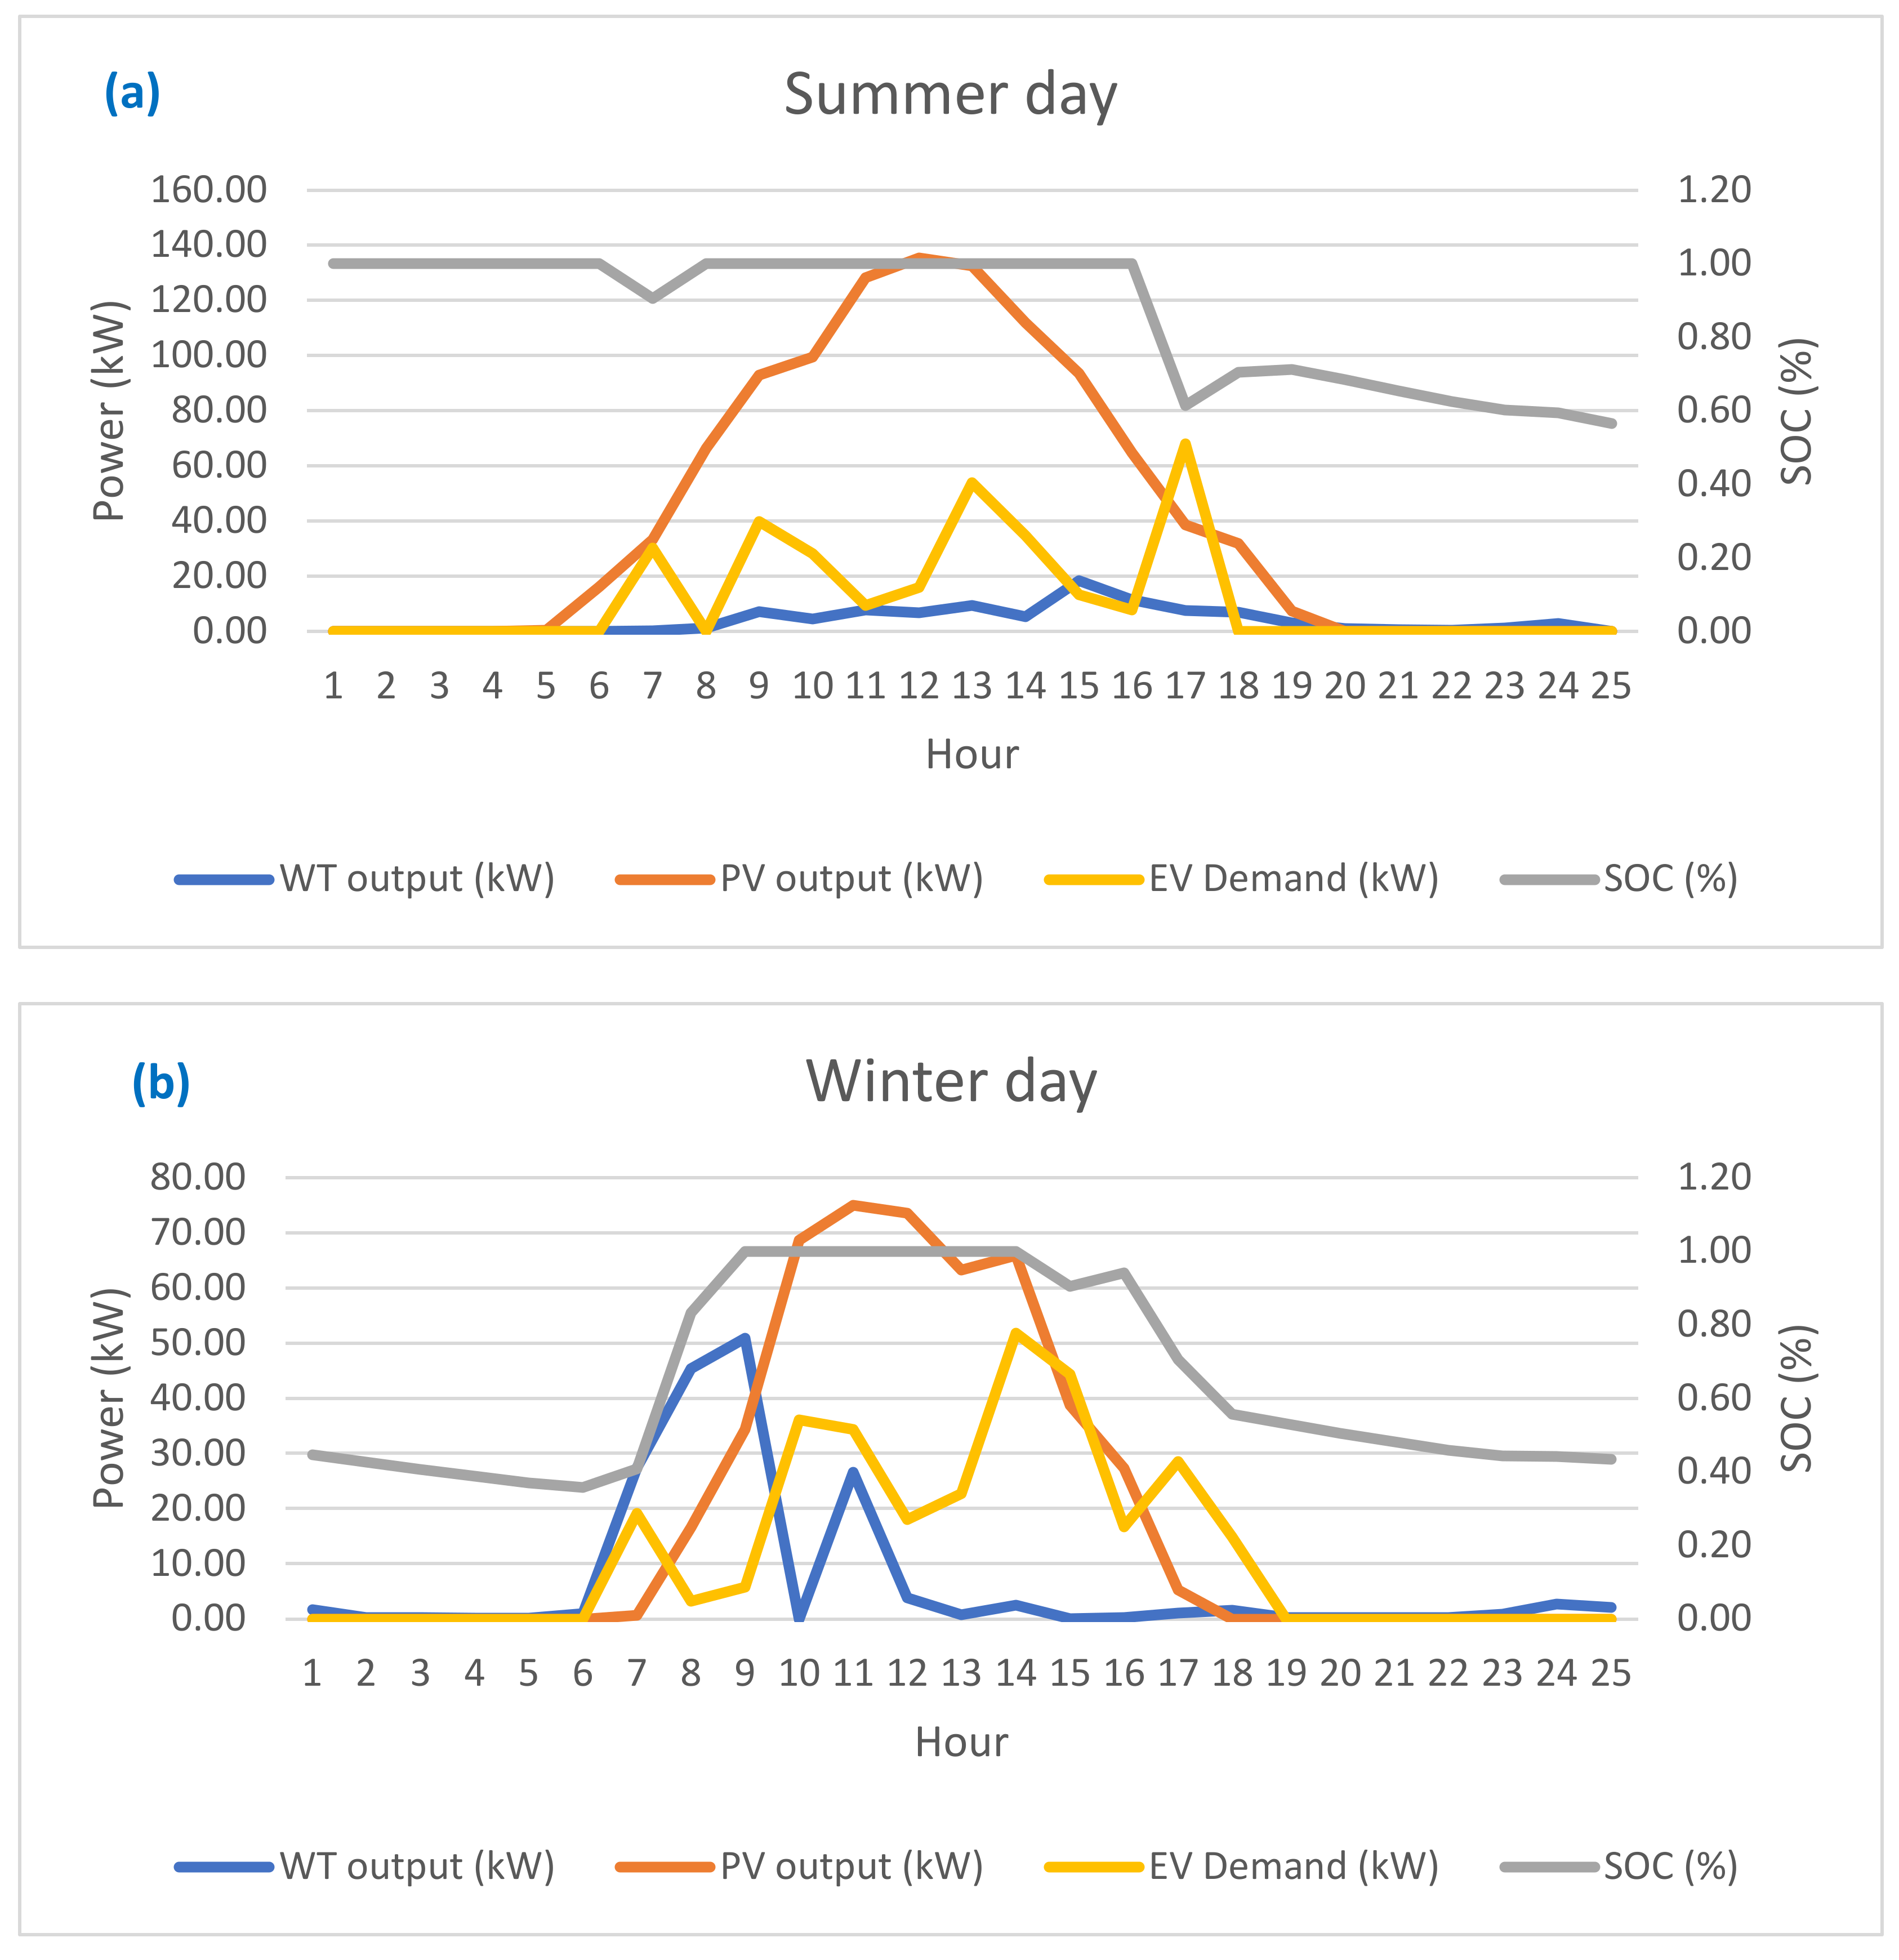
The proposed system can adjust to different energy requirements in different seasons, showcasing its ability to function effectively under diverse weather conditions.
The study concludes that the development of a hybrid renewable energy system can provide a reliable source of sustainable electricity for institutions and neighboring communities.
The findings have implications for designing and implementing sustainable renewable energy systems that consider seasonal variations in energy production and consumption.
In conclusion, the study had the goal of finding a sustainable solution for hybrid EV charging systems by considering both technical and economic aspects. The results offer helpful advice for developing sustainable EV charging systems that rely on RES. For future work, we will build on this study to further enhance the design and operation of such systems. Specifically, we will examine the integration of more renewable energy sources, the effect of different economic and environmental conditions, and the impact of EV usage on the grid. We hope that these future works will lead to considerable improvements and support the development of sustainable energy systems.

Author Contributions

Methodology, N.F.A., M.M.S. and S.B.; Software, S.B.; Validation, M.M.S. and S.B.; Investigation, S.B.; Writing—original draft, S.B.; Writing—review & editing, M.M.S.; Supervision, M.M.S.; Project administration, N.F.A.; Funding acquisition, N.F.A. All authors have read and agreed to the published version of the manuscript.

Funding

This research was funded by Deputyship for Research & Innovation, Ministry of Education in Saudi Arabia grant number 223202.

Data Availability Statement

The data that support the findings of this study are available from the corresponding author upon reasonable request.

Acknowledgments

The authors extend their appreciation to the Deputyship for Research and Innovation, Ministry of Education, Saudi Arabia, for funding this research work through the project number 223202.

Conflicts of Interest

The authors declare no conflict of interest.

Nomenclature

P p v PV Output PowerABCArtificial Bee Colony
P P V r PV Rated PowerCRFCapital Recovery Factor.
GGlobal Irradiance Incident on Titled PlaneDODDepth of Discharge.
D F p v PV Derating FactorDRPDemand Response Participation
D E G F p v PV Degradation FactorEVCSElectric Vehicle Charging Stations
S F p v Shading FactorEVsElectric Vehicles
N p v The number of PV system.GHGGreenhouse Gas
T a m b Ambient TemperatureHOMERHybrid Optimization of Multiple Energy Resources
T b a s e Base TemperatureHPSHybrid Power Systems
N W T The number of wind turbinesLCOElevelized Cost of Energy
η w The wind turbine efficiencyLPSPLoss of Power Supply Probability
P W T r The rated power of the wind turbine (kW).LSALightning Search Algorithm
V(t)The upgraded wind speed in (m/s)MOEA/DMulti-Objective Evolutionary Algorithm Based on Decomposition
VciThe cut-in wind speed in (m/s)MOPSOMulti-Objective Particle Swarm Optimization
VcoThe cut-out wind speed in (m/s)NOCTNormal Operating Cell Temperature
VrThe rated wind speed (m/s)NSGA-IINon-dominated Sorting Genetic Algorithm
C B a t Battery bank nominal capacity (kWh).NSGA-IIINon-dominated Sorting Genetic Algorithm III
C B a t , m i n Minimum allowable storage battery capacity.POWERNASA Prediction of Worldwide Energy Resource database
C B a t , m a x Maximum allowable storage battery capacity.PSOParticle Swarm Optimization
NbatThe number of battery banks.PVPhotovoltaic
C I The initial capital cost.PV-BESSPhotovoltaic-Battery Energy Storage Systems
C R The replacement costs of the componentsPVWB/EVCSPhotovoltaic-Wind Turbine-Battery/Electric Vehicle Charging Station
C O & M Operating and Maintenance CostsRESRenewable Energy Sources
IrInterest rate.RFRenewable Fraction
IfInflation rate.SDGsSustainable Development Goals
E s e r v e d The primary load served (kWh/year).TNPCTotal Net Present Cost
σ The Battery Self-DischargeTNPCTotal Net Present Cost
η b The Battery efficiencyV2GVehicle-to-Grid
P E V C S The EVCS loadVCSVirus Colony Search Optimization
SSalvage valueWTWind Turbines

References

  1. Brenna, M.; Foiadelli, F.; Leone, C.; Longo, M. Electric vehicles charging technology review and optimal size estimation. J. Electr. Eng. Technol. 2020, 15, 2539–2552. [Google Scholar] [CrossRef]
  2. Mishra, S.; Verma, S.; Chowdhury, S.; Gaur, A.; Mohapatra, S.; Dwivedi, G.; Verma, P. A comprehensive review on developments in electric vehicle charging station infrastructure and present scenario of India. Sustainability 2021, 13, 2396. [Google Scholar] [CrossRef]
  3. Chavhan, S.; Zeebaree, S.R.M.; Alkhayyat, A.; Kumar, S. Design of Space Efficient Electric Vehicle Charging Infrastructure Integration Impact on Power Grid Network. Mathematics 2022, 10, 3450. [Google Scholar] [CrossRef]
  4. Balmelli, S.; Moresino, F. Coordination of Plug-In Electric Vehicle Charging in a Stochastic Framework: A Decentralized Tax/Incentive-Based Mechanism to Reach Global Optimality. Mathematics 2023, 11, 999. [Google Scholar] [CrossRef]
  5. Ullah, Z.; Wang, S.; Wu, G.; Hasanien, H.M.; Rehman, A.U.; Turky, R.A.; Elkadeem, M.R. Optimal scheduling and techno-economic analysis of electric vehicles by implementing solar-based grid-tied charging station. Energy 2023, 267, 126560. [Google Scholar] [CrossRef]
  6. Bhatt, A.; Ongsakul, W.; Madhu, N.M. Optimal techno-economic feasibility study of net-zero carbon emission microgrid integrating second-life battery energy storage system. Energy Convers. Manag. 2022, 266, 115825. [Google Scholar] [CrossRef]
  7. Farhoodnea, M.; Mohamed, A.; Shareef, H.; Zayandehroodi, H. Power quality impacts of high-penetration electric vehicle stations and renewable energy-based generators on power distribution systems. Measurement 2013, 46, 2423–2434. [Google Scholar] [CrossRef]
  8. Al-Shetwi, A.Q.; Hannan, M.A.; Jern, K.P.; Alkahtani, A.A.; PG Abas, A.E. Power quality assessment of grid-connected PV system in compliance with the recent integration requirements. Electronics 2020, 9, 366. [Google Scholar] [CrossRef] [Green Version]
  9. Solanke, T.U.; Ramachandaramurthy, V.K.; Yong, J.Y.; Pasupuleti, J.; Kasinathan, P.; Rajagopalan, A. A review of strategic charging–discharging control of grid-connected electric vehicles. J. Energy Storage 2020, 28, 101193. [Google Scholar] [CrossRef]
  10. Divyapriya, S.; Vijayakumar, R. Design of residential plug-in electric vehicle charging station with time of use tariff and IoT technology. In Proceedings of the 2018 International Conference on Soft-computing and Network Security (ICSNS), Coimbatore, India, 14–16 February 2018; pp. 1–5. [Google Scholar]
  11. Fang, J.; Li, H.; Tang, Y.; Blaabjerg, F. Distributed power system virtual inertia implemented by grid-connected power converters. IEEE Trans. Power Electron. 2017, 33, 8488–8499. [Google Scholar] [CrossRef] [Green Version]
  12. Al-Shetwi, A.Q.; Issa, W.K.; Aqeil, R.F.; Ustun, T.S.; Al-Masri, H.M.K.; Alzaareer, K.; Abdolrasol, M.G.M.; Abdullah, M.A. Active Power Control to Mitigate Frequency Deviations in Large-Scale Grid-Connected PV System Using Grid-Forming Single-Stage Inverters. Energies 2022, 15, 2035. [Google Scholar] [CrossRef]
  13. Narasipuram, R.P.; Mopidevi, S. A technological overview & design considerations for developing electric vehicle charging stations. J. Energy Storage 2021, 43, 103225. [Google Scholar]
  14. Singh, S.; Chauhan, P.; Singh, N.J. Feasibility of grid-connected solar-wind hybrid system with electric vehicle charging station. J. Mod. Power Syst. Clean Energy 2020, 9, 295–306. [Google Scholar] [CrossRef]
  15. Shaukat, N.; Khan, B.; Ali, S.M.; Mehmood, C.A.; Khan, J.; Farid, U.; Majid, M.; Anwar, S.M.; Jawad, M.; Ullah, Z. A survey on electric vehicle transportation within smart grid system. Renew. Sustain. Energy Rev. 2018, 81, 1329–1349. [Google Scholar] [CrossRef]
  16. Samy, M.M.; Elkhouly, H.I.; Barakat, S. Multi-objective optimization of hybrid renewable energy system based on biomass and fuel cells. Int. J. Energy Res. 2021, 45, 8214–8230. [Google Scholar] [CrossRef]
  17. Samy, M.M.; Mosaad, M.I.; Barakat, S. Optimal economic study of hybrid PV-wind-fuel cell system integrated to unreliable electric utility using hybrid search optimization technique. Int. J. Hydrogen Energy 2021, 46, 11217–11231. [Google Scholar] [CrossRef]
  18. Samy, M.M.; Almamlook, R.E.; Elkhouly, H.I.; Barakat, S. Decision-Making and Optimal Design of Green E nergy System Based on Statistical Methods and Artificial Neural Network Approaches. Sustain. Cities Soc. 2022, 84, 104015. [Google Scholar] [CrossRef]
  19. Samy, M.M.; Barakat, S.; Ramadan, H.S. A flower pollination optimization algorithm for an off-grid PV-Fuel cell hybrid renewable system. Int. J. Hydrogen Energy 2019, 44, 2141–2152. [Google Scholar] [CrossRef]
  20. Deb, K.; Deb, K. Multi-objective optimization. In Search Methodologies: Introductory Tutorials in Optimization and Decision Support Techniques; Springer: Berlin/Heidelberg, Germany, 2013; pp. 403–449. [Google Scholar]
  21. Coello, C.A.C. Treating constraints as objectives for single-objective evolutionary optimization. Eng. Optim. A35 2000, 32, 275–308. [Google Scholar] [CrossRef]
  22. Taboada, H.A.; Baheranwala, F.; Coit, D.W.; Wattanapongsakorn, N. Practical solutions for multi-objective optimization: An application to system reliability design problems. Reliab. Eng. Syst. Saf. 2007, 92, 314–322. [Google Scholar] [CrossRef]
  23. Konak, A.; Coit, D.W.; Smith, A.E. Multi-objective optimization using genetic algorithms: A tutorial. Reliab. Eng. Syst. Saf. 2006, 91, 992–1007. [Google Scholar] [CrossRef]
  24. Abbass, H.A.; Sarker, R.; Newton, C. PDE: A Pareto-frontier differential evolution approach for multi-objective optimization problems. In Proceedings of the 2001 Congress on Evolutionary Computation (IEEE Cat. No. 01TH8546), Seoul, Republic of Korea, 27–30 May 2001; Volume 2, pp. 971–978. [Google Scholar]
  25. Ngatchou, P.; Zarei, A.; El-Sharkawi, A. Pareto multi objective optimization. In Proceedings of the 13th International Conference on Intelligent Systems Application to Power Systems, Arlington, VA, USA, 6–10 November 2005; pp. 84–91. [Google Scholar]
  26. Ball, M.O. Heuristics based on mathematical programming. Surv. Oper. Res. Manag. Sci. 2011, 16, 21–38. [Google Scholar] [CrossRef]
  27. Marler, R.T.; Arora, J.S. The weighted sum method for multi-objective optimization: New insights. Struct. Multidiscip. Optim. 2010, 41, 853–862. [Google Scholar] [CrossRef]
  28. Mavrotas, G. Effective implementation of the ε-constraint method in multi-objective mathematical programming problems. Appl. Math. Comput. 2009, 213, 455–465. [Google Scholar] [CrossRef]
  29. Tamiz, M.; Jones, D.; Romero, C. Goal programming for decision making: An overview of the current state-of-the-art. Eur. J. Oper. Res. 1998, 111, 569–581. [Google Scholar] [CrossRef]
  30. Chiong, R. Nature-Inspired Algorithms for Optimisation; Springer: Berlin/Heidelberg, Germany, 2009; Volume 193. [Google Scholar]
  31. Jansen, T. Analyzing Evolutionary Algorithms: The Computer Science Perspective; Springer: Berlin/Heidelberg, Germany, 2013. [Google Scholar]
  32. Forrest, S. Genetic algorithms. ACM Comput. Surv. 1996, 28, 77–80. [Google Scholar] [CrossRef]
  33. Kennedy, J.; Eberhart, R. Particle swarm optimization. In Proceedings of the ICNN’95-International Conference on Neural Networks, Perth, Australia, 27 November 1995; Volume 4, pp. 1942–1948. [Google Scholar]
  34. Feoktistov, V. Differential Evolution; Springer: Berlin/Heidelberg, Germany, 2006. [Google Scholar]
  35. Price, K.V. Differential evolution. Handbook of Optimization: From Classical to Modern Approach; Springer: Berlin/Heidelberg, Germany, 2013; pp. 187–214. [Google Scholar]
  36. Coello, C.A.C.; Lamont, G.B. Applications of Multi-Objective Evolutionary Algorithms; World Scientific: Singapore, 2004; Volume 1. [Google Scholar]
  37. Deb, K. Multi-objective evolutionary algorithms. In Springer Handbook of Computational Intelligence; Springer: Berlin/Heidelberg, Germany, 2015; pp. 995–1015. [Google Scholar]
  38. Marcelino, C.G.; Leite, G.M.C.; Delgado, C.A.D.M.; de Oliveira, L.B.; Wanner, E.F.; Jiménez-Fernández, S.; Salcedo-Sanz, S. An efficient multi-objective evolutionary approach for solving the operation of multi-reservoir system scheduling in hydro-power plants. Expert Syst. Appl. 2021, 185, 115638. [Google Scholar] [CrossRef]
  39. Lin, Q.; Liu, S.; Zhu, Q.; Tang, C.; Song, R.; Chen, J.; Coello, C.A.C.; Wong, K.-C.; Zhang, J. Particle swarm optimization with a balanceable fitness estimation for many-objective optimization problems. IEEE Trans. Evol. Comput. 2016, 22, 32–46. [Google Scholar] [CrossRef]
  40. Coello, C.A.C.; Lechuga, M.S. MOPSO: A proposal for multiple objective particle swarm optimization. In Proceedings of the 2002 Congress on Evolutionary Computation, CEC’02 (Cat. No. 02TH8600), Honolulu, HI, USA, 12–17 May 2002; Volume 2, pp. 1051–1056. [Google Scholar]
  41. Deb, K.; Pratap, A.; Agarwal, S.; Meyarivan, T. A fast and elitist multiobjective genetic algorithm: NSGA-II. IEEE Trans. Evol. Comput. 2002, 6, 182–197. [Google Scholar] [CrossRef] [Green Version]
  42. Ishibuchi, H.; Imada, R.; Setoguchi, Y.; Nojima, Y. Performance comparison of NSGA-II and NSGA-III on various many-objective test problems. In Proceedings of the 2016 IEEE Congress on Evolutionary Computation (CEC), Vancouver, BC, Canada, 24–29 July 2016; pp. 3045–3052. [Google Scholar]
  43. Zhang, Q.; Li, H. MOEA/D: A multiobjective evolutionary algorithm based on decomposition. IEEE Trans. Evol. Comput. 2007, 11, 712–731. [Google Scholar] [CrossRef]
  44. Boddapati, V.; Kumar, A.R.; Daniel, S.A.; Padmanaban, S. Design and prospective assessment of a hybrid energy-based electric vehicle charging station. Sustain. Energy Technol. Assess. 2022, 53, 102389. [Google Scholar] [CrossRef]
  45. Karmaker, A.K.; Ahmed, M.R.; Hossain, M.A.; Sikder, M.M. Feasibility assessment & design of hybrid renewable energy based electric vehicle charging station in Bangladesh. Sustain. Cities Soc. 2018, 39, 189–202. [Google Scholar]
  46. Bastida-Molina, P.; Hurtado-Pérez, E.; Gómez, M.C.M.; Vargas-Salgado, C. Multicriteria power generation planning and experimental verification of hybrid renewable energy systems for fast electric vehicle charging stations. Renew. Energy 2021, 179, 737–755. [Google Scholar] [CrossRef]
  47. Rahman, M.M.; Al-Ammar, E.A.; Das, H.S.; Ko, W. Optimal design of grid connected pv battery system for probabilistic EVCS load. In Proceedings of the 2020 Advances in Science and Engineering Technology International Conferences (ASET), Dubai, United Arab Emirates, 4 February–9 April 2020; pp. 8–13. [Google Scholar] [CrossRef]
  48. Verma, A.; Singh, B. CAPSA Based Control for Power Quality Correction in PV Array Integrated EVCS Operating in Standalone and Grid Connected Modes. IEEE Trans. Ind. Appl. 2021, 57, 1789–1800. [Google Scholar] [CrossRef]
  49. Bilal, M.; Alsaidan, I.; Alaraj, M.; Almasoudi, F.M.; Rizwan, M. Techno-Economic and Environmental Analysis of Grid-Connected Electric Vehicle Charging Station Using AI-Based Algorithm. Mathematics 2022, 10, 924. [Google Scholar] [CrossRef]
  50. Araújo, D.N.; Araújo, A.P.V.G.; Vasconcelos, A.; Castro, J.; Júnior, W.D.A.S.; Medeiros, L.; Conceição, J. Optimum Design of On-Grid PV-BESS for Fast Electric Vehicle Charging Station in Brazil Optimum Design of On-Grid PV-BESS for Fast Electric Vehicle Charging Station in Brazil. In Proceedings of the IEEE PES Innovative Smart Grid Technologies Conference-Latin America (ISGT Latin America), Lima, Peru, 15–17 September 2021. [Google Scholar]
  51. Enescu, F.M.; Birleanu, F.G.; Raboaca, M.S.; Raceanu, M.; Bizon, N.; Thounthong, P. Electric Vehicle Charging Station Based on Photovoltaic Energy with or without the Support of a Fuel Cell—Electrolyzer Unit. Energies 2023, 16, 762. [Google Scholar] [CrossRef]
  52. Kothandaraman Raghavan, A. PV Enabled Net Zero EV Charging Station: System Design and Simulation Study. Master’s Thesis, University of Waterloo, Waterloo, ON, Canada, 2018. [Google Scholar]
  53. Cazzato, F.; Di Clerico, M.; Falvo, M.C.; Ferrero, S.; Vivian, M. New Dispatching Paradigm in Power Systems Including EV Charging Stations and Dispersed Generation: A Real Test Case. Energies 2020, 13, 944. [Google Scholar] [CrossRef] [Green Version]
  54. Ye, B.; Jiang, J.; Miao, L.; Yang, P.; Li, J.; Shen, B. Feasibility study of a solar-powered electric vehicle charging station model. Energies 2015, 8, 13265–13283. [Google Scholar] [CrossRef] [Green Version]
  55. Al Wahedi, A.; Bicer, Y. Techno-economic optimization of novel stand-alone renewables-based electric vehicle charging stations in Qatar. Energy 2022, 243, 123008. [Google Scholar] [CrossRef]
  56. Al-Buraiki, A.S.; Al-Sharafi, A. Technoeconomic analysis and optimization of hybrid solar/wind/battery systems for a standalone house integrated with electric vehicle in Saudi Arabia. Energy Convers. Manag. 2021, 250, 114899. [Google Scholar] [CrossRef]
  57. El-Bayeh, C.Z.; Zellagui, M.; Shirzadi, N.; Eicker, U. A novel optimization algorithm for solar panels selection towards a self-powered EV parking lot and its impact on the distribution system. Energies 2021, 14, 4515. [Google Scholar] [CrossRef]
  58. Hao, D.; Ren, X.; Mohammed, A.S. Optimal Design of Electric Vehicle Parking Lot based on Energy Management Considering Hydrogen Storage System and Demand Side Management. J. Energy Storage 2021, 42, 103045. [Google Scholar] [CrossRef]
  59. Ghadi-Sahebi, M.; Ebrahimi, R.; Parvin-darabad, V. Optimal probabilistic operation management of smart parking lot and renewable sources in microgrid to reduce cost and improve system reliability considering demand response program. Int. Trans. Electr. Energy Syst. 2021, 31, e13108. [Google Scholar] [CrossRef]
  60. Goli, P.; Shireen, W. PV powered smart charging station for PHEVs. Renew. Energy 2014, 66, 280–287. [Google Scholar] [CrossRef]
  61. Kabli, M.; Quddus, M.A.; Nurre, S.G.; Marufuzzaman, M.; Usher, J.M. A stochastic programming approach for electric vehicle charging station expansion plans. Int. J. Prod. Econ. 2020, 220, 107461. [Google Scholar] [CrossRef]
  62. Li, Y.; Su, S.; Liu, B.; Yamashita, K.; Li, Y.; Du, L. Trajectory-driven planning of electric taxi charging stations based on cumulative prospect theory. Sustain. Cities Soc. 2022, 86, 104125. [Google Scholar] [CrossRef]
  63. Vuarnoz, D.; Jusselme, T. Neutral global warming potential target of electricity storage as threshold for greenhouse gas emission mitigation in buildings. In Proceedings of the PLEA 2018—Smart and Healthy Within the Two-Degree Limit, 34th International Conference on Passive and Low Energy Architecture, Hong Kong, China, 10–12 December 2018; Volume 1, pp. 68–73. [Google Scholar]
  64. Carlstedt, D.; Asp, L.E. Performance analysis framework for structural battery composites in electric vehicles. Compos. Part B Eng. 2020, 186, 107822. [Google Scholar] [CrossRef]
  65. Arvizu, D.; Balaya, P.; Cabeza, L.F.; Hollands, T.; Jäger-Waldau, A.; Kondo, M.; Konseibo, C.; Meleshko, V.; Stein, W.; Tamaura, Y.; et al. Direct Solar Energy. In IPCC Special Report on Renewable Energy Sources and Climate Change Mitigation; Cambridge University Press: Cambridge, UK, 2011; pp. 333–400. [Google Scholar]
  66. Duffie, J.A.; Beckman, W.A. Solar Engineering of Thermal Processes; Wiley: New York, NY, USA, 2013; Volume 3. [Google Scholar]
  67. Wiser, R.; Yang, Z.; Hand, M.; Hohmeyer, O.; Infield, D.; Jensen, P.H.; Nikolaev, V.; O’Malley, M.; Sinden, G.; Zervos, A. Wind energy. In IPCC Special Report on Renewable Energy Sources and Climate Change Mitigation; Cambridge University Press: Cambridge, UK, 2011; pp. 535–608. [Google Scholar]
  68. Hakimi, S.M.; Tafreshi, S.M.M.; Kashefi, A. Unit sizing of a stand-alone hybrid power system using particle swarm optimization (PSO). In Proceedings of the Automation and logistics, 2007 IEEE International Conference on Automation and Logistics, Jinan, China, 18–21 August 2007; pp. 3107–3112. [Google Scholar]
  69. Malheiro, A.; Castro, P.M.; Lima, R.M.; Estanqueiro, A. Integrated sizing and scheduling of wind/PV/diesel/battery isolated systems. Renew. Energy 2015, 83, 646–657. [Google Scholar] [CrossRef] [Green Version]
  70. Wu, K.; Zhou, H.; An, S.; Huang, T. Optimal coordinate operation control for wind--photovoltaic--battery storage power-generation units. Energy Convers. Manag. 2015, 90, 466–475. [Google Scholar] [CrossRef]
  71. Amrouche, S.O.; Rekioua, D.; Rekioua, T.; Bacha, S. Overview of energy storage in renewable energy systems. Int. J. Hydrogen Energy 2016, 41, 20914–20927. [Google Scholar] [CrossRef]
  72. Diaf, S.; Diaf, D.; Belhamel, M.; Haddadi, M.; Louche, A. A methodology for optimal sizing of autonomous hybrid PV/wind system. Energy Policy 2007, 35, 5708–5718. [Google Scholar] [CrossRef] [Green Version]
  73. Samy, M.M.; Emam, A.; Tag-Eldin, E.; Barakat, S. Exploring energy storage methods for grid-connected clean power plants in case of repetitive outages. J. Energy Storage 2022, 54, 105307. [Google Scholar] [CrossRef]
  74. Barakat, S.; Samy, M.M. A Hybrid Photovoltaic/Wind Green Energy System for Outpatient Clinic Utilizing Fuel Cells and Different Batteries as a Storage Devices. In Proceedings of the 2022 23rd International Middle East Power Systems Conference (MEPCON), Cairo, Egypt, 13–15 December 2022; pp. 1–6. [Google Scholar]
  75. Barakat, S.; Emam, A.; Samy, M.M. Investigating grid-connected green power systems’ energy storage solutions in the event of frequent blackouts. Energy Rep. 2022, 8, 5177. [Google Scholar] [CrossRef]
  76. Samy, M.M.; Mossad, M.I.; El-Naggar, M.F.; Barakat, S. Reliability Support of Undependable Grid Using Green Energy Systems; Economic Study. IEEE Access 2021, 9, 14528–14539. [Google Scholar] [CrossRef]
  77. Javed, M.S.; Song, A.; Ma, T. Techno-economic assessment of a stand-alone hybrid solar-wind-battery system for a remote island using genetic algorithm. Energy 2019, 176, 704–717. [Google Scholar] [CrossRef]
  78. Mostaghim, S.; Teich, J. Strategies for finding good local guides in multi-objective particle swarm optimization (MOPSO). In Proceedings of the 2003 IEEE Swarm Intelligence Symposium, SIS’03 (Cat. No. 03EX706), Indianapolis, IN, USA, 26 April 2003; pp. 26–33. [Google Scholar]
  79. Kumar, V.; Minz, S. Multi-objective particle swarm optimization: An introduction. SmartCR 2014, 4, 335–353. [Google Scholar] [CrossRef]
  80. Deb, K.; Agrawal, S.; Pratap, A.; Meyarivan, T. A fast elitist non-dominated sorting genetic algorithm for multi-objective optimization: NSGA-II. In Parallel Problem Solving from Nature PPSN VI, Proceedings of the 6th International Conference, Paris, France, 18–20 September 2000; Proceedings 6; Springer: Berlin/Heidelberg, Germany, 2000; pp. 849–858. [Google Scholar]
  81. Deb, K.; Jain, H. An evolutionary many-objective optimization algorithm using reference-point-based nondominated sorting approach, part I: Solving problems with box constraints. IEEE Trans. Evol. Comput. 2013, 18, 577–601. [Google Scholar] [CrossRef]
  82. Santos, T.; Xavier, S. A convergence indicator for multi-objective optimisation algorithms. TEMA 2018, 19, 437–448. [Google Scholar] [CrossRef] [Green Version]
  83. Khare, V.; Yao, X.; Deb, K. Performance scaling of multi-objective evolutionary algorithms. In Evolutionary Multi-Criterion Optimization, Proccedings of the Second International Conference, EMO 2003, Faro, Portugal, 8–11 April 2003; Proceedings 2; Springer: Berlin/Heidelberg, Germany, 2003; pp. 376–390. [Google Scholar]
  84. Riquelme, N.; Von Lücken, C.; Baran, B. Performance metrics in multi-objective optimization. In Proceedings of the 2015 Latin American Computing Conference (CLEI), Arequipa, Peru, 19–23 October 2015; pp. 1–11. [Google Scholar]
  85. Pal, M.; Bandyopadhyay, S. Reliability of convergence metric and hypervolume indicator for many-objective optimization. In Proceedings of the 2016 2nd International Conference on Control, Instrumentation, Energy & Communication (CIEC), Kolkata, India, 28–30 January 2016; pp. 511–515. [Google Scholar]
  86. Zitzler, E.; Brockhoff, D.; Thiele, L. The hypervolume indicator revisited: On the design of Pareto-compliant indicators via weighted integration. In Evolutionary Multi-Criterion Optimization, Proceedings of the 4th International Conference, EMO 2007, Matsushima, Japan, March 5–8 2007; Proceedings 4; Springer: Berlin/Heidelberg, Germany, 2007; pp. 862–876. [Google Scholar]
  87. Mostaghim, S.; Teich, J. A New Approach on Many Objective Diversity Measurement; Schloss Dagstuhl-Leibniz-Zentrum für Informatik: Wadern, Germany, 2005. [Google Scholar]
  88. He, Z.; Yen, G.G. Many-objective evolutionary algorithm: Objective space reduction and diversity improvement. IEEE Trans. Evol. Comput. 2015, 20, 145–160. [Google Scholar] [CrossRef]
  89. Bertsimas, D.; Sim, M. The price of robustness. Oper. Res. 2004, 52, 35–53. [Google Scholar] [CrossRef] [Green Version]
  90. Ehrgott, M.; Ide, J.; Schöbel, A. Minmax robustness for multi-objective optimization problems. Eur. J. Oper. Res. 2014, 239, 17–31. [Google Scholar] [CrossRef]
  91. Eker, S.; Kwakkel, J.H. Including robustness considerations in the search phase of Many-Objective Robust Decision Making. Environ. Model. Softw. 2018, 105, 201–216. [Google Scholar] [CrossRef] [Green Version]
  92. Kasprzyk, J.R.; Nataraj, S.; Reed, P.M.; Lempert, R.J. Many objective robust decision making for complex environmental systems undergoing change. Environ. Model. Softw. 2013, 42, 55–71. [Google Scholar] [CrossRef]
  93. Shavazipour, B.; Kwakkel, J.H.; Miettinen, K. Multi-scenario multi-objective robust optimization under deep uncertainty: A posteriori approach. Environ. Model. Softw. 2021, 144, 105134. [Google Scholar] [CrossRef]
  94. Schöbel, A.; Zhou-Kangas, Y. The price of multiobjective robustness: Analyzing solution sets to uncertain multiobjective problems. Eur. J. Oper. Res. 2021, 291, 782–793. [Google Scholar] [CrossRef]
  95. Martínez-Peñaloza, M.-G.; Mezura-Montes, E.; Morales-Reyes, A.; Aguirre, H.E. Distance-based immune generalised differential evolution algorithm for dynamic multi-objective optimisation. Int. J. Bio-Inspired Comput. 2021, 18, 69–81. [Google Scholar] [CrossRef]
  96. Stackhouse, P., Jr.; Eckman, R.; Zhang, T.; Mikovitz, J.; Whitlock, C.; Chandler, W.; Hoell, J.; Leng, G.; Lilienthal, P. Supporting energy-related societal applications using NASAs satellite and modeling data. In Proceedings of the 2006 IEEE International Symposium on Geoscience and Remote Sensing, Denver, CO, USA, 31 July–4 August 2006; pp. 425–428. [Google Scholar]
  97. Boussetta, M.; Bachtiri, R.E.; Khanfara, M.; Hammoumi, K. El Assessing the potential of hybrid PV—Wind systems to cover public facilities loads under different Moroccan climate conditions. Sustain. Energy Technol. Assess. 2020, 22, 74–82. [Google Scholar] [CrossRef]
  98. Elshurafa, A.M.; Muhsen, A.R.; Felder, F.A. Cost, footprint, and reliability implications of deploying hydrogen in off-grid electric vehicle charging stations: A GIS-assisted study for Riyadh, Saudi Arabia. Int. J. Hydrogen Energy 2022, 47, 32641–32654. [Google Scholar] [CrossRef]
  99. Li, C.; Shan, Y.; Zhang, L.; Zhang, L.; Fu, R. Techno-economic evaluation of electric vehicle charging stations based on hybrid renewable energy in China. Energy Strateg. Rev. 2022, 41, 100850. [Google Scholar] [CrossRef]
  100. Praveenkumar, S.; Agyekum, E.B.; Ampah, J.D.; Afrane, S.; Velkin, V.I.; Mehmood, U.; Awosusi, A.A. Techno-economic optimization of PV system for hydrogen production and electric vehicle charging stations under five different climatic conditions in India. Int. J. Hydrogen Energy 2022, 47, 38087–38105. [Google Scholar] [CrossRef]
  101. Syed Mohammed, A.; Lodhi, A.S.; Murtaza, Q. Techno-economic feasibility of hydrogen based electric vehicle charging station: A case study. Int. J. Energy Res. 2022, 46, 14145–14160. [Google Scholar] [CrossRef]
Figure 1. Framework of the adopted research methodology.
Mathematics 11 01741 g001
Figure 2. A schematic diagram of the proposed system.
Mathematics 11 01741 g002
Figure 3. Number of EV visits per day.
Mathematics 11 01741 g003
Figure 4. The daily load profile of the EV charging station.
Mathematics 11 01741 g004
Figure 5. Flowchart of the proposed hybrid EMS.
Mathematics 11 01741 g005
Figure 6. The annual average global irradiance of the selected case study.
Mathematics 11 01741 g006
Figure 7. The annual average wind speed of the selected case study.
Mathematics 11 01741 g007
Figure 8. The Pareto front of TNPC vs. LPSP for the suggested four optimization algorithms.
Mathematics 11 01741 g008aMathematics 11 01741 g008bMathematics 11 01741 g008c
Figure 9. The performance indicators for the four proposed algorithms.
Mathematics 11 01741 g009
Figure 10. The Discounted Cash Flows of the optimum system.
Mathematics 11 01741 g010
Figure 11. The monthly average energy production from the PV and WT systems.
Mathematics 11 01741 g011
Figure 12. The monthly average battery state of charge (SOC) for the optimum system.
Mathematics 11 01741 g012
Figure 13. The performance evaluation of the proposed system on (a) summer and (b) winter day.
Mathematics 11 01741 g013
Figure 14. Effect of Lithium-Ion Cost on TNPC of the proposed system.
Mathematics 11 01741 g014
Figure 15. Effect of PV system Cost on TNPC of the proposed system.
Mathematics 11 01741 g015
Figure 16. Effect of Wind Turbine Cost on TNPC of the proposed system.
Mathematics 11 01741 g016
Table 1. Electronic Vehicle Characteristics Summary [63,64].
ModelBattery Capacity (kWh)Charging Time (min)Proportion of EV Population (%)Type of ChargingBattery Technology
Volkswagen e-Golf364030Fast ChargeLithium-ion
Mercedes EQA 250673030
Fiat 500e Hatchback242510
BMW i3434030
Table 2. Key Parameters in Adopted Algorithms.
1. MOPSO
population size100
Stopping criteria (Max. iteration)200
Inertia Weight0.85
Inertia Weight Damping Rate0.90
Personal Learning Coefficient1.8
Global Learning Coefficient2
Leader Selection Pressure2
Deletion Selection Pressure2
Mutation Rate0.10
2. NSGA-II3. NSGA-III
population size100
Stopping criteria (Max. iteration)200
Crossover Percentage0.70
Number of Parents (Off springs)70
Mutation Percentage0.40
Number of Mutants40
Mutation Rate0.02
4. MOEA/D
population size100
Stopping criteria (Max. iteration)200
Number of Neighbors30
Crossover Percentage0.50
Table 3. Techno-economic characteristics of the system components.
ItemParameterValueUnit
Generic flat plate PV [73]capacity1kW
IC1187USD
RC1187USD
O&M5USD/year
lifetime25years
Wind turbine (WES 18) [97]capacity80kW
IC84,000USD
RC52,080USD
O&M400USD/year
lifetime20years
Lithium Ion (Blue Ion 2.0) [73]Nominal capacity16.8kW
IC15,000USD
RC13,800USD
O&M1.0USD/year
lifetime25years
Discount rate3(%)
Inflation rate2.15(%)
Project lifetime25years
Table 4. Comparing the Pareto-Optimal Systems Obtained from MOOAs with HOMER.
PV (Kw)WT (units)Battery (units)LPSP (%)LCOE
(USD/kWh)
TNPC (USD)
MOEA-D223171.210.2521564,846
MOPSO224190.870.2654596,662
NSGA-III2081110.760.2673601,519
NSGA-II171290.830.2861643,510
HOMER2221220.000.319724,004
Table 5. LCOE Comparison between Proposed PVWB/EVCS System and Previous Studies.
LCOE (USD/kWh)Source
0.2521proposed PVWB/EVCS system
0.4381 and 0.4417[56]
0.349, 0.360 and 0.370[98]
0.292[99]
ranges between 0.285 to USD 0.329[55]
ranges between 0.41 and 0.48[100]
0.264[101]
Disclaimer/Publisher’s Note: The statements, opinions and data contained in all publications are solely those of the individual author(s) and contributor(s) and not of MDPI and/or the editor(s). MDPI and/or the editor(s) disclaim responsibility for any injury to people or property resulting from any ideas, methods, instructions or products referred to in the content.

