Article

Universities as an External Knowledge Source for Industry: Investigating the Antecedents’ Impact on the Importance Perception of Their Collaboration in Open Innovation Using an Ordinal Regression-Neural Network Approach

Faculty of Management and Technological Engineering, University of Oradea, 410087 Oradea, Romania
*
Author to whom correspondence should be addressed.
Mathematics 2023, 11(7), 1671; https://doi.org/10.3390/math11071671
Submission received: 16 January 2023 / Revised: 12 March 2023 / Accepted: 28 March 2023 / Published: 30 March 2023

Abstract

:
Within the highly complex ecosystem of industry-university collaboration in open innovation, three specific antecedents typically characterize the patterns of their interaction, i.e., motivations, barriers, and channels of knowledge transfer. However, an investigation of the extent to which these antecedents of opening up innovation impact the perceived importance of universities as an external knowledge source to the industry is still missing in the literature. Based on a research framework developed from a review of the literature, a two-stage ordinal regression, and neural network approach was performed to investigate this impact. In the first stage, the hypotheses of the proposed research framework were tested based on an ordinal regression, and those antecedents that significantly impacted the importance perception were revealed. In the second stage, an artificial neural network analysis was carried out to capture the complex relationships among the significant antecedents and the important perception of universities as an external knowledge source to the industry. On the whole, the findings of our study expand the existing open innovation literature and contribute to a more articulate view of the collaboration between industry and university in this field by providing a first perspective on which of the three antecedents has a significant impact on this perception and how such an impact can be predicted.

1. Introduction

Nowadays, we operate in a dynamic and globalized economy where complexity increases, networks spread, and interdependencies expand [1]. In such an environment, generating innovation is seen as fundamental to sustaining the advantages that firms have to maintain to remain competitive [1]. At the same time, innovation has been considered knowledge-intensive [2], and relying entirely on internal knowledge may not be enough to succeed in the new landscape of complexity and connectivity. Therefore, firms have to employ external knowledge from diverse sources to support development and innovation [3,4,5,6]. Emphasizing the importance of interaction with other actors to innovate, the concept of open innovation that was introduced at the beginning of this century by Chesbrough [7] has attracted increasing attention in both academic research and industrial practice, reflecting the changes of recent years in terms of technological, organizational, and societal developments [8]. Following the open innovation paradigm [7], a firm’s ability to employ external sources of knowledge becomes of great importance for innovation generation in the context of the turbulent and rapidly changing environment of our times, which requires continuous adaptations and reconfiguration of competencies [9].
The industry receives ideas, knowledge, and technologies from diverse external sources, which have been differently classified in the literature [10,11,12]. Distinctions have often been drawn between industrial and knowledge sources: competitors, suppliers, and clients are included in the first category, while universities, public research centers, research laboratories, and consulting firms are considered in the second one [10,12]. Among these partners, universities have been recognized as a special external knowledge source [13], since they are major providers of new knowledge and technologies [14].
Like any other strategic initiative, opening up boundaries to innovation with universities is related to different antecedents that firms have to deal with [15]. According to the extant literature, e.g., [16], three specific dimensions are commonly employed to capture the patterns of interaction between industry and university collaboration. They are as follows: why to engage in collaboration, that is, the motivations; what inhibits collaboration, that is, the barriers; and how to collaborate, that is, the channels of knowledge transfer. However, limited research on such antecedents is available in open innovation, with only a few recent studies addressing these antecedents in an integrative manner rather than independently [17,18]. Despite these advances that have been recently achieved related to university-industry collaboration in open innovation, a comprehensive investigation of the antecedents’ association with the perceived importance of their collaboration in such a context is still missing. Within this framework, we aim to explore the degree to which these three major antecedents influence the importance perception of collaboration between the two actor organizations in open innovation. For this purpose, we define the following research questions to guide our study:
RQ1. Given motivations, barriers, and channels of collaboration as major antecedents, which of them significantly impact the perception of universities as an external knowledge source for open innovation activities?
RQ2. How can this impact be predicted?
To answer these questions, we developed a conceptual framework to explore this impact. An exploratory approach was employed using the proposed research framework to collect and then investigate the empirical data based on a two-stage ordinal regression and artificial neural network (ANN) analysis. While ordinal regression can be easily interpreted and used in hypothesis testing, it has less capability to capture the diverse and non-linear relationships among the variables of highly complex phenomena, such as open innovation. An ANN approach is recommended in the literature to overcome this challenge [19] since it does not require a priori specification of the input-output relationships. With no prior assumptions, ANN is also an appropriate choice for explorative studies that look for insights beyond what traditional methods (e.g., ordinal regression) can provide [20]. Although ANN has been used to handle different problems in many fields [19,20,21,22,23,24,25], its employment in industry-university collaboration is still scarce [26]. Nevertheless, the existing studies argue that an ANN approach may be appropriate to model the complexity of innovation as it was found to have good results in modeling its dynamic and nonlinear nature [27,28]. Moreover, recent studies [20,29] have emphasized the advantages of integrating statistical (i.e., ordinal regression) and ANN models when compared to a single-step traditional statistical or predictive ANN analysis. Accordingly, a two-stage ordinal regression and neural network approach may lead to better modeling and prediction performance. Therefore, incorporating the results of ordinal regression into the ANN approach for a jointly explanatory and predictive analysis can offer a perspective that enables a more in-depth understanding of the key antecedents and their impact on the perception of universities as an external knowledge source to the industry in open innovation. As a result, answers to the two research questions of this study are provided.
The remainder of our article is structured as follows: First, we provide a research background and conceptual framework section, which also illustrates the hypotheses of this study. Next, we describe the research approach that includes the setting of our study, the constructs of the developed framework, and their measurement. After that, we present the mathematical modeling of the two-stage ordinal regression and neural network approach. Then, we analyze the data and report the results of our study. Finally, we discuss the findings of our research, conclude the final remarks, present the limitations of the study, and make suggestions for future research.

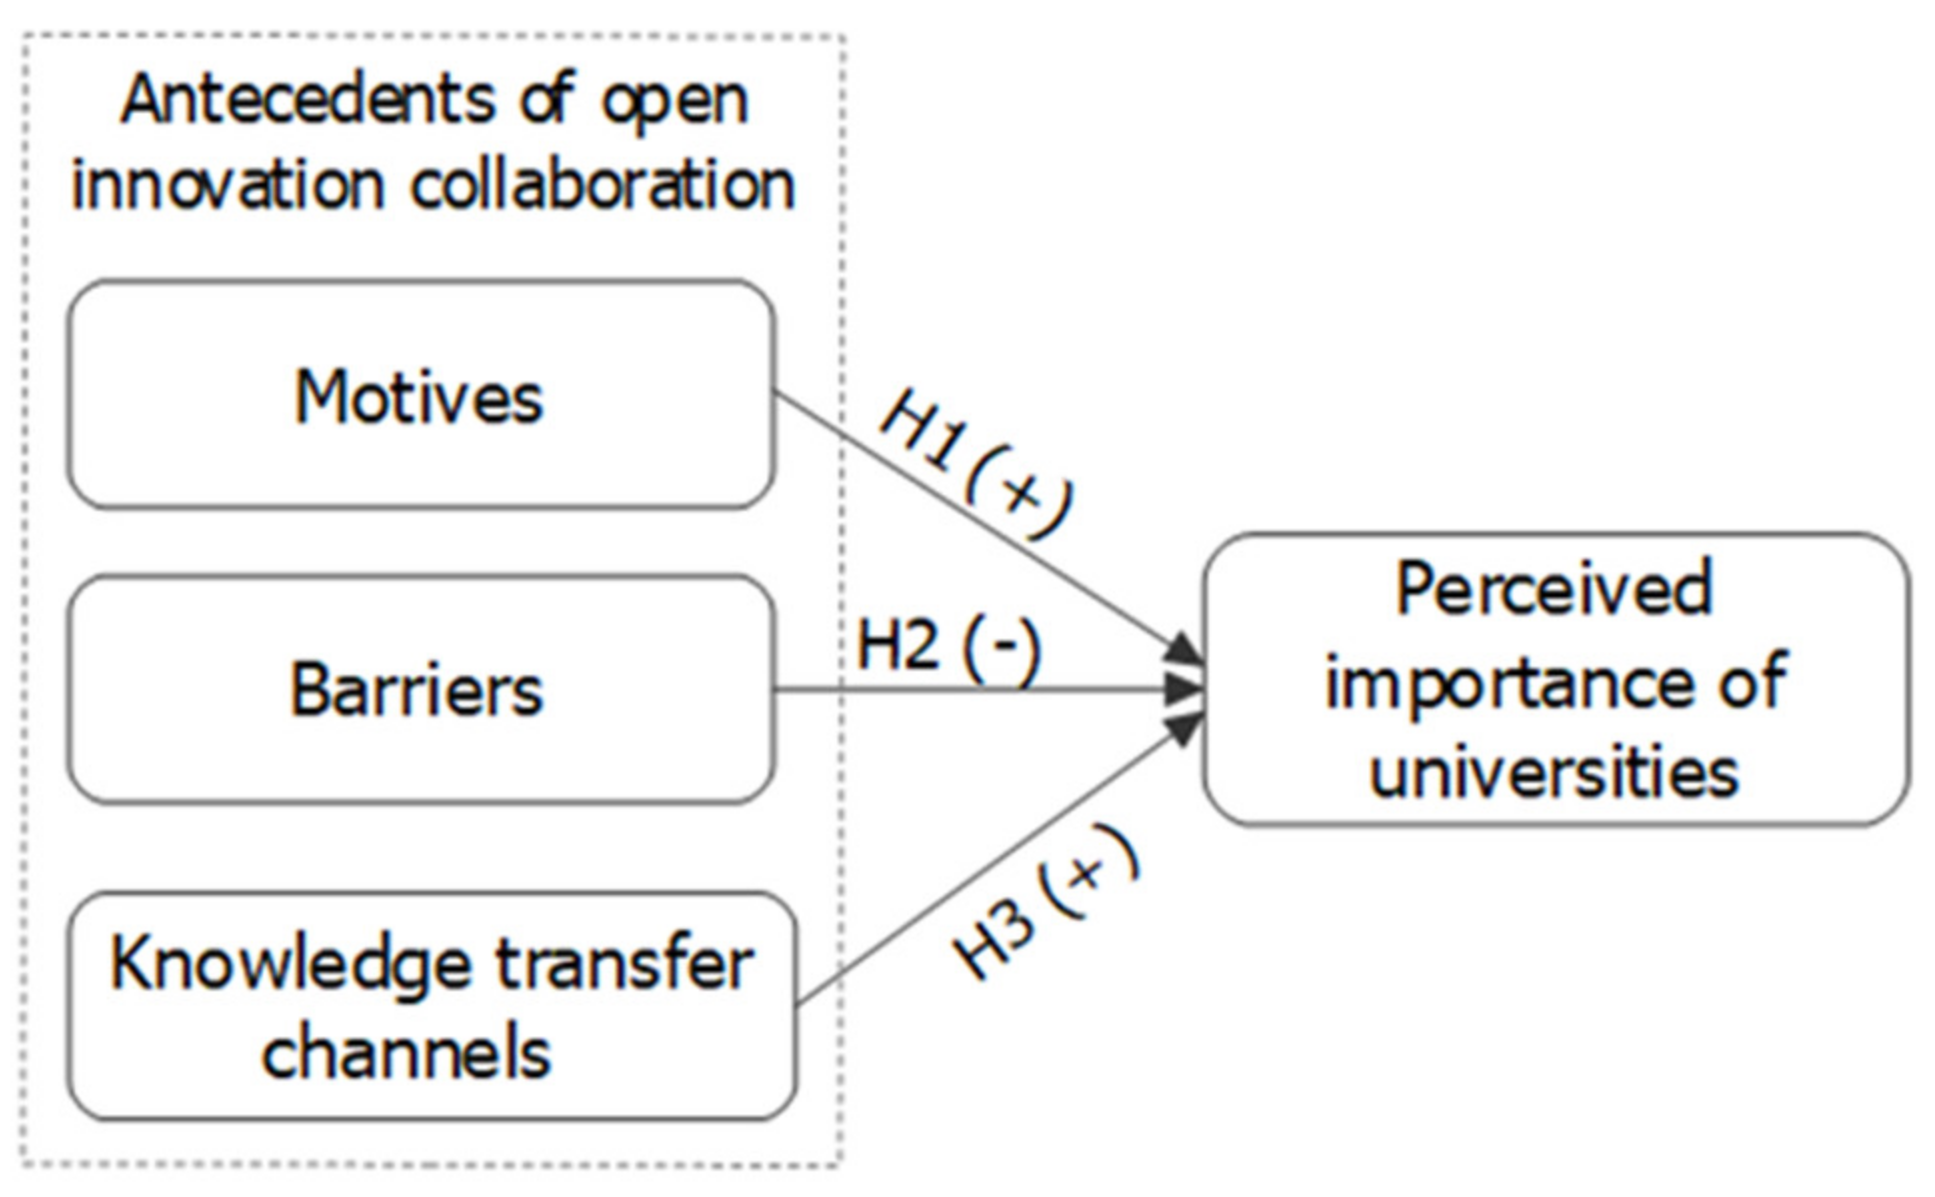
2. Research Background and Conceptual Framework

The ability to capture and exploit external knowledge has been long seen as of great importance in the development of innovative capabilities [30]. A number of current models, such as the Triple Helix [31] and its extension to the Fourth Helix and beyond [32], have already stressed the effect of firms’ collaboration with heterogeneous and diverse actors on innovation [33]. According to these models, other organizations (i.e., public entities, industry associations, civil society, and the natural environment of society) are often important connectors between universities and industries. This may be beneficial to their collaboration since it can stimulate knowledge production, innovation generation, and synergy between the involved stakeholders [31]. In this way, firms are expected to benefit more from external collaboration in their innovation activities. Among such external knowledge sources, universities are particularly large repositories of generic and more important new scientific knowledge (i.e., ideas, knowledge, or technologies developed by universities [34]), which can be used by firms to develop novel products and services [35]. Considering the heterogeneity of this knowledge as well as that of the partners, knowledge and technology transfer between industry and universities is expected to accelerate innovation [36].
There have been numerous studies looking into how firms access the scientific knowledge of universities and collaborate with them in the innovation process [37,38,39]. These studies underline that firms are constantly looking to integrate such scientific knowledge provided by university actors into their innovation funnel and to develop new ways to innovate. Moreover, models such as the quadruple helix have emphasized the flow of knowledge into all spheres of society [40], pointing to more open models of innovation processes among the collaborating partners [41]. At the same time, science is becoming more and more open [42,43,44], which has led to a large amount of scientific knowledge in almost any scientific area [42]. As academics generate and disseminate both explicit and tacit knowledge through their activities, easy access to the abundant scientific knowledge of universities is relatively high [45]. However, the nature of their knowledge tends to be more fundamental than specifically oriented (often referred to as “basic knowledge” and “applied knowledge”, respectively), as academics are more likely to generalize their findings than to create more particular and specialized ones [45].
In this context, open innovation between industry and universities becomes especially important in accessing those knowledge resources that firms cannot produce, for different reasons, internally. In such an approach, firms are considered the central agents [46], which have to combine the inflows and outflows of knowledge using pecuniary and non-pecuniary mechanisms to deal with the greater complexity of innovation and improve their innovation efforts [47]. Although industry has employed external knowledge sources to improve its innovation potential for decades, open innovation has become so attractive because it gathers into a single concept a collection of already existing activities and offers many opportunities for extension and development [48], including in its collaboration with universities. As a result, firms are increasingly adopting open innovation with universities to enhance their innovation processes, which is expected to contribute to better performance and a competitive advantage [49,50,51]. Indeed, the knowledge inflow from collaboration with universities usually has a positive influence on the involved firms [52], which can be highlighted in terms of both pecuniary and non-pecuniary benefits [53]. However, opening up the innovation to universities gives rise to some challenges that may be addressed in the same logic of pecuniary versus non-pecuniary proposed by Dahlander and Gann [53].
Within the highly complex and sophisticated ecosystem of industry-university collaboration [54], a number of determinants that describe the process are presented and analyzed in the literature. Nevertheless, three specific dimensions typically characterize the patterns of their interaction. They are motivations, barriers, and channels of knowledge transfer [16], which can be seen as major antecedents of the collaboration between firms and universities in open innovation. Their impact in such a context is thus reviewed next.
Regarding the first antecedent, motivation is less explored in the extant literature, although firms may engage in open innovation with universities for many different reasons [55,56]. The results of a study conducted by Lam et al. [50] in the Hong Kong environmental industry showed the integration of complex technologies and the development of new innovative products for increasingly demanding customers as among the most important drivers of industry-university collaboration in open innovation. An analysis of several motivation factors between automotive companies within a consortium and two universities in open innovation carried out by Lopes et al. [57] listed the development and sharing of knowledge to reduce the time to innovation, as well as the developing and sharing of technology, at the top of the list of the motives’ importance. Based on an extensive review of the extant literature, Baban and Baban [58] synthesized the motives of open innovation between industry and university and distinguished ten main components. The existing studies reveal the positive influence of motives in the automotive industry to achieve better competitiveness and success through open innovation [50,55].
Concerning the second antecedent, different challenges that industry is facing in its collaboration with universities in open innovation have been scrutinized in the extant literature, and various barriers have been identified by these studies. Lam et al. [50] found the unavailability of external partners capable of providing the necessary scientific knowledge and the possibility of disclosure of their intellectual property to these partners as the main barriers to collaboration between the two actor organizations. Differences in the orientation of research between industry and university (short-term applied research vs. long-term fundamental research) and the lack of adequate internal resources (particularly for small and medium enterprises) were identified as among the main barriers by Saguy and Sirotinskaya [59]. In the view of Galati et al., finding the best scientific partner that can solve technical or technological problems was seen as the main challenge [60]. Using a Delphi approach, Quiñones et al. [61] extracted the relevant barriers to university technology transfer and, through a case study, pointed out conflicting objectives between research and commercialization of the transfer results as the barrier most influenced by the other barriers. At the same time, they found the high costs of managing joint research projects and administrative bureaucracy as the barriers that impacted the other ones the most. Baban and Baban [58] also identified such barriers considering the extant literature and differentiated them into a list of fourteen main elements. There is also a commonly accepted negative meaning of the barriers [62], as they impede the adoption of open innovation between industry and university.
With regard to the third antecedent, the existing studies suggested that during industry-university collaboration in open innovation, scientific knowledge flows through diverse channels that can be characterized in different ways. Considering their dominant mode of governance, Alexander et al. [41] characterized each channel in terms of relational (informal) or transactional (formal) engagement. They hypothesized that the first style of engagement is more achieved through channels that stimulate open innovation, while the last one is more related to the closed cycle of innovation. Their opinion is in agreement with the prior work of Villasalero [14], which described the scientific knowledge transfer channels based on a continuum between revealing and selling strategies. After reviewing the extant literature, Baban and Baban [58] synthesized the existing connection between industry and university into twelve channels of scientific knowledge transfer, considering both types of strategies. According to Costa et al. [63], promoting multiple channels of collaboration rather than a single one may be more effective. However, maintaining a large number of channels may also be detrimental since it requires adequate resources, the right timing, and special attention [64]. Even so, the connections with the university support firms to achieve and sustain innovation and play an important role in shaping their performance [63].
In light of these considerations, we may conclude that the antecedents of opening up innovation between firms and universities have been studied rather independently than all together. Moreover, an investigation of the extent to which these antecedents influence the perceived importance of universities as an external knowledge source for industry is still lacking. In order to address this research gap and considering the above-presented argumentation regarding the influence of the three antecedents, we propose the research framework illustrated in Figure 1 and formulate the following expectations about the first research question of our study:
H1. 
The motives of collaboration have a positive and significant impact on the perception of the importance of universities as an external knowledge source to industry in open innovation.
H2. 
The barriers to collaboration have a negative and significant impact on the perception of universities as an important external knowledge source for industry in open innovation.
H3. 
The knowledge transfer channels of collaboration are more likely to have a positive and significant impact on the perception of universities as an external knowledge source to industry in open innovation.
Figure 1. The research framework.
Mathematics 11 01671 g001

3. Study Setting and Data Collection

There has been very little theoretical or empirical evidence related to the framework presented in Figure 1. One notable exception is the work [17], in which an integrative approach was employed to explore the impact of the three analyzed antecedents on the outcome of collaboration, its findings revealing their influence on both the benefits and drawbacks of collaboration between firms and universities in open innovation. Therefore, we employed an exploratory approach to address the research hypotheses of this study. For this purpose, our data source was represented by companies from industrial areas since firms from such agglomerations are not only contributing to increased economic growth and regional development [65], but are increasingly becoming more open to global competition and have to face both its opportunities and threats [66]. Moreover, collaborating with qualified local actors, such as universities, has been found to be among the most important drivers of their innovation activities [66]. Taking into account the great extent of the Italian experience in the field of business agglomeration and the continuous efforts of Romania to develop its industrial sectors based on agglomeration concepts, two industrial Italian and Romanian areas were employed for data collection. The first one is the Valenza Industrial District, which is seen as one of the most important components of the so-called ‘Made in Italy’ sectors, while the other is represented by one of the most successful stories in increasing competitiveness through the implementation of industrial parks in the Romanian economy, i.e., the Oradea Industrial Parks [67]. Although most of these firms compete in a world-class manufacturing environment, those from the Valenza Industrial District and Oradea Industrial Parks belong to low-tech and medium-to-high-tech industries, respectively. Moreover, most of the firms from the Valenza Industrial District are small enterprises, while those from industrial parks are medium-sized and large enterprises.
We exploit data from a self-administered survey conducted among companies located within the two industrial areas. Among other dimensions, the survey addressed each of the four components of the research framework depicted in Figure 1, using a scale from 1 (‘not important’) to 5 (‘very important’) for all of their items [18].
One of the main concerns regarding open innovation is related to the paradox of openness [68], which manifests because the development of innovation is often based on openness, while capturing its returns may demand protection and security. Therefore, it can be difficult to find adequate respondents as firms tend to protect innovation against imitation. Moreover, information about such people is not publicly available, so we followed a purposive sampling method to select these respondents. Since our study was an explorative one, the recommended sample size should be 100 or larger [69]. The considered sampling criteria included: (1) participants who were in charge of the innovation activities/owners of those firms that cooperate with universities and who agreed to respond to the survey questions; (2) respondents should come from different industries and firm sizes to cover as much diversity as possible. Prospective candidates were identified through a prescreening process, and in the end, we received 100 questionnaires, of which two were removed based on questionable responses. Therefore, a total of 98 questionnaires remained for the analysis. Table 1 summarizes the sample details. For internal consistency reliability, we found that Cronbach’s alphas for the OiM.Motives and OiC.Channels were 0.913 and 0.931, respectively, which represent high internal consistency [69]. Meanwhile, for the OiB.Barriers, the Cronbach’s alpha was 0.805, which indicates a good level of the internal consistency reliability of this antecedent.

4. Research Approach

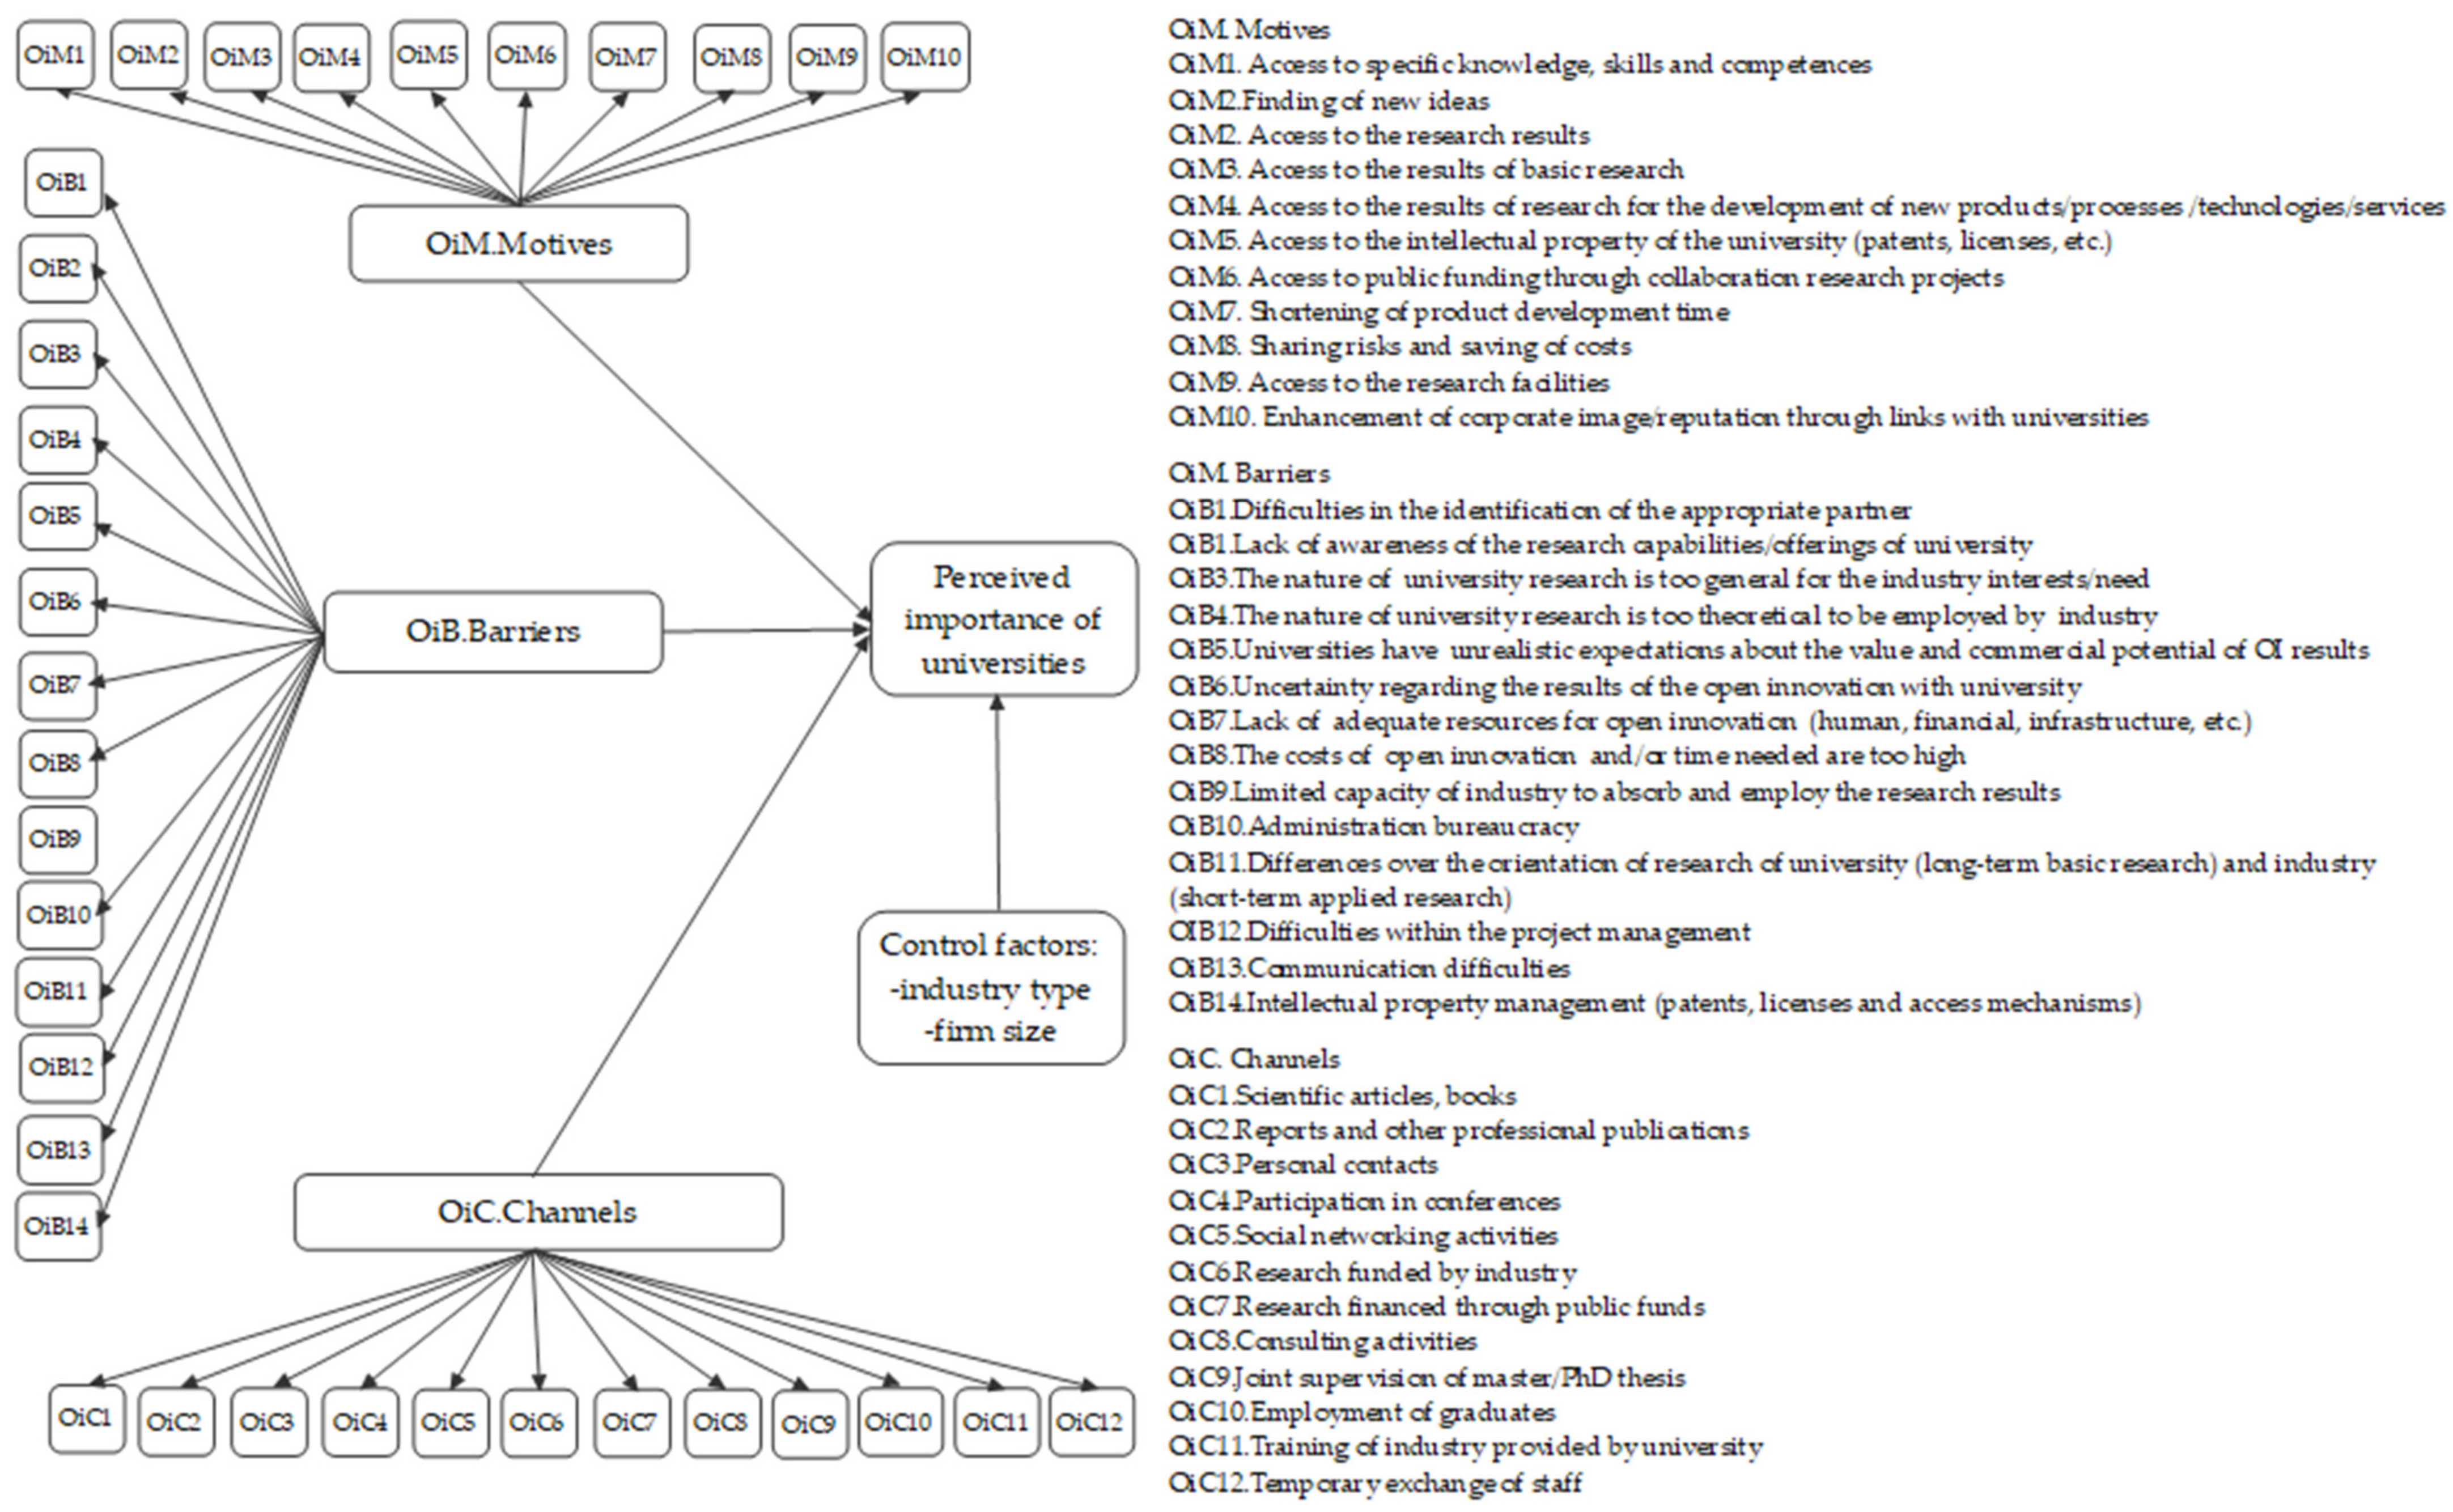
4.1. Research Framework Constructs and Their Measurement

In line with the above-mentioned considerations, Figure 2 details the constituents of the proposed research framework and the measures behind each construct. The dependent variable y is represented by the perceived importance of universities as an external knowledge source for industry in open innovation. The OiM, OiB, and OiC antecedents were used to define the explanatory variables of our study, with all their items adapted from the extensive survey of Baban and Baban [58]. For this purpose, we introduce three new variables, following the approach proposed in Laursen and Salter [64] and Leiponen and Helfat [70].
The first new explanatory variable is named x1 and is constructed for any response i ( i = 1 ,   98 ¯ ) of the survey as a combination of the 10 items of the motives OiMj ( j = 1 ,   10 ¯ ) presented in Figure 2. Each of these 10 items is coded as 0 if the motive is not important, of little importance, or somewhat important (i.e., 1/2/3), and 1 if it is important or very important (i.e., 4/5). Then, the 10 items are added up so that the expression of x1 for the ith response is given as:
x 1 i = j = 1 10 Oi M ji , i = 1 ,   98 ¯
with Oi M ji = 1 , if the jth motive of the ith response received a value of 4 or 5 0 , if the jth motive of the ith response received a value of 1 , 2 or 3
Therefore, each x1i ( i = 1 ,   98 ¯ ) gets a minimum and maximum value of 0 and 10, respectively. In this way, we assumed that the more important the motives for collaboration are, the stronger the influence they will have on the perception of universities as an external knowledge source for open innovation. Although the x1 variable is a relatively simple construct, its Cronbach’s alpha coefficient is equal to 0.882, which represents a relatively high internal consistency [69].
The second new explanatory variable is termed x2 and is constructed in a similar way to the x1 variable, using the 14 items of the barriers OiBj ( j = 1 ,   14 ¯ ) shown in Figure 2. Thus, the expression of x2 for the ith response is defined as:
x 2 i = j = 1 14 O i B j i , i = 1 ,   98 ¯
with O i B j i = 1 , if the jth barrier of the ith response received a value of 4 or 5 0 , if the jth barrier of the ith response received a value of 1 , 2 or 3
As a result, the minimum and maximum values of each x2i ( i = 1 ,   98 ¯ ) will be 0 and 14, respectively. Thus, we assumed that the more important the barriers to collaboration are, the stronger their impact on the perception of universities as an external knowledge source for open innovation. Its internal consistency is also at a good level, as its Cronbach’s alpha coefficient is equal to 0.844 [69].
The third new explanatory variable is called x3 and is constructed similarly to the x1 and x2 variables, using the 12 items of the channels OiCj ( j = 1 ,   12 ¯ ) illustrated in Figure 2. Subsequently, the expression of x3 for the ith response is given as:
x 3 i = j = 1 12 O i C j i , i = 1 ,   98 ¯
with O i C j i = 1 , if the jth channel of the ith response received a value of 4 or 5 0 , if the jth channel of the ith response received a value of 1 , 2 or 3
In this way, each x3i ( i = 1 ,   98 ¯ ) will have a minimum value of 0 and a maximum of 12. Again, we assumed that the more important the channels for collaboration are, the stronger their influence on the perception of universities as an external knowledge source for open innovation. The internal consistency of the x3 variable is high since its Cronbach’s alpha coefficient is equal to 0.909 [69].
We also include two control variables commonly used in innovation studies, which are the size of the firm and industry type [71,72]. The first one is measured by the number of employees, while for the other one, we consider the Eurostat classification of different industries [73] (see the sample attributes in Table 1). We label the firm size and industry type as x4 and x5, respectively.

4.2. Setting up the Mathematical Modeling

Our dependent variable is a discrete and multinomial-choice response with a logical order. Therefore, an ordinal regression based on the cumulative link model [74] was proposed to infer the dependence of the response on the explanatory variables. While ordinal regression can be interpreted and statistically tested, it is not capable of performing well with any type of non-linear model and any data distribution [75]. At the same time, ANNs have a higher capability to learn any relationships between the dependent and explanatory variables through an iterative process based on the data pattern, and they are highly robust and tolerant against noise [76,77]. In this way, ANNs can use the information hidden in data, although they are not capable of extracting it [78]. However, ANNs are not suitable for explanation and hypothesis testing because of their “black box” algorithm, which makes it difficult to determine how the decision is taken by the ANNs [77].
In order to take advantage of the advantages provided by both ordinal regression and ANN and address their shortcomings, a two-stage approach was adopted in our research. In the first stage, we used ordinal regression to examine the proposed research model and hypotheses of the study. Next, the significant explanatory variables obtained from the hypotheses testing of the initial ordinal regression analysis were employed as the inputs for the second stage ANN analysis. In this way, the complex relationships among these explanatory and dependent variables can be further investigated. Figure 3 illustrates the connection between the two stages.

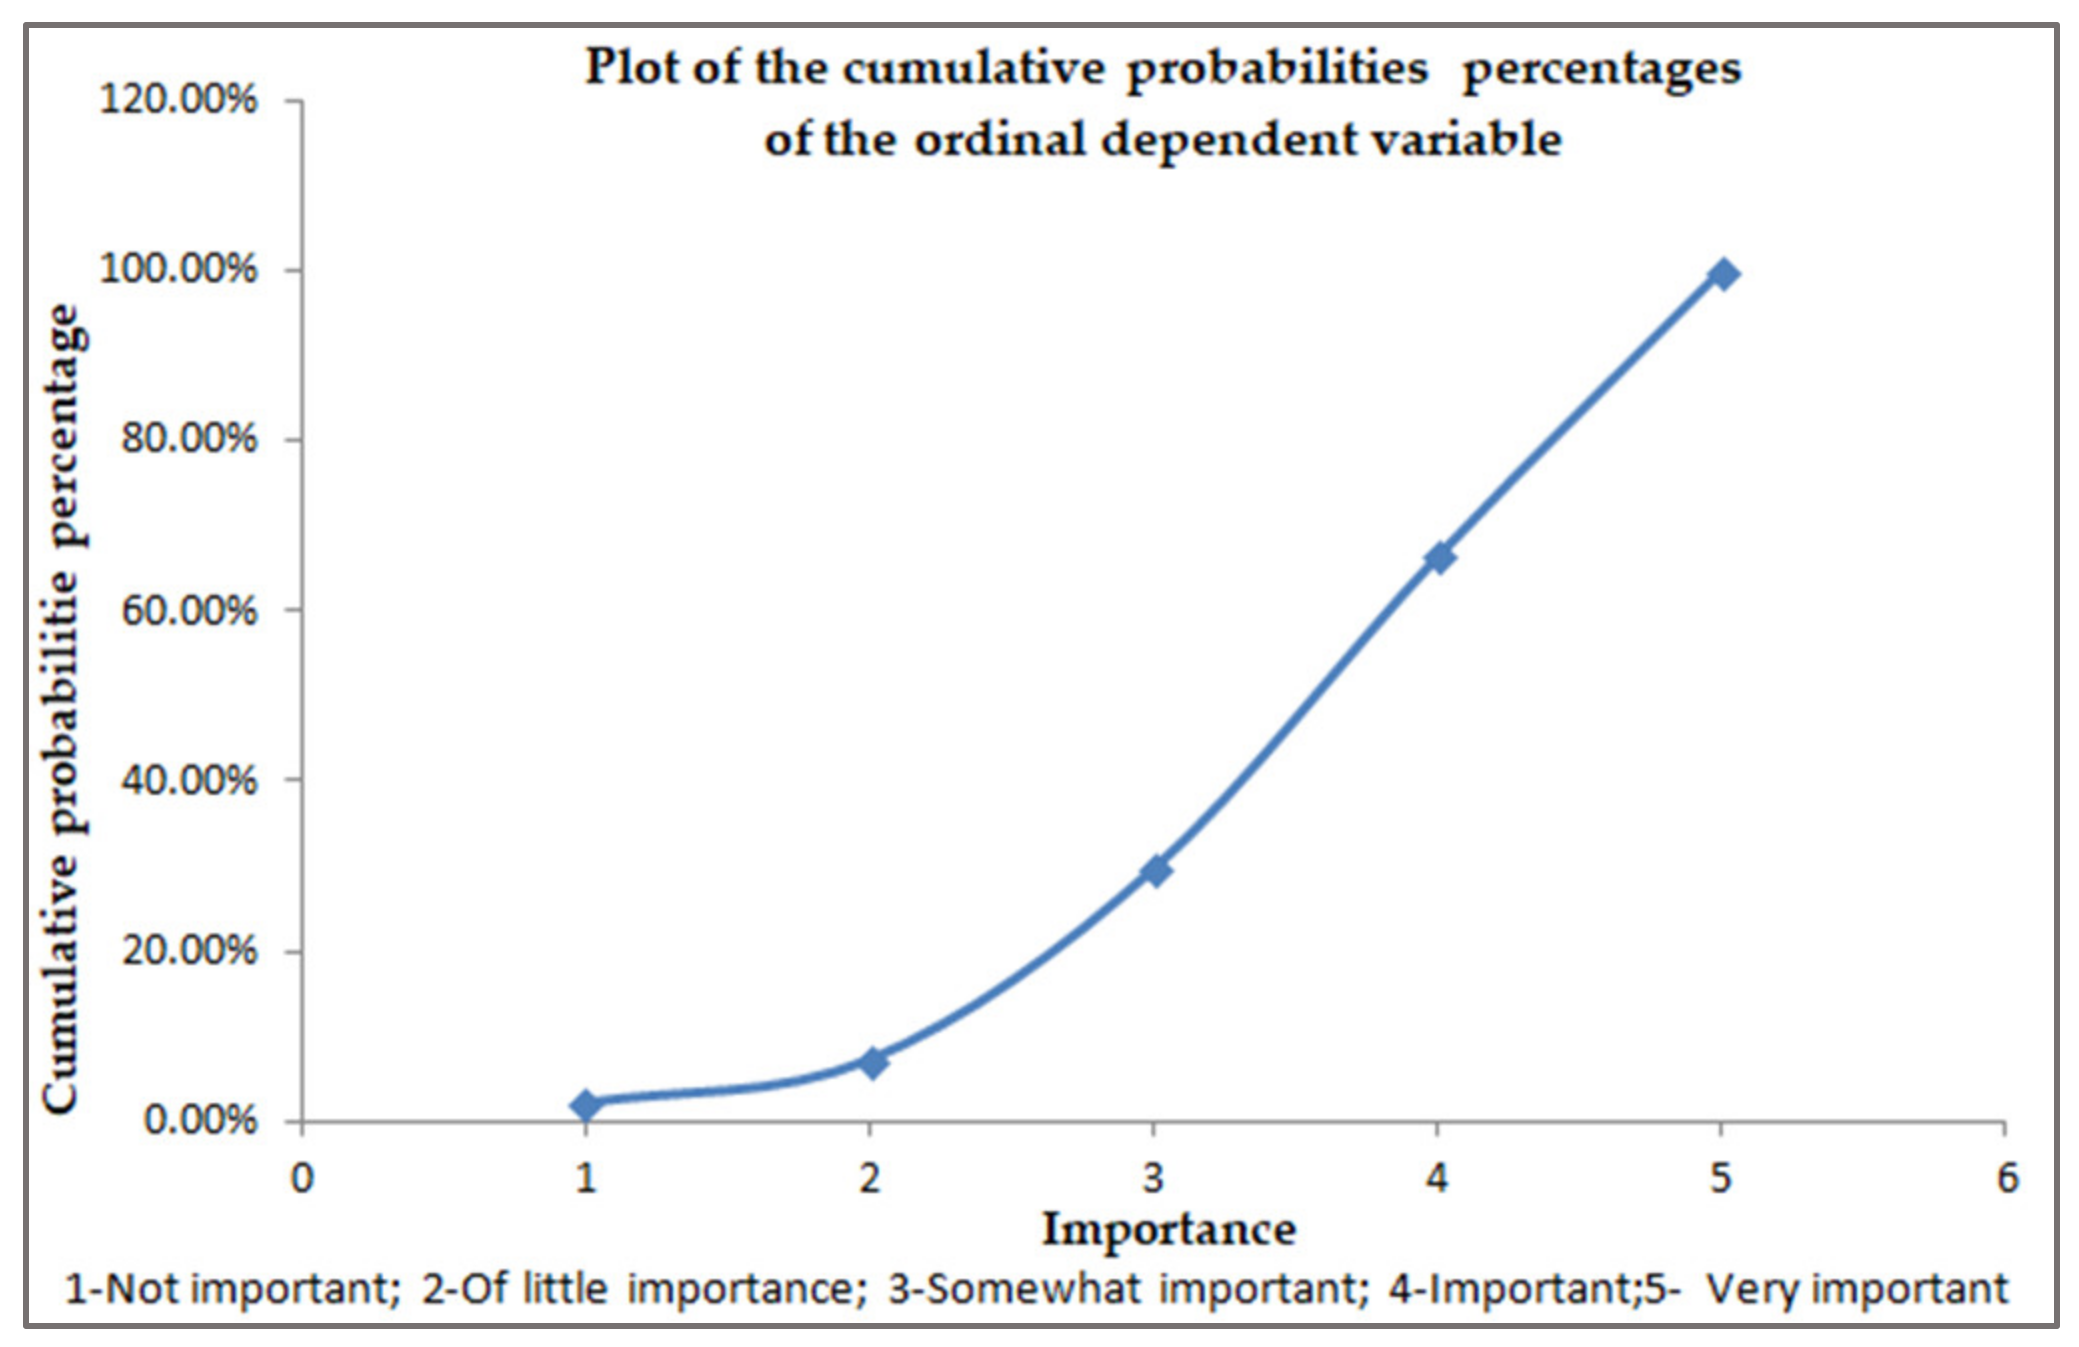
4.2.1. The Ordinal Regression Modeling

Suppose y { C 1 , C 2 , , C k } is the ordinal dependent variable with c 1 c 2 c k (where is an order relation between categories) and x = (x1, x2, …, xq) a set of q explanatory variables, x R q ( k = 1 ,   5 ¯ and q = 5 in our case). According to this model, the cumulative probabilities P ( y C j x ) can be estimated as follows [79]:
P ( y C j x ) = P ( y = C 1 x ) + P ( y = C 2 x ) + P ( y = C j x )
P ( y = C j x ) = P ( y C j x ) P ( y C j 1 x )
for j = 2 , k ¯ , and considering by definition that P ( y = C 1 x ) = P ( y C 1 x ) and   P ( y C k x ) = 1 .
Let P j = P ( y C j x ) be the cumulative probability of category j. The general model for ordinal regression can be written as follows ([74], p. 308):
L ( P j ) = θ j i = 1 q β i x i ,   j = 1 , k 1 ¯
where L (pj) is a link function that links the dependent variable y to the explanatory variables x, θj is the intercept of the regression equation or threshold for each Cj with θ 1 θ 2 θ k 1 , and β i , i = 1 , q ¯ are the regression coefficients. To implement the regression model (9), the unknown parameters θ j , j = 1 , k 1 ¯ and β i , i = 1 , q ¯ must be estimated from the sample data. The maximum likelihood estimation approach is usually employed for this purpose [74].
Different link functions L (pj) can be used in an ordinal regression model, depending on the distribution of the response variable values [74]. When the cumulative probabilities of the less important categories are lower and then rapidly approach 1 for the more important ones, the complementary log-log link function is recommended in the ordinal regression analysis [80]. This is our case (see Figure 4), and our model can be expressed as follows ([74], p. 308):
ln ( ln ( 1 p j ) ) = θ j i = 1 q β i x i
and
p j = P ( y C j x ) = 1 e e θ j i = 1 q β i x i
The probability P ( y = C j x ) of a category j can then be obtained from relations (8) and (11).
Figure 4. The cumulative probabilities percentages of the ordinal dependent variable.
Mathematics 11 01671 g004
The regression coefficients in the model (9) are generally more difficult to interpret, as an estimated coefficient βi represents the change in the link function for each unit change in the corresponding explanatory variable, holding the other regressors constant [81]. More generally, a positive/negative regression coefficient indicates that as the value of the explanatory variable increases/decreases, the probability of a higher category of the dependent variable increases/decreases, while the other regressors in the model are held constant [82]. Thus, the analysis should be focused on the sign and statistical significance of the regression coefficients, since the signs give the direction of the effect of the explanatory variables on the dependent variable, and their statistical significance can be used to test the hypotheses of the study.

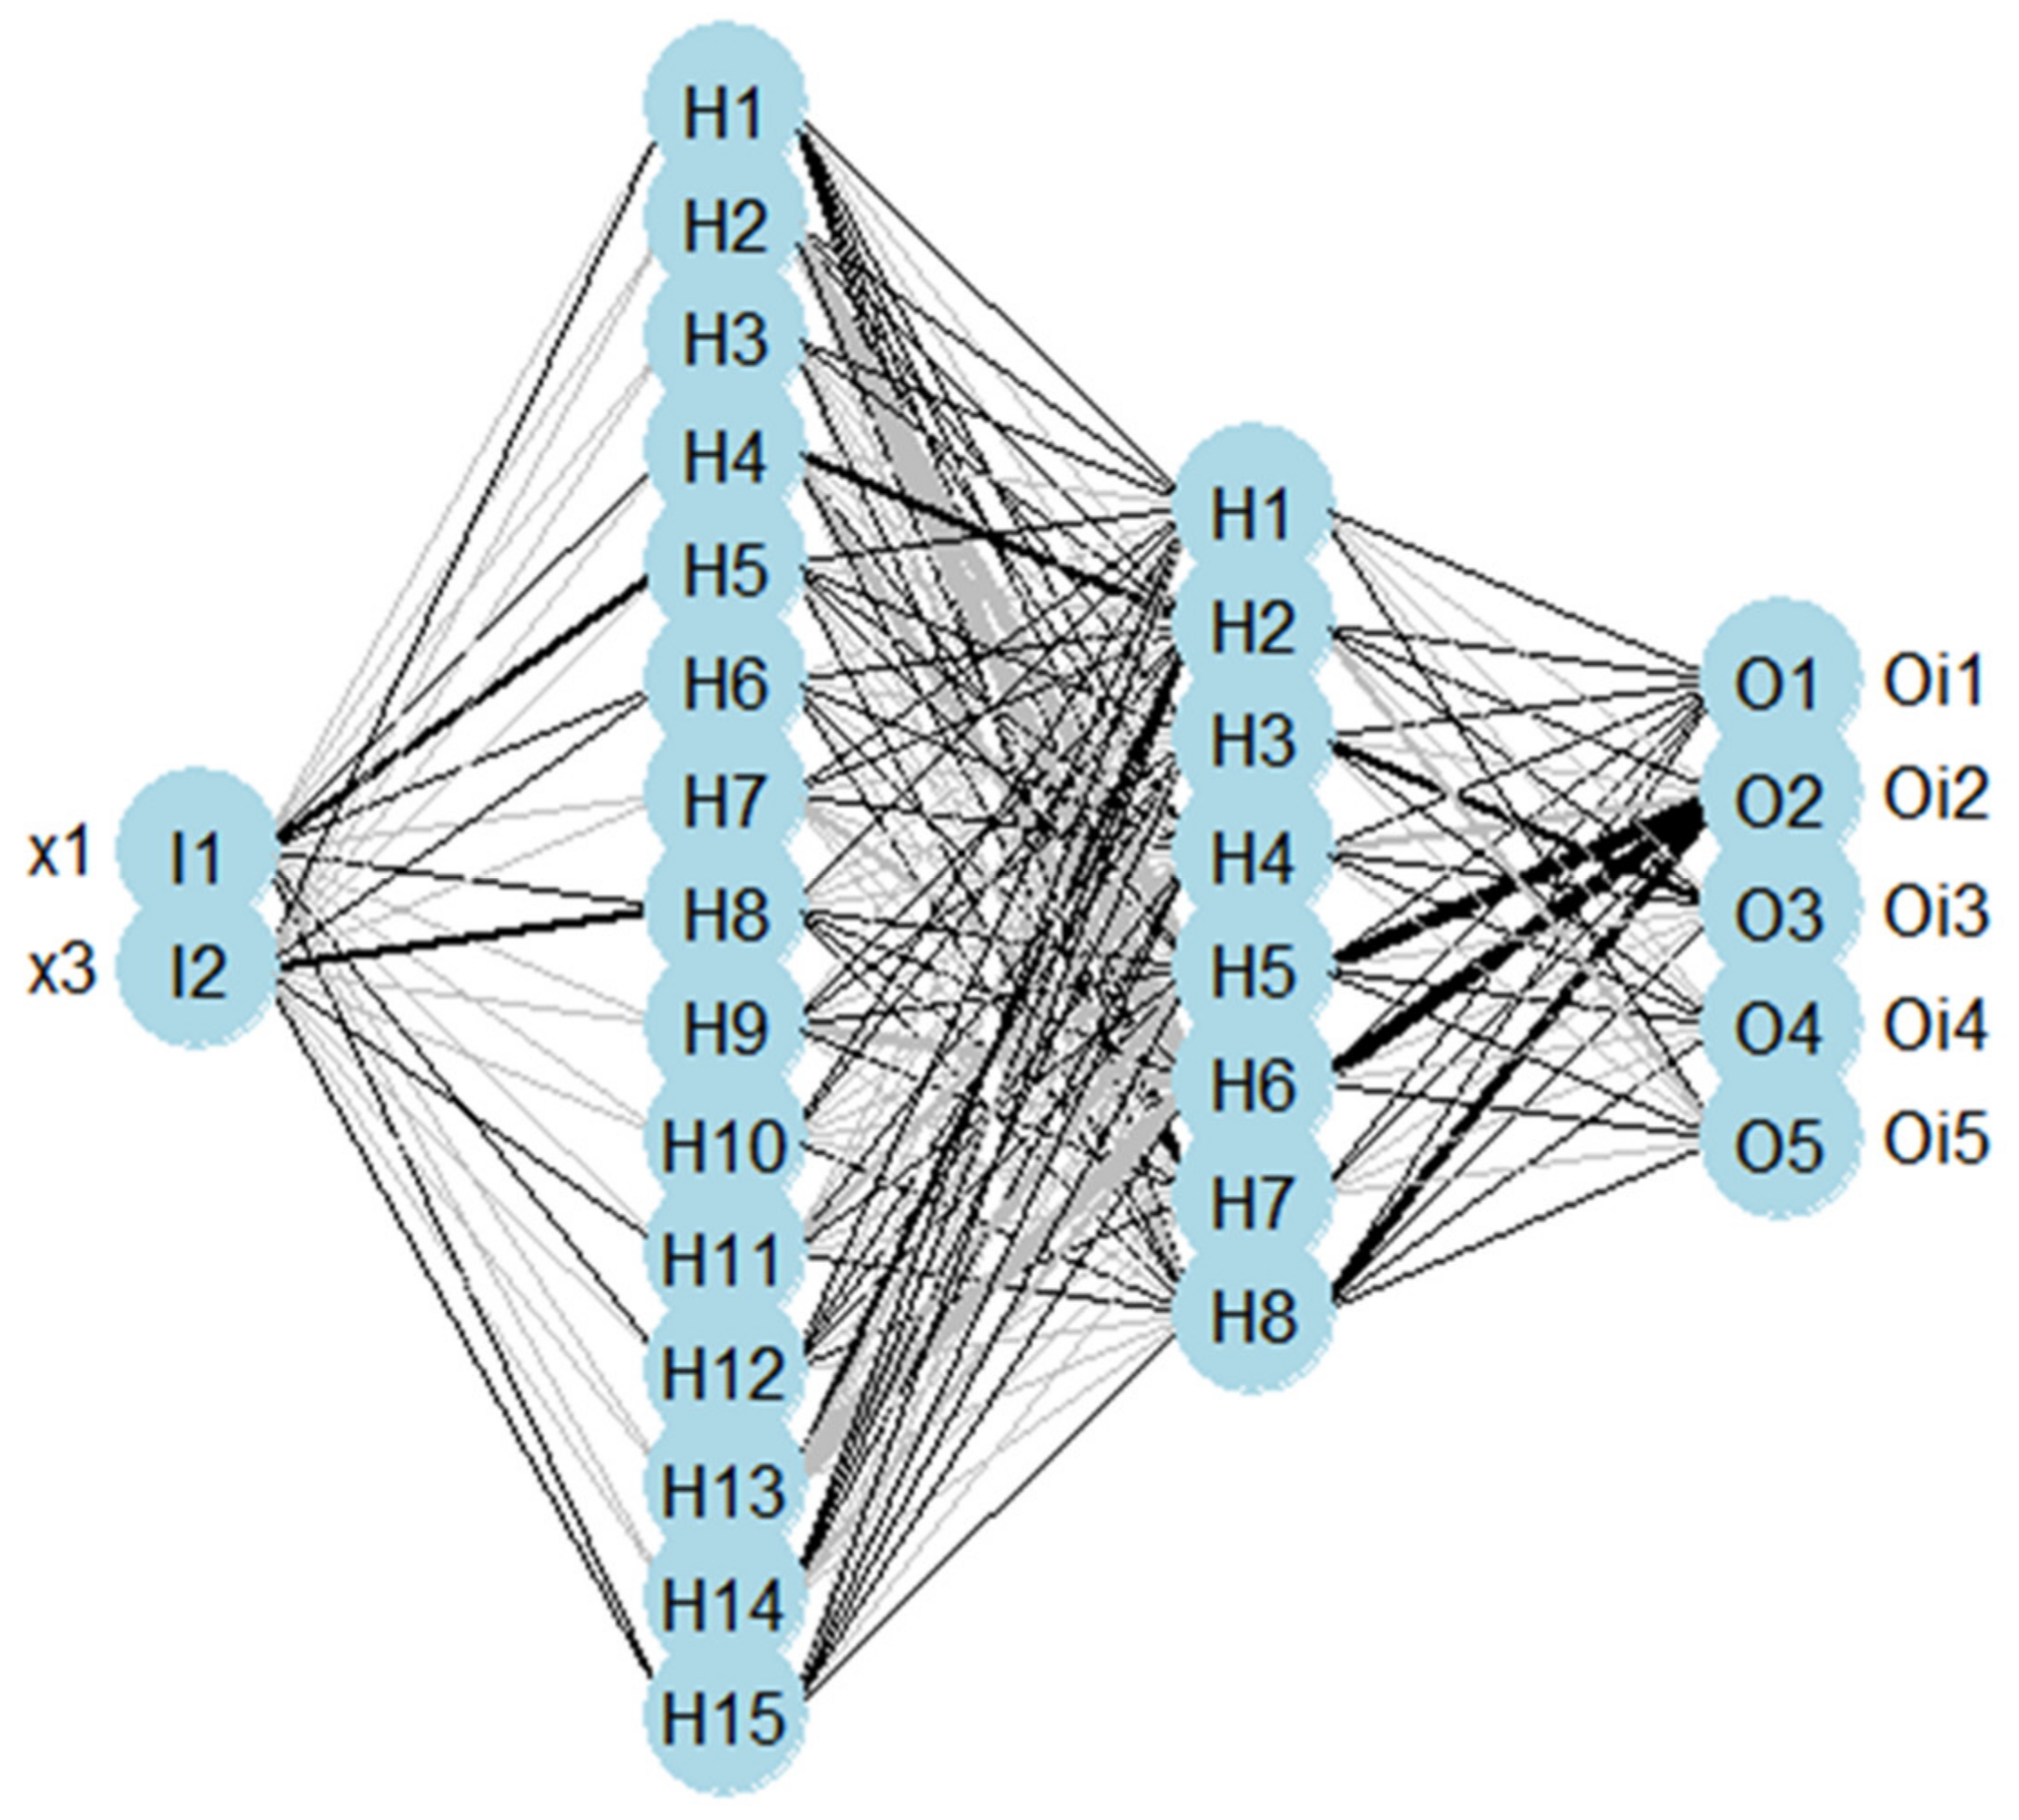
4.2.2. The ANN Modeling

The architecture of an ANN includes one input layer, one or more hidden layers, and one output layer. The ANNs with a single hidden layer are recognized as shallow networks, while those with two or more hidden layers are known as deep neural networks [83,84]. Each layer of an ANN consists of a number of processing units that are also called neurons or nodes. The input layer comprises the initial units that each handle one explanatory variable, while the output layer contains the units that each represent one category of the dependent variable. The units in the hidden layers are the main components in an ANN, which uses the x i , i = 1 , p ¯ features of the input layer/hidden units in lower layers and produces a numerical output to the hidden units in the higher layers/output layer, y j = ϕ i = 1 p w j i x i + b j [83]. Considering a hidden unit j, wji are the components of the weight matrix, bj represents the bias term, and φ(.) stands for the activation function. The extant literature [19,85] shows different types of ANNs that are closely related to the learning algorithm, the process through which the unknown information from the data is captured by the adjustment of the weight coefficients wji.
The capacity of an ANN to model complex and nonlinear relationships between the input and output units depends on the size and number of nodes in the hidden layer(s) [77,86]. As these hyperparameters of network structure are increased, the capacity of ANN to recognize such relationships and thus produce higher classification accuracy is enhanced. However, the probability of overtraining the model is also increased for networks that are too large [77,86]. Although different approaches are described in the literature [87,88,89], there may be no easy way to define the size and number of nodes in the hidden layer(s). Nevertheless, Huang and Babri [90] rigorously proved that N distinct samples can be precisely learned by a single-hidden-layer feedforward network (SLFN) with at most N hidden nodes. The sufficient condition for the activation function is that it be any bounded non-linear function that has a limit at infinity [90]. Thus, the upper bound of the number of hidden nodes for an SLFN is given by [90]:
NSLFN N
Moreover, Huang [91] rigorously proved that the required hidden nodes for a two-hidden-layer feedforward network (TLFN) are as follows ([91], p. 275):
N TLFN = 2 ( n o + 2 ) N
where N represents the number of distinct samples, while no stands for the number of outputs. Huang [91] further proved that a TLFN with (N1)TLFN and (N2)TLFN hidden nodes in the first and second layers, which are given by ([91], p. 278):
( N 1 ) TLFN = ( n o + 2 ) N + 2 N / ( n o + 2 ) ( N 2 ) TLFN = n o N / ( n o + 2 )
can learn the N distinct samples with negligibly small errors. It should be noted that (N1)TLFN and (N2)TLFN in expression (14) are also related to the upper bounds of the required hidden nodes for a TLFN.
Among the existing ANN architectures, the multilayer perceptron (MLP), a fully connected layer feedforward network that is considered a universal approximator for nonlinear functions [85], is one of the most used in classification and regression problems. Although a MLP with a single hidden layer (SMLP) is considered enough for most problems, a MLP with two hidden layers (TMLP) is recognized to solve some problems more efficiently [86], especially when large numbers of input samples are employed [91]. Usually, there is no need to employ a multi-layer feed-forward neural network with more than two hidden layers [78]. Therefore, the architectures of such MLP networks adapted to learn ordinal categories based on the approach of Cheng et al. [92] were used in our study. The activation function of the hidden nodes of this adapted MLP can be any of the commonly used activation functions. Nevertheless, different recommendations on how to choose them are available in the literature, including the goodness-of-fit tests presented in [93,94]. Since the complementary log-log link function in relation (10) is the inverse of the cumulative distribution function (cdf) of the extreme value (or log-Weibull) distribution that can be written as F ( z i ) = 1 e e z i , this expression is proposed in our study as the activation function for each output node of the MLP network instead of the softmax that is generally employed for a standard classification of MLP.
As a result, the topology of our MLP network is as follows ([95], pp. 291–292):
Input layer: J0 = r nodes, a0:1, a0:2,…, a0:r with a0:j = xj ( j = 1 , r ¯ ).
The ith hidden layer ( i = 1 ,   2 ¯ ): Ji nodes, ai:1,…, ai:Js,…, ai:Ji, with ai:s = φi(ci:s) and c i : s = j = 0 j i 1 w i : j , s a i 1 : j where: the upper bound J1 for SMLP is according to relation (12); the J1 and J2 for the TMLP are given by relation (14); φi is the activation function for the layer i; wi:j,s is the weight leading from node j of layer i − 1 to node s of layer i; and ai-1:0 = 1. Different types of activation functions can be used for the hidden layers. One of the most commonly employed is the logistic activation function defined by ϕ i ( z ) = 1 1 + e z [85], which is also used in our study.
Output layer: JI = k nodes, aI:1,…, aI:s,…, aI:k with aI:s = φI(cI:s) and c I : s = j = 0 j 1 w i : j , s a i 1 : j where ai-1:0 = 1. The activation function for this layer is given by ϕ i : s ( z ) = 1 e e z s .

4.2.3. Performance Measures

Several measures are available to assess the performance of multiple classification models. One of the most useful of these is accuracy, which returns the proportion of classes that were estimated correctly [96,97]. Mathematically, accuracy can be expressed as follows ([96], p. 54):
a c c = i = 1 N I ( ( C ^ j ) i = ( C j ) i ) N , ( ) j = 1 , k ¯
where I ( ( C ^ j ) i = ( C j ) i ) = 1 , if ( C ^ j ) i = ( C j ) i 0 , othervise , C ^ j is the predicted dependent variable, Cj is the true value of the dependent variable, and N is the sample size.
Although accuracy indicates how much the model is correctly estimating on the entire data set, the differences in performance on different classes are not considered in relation (15). Therefore, other metrics may also be meaningful in the case of multi-class problems. Such a commonly employed measure is the Area Under the Receiver Operating Characteristic Curve (AUC-ROC), which quantifies the ability of the model to distinguish between each class [97]. One of the most used approaches to computing AUC for different classes was developed by Hand and Till [98]. Their AUC combines the pairwise discriminability values of classes into a global measure that can be written as follows ([98], p. 177):
AUC total = 2 k ( k 1 ) i < j AUC ( c i , c j )
where AUC ( c i , c j ) = AUC ( c i | c j ) + AUC ( c j | c i ) 2 . Each term in the expression of AUC(ci,cj) is computed based on the formula developed by Hand and Till [98] for binary classes. For example, the expression of AUC(ci|cj) that represents the probability of a randomly chosen class cj having a lower estimated probability of belonging to class ci than a randomly chosen class ci is given by ([98], p. 174):
AUC ( c i | c j ) = S c i n c i ( n c i + 1 ) / 2 n c i n c j
where S c i is the sum of the ranks of the class ci data set points, while n c i and n c j are the number of data set points that belong to class ci and cj, respectively.
Since an ANN multiple ordinal classification is an iterative approach in which the network architecture is continually improved and its hyperparameters are tuned to obtain the expected output, computing time and resources are influenced by the sophistication of the ANN model [99]. In order to determine if an ANN model configuration is worth applying, the resulting accuracy versus the time consumed by the ANN model to reach it was introduced as a measure of time complexity [99].

5. Data Analysis and Results

5.1. The Ordinal Regression Analysis

Ordinal regression is sensitive to the explanatory variables that are highly correlated with each other [100]. Thus, one of the model assumptions includes the absence of multicollinearity among these variables [100]. The variance inflation factor (VIF) was employed to check that there is no multicollinearity between the independent variables, as it is a commonly employed measure to verify its absence [101]. Besides ordinal regression, detecting collinearity between independent variables is also needed in linear regression and Fisher discriminant analysis [101]. The existing statistical software (including SPSS) offers the possibility of computing the VIFs only through a linear regression procedure, although their values are also required in the logistic regression analysis. Therefore, such a procedure must be performed in SPSS to obtain the VIF values; these measures concern the relationships among the independent variables but not the relationships with the dependent variable. Moreover, to run multicollinearity analysis in SPSS, the categorical predictors must be replaced with dichotomous dummy variables [100,102]. After running the required procedure, the resulting values of the VIFs ranged from 1.606 to 3.375, which are below the value of 5. Therefore, the results do not indicate a problematic amount of collinearity [101,103], and the assumption of the absence of multicollinearity is satisfied.
The other assumption of ordinal regression is the proportionality of the odds, which states that the regression coefficients are the same across all categories of the ordinal dependent variable [104]. We examined this assumption through the test of parallel lines conducted in SPSS software, considering the x 1 , x 4 ¯   variables as covariates and x5 as a factor (the x4 variable was considered a covariate since there is an inherent order between the SME and large enterprise in terms of number of employees). We found this test as not significant (χ2 = 9.003, df = 18, p = 0.960) and we concluded that the proportional odds assumption is also held.
Next, we also employed SPSS software to fit the ordinal regression model to our data using the likelihood ratio test [103], which compares the difference in −2log likelihood of the proposed model (10) and the null model (the model with no explanatory variables). The ratio test was significant (χ2diff = 158.597, df = 6, p < 0.001), indicating that our model provides a significant improvement over the intercept-only model. The consistency between the observed data and the fitted model can be tested through the Pearson and deviance goodness-of-fit statistics [104]. We found the Pearson goodness-of-fit statistic (χ2 = 308.275, df = 334, p = 0.840 > 0.05) and the deviance measure (χ2 = 160.009, df = 334, p = 1.000 > 0.05) as both non-significant, and we may conclude that the observed data are consistent with the fitted model. However, the statistics of the likelihood ratio and goodness-of-fit tests are sensitive to empty cells [104,105]. When estimating models that include covariates, there are often many cells with zero frequencies reported by SPSS. This is our case, and in a situation like this, the significance values of these statistics would not be accurate, and neither of them may be considered reliable [104,105]. Nevertheless, there are several pseudo-R-square statistics that have been advised in examining the association between the dependent variable and the explanatory variables in the proposed model. The pseudo-R-square for McFadden (0.622) should be considered indicative of a very satisfactory fit of the model, as this value tends to be much lower than the R2s for the multiple regression model [106]. Therefore, this value suggests that our model with its independent variables explains a relatively large proportion of the variation among firms in their perception of universities as an external source for open innovation activities. In conclusion, the proposed ordinal regression model is most likely to be a good predictor of the perceived importance of universities in open innovation with firms. Table 2 presents the results of the estimation of the ordinal regression model. The interpretation of these results was mainly focused on the sign and statistical significance of the regression coefficients.
The x1 and x3 explanatory variables were found to have a significant positive impact on the importance of universities as an external source of open innovation for the industry, as their regression coefficients were both positive and statistically significant (p < 0.001). Therefore, hypotheses 1 and 3 are supported. Moreover, as the value of each of these explanatory variables increases, the probability of a higher category of the dependent variable increases, while the other predictors in the model are held constant. The x2 explanatory variable turned out to have a negative impact on the university’s perception of the importance of open innovation with industry. However, this impact was not statistically significant (p > 0.1), and thereby Hypothesis 2 was only partially supported given the insignificance of the barriers. Regarding the control variables x4 and x5, they were also found to be not statistically significant (p > 0.1).

5.2. The ANN Analysis

The x1 and x3 significant hypothesized explanatory variables from the ordinal regression were used as nodes in the input layer of the developed MLP network, which was implemented with the “Neuralnet” package of R software [107]. The resilient backpropagation algorithm (rprop) was employed because of its faster convergence and robustness [108]. More specifically, our MLP network was based on the rprop+ (the rprop with weight backtracking) algorithm with cross entropy as an error function, while its threshold and stepmax values were set as 0.1 and 1 × 10⁷, respectively. Since the sample size of our study is N = 98, the upper bound of the number of hidden nodes for a SLFN is according to relation (12) NSLFN ≤ 98. Moreover, the upper bounds of the hidden nodes for a TLFN are (N1)TLFN = 33 and (N2)TLFN = 18, considering the integer values in relation (14). To determine the number of neurons in each hidden layer of the two networks, the dataset was split into training, validation, and test sets with a typical proportion of 70-15-15 [109] taking into account the relatively small size of the sample data.
Different models were built for the SLFN, with the neurons in the hidden layer varying from 1 to 98 (a total of 98 models). For the TLFN, the neurons in the first layer varied from 1 to 33, while in the second layer, they ranged from 1 to 18 (594 models). The training dataset was employed to fit the models in the case of both SLFN and TLFN architectures. Next, the validation dataset was used to compare these models, and the one with the best performance was identified. Finally, the best model was applied against the testing dataset to evaluate its predicting performance. The accuracy criterion given by relation (15) was employed to assess the performance of each model. Table 3 presents the results for the best SLFN and TLFN models, which also include the AUC-ROC measure for each of these models. According to the results in Table 3, the performance measures of the best MLP with two hidden layers model TLFN(15,8) are better than those of the best with one hidden layer model SLFN(41) for all training, validation, and test sets. At the same time, the performance statistics of the TLFN(15,8) of the validation and test sets are relatively similar to those of the training set. Therefore, the TLFN(15,8) network may be considered an adequate predictor of new datasets. Moreover, the 79.687% accuracy of the SLFN(41) model was obtained in the training time of 1.18 s. Regarding TLFN(15,8) model, an accuracy of 82.812% resulted after a training time of 1.05 s. With this outcome, the TLFN(15,8) model also gives a better result compared to SLFN(41). Figure 5 depicts the final architecture of the proposed ANN model.
Nevertheless, a k-fold cross-validation was carried out to further avoid overfitting the TLFN(15,8) model, as the sample size of our study was relatively small. In addition, the k-fold cross-validation gives a reliable perspective on the model’s performance. Table 4 shows the accuracy and AUC-ROC statistics of a 10-fold cross-validation process. The values of the performance measures of the test set are smaller, which is usual [110], but not substantially different from those of the training dataset. Thus, the TLFN(15,8) can be considered a robust model for predicting independent datasets.

6. Discussion and Conclusions

Opening up their innovation activities has become an important way for firms to compete in today’s dynamic and changing environment. Although industry may draw knowledge and technologies from different sources, the scientific knowledge of universities is regarded as having a great potential to improve firms’ competitiveness [111], considering its unique features compared to other sources [30]. The understanding of how industry engages in collaboration with universities in open innovation has recently seen important advances [112,113]. Accordingly, it appears that motives, barriers, and channels of knowledge transfer are important antecedents in explaining the propensity of firms to employ universities in their open innovation activities. Despite this fact, an integrative approach that investigates their impact on the perception of universities as an important external knowledge source for open innovation is still lacking. Within this context, we developed a research framework to fill the above research gap in the open innovation literature.
The findings of our analysis provided some interesting insights regarding the influence of the proposed antecedents of industry-university collaboration for open innovation and the resulting impact on the perception of the importance of universities as a source of knowledge in the open innovation context. Conceived as fundamental reasons for firms to engage in collaboration with universities, motives have been seen as anticipated benefits [114]. In collaboration with universities, firms aim to capture both their tacit and highly codified scientific knowledge using proactive and passive strategies, respectively [115]. Thus, several studies reviewed the motivations of firms to collaborate with universities in an open innovation context [50,57,58]. The inbound knowledge flow between the university and industry may each have ‘non-pecuniary’ or ‘pecuniary’ motives [116], which can be used to explain why they collaborate in open innovation. In this sense, our study included motives that belong to both the unmonetized and monetized flows of knowledge. Our findings indicated that, taken together, these motives have a significantly positive impact on the perception of universities as a knowledge source for industry in open innovation. In other words, universities are perceived as more important sources for firms that have expressed more important motives for their collaboration in open innovation. Therefore, an understanding of the nature and importance of the motives becomes essential to the successful implementation of open innovation between industry and university actors.
Since innovation is considered a complex phenomenon that is subjected to uncertainty and changes, the collaboration between industry and universities in such a setting may face significant challenges [117]. Inherent with the complexity of the open innovation context, the collaboration between the two organizations in this process is hindered by different barriers. Identifying these barriers and eventually overcoming them is also crucial for successfully implementing open innovation activities [61]. For this purpose, our study comprised barriers that can be delineated based on the same logic of pecuniary and non-pecuniary challenges to open innovation [53]. As expected, we found at an overall level that these barriers have a negative impact on the perceived importance of universities as a knowledge source for industry in open innovation. However, these barriers do not significantly influence this perception. A possible explanation of this result is related to the criterion for inclusion in the sample of only the firms that cooperate with universities. Despite the recognition of the presence of barriers to open innovation, they might learn how to gain scientific knowledge from universities, although this process requires time, resources, and extensive effort [118,119]. As a result, firms may become more open and confident in partnering with universities in order to attain their goals [120].
According to extant literature [41,58], knowledge flows through many channels during industry-university collaboration in open innovation. Different perspectives on categorizing these channels have been proposed by the scholars, such as the “dominant mechanisms employed” considered by Gilsing et al. [121] or the “dominant mode of governance” illustrated by Alexander et al. [41]. The science versus development-based regimes criterion was used in the former, while the relational versus transactional style of engagement was distinguished in the latter. Each of these transfer mechanisms shows its own unique characteristics, and it should be noted that in most situations, multiple connections are used together depending on the transfer objectives [122]. On the whole, our study involved transfer channels that belong to both perspectives described above, which can also be analyzed based on the same pecuniary versus non-pecuniary logic of knowledge transfer proposed by Dahlander and Gann [53]. Altogether, these channels have a positive and significant impact on the perception of the importance of universities as an external knowledge source for industry in open innovation. Therefore, universities are perceived as more important sources for firms that employ more channels for their collaboration in open innovation. This result supports the view of Meissner and Carayannis [122] and the findings of Costa et al. [63] regarding the diversity of knowledge sources, which pointed out that the promotion of multiple channels of collaboration rather than a single one may be more effective. Although a deep search across a wide variety of knowledge transfer channels can provide valuable resources to industry in exploiting innovation opportunities, the costs of such search efforts should also be understood and not dissipated across too many external sources [64].
The control variables also offered some insights in terms of the size of the firm and industry type. Specifically, the sign of the firm size variable in Table 2 suggested that the SMEs (coded with 1) are more likely to assign higher ratings on the importance perception of universities in their collaboration for open innovation than large firms (coded with 2). At the same time, the impact of the firms’ size on the open innovation paradigm is still under debate [123,124]. On one hand, SMEs have to draw more from open innovation initiatives than large firms, as they are generally less research-intensive, but they also possess more limited internal capabilities and resources for managing such initiatives [112]. On the other hand, large firms may be more responsive to open innovation with universities as they carry out more formal research and development activities and have greater resources and time to build their collaboration than SMEs [111,125], but they also have more capabilities to conduct internal innovation activities. With regard to the industry type, our analysis has mixed results, as shown in Table 2. Our finding suggested that the high-tech industry (coded with 1) is less likely, while the medium high-tech industry (coded with 2) is more likely to assign higher ratings on the importance perception of universities in their collaboration for open innovation than the low-tech industry (coded with 3). Although open innovation practices vary across sectors [52], this finding is in part different from other research such as that of Kanama and Nishikawa [126], which found medium- and high-tech industries as having the tendency to use more universities as an external knowledge source. It also should be noted that control variables do not offer any significant impact, which may be related to the limited homogeneity of the participants from the two industrial areas employed in our sample.
As industry searches to become more innovative, understanding the antecedents’ impact on the perception of universities as an external knowledge source to industry may help firms develop specific strategies to sustain those antecedents that have a positive effect and diminish the influence of those with a negative one. In this way, more effective and efficient employment of open innovation between the two partner organizations is expected, which may increase their collaboration in such a context through suitable policies and procedures.

6.1. Concluding Remarks

The interaction between firms and universities continues to increase in the context of the open innovation paradigm [122], where motivations, barriers, and channels of knowledge transfer have been considered as major antecedents of their collaboration [16]. However, their impact on the perception of universities as an important external knowledge source for industry has not been explored yet, which has resulted in a limited understanding of such influence. Aiming to fill this gap, we developed a research framework based on the extant literature that related the impact of the above antecedents to the perceived importance of universities as an external knowledge source to industry in open innovation. As a result of the hypotheses of our study, we provide a first perspective of which of the three antecedents significantly impact this perception and contributes to a more articulate view of the collaboration between these two actor partners in an open innovation context.
On the whole, the findings of our study expand the existing literature in the open innovation field and have both theoretical and practical implications. The main theoretical contribution consists in modeling the antecedents’ impact on the importance perception of universities as an external knowledge source to industry in open innovation based on the two-stage ordinal regression and neural network approaches. Although some studies have been conducted to adapt ANNs to learn ordinal categories [92,127], a hybrid ordinal regression and ANN modeling approach has been rarely described in the literature. Considering the order relation between categories of perceived importance, an ordinal regression approach was employed in the first stage for modeling the relationship between the response and explanatory variables of our research framework. However, such modeling presents some shortcomings related to the non-linearity of the model and data distribution. At the same time, the ANNs can overcome these shortcomings but are not suitable for hypothesis testing because of their algorithm’s difficulty in determining how the decision is made. Within this context, in the second stage, an ANN analysis was carried out that included shallow and deep ANNs. Both types of architecture employed the significant explanatory variables obtained in the first stage and the dependent variable of our study as inputs and outputs, respectively. Moreover, the CDF of the distribution used in obtaining the link function of the ordinal regression model through its inverse transformation was also employed as the activation function for each output node of the ANNs.
In the first stage, the regression coefficients of the resulting model are somewhat more difficult to interpret [81]. Therefore, our analysis was focused on their sign to examine the direction of the effect of the explanatory variables on the response variable and their statistical significance to test the hypotheses of the study. The results have shown that hypotheses H1 and H3 are fully supported, while hypothesis H2 is only partially supported, which suggests a differentiated impact of the analyzed antecedents. The sign and statistical significance of the findings of this work are relatively similar to those of other studies in which methods such as SEM were employed (e.g., [17]). Therefore, reaching such conclusions with different approaches may contribute to supporting their validity.
From a practical perspective, these findings provide an insight into the antecedents that firms should sustain to exploit open innovation opportunities, as well as those they should mitigate in their collaboration with universities. We also found in the second stage that a two-hidden-layer MLP network is more effective in modeling the complex relationship between the significant explanatory variables obtained in the first stage and the dependent variable of our study, which is consistent with the existent literature [19]. In this way, we focus on quantifying the antecedents’ impact on the perceived importance of universities as an external knowledge source and offer a practical tool to predict such an impact.

6.2. Limitations and Direction for Future Research

Like any other exploratory research, our study has several limitations that have to be acknowledged, which also points out future research directions. First, to our best knowledge, very little theoretical or empirical evidence related to the developed research framework is available in the literature. On the one hand, it is possible that some of its components might not be considered. Nevertheless, our framework has an open and flexible architecture that allows the incorporation of any new components. And future studies will have to confirm, modify, or even reject some of these findings once such components are distinguished in future research. On the other hand, the three variables of our study expressed by the relations (1), (3), and (5) are relatively simple constructs that were defined based on the seminal works in the field of open innovation [64,70]. Nevertheless, each of them has a relatively high internal consistency, a similar result to those pointed out in the literature [64,70]. However, the statistical significance of the proposed variables may be of higher relevance if they are validated by both confirmatory and exploratory factor analysis, which is expected to be performed in our future studies.
Second, the findings resulting from this study should be viewed within the described context of the two industrial areas and based on a relatively small sample size. Moreover, we employed a purposive sampling to cover as many opinions as possible [128], which also may induce some limited homogeneity among the participants. Considering its exploratory nature, this work is also intended to draw a tentative outline for future research in the analyzed field and requires replication before generalizing its findings. Hence, future additional research is required so that its conclusions can be fully useful in the practice of open innovation between industry and universities. As Villasalero [14] pointed out, future studies that involve larger samples should be conducted in different settings and different national operating environments to find the extent to which the analyzed impact is conditioned by the features existing in such contexts.
Third, the proposed activation function for the output nodes of ANNs does not guarantee the rank-monotonicity of the outputs, a desirable characteristic in prediction-making although not necessary [92]. More sophisticated modeling in the direction suggested in [127] should be performed in future studies to explore if it will lead to better performance in the context of our approach.
Lastly, this study reflects only the firms’ perspective regarding the antecedents’ impact of opening up innovation on the perceived importance of universities as an external knowledge source to industry. Future research should also address this impact from the point of view of the academic institutions open innovation with industry. Findings from comparing the perspectives of both organizational actors are expected to provide empirical evidence that can be used to improve their collaboration in an open innovation context.

Author Contributions

Conceptualization, C.F.B.; methodology, C.F.B. and M.B.; software, M.B.; validation, C.F.B. and M.B.; formal analysis, C.F.B. and T.M.; investigation, C.F.B. and M.B.; resources, M.B. and T.M.; data curation, M.B.; writing—original draft preparation, C.F.B. and T.M.; writing—reviewing and editing, C.F.B. and T.M.; visualization, C.F.B. and M.B.; supervision, M.B. All authors have read and agreed to the published version of the manuscript.

Funding

This research was funded by the University of Oradea.

Data Availability Statement

Not applicable.

Conflicts of Interest

The authors declare no conflict of interest.

References

  1. Bennet, D.; Bennet, A. Organizational Survival in the New World: The Intelligent Complex Adaptive System; Butterworth-Heineniann: Amsterdam, The Netherlands, 2004. [Google Scholar]
  2. Duong, P.A.N.; Voordeckers, W.; Huybrechts, J.; Lambrechts, F. On external knowledge sources and innovation performance: Family versus non-family firms. Technovation 2022, 114, 102448. [Google Scholar] [CrossRef]
  3. Bigliardi, B.; Ferraro, G.; Filippelli, S.; Galati, F. The influence of open innovation on firm performance. Int. J. Eng. Bus. Manag. 2020, 12, 1–14. [Google Scholar] [CrossRef]
  4. Fernandes, S.; Cesário, M.; Barata, J.M. Ways to open innovation: Main agents and sources in the Portuguese case. Technol. Soc. 2017, 51, 153–162. [Google Scholar] [CrossRef]
  5. Lichtenthaler, U. Open innovation: Past research, current debates, and future directions. Acad. Manag. Perspect. 2011, 25, 75–93. [Google Scholar]
  6. Villasalero, M. Multi-Business Firms, Knowledge Flows and Intra-Network Open Innovations. J. Knowl. Econ. 2018, 9, 162–179. [Google Scholar] [CrossRef] [Green Version]
  7. Chesbrough, H. Open Innovation: The New Imperative for Creating and Profiting from Technology; Harvard Business School Press: Boston, MA, USA, 2003. [Google Scholar]
  8. Dahlander, L.; Gann, D.M.; Wallin, M.W. How open is innovation? A retrospective and ideas forward. Res. Policy 2021, 50, 104218. [Google Scholar] [CrossRef]
  9. Bellucci, A.; Pennacchio, L. University knowledge and firm innovation: Evidence from European countries. J. Technol. Transf. 2016, 41, 730–752. [Google Scholar] [CrossRef] [Green Version]
  10. D’Este, P.; Amara, N.; Olmos, J. Fostering novelty while reducing failure: Balancing the twin challenges of product innovation. Technol. Forecast. Soc. Change 2016, 113, 280–292. [Google Scholar] [CrossRef]
  11. Du, J.; Leten, B.; Vanhaverbeke, W. Managing open innovation projects with science based and market-based partners. Res. Policy 2014, 43, 828–840. [Google Scholar] [CrossRef]
  12. Huang, S.; Chen, J.; Liang, L. How open innovation performance responds to partner heterogeneity in China. Manag. Decis. 2018, 56, 26–46. [Google Scholar] [CrossRef]
  13. West, J.; Bogers, M. Leveraging External Sources of Innovation: A Review of Research on Open Innovation. J. Prod. Innov. Manag. 2014, 31, 814–831. [Google Scholar] [CrossRef]
  14. Villasalero, M. University knowledge, open innovation and technological capital in Spanish science parks: Research revealing or technology selling? J. Intellect. Cap. 2014, 15, 479–496. [Google Scholar]
  15. West, J.; Bogers, M. Open innovation: Current status and research opportunities, Innovation: Management. Policy Pract. 2016, 19, 43–50. [Google Scholar]
  16. Parmentola, A.; Ferretti, M.; Panetti, E. Exploring the university-industry cooperation in a low innovative region. What differences between low tech and high tech industries? Int. Entrep. Manag. J. 2021, 17, 1469–1496. [Google Scholar] [CrossRef]
  17. Baban, C.F.; Baban, M.; Rangone, A. Outcomes of Industry—University Collaboration in Open Innovation: An Exploratory Investigation of Their Antecedents’ Impact Based on a PLS-SEM and Soft Computing Approach. Mathematics 2022, 10, 931. [Google Scholar] [CrossRef]
  18. Baban, C.F.; Baban, M.; Rangone, A. Investigating determinants of industry-university collaboration in an open innovation context: Comparative evidence from an exploratory study. Sci. Technol. Soc. 2021, 26, 482–502. [Google Scholar] [CrossRef]
  19. Abiodun, O.I.; Jantan, A.; Omolara, A.E.; Dada, K.V.; Mohamed, N.A.; Arshad, H. State-of-the art in artificial neural network applications: A survey. Heliyon 2018, 4, e00938. [Google Scholar] [CrossRef] [Green Version]
  20. Lee, J.; Kwon, H.-B.; Pati, N. Exploring the relative impact of R&D and operational efficiency on performance: A sequential regression-neural network approach. Expert Syst. Appl. 2019, 137, 420–431. [Google Scholar]
  21. Cao, H. Entrepreneurship education-infiltrated computer-aided instruction system for college Music Majors using convolutional neural network. Front. Psychol. 2022, 13, 900195. [Google Scholar] [CrossRef]
  22. Cheng, L.; Yin, F.; Theodoridis, S.; Chatzis, S.; Chang, T. Rethinking Bayesian Learning for Data Analysis: The art of prior and inference in sparsity-aware modeling. IEEE Signal Process. Mag. 2022, 39, 18–52. [Google Scholar] [CrossRef]
  23. Feng, Q.; Feng, Z.; Su, X.; Bai, Y.D.; Ding, B.Y. Design and Simulation of Human Resource Allocation Model Based on Double-Cycle Neural Network. Comput. Intell. Neurosci. 2021, 2021, 7149631. [Google Scholar] [CrossRef] [PubMed]
  24. Huang, C.; Han, Z.; Li, M.; Wang, X.; Zhao, W. Sentiment evolution with interaction levels in blended learning environments: Using learning analytics and epistemic network analysis. Australas. J. Educ. Technol. 2021, 37, 81–95. [Google Scholar] [CrossRef]
  25. Li, X.; Zhang, X.; Jia, T. Humanization of nature: Testing the influences of urban park characteristics and psychological factors on collegers’ perceived restoration. Urban For. Urban Green. 2023, 79, 127806. [Google Scholar] [CrossRef]
  26. Sutrisna, M.; Tjia, D.; Wu, P. Developing a predictive model of construction industry-university research collaboration. Constr. Innov. 2021, 21, 761–781. [Google Scholar] [CrossRef]
  27. Hajek, P.; Henriques, R. Modelling innovation performance of European regions using multi-output neural networks. PLoS ONE 2017, 12, e018575. [Google Scholar] [CrossRef] [Green Version]
  28. Prokop, V.; Stejskal, J.; Mikusova Merickova, B.; Odei, S.A. Revealing the importance of international and domestic cooperation by using artificial neural networks: Case of European radical and incremental innovators. Eur. J. Innov. Manag. 2023, 26, 531–563. [Google Scholar] [CrossRef]
  29. Lee, J.; Kwon, H.-B. Synergistic effect of R&D and exports on performance in US manufacturing industries: High-tech vs. low-tech. J. Model. Manag. 2021. ahead-of-print. [Google Scholar]
  30. Cohen, W.M.; Levinthal, D.A. Absorptive Capacity: A New Perspective on Learning and Innovation. Source Adm. Sci. Q. 1990, 35, 128–152. [Google Scholar]
  31. Etzkowitz, H.; Leydesdorff, L. The dynamics of innovation from national systems and mode 2 to a triple helix of university-industry-government relations. Res. Policy 2000, 29, 109–123. [Google Scholar] [CrossRef]
  32. Leydesdorff, L. The Triple Helix, Quadruple Helix, …, and an N-Tuple of Helices: Explanatory Models for Analyzing the Knowledge-Based Economy? J. Knowl. Econ. 2012, 3, 25–35. [Google Scholar] [CrossRef] [Green Version]
  33. Rybnicek, R.; Königsgruber, R. What makes industry-university collaboration succeeds? A systematic review of the literature. J. Bus. Econ. 2019, 89, 221–250. [Google Scholar] [CrossRef] [Green Version]
  34. Kafouros, M.I.; Forsans, N. The role of open innovation in emerging economies: Do companies profit from the scientific knowledge of others? J. World Bus. 2012, 47, 362–370. [Google Scholar]
  35. Walsh, J.P.; Lee, Y.N.; Nagaoka, S. Openness and innovation in the US: Collaboration form, idea generation and implementation. Res. Policy 2016, 45, 1660–1671. [Google Scholar] [CrossRef]
  36. Rajalo, S.; Vadi, M. University-industry innovation collaboration: Reconceptualization. Technovation 2017, 62–63, 42–54. [Google Scholar] [CrossRef]
  37. Ankrah, S.; AL-Tabbaa, O. Universities-industry collaboration: A systematic review. Scand. J. Manag. 2015, 31, 387–408. [Google Scholar]
  38. Figueiredo, N.; Fernandes, C. Cooperation University-Industry: A Systematic Literature Review. Int. J. Innov. Technol. Manag. 2020, 17, 2130001. [Google Scholar] [CrossRef]
  39. Mascarenhas, C.; Ferreira, J.J.; Marques, C. University-industry cooperation: A systematic literature review and research agenda. Sci. Public Policy 2018, 45, 708–718. [Google Scholar] [CrossRef] [Green Version]
  40. Carayannis, E.G.; Campbell, D.F.J. Open innovation diplomacy and a 21st century fractal research, education and innovation (FREIE) ecosystem: Building on the Quadruple and Quintuple Helix innovation concepts and the “Mode 3” knowledge production system. J. Knowl. Econ. 2011, 2, 327–372. [Google Scholar] [CrossRef]
  41. Alexander, A.T.; Miller, K.; Fielding, S. Open for business: Universities, entrepreneurial academics and open innovation. Int. J. Innov. Manag. 2015, 19, 1540013. [Google Scholar]
  42. Chesbrough, H. From Open Science to Open Innovation; Science Business Publishing, Institute for Innovation and Knowledge Management UC: Berkeley, CA, USA, 2015; pp. 1–16. [Google Scholar]
  43. Johnston, A. Open innovation in science: Assessing the formation and function of SME-university collaborations through the proximity matrix. Ind. Innov. 2022, 29, 310–332. [Google Scholar] [CrossRef]
  44. Vicente-Saez, R.; Gustafsson, R.; Van den Brande, L. The dawn of an open exploration era: Emergent principles and practices of open science and innovation of university research teams in a digital world. Technol. Forecast. Soc. Chang. 2020, 156, 120037. [Google Scholar] [CrossRef]
  45. Un, C.A.; Rodríguez, A. Local and global knowledge complementarity: R&D collaborations and innovation of foreign and domestic firms. J. Int. Manag. 2018, 24, 137–152. [Google Scholar]
  46. Leydesdorff, L.; Ivanova, I. “Open innovation” and “triple helix” models of innovation: Can synergy in innovation systems be measured? J. Open Innov. 2016, 2, 11. [Google Scholar]
  47. Chesbrough, H.; Bogers, M. Explicating open innovation: Clarifying an emerging paradigm for understanding innovation. In New Frontiers in Open Innovation; Chesbrough, H., Vanhaverbeke, W., West, J., Eds.; Oxford University Press: Oxford, UK, 2014; pp. 3–28. [Google Scholar]
  48. Huizingh, E.K.R.E. Open innovation: State of art and future perspectives. Technovation 2011, 31, 2–9. [Google Scholar] [CrossRef]
  49. Greco, M.; Grimaldi, M.; Cricelli, L. An analysis of the open innovation effect on firm performance. Eur. Manag. J. 2016, 34, 501–516. [Google Scholar] [CrossRef]
  50. Lam, J.C.K.; Hills, P.; Ng, C.K.W. Open innovation: A study of industry-university collaboration in environmental R&D in Hong Kong. Int. J. Technol. Knowl. Soc. 2013, 8, 83–102. [Google Scholar]
  51. Suhada, T.A.; Ford, J.A.; Verreynne, M.L.; Indulska, M. Motivating individuals to contribute to firms’ non-pecuniary open innovation goals. Technovation 2021, 102, 102233. [Google Scholar] [CrossRef]
  52. Johnston, A. Open innovation and the formation of university-industry links in the food manufacturing and technology sector: Evidence from the UK. Eur. J. Innov. Manag. 2021, 24, 89–107. [Google Scholar] [CrossRef] [Green Version]
  53. Dahlander, L.; Gann, D.M. How open is innovation? Res. Policy 2010, 39, 699–709. [Google Scholar]
  54. Galan-Muros, V.; Davey, T. The UBC ecosystem: Putting together a comprehensive framework for university-business cooperation. J. Technol. Transf. 2019, 44, 1311–1346. [Google Scholar] [CrossRef]
  55. Razak, A.A.; Murray, P.A.; Robert, D. Open innovation in universities: The relationship between innovation and commercialisation. Knowl. Process Manag. 2014, 21, 260–269. [Google Scholar]
  56. Wikhamn, B.R. Designing Lightweight Open Innovation: A Conceptualisation of How Large Firms Engage with Small Entrepreneurial Firms. Int. J. Innov. Manag. 2021, 25, 2150103. [Google Scholar] [CrossRef]
  57. Lopes, A.P.V.B.V.; Ferrarese, A.; De Carvalho, M.M. Open innovation in the research and development process: An analysis of the cooperation between automotive companies and universities. Gestão Produção 2017, 24, 653–666. [Google Scholar]
  58. Baban, C.F.; Baban, M. Main dimensions of open innovation between industry and university: An exploratory approach in a Romanian environment. In Proceedings of the ICERI 2018 Conference, Seville, Spain, 12–14 November 2018; pp. 9726–9734. [Google Scholar]
  59. Saguy, I.M.; Sirotinskaya, V. Challenges in exploiting open innovation’s full potential in the food industry with a focus on small and medium enterprises (SMEs). Trends Food Sci. Technol. 2014, 38, 136–148. [Google Scholar] [CrossRef]
  60. Galati, F.; Bigliardi, B.; Petroni, A. Open innovation in food firms: Implementation strategies, drivers and enabling factors. Int. J. Innov. Manag. 2016, 20, 1650042. [Google Scholar] [CrossRef]
  61. Quiñones, R.; Caladcad, J.A.; Quiñones, H.; Caballes, S.A.; Abellana, D.P.; Jabilles, E.M.; Himang, C.; Ocampo, L. Open Innovation with Fuzzy Cognitive Mapping for Modeling the Barriers of University Technology Transfer: A Philippine Scenario. J. Open Innov. Technol. Mark. Complex. 2019, 5, 94. [Google Scholar] [CrossRef] [Green Version]
  62. Bigliardi, B.; Galati, F. Which factors hinder the adoption of open innovation in SMEs? Technol. Anal. Strateg. Manag. 2016, 28, 869–885. [Google Scholar] [CrossRef]
  63. Costa, J.; Neves, A.R.; Reis, J. Two Sides of the Same Coin. University-Industry Collaboration and Open Innovation as Enhancers of Firm Performance. Sustainability 2021, 13, 3866. [Google Scholar] [CrossRef]
  64. Laursen, K.; Salter, A. Open for innovation: The role of openness in explaining innovation performance among UK manufacturing firms. Strateg. Manag. J. 2006, 27, 131–150. [Google Scholar] [CrossRef]
  65. DiGiovanna, S. Industrial Districts and Regional Economic Development: A Regulation Approach. Reg. Stud. 1996, 30, 373–386. [Google Scholar] [CrossRef]
  66. Cainelli, G.; Mazzanti, M.; Montresor, S. Environmental innovations, local networks and internationalization. Ind. Innov. 2012, 19, 697–734. [Google Scholar]
  67. Băban, C.F.; Băban, M. An Orchestration Perspective on Open Innovation between Industry-University: Investigating Its Impact on Collaboration Performance. Mathematics 2022, 10, 2672. [Google Scholar] [CrossRef]
  68. Laursen, K.; Salter, A. The paradox of openness: Appropriability, external search and collaboration. Res. Policy 2014, 43, 867–878. [Google Scholar] [CrossRef] [Green Version]
  69. Hair, J.; Anderson, R.; Tatham, R.; Black, W. Multivariate Data Analysis, 8th ed.; Cengage Learning: Andover, UK, 2019. [Google Scholar]
  70. Leiponen, A.; Helfat, C.E. Innovation objectives, knowledge sources, and the benefits of breadth. J. Strat. Mgmt. J. 2010, 31, 224–236. [Google Scholar] [CrossRef] [Green Version]
  71. Cristo-Andrade, S.; Franco, M.J. Cooperation as a vehicle for innovation: A study of the effects of firm size and industry type. Eur. J. Innov. Manag. 2020, 23, 329–347. [Google Scholar] [CrossRef]
  72. Hewitt-Dundas, N.; Gkypali, A.; Roper, S. Does learning from prior collaboration help firms to overcome the ‘two-worlds’ paradox in university-business collaboration? Res. Policy 2019, 48, 1310–1322. [Google Scholar] [CrossRef]
  73. ***-Eurostat Indicators on High-Tech Industry and Knowledge-Intensive Services. Annex 3-High-Tech Aggregation by NACE Rev.2. Available online: http://ec.europa.eu/eurostat/cache/metadata/Annexes/htec_esms_an3.pdf (accessed on 2 September 2022).
  74. Agresti, A. Categorical Data Analysis, 3rd ed.; John Wiley & Sons: Hoboken, NJ, USA, 2013. [Google Scholar]
  75. Larasati, A.; DeYong, C.; Slevitch, L. Comparing Neural Network and Ordinal Logistic Regression to Analyze Attitude Responses. Serv. Sci. 2011, 3, 304–312. [Google Scholar] [CrossRef] [Green Version]
  76. Chan, F.T.S.; Chong, A.Y.L. A SEM-neural network approach for understanding determinants of interorganizational system standard adoption and performances. Decis. Support Syst. 2012, 54, 621–630. [Google Scholar] [CrossRef]
  77. Nisbet, R.; Miner, G.; Elder, J. Handbook of Statistical Analysis and Data Mining Applications; Elsevier: Burlington, MA, USA, 2009. [Google Scholar]
  78. Svozil, D.; Kvasnicka, V.; Pospichal, J. Introduction to multi-layer feed-forward neural networks. Chemom. Intell. Lab. Syst. 1997, 39, 43–62. [Google Scholar] [CrossRef]
  79. Gutiérrez, P.A.; Pérez-Ortiz, M. Sánchez-Monedero, J.; Fernández-Navarro, F.; Hervás-Martínez, C. Ordinal Regression Methods: Survey and Experimental Study. IEEE Trans. Knowl. Data Eng. 2016, 28, 127–146. [Google Scholar]
  80. Norušis, M.J. IBM SPSS Statistics 19 Advanced Statistical Procedures Companion; Prentice Hall: Upper Saddle River, NJ, USA, 2012. [Google Scholar]
  81. Ranganathan, P.; Pramesh, C.S.; Aggarwal, R. Common pitfalls in statistical analysis: Logistic regression. Perspect. Clin. Res. 2017, 8, 148–151. [Google Scholar]
  82. Kumar, K. Users’ Satisfaction on SC/ST Book Bank Scheme through Ordinal Logistic Regression Analysis. Libr. Philos. Pract. 2021, 5644, 1–22. [Google Scholar]
  83. Huang, W.; Stokes, J.W. MtNet: A Multi-Task Neural Network for Dynamic Malware Classification. In Detection of Intrusions and Malware, and Vulnerability Assessment; DIMVA 2016, Lecture Notes in Computer Science; Caballero, J., Zurutuza, U., Rodríguez, R., Eds.; Springer: Cham, Switzerland, 2016; Volume 9721. [Google Scholar]
  84. Nielsen, M.A. Neural Networks and Deep Learning; Springer: Cham, Switzerland, 2018. [Google Scholar]
  85. Du, K.-L.; Swamy, M.N.S. Neural Networks and Statistical Learning, 2nd ed.; Springer: London, UK, 2019. [Google Scholar]
  86. Mas, J.F.; Flores, J.J. The application of artificial neural networks to the analysis of remotely sensed data. Int. J. Remote Sens. 2008, 29, 617–663. [Google Scholar] [CrossRef]
  87. Ghana Sheila, K.; Deepak, S.N. Review on Methods to Fix Number of Hidden Neurons in Neural networks. Math. Probl. Eng. 2013, 2013, 425740. [Google Scholar]
  88. Stathakis, D. How Many Hidden Layers and Nodes. Int. J. Remote Sens. 2009, 30, 2133–2147. [Google Scholar] [CrossRef]
  89. Thomas, A.J.; Petridis, M.; Walters, S.D.; Gheytassi, S.M.; Morgan, R.E. On Predicting the Optimal Number of Hidden Nodes. In Proceedings of the 2015 International Conference on Computational Science and Computational Intelligence (CSCI), Las Vegas, NV, USA, 7–9 December 2015; pp. 565–570. [Google Scholar]
  90. Huang, C.-B.; Babri, H.A. Upper Bounds on the Number of Hidden Neurons in Feedforward Networks with Arbitrary Bounded Nonlinear Activation Functions. IEEE Trans. Neural Netw. 1998, 9, 224–229. [Google Scholar]
  91. Huang, C.-B. Learning Capability and Storage Capacity of Two-Hidden-Layer Feedforward Networks. IEEE Trans. Neural Netw. 2003, 14, 274–281. [Google Scholar]
  92. Cheng, J.; Wang, Z.; Pollastri, G. A neural network approach to ordinal regression. In Proceedings of the 2008 IEEE International Joint Conference on Neural Networks (IEEE World Congress on Computational Intelligence), Hong Kong, China, 1–8 June 2008; pp. 1279–1284. [Google Scholar]
  93. Arnastauskaitė, J.; Ruzgas, T.; Bražėnas, M. A New Goodness of Fit Test for Multivariate Normality and Comparative Simulation Study. Mathematics 2021, 9, 3003. [Google Scholar] [CrossRef]
  94. Erlemann, R.; Lindqvist, B.H. Conditional Goodness-of-Fit Tests for Discrete Distributions. J. Stat. Theory Pract. 2022, 16, 8. [Google Scholar]
  95. IBM. SPSS Modeler 18 Algorithms Guide. Available online: http://public.dhe.ibm.com/software/analytics/spss/documentation/modeler/18.0/en/AlgorithmsGuide.pdf (accessed on 1 October 2022).
  96. Flach, P. Machine Learning: The Art and Science of Algorithms That Make Sense of Data; Cambridge University Press: Cambridge, UK, 2012. [Google Scholar]
  97. Pinto, L.; Gopalan, S.; Balasubramaniam, P. Quantification on the generalization performance of deep neural network with tychonoff separation axioms. Inf. Sci. 2022, 608, 262–285. [Google Scholar] [CrossRef]
  98. Hand, D.J.; Till, R.J. A Simple Generalisation of the Area under the ROC Curve for Multiple Class Classification Problems. Mach. Learn. 2001, 45, 171–186. [Google Scholar]
  99. Lee, R.; Chen, I.-Y. The Time Complexity Analysis of Neural Network Model Configurations. In Proceedings of the 2020 International Conference on Mathematics and Computers in Science and Engineering (MACISE), Madrid, Spain, 18–20 January 2020; pp. 178–183. [Google Scholar]
  100. Tabachnick, B.G.; Fidell, L.S. Using Multivariate Statistics, 6th ed.; Pearson Education: Upper Saddle River, NJ, USA, 2013. [Google Scholar]
  101. Tufféry, S. Data Mining and Statistics for Decision Making; John Wiley & Sons: Chichester, UK, 2011. [Google Scholar]
  102. Sesay, R.B.; Kpangay, M.; Seppeh, S. An Ordinal Logistic Regression Model to Identify Factors Influencing Students Academic Performance at Njala University. Int. J. Res. Sci. Innov. 2021, 8, 91–100. [Google Scholar] [CrossRef]
  103. Menard, S. Applied Logistic Regression Analysis, 2nd ed.; Sage: New York, NY, USA, 2002; Volume 106. [Google Scholar]
  104. O’Connell, A.A. Logistic Regression Models for Ordinal Response Variables; Sage Publications: Thousand Oaks, CA, USA, 2006. [Google Scholar]
  105. Spais, G.; Vasileiou, K. An ordinal regression analysis for the explanation of consumer overall satisfaction in the food-marketing context: The managerial implications to consumer strategy management at a store level. J. Database Mark. Cust. Strategy Manag. 2006, 14, 51–73. [Google Scholar] [CrossRef] [Green Version]
  106. Louviere, J.J.; Hensher, D.A.; Swait, J. Stated Choice Methods Analysis and Applications; Cambridge University Press: Cambridge, UK, 2000. [Google Scholar]
  107. Frauke, G.; Fritsch, S. Neuralnet: Training of Neural Networks. R J. 2010, 2, 30–38. [Google Scholar]
  108. Riedmiller, M.; Braun, H. A direct adaptive method for faster backpropagation learning: The RPROP algorithm. In Proceedings of the IEEE International Conference on Neural Networks, San Francisco, CA, USA, 28 March–1 April 1993; pp. 586–591. [Google Scholar]
  109. Williams, G. Data Mining with Rattle and R: The Art of Excavating Data for Knowledge Discovery; Springer: New York, NY, USA, 2011. [Google Scholar]
  110. Wendler, T.; Gröttrup, S. Data Mining with SPSS Modeler, 2nd ed.; Springer International Publishing: Cham, Switzerland, 2020. [Google Scholar]
  111. Laursen, K.; Salter, A. Searching high and low: What types of firms use universities as a source of innovation? Res. Policy 2004, 33, 1201–1215. [Google Scholar] [CrossRef]
  112. De las Heras-Rosas, C.; Herrera, J. Research Trends in Open Innovation and the Role of the University. J. Open Innov. Technol. Mark. Complex. 2021, 7, 29. [Google Scholar] [CrossRef]
  113. Haidar, H.; Evrard Samuel, K.; Boujut, J.-F. Influential factors of initiating open innovation collaboration between universities and SMEs: Systematic Literature Review. In Proceedings of the EURAM 2019 Exploring the Future of Management, Lisbon, Portugal, 26–28 June 2019; p. hal-02184337. [Google Scholar]
  114. Ankrah, S.N.; Burgess, T.F.; Grimshaw, P.; Shaw, N.E. Asking both university and industry actors about their engagement in knowledge transfer: What single-group studies of motives omit. Technovation 2013, 33, 50–65. [Google Scholar] [CrossRef]
  115. Arza, V. Channels, benefits and risks of public-private interactions for knowledge transfer: Conceptual framework inspired by Latin America. Sci. Public Policy 2010, 37, 473–484. [Google Scholar] [CrossRef]
  116. West, J. Localized Knowledge Flows and Asymmetric Motivations in Open Innovation. J. Innov. Econ. 2020, 2, 181–196. [Google Scholar] [CrossRef]
  117. Bruneel, J.; D’Este, P.; Salter, A. Investigating the factors that diminish the barriers to university-industry collaboration. Res. Policy 2010, 39, 858–868. [Google Scholar] [CrossRef]
  118. Ferreras-Méndez, J.L.; Newell, S.; Fernández-Mesa, A.; Alegre, J. Depth and breadth of external knowledge search and performance: The mediating role of absorptive capacity. Ind. Mark. Manag. 2015, 47, 86–97. [Google Scholar] [CrossRef]
  119. Torres de Oliveira, R.; Gentile-Lüdecke, S.; Figueira, S. Barriers to innovation and innovation performance: The mediating role of external knowledge search in emerging economies. Small. Bus. Econ. 2022, 58, 1953–1974. [Google Scholar] [CrossRef]
  120. Marzi, G.; Manesh, M.F.; Caputo, A.; Pellegrini, M.M.; Vlačić, B. Do or do not. Cognitive configurations affecting open innovation adoption in SMEs. Technovation 2022, 119, 102585. [Google Scholar] [CrossRef]
  121. Gilsing, V.; Bekkers, R.; De Bodas Freitas, I.M.; Van der Steen, M. Differences in technology transfer between science-based and development-based industries: Transfer mechanisms and barriers. Technovation 2011, 31, 638–647. [Google Scholar] [CrossRef]
  122. Meissner, D.; Carayannis, E.G. Value generation from industry-science linkages in light of targeted open innovation. J. Knowl. Manag. 2017, 21, 295–307. [Google Scholar]
  123. Maietta, O.W. Determinants of university-firm R&D collaboration and its impact on innovation: A perspective from a low-tech industry. Res. Policy 2015, 44, 1341–1359. [Google Scholar]
  124. Verbano, C.; Crema, M.; Venturini, K. The Identification and Characterization of Open Innovation Profiles in Italian Small and Medium-sized Enterprises. J. Small Bus. Manag. 2015, 53, 1052–1075. [Google Scholar] [CrossRef]
  125. Bodas Freitas, I.M.; Geuna, A.; Rossi, F. Finding the right partners: Institutional and personal modes of governance of university-industry interactions. Res. Policy 2013, 41, 50–62. [Google Scholar] [CrossRef] [Green Version]
  126. Kanama, D.; Nishikawa, K. What type of obstacles in innovation activities make firms access university knowledge? An empirical study of the use of university knowledge on innovation outcomes. J. Technol. Transf. 2017, 42, 141–157. [Google Scholar] [CrossRef]
  127. Cao, W.; Mirjalili, V.; Raschka, S. Rank Consistent Ordinal Regression for Neural Networks with Application to Age Estimation. Pattern Recognit. Lett. 2020, 140, 325–331. [Google Scholar] [CrossRef]
  128. Sharifi, H.; Liu, W.; Ismail, F.S. Higher education system and the ‘open’ knowledge transfer: A view from perception of senior managers at university knowledge transfer offices. Stud. High. Educ. 2014, 39, 1860–1884. [Google Scholar] [CrossRef]
Figure 2. Research framework constructs.
Mathematics 11 01671 g002
Figure 3. The two-stage ordinal regression and neural network approaches.
Mathematics 11 01671 g003
Figure 5. The architecture of the proposed TLFN(15,8) model.
Mathematics 11 01671 g005
Table 1. Sample information.
Survey Design
Data collection methodSelf-administered survey
Sampling design Purposive sampling
Total responses/Accepted responses100/98
Sample Attributes
(a) Industry type
Type of industryFrequency (%)
1 = High-tech industry (electronics) 12.24
2 = Medium high-tech industry (automotive)38.78
3 = Low-tech industry (jewelry)48.98
(b) Firm size
Size classFrequency (%)
1 = Small and medium-sized enterprises
(10 to 249 employees)
59.18
2 = Large enterprises
(250+ employees)
40.82
Table 2. Parameter estimates for the ordinal regression model.
EstimateStd. ErrorWalddfSig.95% Confidence Interval
Lower BoundUpper Bound
Threshold[y = 1.00]−3.2130.93511.81110.001−5.045−1.381
[y = 2.00]−1.8940.7226.87110.009−3.309−0.478
[y = 3.00]0.3610.6770.28510.593−0.9651.688
[y = 4.00]2.8990.76514.34010.0001.3984.399
Locationx10.3610.07921.14610.0000.2070.515
x2−0.0260.0480.29710.586−0.1200.068
x30.2200.06511.59610.00060.0930.347
x4−0.9170.6152.22110.136−2.1220.289
[x5 = 1.00]−0.6030.8060.55910.454−2.1830.977
[x5 = 2.00]0.0430.6050.00510.943−1.1431.229
[x5 = 3.00]0 a..0...
Link function: complementary log-log.
a This parameter is set to zero because it is redundant (see Table 1 for the codification of the firm size and industry type, i.e., the x4 and x5 variables).
Table 3. The performance measures of the best SLFN and TLFN models.
MLP ModelArchitectureNumber of NeuronsAccuracy AUC-ROC
TrainingValidationTestTrainingValidationTest
SLFN1 hidden layer4179.687%70.588%52.941%0.8940.7940.796
TLFN1st hidden layer 1582.812%76.47%70.588%0.9000.8580.881
2nd hidden layer8
Table 4. The 10-fold cross-validation results.
StatisticPartitionFoldMeanStandard Deviation
12345678910
Accuracy (%)Training87.50067.04586.36485.39365.90981.81882.02281.81880.68262.50078.105 (%)8.796 (%)
Test50.00070.00060.00066.66760.00070.00066.66760.00070.00060.00063.333 (%)6.146 (%)
AUC-ROCTraining0.9340.8670.9370.9310.8420.9200.9190.8850.9140.8450.89940.0348
Test0.7540.8000.7220.6250.8330.8880.9160.8500.7770.6940.78590.0856
Disclaimer/Publisher’s Note: The statements, opinions and data contained in all publications are solely those of the individual author(s) and contributor(s) and not of MDPI and/or the editor(s). MDPI and/or the editor(s) disclaim responsibility for any injury to people or property resulting from any ideas, methods, instructions or products referred to in the content.

