
X-STATIS: A Multivariate Approach to Characterize the Evolution of E-Participation, from a Global Perspective


 ,
, 
Abstract
:1. Introduction
2. Literature Review
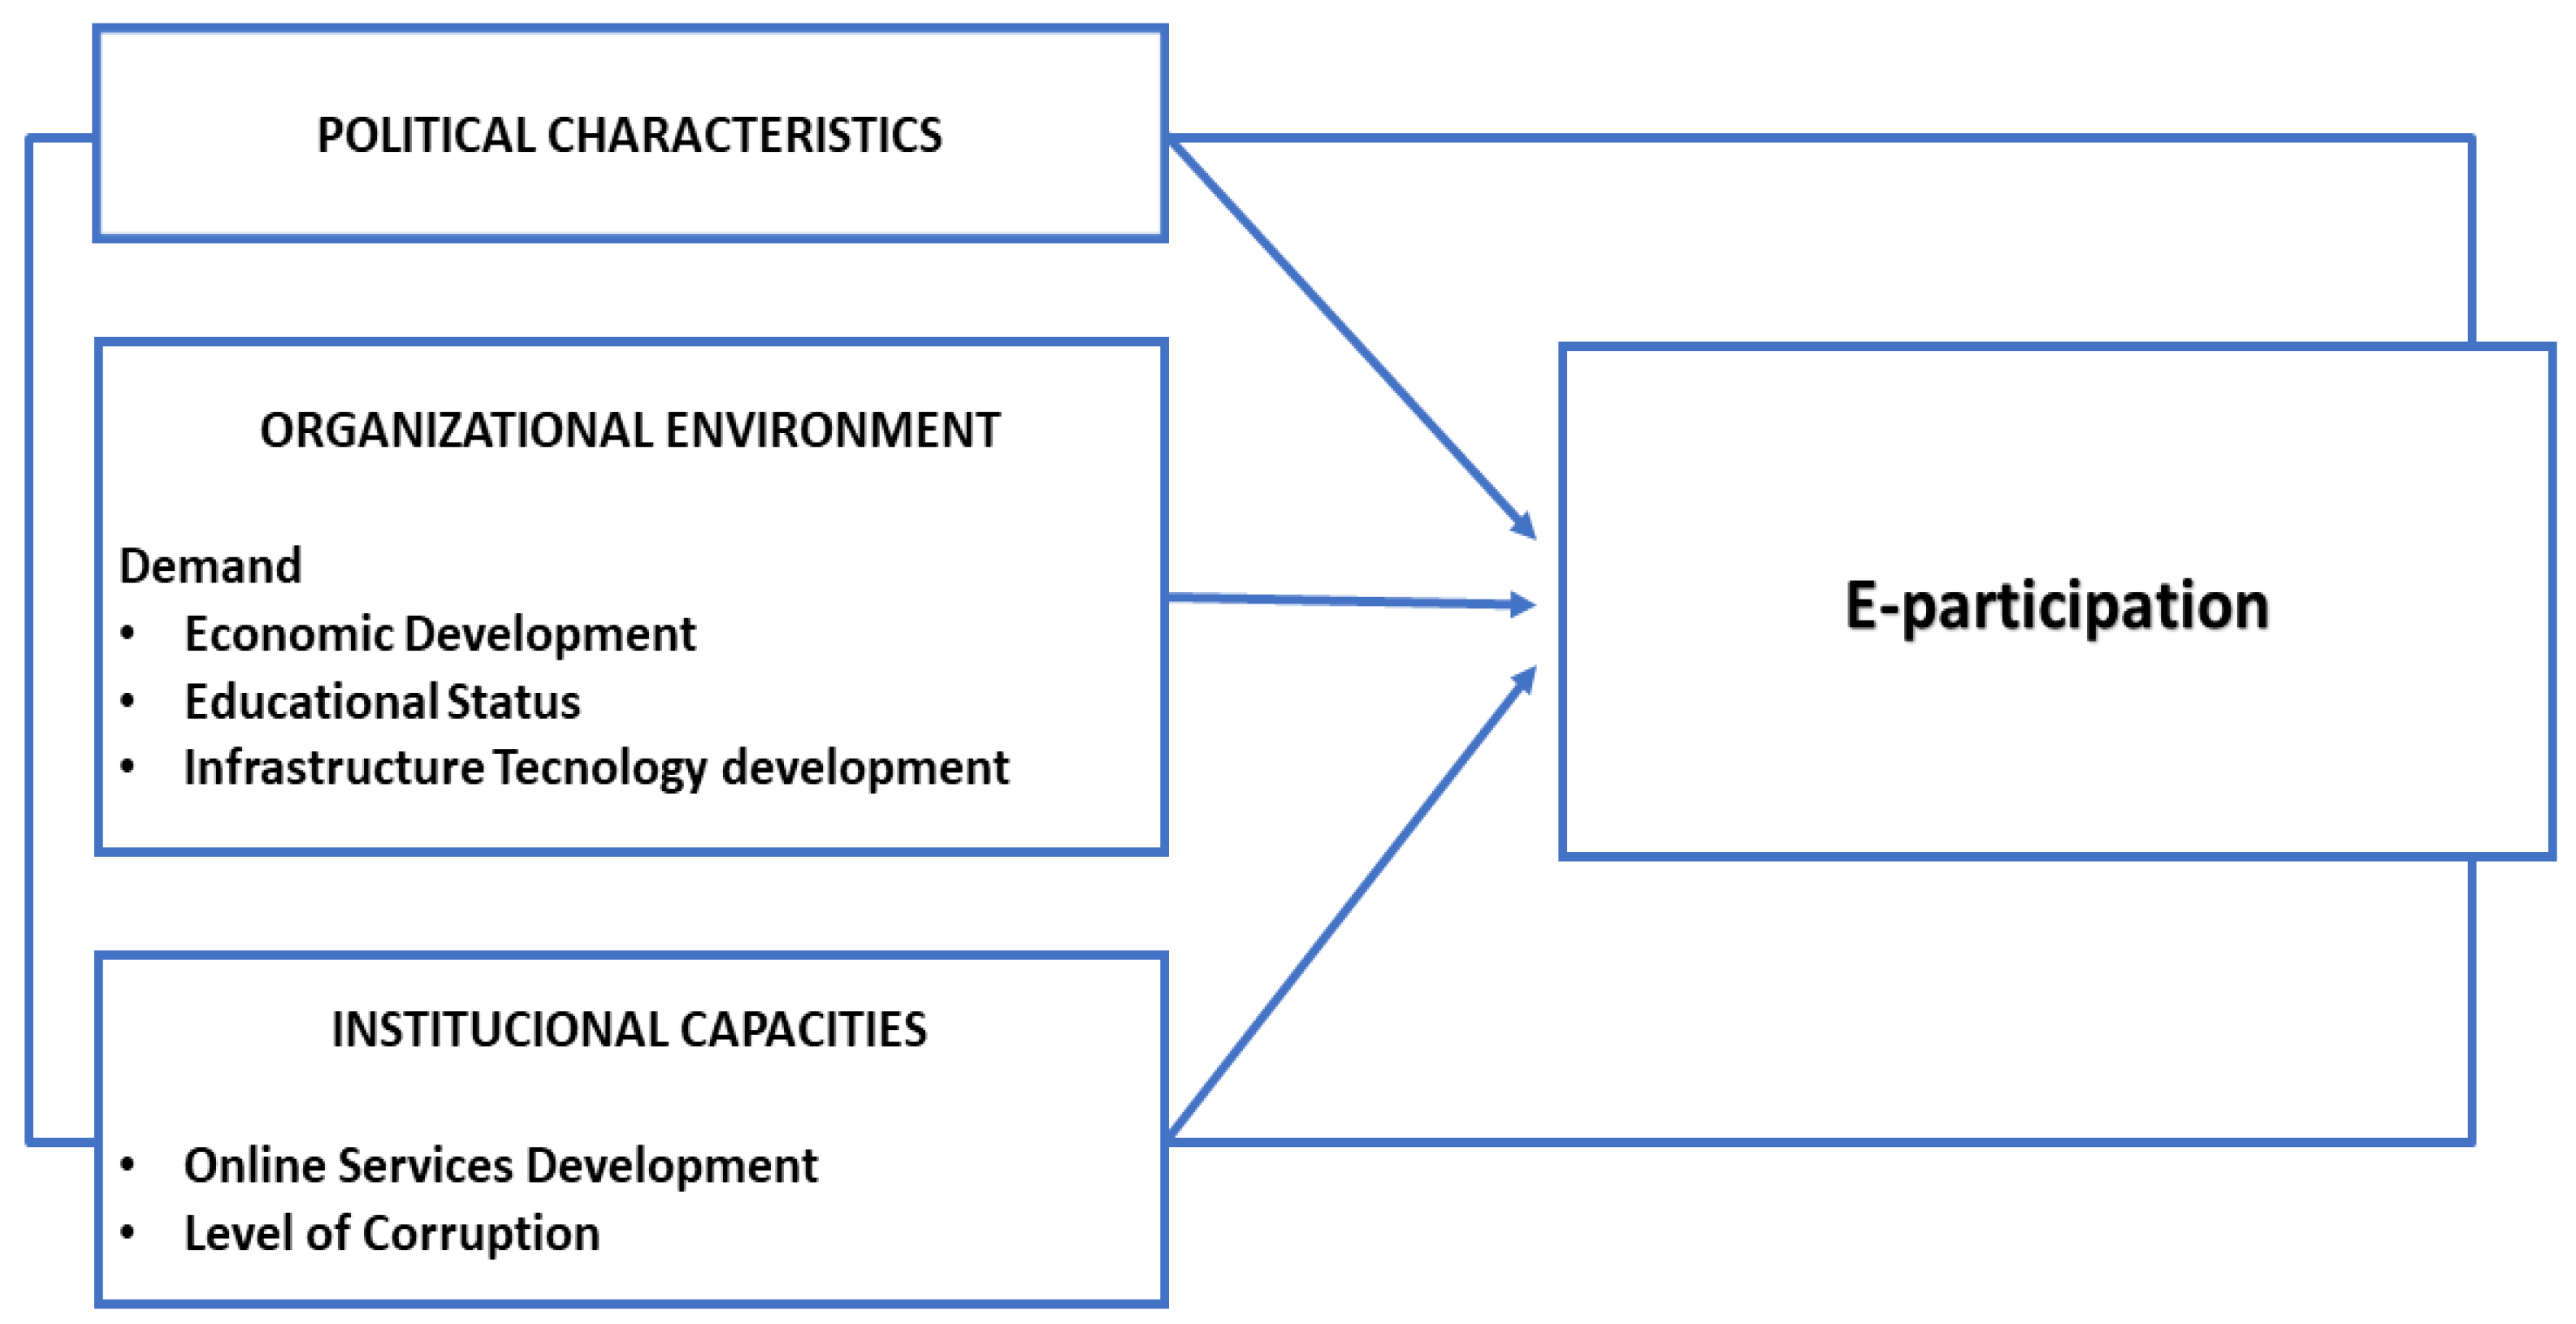
2.1. Political Characteristics
2.2. Organizational Environment
2.3. Political Characteristics
3. Materials and Methods
3.1. Population and Data
3.2. Methodology
3.2.1. X-STATIS
3.2.2. Cluster Analysis
4. Results
5. Discussion
6. Conclusions
Author Contributions
Funding
Data Availability Statement
Conflicts of Interest
Appendix A

| Indicator Code | Description |
|---|---|
| Dependent Variable | |
| e-participation index (EPI). | It is a complementary index to the United Nations E-government Survey. It focuses on the use of online services to facilitate the provision of information by governments to citizens (“electronic information exchange”), interaction with stakeholders (“electronic consultation”), and participation in decision-making (“electronic decision making”) (UN, [47]). |
| Political Factors | |
| Political Constraint Index (POLIII). | Estimates the feasibility of policy change (the extent to which a change in the preferences of any actor can lead to a change in government policy) [49,50]. |
| Organizacional Environment | |
| Human Capital Index (HCI). | It shows the aggregate level of education of a country, it is made up of two indicators: the adult literacy rate and the combined gross rate of primary, secondary and tertiary enrollment. |
| Gross domestic product per capita (GDP). | GDP per capita (WB, [48]). |
| Telecommunication Infrastructure Index (TII). | Evidence of the economic and ICT development of a country (UN, [47]). |
| Institutional Capacities | |
| Online Service Index (OSI). | Demonstrates the scope and quality of online services (UN, [47]). |
| Corruption Perception Index (CPI). | It is elaborated with the perception of its levels of corruption, coming from businesses, political analysts and the public. (TI, [44]). |
References
- Font, J. Nuevos Mecanismos Participativos y Democracia Participativa. In Proceedings of the Jornadas Sobre Democracia Participativa, Valencia, Spain, June 2003; Available online: 267235725_NUEVOS_MECANISMOS_PARTICIPATIVOS_Y_DEMOCRACIA_PARTICIPATIVA (accessed on 18 February 2023).
- United Nations. Global E-Government Survey 2003; UN: New York, NY, USA, 2003. [Google Scholar]
- Royo, S.; Pina, V.; Garcia-Rayado, J. Decide Madrid: A Critical Analysis of an Award-Winning e-Participation Initiative. Sustainability 2020, 12, 1674. [Google Scholar] [CrossRef] [Green Version]
- Pina, V.; Torres, L.; Acerete, B. Are ICTs Promoting Government Accountability?: A Comparative Analysis of e-Governance Developments in 19 OECD Countries. Crit. Perspect. Account. 2007, 18, 583–602. [Google Scholar] [CrossRef]
- García-Sánchez, I.-M.; Rodríguez-Domínguez, L.; Gallego-Álvarez, I. The Relationship between Political Factors and the Development of E–Participatory Government. Inf. Soc. 2011, 27, 233–251. [Google Scholar] [CrossRef]
- Tolbert, C.J.; Mossberger, K. The Effects of E-Government on Trust and Confidence in Government. Public Adm. Rev. 2006, 66, 354–369. [Google Scholar] [CrossRef]
- Zúñiga, R.P.; Castillo, O.C.; Mena Hernández, E.; Cervantes, G.A. Análisis General Del Gobierno Electrónico En México. Rev. Tecnol. Soc. 2015, 5, 1–10. [Google Scholar]
- Justice, J.B.; Melitski, J.; Smith, D.L. E-Government as an Instrument of Fiscal Accountability and Responsiveness: Do the Best Practitioners Employ the Best Practices? Am. Rev. Public Adm. 2006, 36, 301–322. [Google Scholar] [CrossRef]
- Torres, L.; Pina, V.; Acerete, B. E-Government Developments on Delivering Public Services among EU Cities. Gov. Inf. Q. 2005, 22, 217–238. [Google Scholar] [CrossRef]
- Jasimuddin, S.M.; Mishra, N.; Saif Almuraqab, N.A. Modelling the Factors That Influence the Acceptance of Digital Technologies in E-Government Services in the UAE: A PLS-SEM Approach. Prod. Plan. Control 2017, 28, 1307–1317. [Google Scholar] [CrossRef]
- Siau, K.; Long, Y. Using Social Development Lenses to Understand E-Government Development. J. Glob. Inf. Manag. 2006, 14, 47–62. [Google Scholar] [CrossRef] [Green Version]
- West, D.M. E-Government and the Transformation of Service Delivery and Citizen Attitudes. Public Adm. Rev. 2004, 64, 15–27. [Google Scholar] [CrossRef]
- Pérez, C.C.; López Hernández, A.M.; Pedro Rodríguez Bolívar, M. Citizens’ Access to on-Line Governmental Financial Information: Practices in the European Union Countries. Gov. Inf. Q. 2005, 22, 258–276. [Google Scholar] [CrossRef]
- Torres, L.; Pina, V.; Royo, S. E-government and the Transformation of Public Administrations in EU Countries. Online Inf. Rev. 2005, 29, 531–553. [Google Scholar] [CrossRef]
- Christou, G.; Simpson, S. New Governance, the Internet, and Country Code Top-Level Domains in Europe. Governance 2009, 22, 599–624. [Google Scholar] [CrossRef] [Green Version]
- Laswad, F.; Fisher, R.; Oyelere, P. Determinants of Voluntary Internet Financial Reporting by Local Government Authorities. J. Account. Public Policy 2005, 24, 101–121. [Google Scholar] [CrossRef]
- Cárcaba, A.; García, J.G. Determinantes de La Divulgación de Información Contable a Través de Internet Por Parte de Los Gobiernos Locales. Span. J. Financ. Account.—Rev. Española Financ. Contab. 2008, 37, 63–84. [Google Scholar] [CrossRef]
- Kim, C.-K. A Cross-National Analysis of Global E-Government. Public Organ. Rev. 2007, 7, 317–329. [Google Scholar] [CrossRef]
- Gandía, J.L.; Archidona, M.C. Determinants of Web Site Information by Spanish City Councils. Online Inf. Rev. 2008, 32, 35–57. [Google Scholar] [CrossRef]
- Gallego-Álvarez, I.; Rodríguez-Domínguez, L.; García-Sánchez, I.-M. Are Determining Factors of Municipal E-Government Common to a Worldwide Municipal View? An Intra-Country Comparison. Gov. Inf. Q. 2010, 27, 423–430. [Google Scholar] [CrossRef]
- García-Sánchez, I.-M.; Rodríguez-Domínguez, L.; Frias-Aceituno, J.-V. Evolutions in E-Governance: Evidence from Spanish Local Governments. Environ. Policy Gov. 2013, 23, 323–340. [Google Scholar] [CrossRef]
- Stier, S. Political Determinants of E-Government Performance Revisited: Comparing Democracies and Autocracies. Gov. Inf. Q. 2015, 32, 270–278. [Google Scholar] [CrossRef]
- García-Sánchez, I.-M.; Frías-Aceituno, J.-V.; Rodríguez-Domínguez, L. Determinants of Corporate Social Disclosure in Spanish Local Governments. J. Clean. Prod. 2013, 39, 60–72. [Google Scholar] [CrossRef]
- Navarro-Galera, A.; Alcaraz-Quiles, F.J.; Ortiz-Rodriguez, D. Enhancing Sustainability Transparency in Local Governments—An Empirical Research in Europe. Sustainability 2018, 10, 2161. [Google Scholar] [CrossRef] [Green Version]
- Rodríguez Domínguez, L.; García Sánchez, I.M.; Gallego Álvarez, I. Determining Factors of E-Government Development: A Worldwide National Approach. Int. Public Manag. J. 2011, 14, 218–248. [Google Scholar] [CrossRef]
- Alathur, S.; Vigneswara Ilavarasan, P.; Gupta, M.P. Determinants of E-Participation in the Citizens and the Government Initiatives: Insights from India. Socio-Econ. Plan. Sci. 2016, 55, 25–35. [Google Scholar] [CrossRef]
- Krishnan, S.; Teo, T.S.H.; Lymm, J. Determinants of Electronic Participation and Electronic Government Maturity: Insights from Cross-Country Data. Int. J. Inf. Manag. 2017, 37, 297–312. [Google Scholar] [CrossRef]
- Macintosh, A.; Whyte, A. Towards an Evaluation Framework for EParticipation. Transform. Gov. People Process Policy 2008, 2, 16–30. [Google Scholar] [CrossRef] [Green Version]
- Serov, I.; Leitner, M. An Experimental Approach to Reputation in E-Participation. In Proceedings of the 2016 International Conference on Software Security and Assurance (ICSSA), St. Polten, Austria, 24–25 August 2016; pp. 37–42. [Google Scholar]
- Åström, J.; Karlsson, M.; Linde, J.; Pirannejad, A. Understanding the Rise of E-Participation in Non-Democracies: Domestic and International Factors. Gov. Inf. Q. 2012, 29, 142–150. [Google Scholar] [CrossRef]
- Jho, W.; Song, K.J. Institutional and Technological Determinants of Civil E-Participation: Solo or Duet? Gov. Inf. Q. 2015, 32, 488–495. [Google Scholar] [CrossRef] [Green Version]
- Jaeger, P.T. Deliberative Democracy and the Conceptual Foundations of Electronic Government. Gov. Inf. Q. 2005, 22, 702–719. [Google Scholar] [CrossRef]
- Lee, C.; Chang, K.; Berry, F.S. Testing the Development and Diffusion of E-Government and E-Democracy: A Global Perspective. Public Adm. Rev. 2011, 71, 444–454. [Google Scholar] [CrossRef]
- Pollitt, C.; Bouckeart, G. Many Houses: Types of Politico-Administrative Regime; Oxford University Press: Oxford, UK, 2004. [Google Scholar]
- Grönlund, Å. Connecting EGovernment to Real Government—The Failure of the UN EParticipation Index. In Electronic Government; Springer: Berlin/Heidelberg, Germany, 2011; pp. 26–37. ISBN 978-3-642-22878-0. [Google Scholar]
- Norris, D.F.; Moon, M.J. Advancing E-Government at the Grassroots: Tortoise or Hare? Public Adm. Rev. 2005, 65, 64–75. [Google Scholar] [CrossRef]
- Cheng, R.H. An Empirical Analysis of Theories on Factors Influencing State Government Accounting Disclosure. J. Account. Public Policy 1992, 11, 1–42. [Google Scholar] [CrossRef]
- Tolbert, C.J.; Mossberger, K.; McNeal, R. Institutions, Policy Innovation, and E-Government in the American States. Public Adm. Rev. 2008, 68, 549–563. [Google Scholar] [CrossRef]
- McNeal, R.S.; Tolbert, C.J.; Mossberger, K.; Dotterweich, L.J. Innovating in Digital Government in the American States. Soc. Sci. Q. 2003, 84, 52–70. [Google Scholar] [CrossRef]
- Lee, S.-Y.; Whitford, A.B. Government Effectiveness in Comparative Perspective. J. Comp. Policy Anal. Res. Pract. 2009, 11, 249–281. [Google Scholar] [CrossRef]
- Christiaens, J. Financial Accounting Reform in Flemish Municipalities: An Empirical Investigation. Financ. Account. Manag. 1999, 15, 21–40. [Google Scholar] [CrossRef]
- Allen, B.A.; Juillet, L.; Paquet, G.; Roy, J. E-Governance & Government On-Line in Canada: Partnerships, People & Prospects. Gov. Inf. Q. 2001, 18, 93–104. [Google Scholar] [CrossRef]
- Pina, V.; Torres, L.; Royo, S. Are ICTS Improving Transparency and Accountability in the EU Regional y Local Governments? An Empirical Study. Public Adm. 2007, 85, 449–472. [Google Scholar] [CrossRef]
- TI—Transparency International Research—CPI—Overview. Available online: https://www.transparency.org/research/cpi/overview (accessed on 10 April 2018).
- Bertot, J.C.; Jaeger, P.T.; Grimes, J.M. Using ICTs to Create a Culture of Transparency: E-Government and Social Media as Openness and Anti-Corruption Tools for Societies. Gov. Inf. Q. 2010, 27, 264–271. [Google Scholar] [CrossRef]
- Reddick, C.G.; Chatfield, A.T.; Brajawidagda, U. Open Government Process and Government Transparency in Crisis Communication: The Case of AirAsia QZ8501 Crash. Inf. Polity 2016, 21, 255–271. [Google Scholar] [CrossRef]
- United Nations. UN E-Government Knowledge Database. Available online: https://publicadministration.un.org/egovkb/en-us/ (accessed on 10 April 2018).
- World Bank. World Bank’s Indicators Database 2018. Available online: https://datos.bancomundial.org/indicador (accessed on 4 April 2018).
- POLCONIII. The Political Constraint Index (POLCON) Dataset. Available online: https://mgmt.wharton.upenn.edu/faculty/heniszpolcon/polcondataset/ (accessed on 10 April 2018).
- Henisz, W.J. The Institutional Environment for Economic Growth. Econ. Politics 2000, 12, 1–31. [Google Scholar] [CrossRef] [Green Version]
- Tejedor-Flores, N.; Vicente-Galindo, P.; Galindo-Villardón, P. Sustainability Multivariate Analysis of the Energy Consumption of Ecuador Using MuSIASEM and BIPLOT Approach. Sustainability 2017, 9, 984. [Google Scholar] [CrossRef] [Green Version]
- Amor-Esteban, V.; García-Sánchez, I.-M.; Galindo-Villardón, M.-P. Analysing the Effect of Legal System on Corporate Social Responsibility (CSR) at the Country Level, from a Multivariate Perspective. Soc. Indic. Res. 2017, 140, 435–452. [Google Scholar] [CrossRef]
- Cubilla-Montilla, M.; Nieto-Librero, A.-B.; Galindo-Villardón, M.P.; Vicente Galindo, M.P.; Garcia-Sanchez, I.-M. Are Cultural Values Sufficient to Improve Stakeholder Engagement Human and Labour Rights Issues? Corp. Soc. Responsib. Environ. Manag. 2019, 1–18. [Google Scholar] [CrossRef]
- Rodríguez-Martínez, C.C.; Cubilla-Montilla, M.; Vicente-Galindo, P.; Galindo-Villardón, P. Sparse STATIS-Dual via Elastic Net. Mathematics 2021, 9, 2094. [Google Scholar] [CrossRef]
- Abdi, H.; Williams, L.J.; Valentin, D.; Bennani-Dosse, M. STATIS and DISTATIS: Optimum Multitable Principal Component Analysis and Three Way Metric Multidimensional Scaling. Wiley Interdiscip. Rev. Comput. Stat. 2012, 4, 124–167. [Google Scholar] [CrossRef]
- Jaffrenou, P.A. Sur l’Analyse des Familles Finies des Variables Vectorielles: Bases Algébrique et Application à la Description Statistique; Université de Sainte-Etiene: Sainte-Etiene, France, 1978. [Google Scholar]
- Thioulouse, J.; Chessel, D. Multi-Table Analysis of Ecological Factors. I. From Description of Ecosystem Status to That of Ecosystem Function Using Triadic Analysis. Acta Oecol. Oecol. Gen. 1987, 8, 463–480. [Google Scholar]
- Kroonenberg, P.M. The Analysis of Multiple Tables in Factorial Ecology. III.-Three-Mode Principle Component Analyses: “Analyse Triadique Complète.”. Acta Oecol. Oecol. Gen. 1989, 10, 245–256. [Google Scholar]
- Lavit, C.; Escoufier, Y.; Sabatier, R.; Traissac, P. The ACT (STATIS Method). Comput. Stat. Data Anal. 1994, 18, 97–119. [Google Scholar] [CrossRef]
- Robert, P.; Escoufier, Y. A Unifying Tool for Linear Multivariate Statistical Methods: The RV-Coefficient. Appl. Stat. 1976, 25, 257. [Google Scholar] [CrossRef]
- Thioulouse, J.; Simier, M.; Chessel, D. Simultaneous Analysis of a Sequence of Paired Ecological Tablesx-Statis. Ecology 2004, 85, 272–283. [Google Scholar] [CrossRef]
- Thioulouse, J.; Chessel, D.; Dolédec, S.; Olivier, J.M. ADE-4: A Multivariate Analysis and Graphical Display Software. Stat. Comput. 1997, 7, 75. [Google Scholar] [CrossRef]
- Anderberg, M.R. Cluster Analysis for Applications; Academic Press: Cambridge, MA, USA, 1973. [Google Scholar]
- Ward, J.H. Hierarchical Grouping to Optimize an Objective Function. J. Am. Stat. Assoc. 1963, 58, 236–244. [Google Scholar] [CrossRef]
- Szekely, G.J.; Rizzo, M.L. Hierarchical Clustering via Joint Between-Within Distances: Extending Ward’s Minimum Variance Method. J. Classif. 2005, 22, 151–183. [Google Scholar] [CrossRef]
- Coursey, D.; Norris, D.F. Models of E-Government: Are They Correct? An Empirical Assessment. Public Adm. Rev. 2008, 68, 523–536. [Google Scholar] [CrossRef]
- Gulati, G.J.J.; Williams, C.B.; Yates, D.J. Predictors of On-Line Services and e-Participation: A Cross-National Comparison. Gov. Inf. Q. 2014, 31, 526–533. [Google Scholar] [CrossRef]
- Cooley, A. Examining Development of E-Government in Russia and China: A Comparative Approach. Int. J. Public Adm. 2018, 41, 899–908. [Google Scholar] [CrossRef]


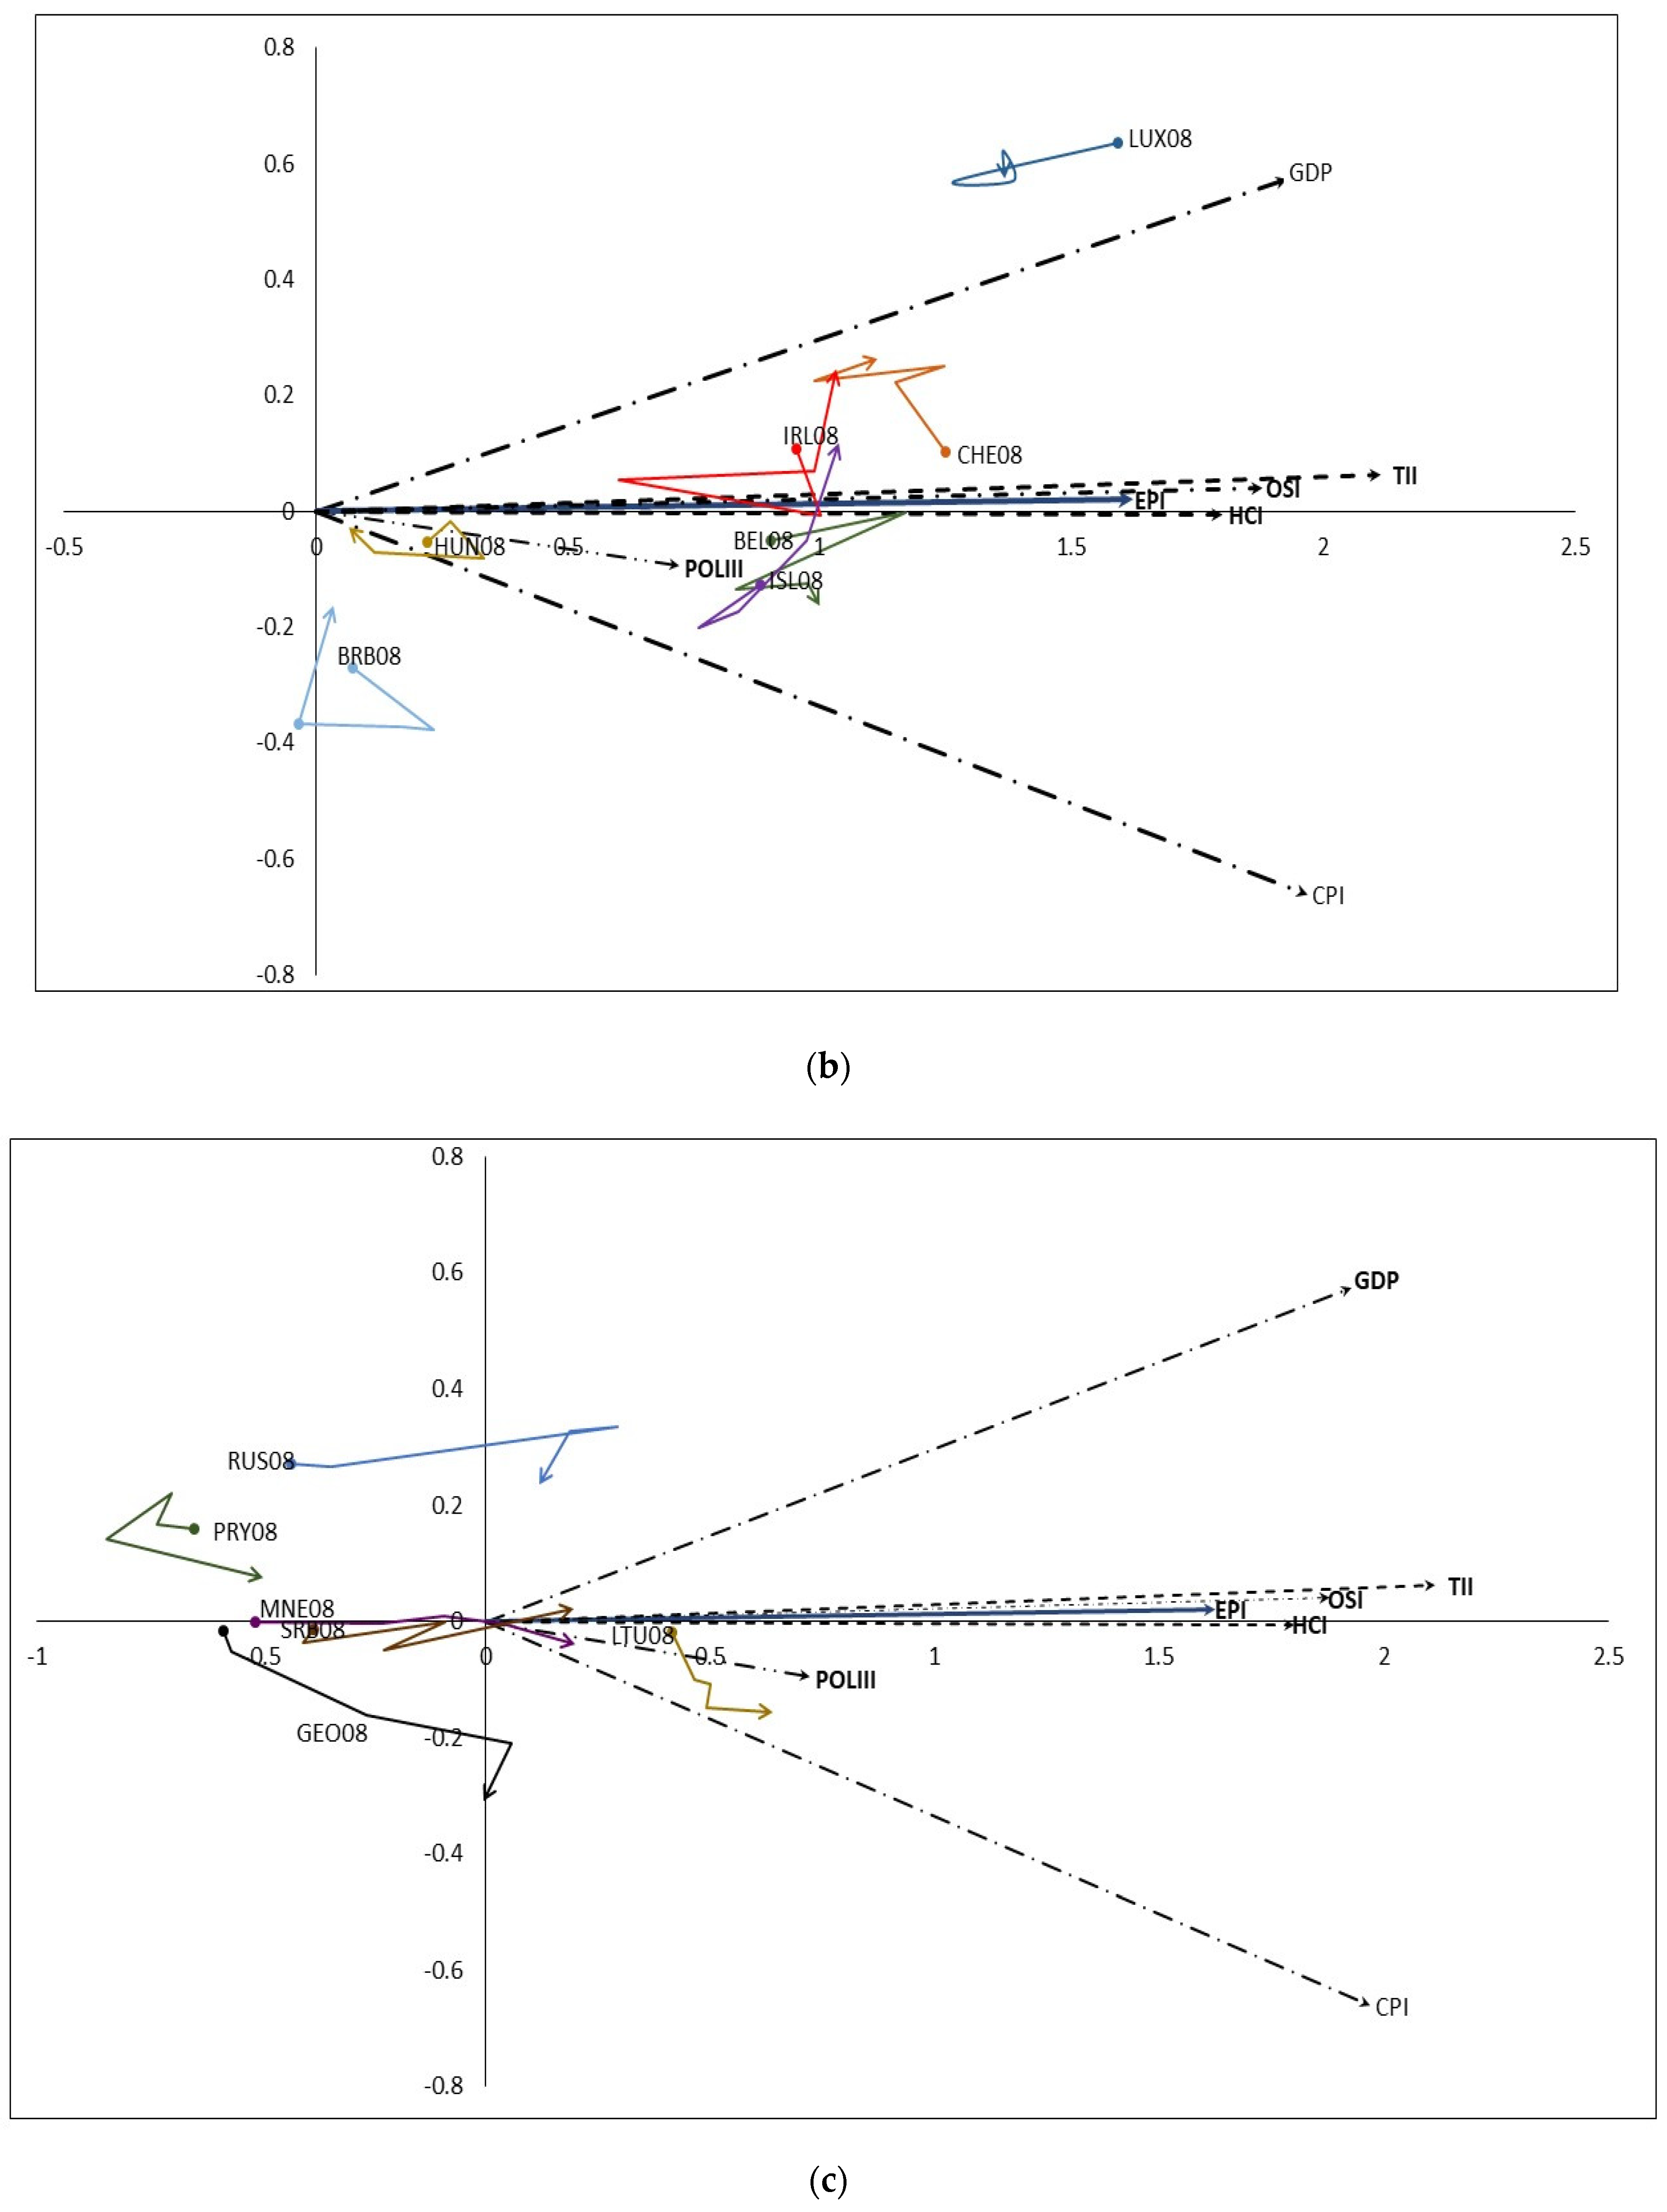
| Axis | Weights | Cos2 |
|---|---|---|
| 2008 | 4.394 × 10⁻¹ | 0.839 |
| 2010 | 4.535 × 10⁻¹ | 0.897 |
| 2012 | 4.534 × 10⁻¹ | 0.895 |
| 2014 | 4.505 × 10⁻¹ | 0.888 |
| 2016 | 4.391 × 10⁻¹ | 0.847 |
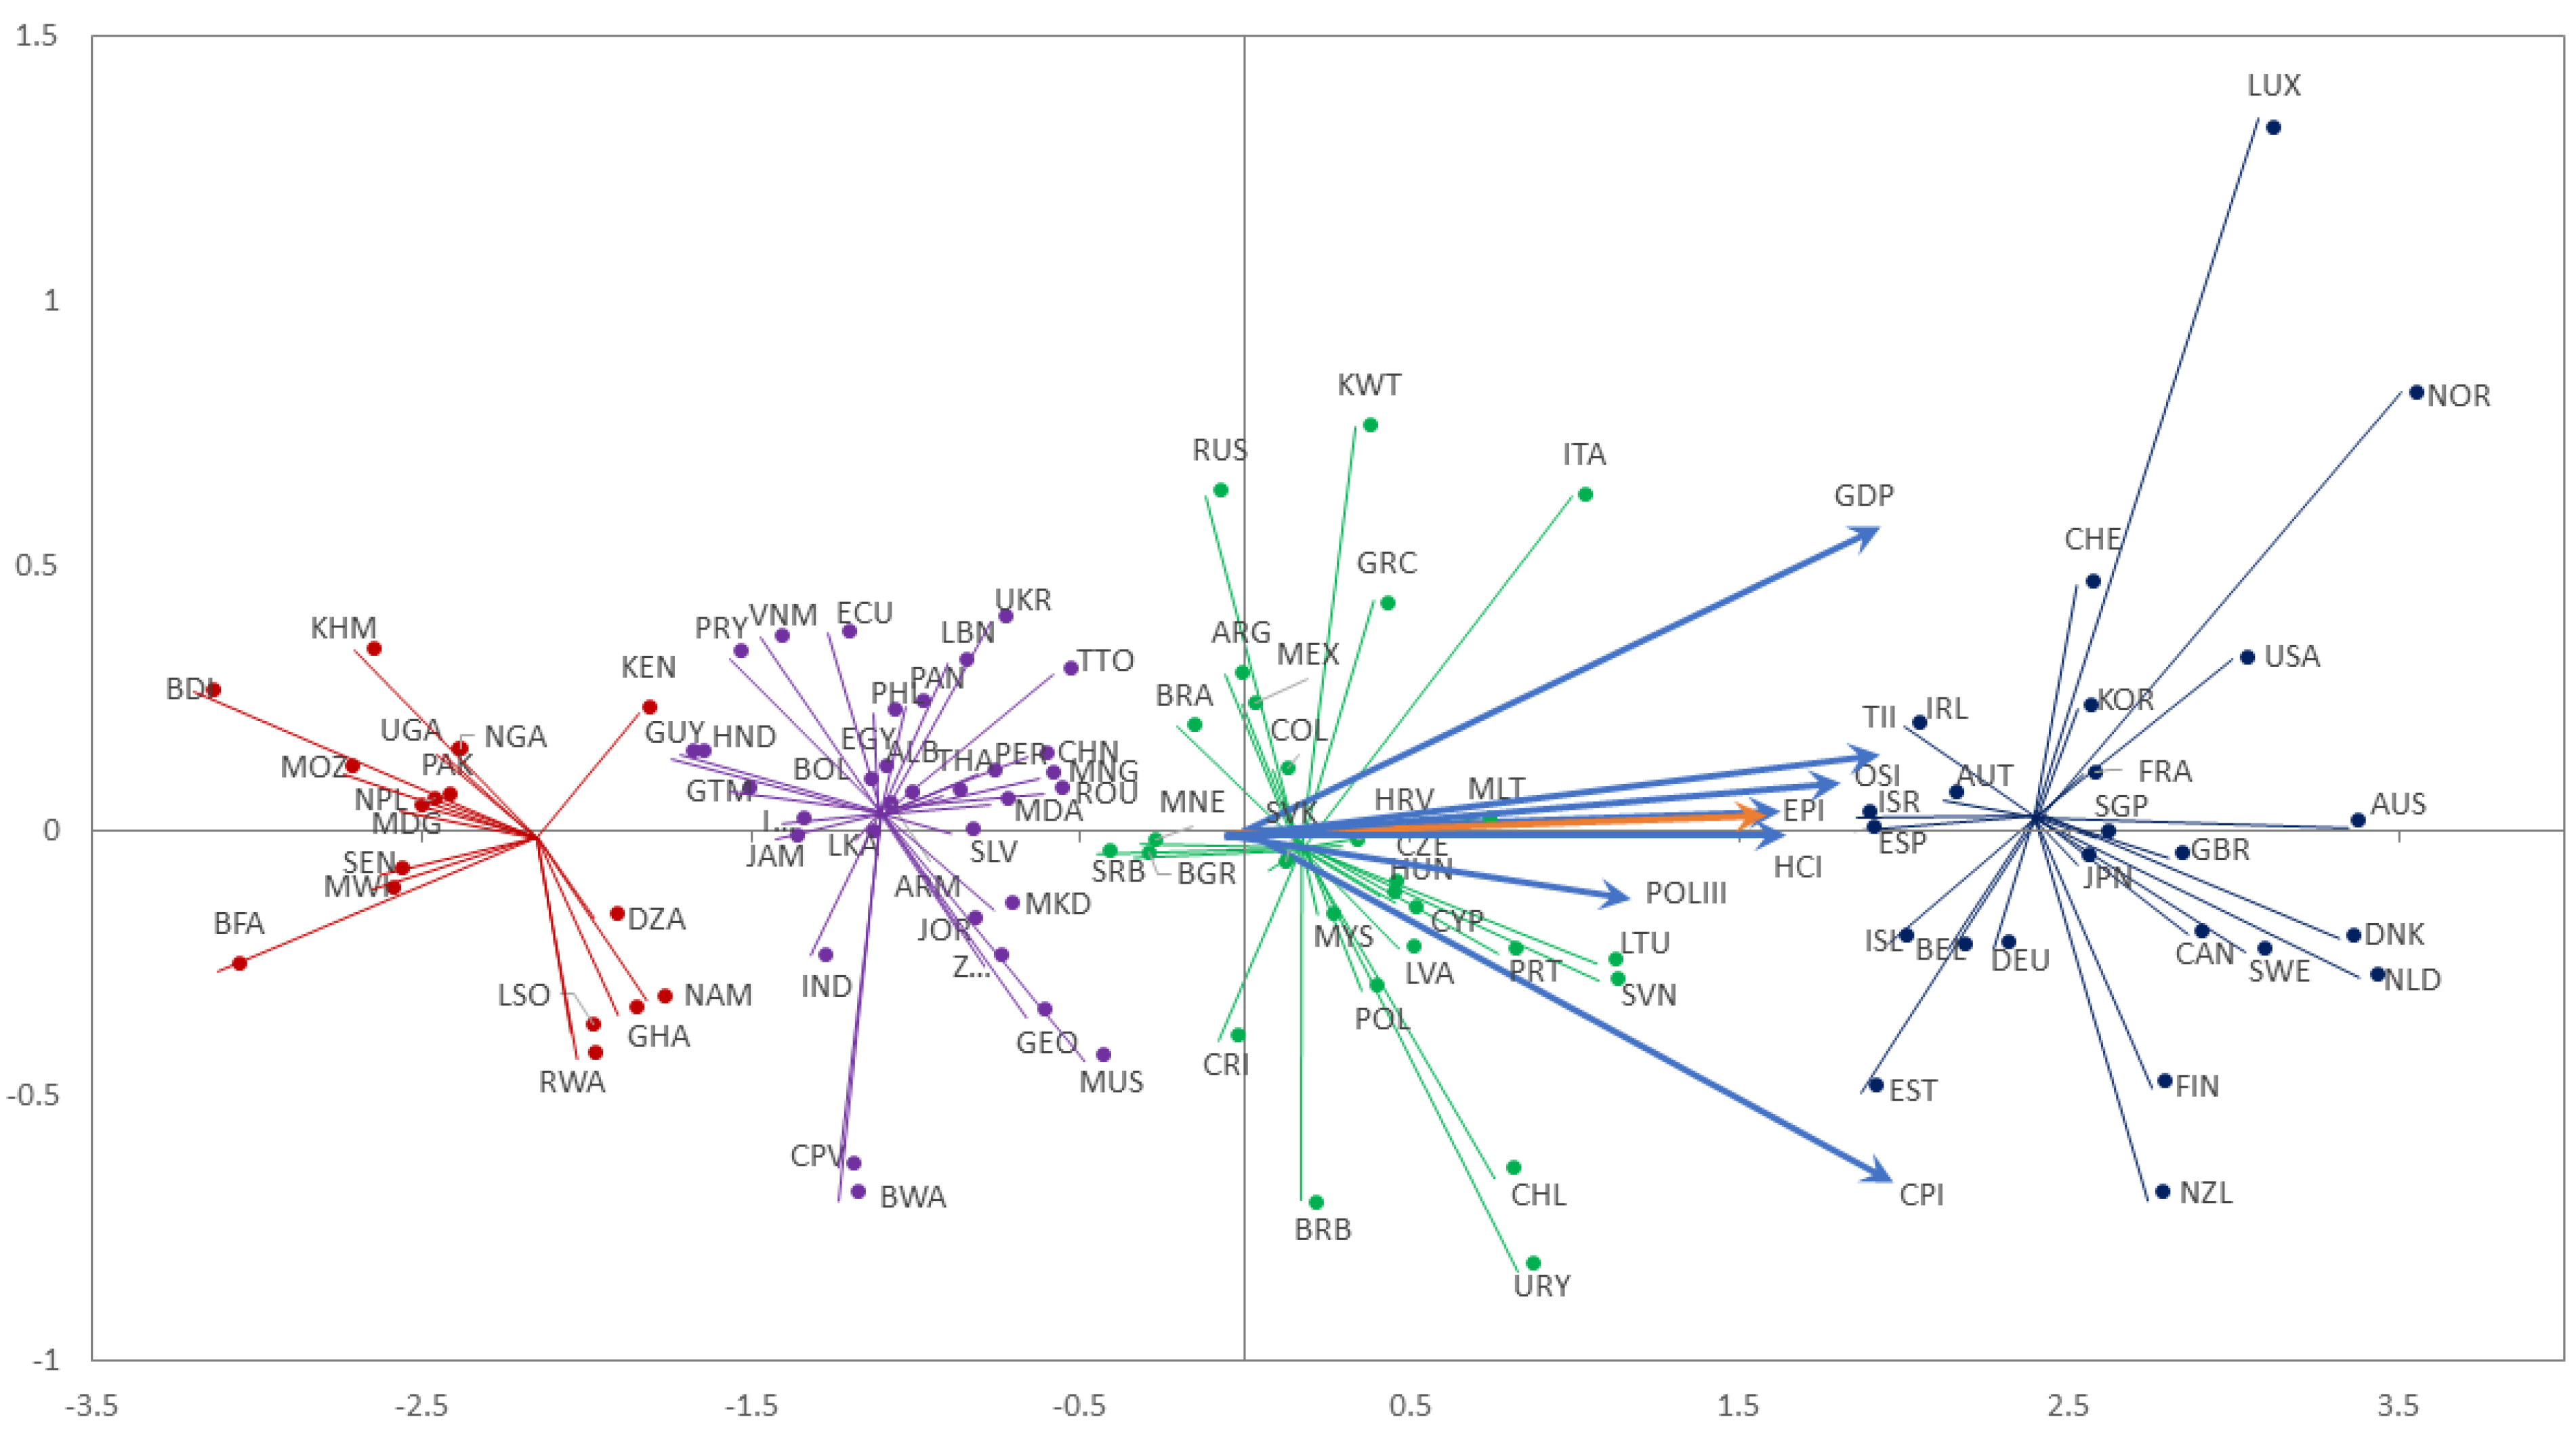
| CLUSTER COMPROMISE | E-PARTICIPATION INDEX LEVEL–2016 | |||
|---|---|---|---|---|
| LOW (Less than 0.25) | MEDIUM (Between 0.25 and 0.50) | HIGH (Between 0.50 and 0.75) | VERY HIGH (More than 0.75) | |
| 1: LOW | Algeria, Burkina Faso, Burundi, Cambodia, Lesotho, Madagascar, Malawi, Mozambique, Namibia, Nigeria, Pakistan, Uganda. | Ghana, Rwanda, Senegal. | Kenya, Nepal. | |
| (12) | (3) | (2) | ||
| 2: MEDIUM | Botswana, Cape Verde, Egypt, Guyana, Honduras, Indonesia, Jamaica, Jordan, Lebanon, Panama, Trinidad and Tobago. | Albania, Armenia, Bolivia, Ecuador, El Salvador, Georgia, Guatemala, Macedonia. Mauritius, Mongolia, Paraguay, Peru, Philippines, the Republic of Moldova, Romania, South Africa, Sri Lanka, Thailand, Vietnam. | China, India, Ukraine. | |
| (11) | (19) | (3) | ||
| 3: HIGH | Barbados, Hungary. | Argentina, Brazil, Bulgaria, Costa Rica, Cyprus, Czech Republic, Greece, Kuwait, Latvia, Malaysia, Portugal, Slovakia, Slovenia, Uruguay. | Chile, Colombia, Croatia, Italy, Lithuania, Malta, Mexico, Poland, Montenegro, Russian Federation, Serbia. | |
| (2) | (14) | (11) | ||
| 4: VERY HIGH | Belgium, Iceland, Ireland, Luxembourg, Switzerland. | Australia, Austria, Canada, Denmark, Estonia, Finland, France, Germany, Israel, Japan, Netherlands, New Zealand, Norway, Singapore, Spain, Sweden, South Korea, United Kingdom, United States. | ||
| (5) | (19) | |||
Disclaimer/Publisher’s Note: The statements, opinions and data contained in all publications are solely those of the individual author(s) and contributor(s) and not of MDPI and/or the editor(s). MDPI and/or the editor(s) disclaim responsibility for any injury to people or property resulting from any ideas, methods, instructions or products referred to in the content. |
© 2023 by the authors. Licensee MDPI, Basel, Switzerland. This article is an open access article distributed under the terms and conditions of the Creative Commons Attribution (CC BY) license (https://creativecommons.org/licenses/by/4.0/).
Share and Cite
Rodríguez-Martínez, C.C.; Cubilla-Montilla, M.; Vicente-Galindo, P.; Galindo-Villardón, P. X-STATIS: A Multivariate Approach to Characterize the Evolution of E-Participation, from a Global Perspective. Mathematics 2023, 11, 1492. https://doi.org/10.3390/math11061492
Rodríguez-Martínez CC, Cubilla-Montilla M, Vicente-Galindo P, Galindo-Villardón P. X-STATIS: A Multivariate Approach to Characterize the Evolution of E-Participation, from a Global Perspective. Mathematics. 2023; 11(6):1492. https://doi.org/10.3390/math11061492
Chicago/Turabian StyleRodríguez-Martínez, Carmen C., Mitzi Cubilla-Montilla, Purificación Vicente-Galindo, and Purificación Galindo-Villardón. 2023. "X-STATIS: A Multivariate Approach to Characterize the Evolution of E-Participation, from a Global Perspective" Mathematics 11, no. 6: 1492. https://doi.org/10.3390/math11061492