1. Introduction
Lung cancer is the second most commonly diagnosed cancer, with the highest mortality rate. The morbidity and mortality rates are approximately twice as high in men as in women [
1]. Approximately 85% of lung cancer patients are clinically staged as NSCLC. The biological differences in the frequency of gene mutations between smokers and non-smokers lead to differences in the genomic landscape of lung cancer [
2]. NSCLC is typically classified as adenocarcinoma, squamous cell cancer, and large cell carcinoma [
3]. With the development of biomarkers, targeted therapies, and immuno-oncology, the treatment of NSCLC has shifted from chemotherapy to highly effective targeted therapies and immune checkpoint therapies [
4,
5]. Deepening understanding of the biology of NSCLC, establishing an early diagnosis system, and finding new therapeutic targets are the keys to improving the diagnosis and prognosis of patients with NSCLC. To achieve this objective, two main approaches are being used for the study of NSCLC, namely statistical-based and network-based.
The traditional approach is a combination of experimental and statistical methods. Based on high-throughput experimental data and statistical analysis, Richmann et al. identified potential new diagnostic and prognostic biomarkers in different NSCLC subtypes, whose roles appear to be highly regulated by histology, mutational status, and EGFR signaling [
6]. Wang et al. identified that the combined detection of gene fusions of eight major driver genes may be a predictor of brain metastasis in NSCLC patients [
7]. Traditional experimental-based methods are time-costly, poorly targeted, and expensive to experiment with. With the development of big data and artificial intelligence, machine learning algorithms have gradually become popular in predicting the causative genes of NSCLC. Xu et al. used random forest to build a prognostic model and found a close correlation with prognosis after screening [
8]. Wang et al. used the support vector machine (SVM) recursive feature elimination method and finally identified eight genes as new diagnostic NSCLC biomarkers [
9].
Although machine learning algorithms can make predictions for key genes, it is difficult to have a reasonable explanation. Nonlinear association measure studies based on simple models and practical system applications can distinguish causality from correlation [
10]. Complex network-based approaches can provide a macroscopic view of disease mechanisms, reducing experimental costs while having plausible explanations. Mi et al. constructed hierarchical associations of complex diseases with functional pathways to develop a disease classification from a system perspective and evaluated the information diversity gain of combined diagnosis and treatment through entropy [
11,
12]. Della et al. explored for the first time the activation of the STING pathway in NSCLC tumors and demonstrated that STING activation correlates with each of these known immune response features in NSCLC [
13]. Gao et al. found that estrogen receptors may promote the NSCLC process of development [
14]. Niemira et al. identified top hub genes by weighted gene co-expression network analysis in NSCLC [
15]. The network establishes connections between genes based on regulatory relationships, then interprets the connections between genes as a metric, such as distance or entropy, and groups genes into modules by metric.
From a systems biology perspective, human gene networks have been shown to be beneficial in many aspects of disease research and have promoted many strategies to generate hypotheses about gene–disease associations. The ability to identify the genes associated with specific diseases has proven particularly important. Our efforts are directed at revealing gene interactions and synergy with disease through gene expression data from patient resected tissues to help early detection of diseases. In this work, mutual information (MI) and synergy derived through information theory are proposed as nonlinear association measures to investigate the association of genes with disease status for gene expression data of NSCLC samples. Among them, genes are screened by removing genes with zero expression or no functional annotation, and gene interactions are regarded as gene pairs of concern. Therefore, the independent and synergistic effects among genes are considered. Moreover, sample classification accuracy based on the SVM classifier with RBF kernel validates the association and significance of genes with NSCLC.
It can be found from the results that the MI of most individual genes are positively correlated with the sample classification accuracy, and then, the MI of gene pairs increases, and the range of sample classification accuracy becomes narrow and approaches one, since in most cases the gene pairs with high sample classification accuracy possess a top individual. Moreover, with the increase of synergy, the median sample classification accuracy increases to 80–90%. It implies that higher synergy detects a high-accuracy combination of two ordinary individual genes, especially bringing a significant gain in accuracy. The results support the development of gene-targeted therapy and combined diagnosis.
2. Results
2.1. Top MI Observes Genes of High Sample Classification Accuracy
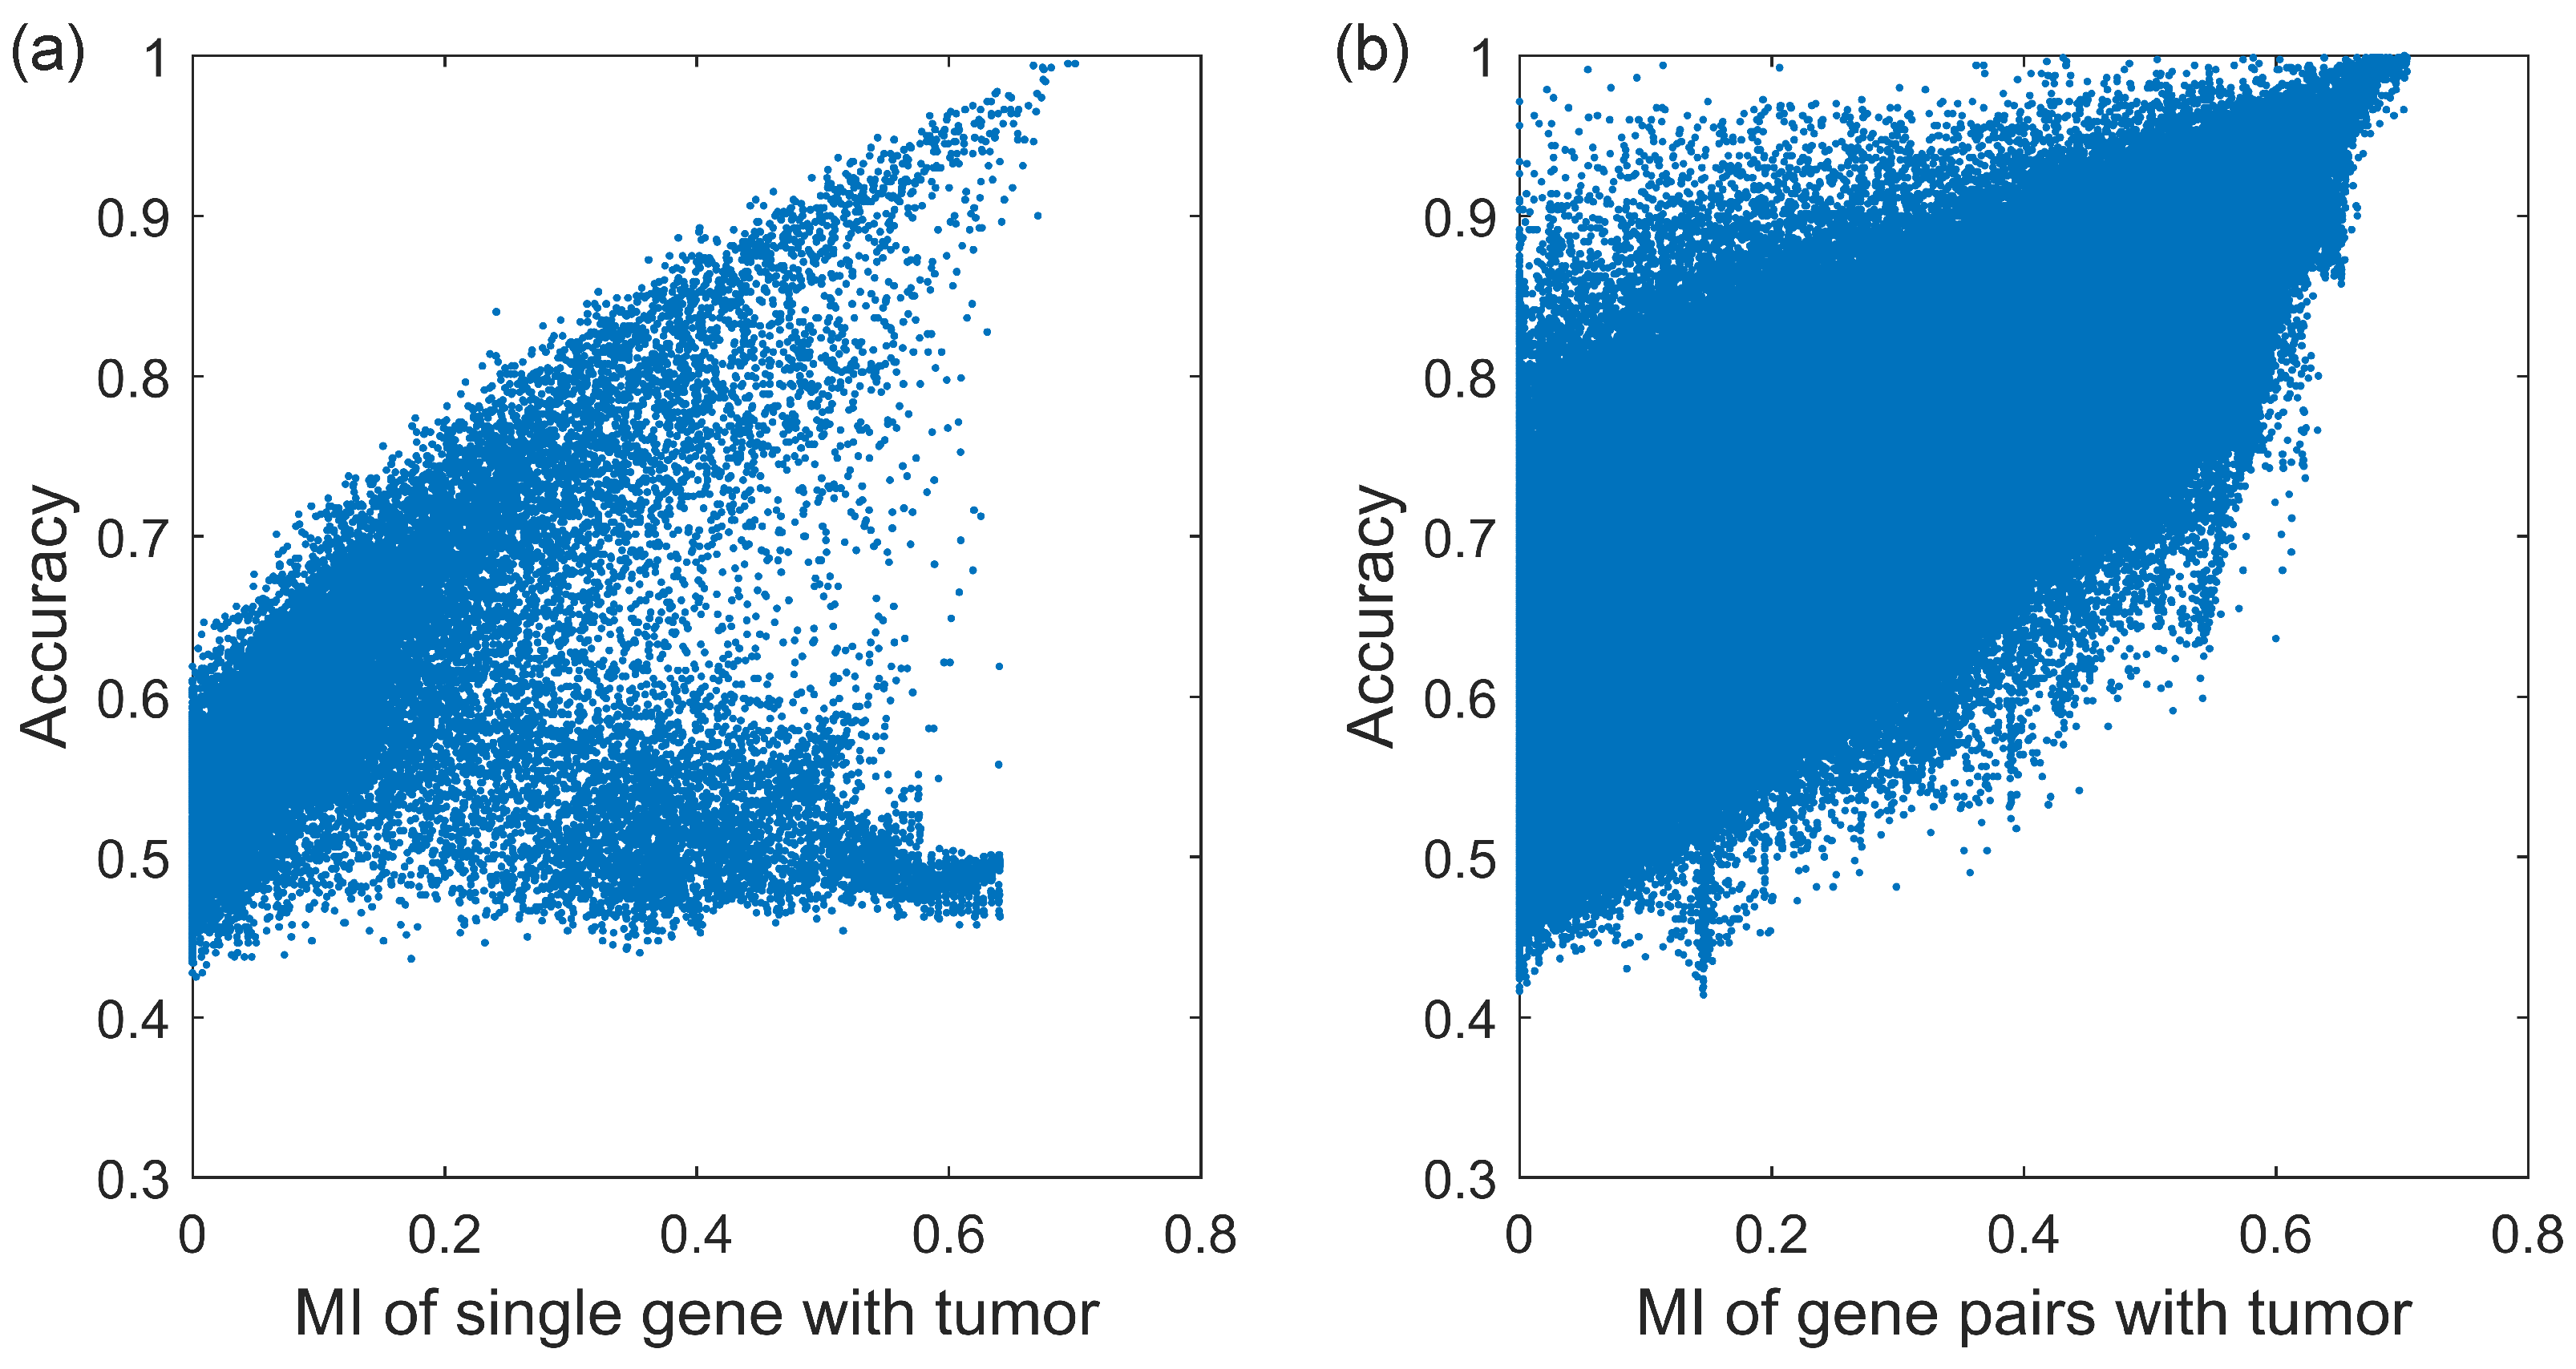
We firstly calculate the MI of 23,918 genes and the sample classification accuracy of each gene, shown in
Figure 1a. As we can see, the MI of most genes are positively correlated with the sample classification accuracy. At the top right of
Figure 1a, as MI increases, the accuracy of the gene increases to one, such as gene S1PR1, STX11, FLI1, FHL1, ADH1B, etc. There have been a number of NSCLC research studies relating to mentioned genes [
16,
17,
18,
19]. However, the MI of other genes are independent of the sample classification accuracy which is always about 0.5 which is equivalent to flipping a coin. At the bottom of
Figure 1a, despite the increase in the MI, the accuracy of the gene is always low, such as gene LINC01826, RN7SL144P, USP9YP2, etc. There is little evidence that these genes are associated with NSCLC.
We calculated the MI and accuracy not only for all tumor samples, but also by gender (male, female), histology (squamous cell cancer, AC unspecified, large cell/NOS), and smoking status (current smoking, smoking ex > 1 year, never smoking). Then, we select the top 30 genes with high MI and label their sample classification accuracies in
Figure 2. Among the 11 genes marked in orange, S1PR1, STX11, FHL1, INMT, ADAMTS8, and NLRC4 have been shown to be significantly downregulated in expression in NSCLC, while FLI1, ADH1B, and ADAMTS8 are strongly associated with the prognosis of NSCLC patients [
16,
18,
20]. Patients with high FLI1 expression, identified as an independent poor prognostic factor in NSCLC, had shorter overall survival than those with low FLI1 expression, and exonic loop RNA of FLI1 acted as a novel oncogenic driver to promote small cell lung cancer tumor metastasis [
18]. ADAMTS8 is also an important gene in lung cancer, and its high expression is associated with high overall survival in lung cancer patients. ADAMTS8 is also aberrantly downregulated in NSCLC cells, promoting cell proliferation and reducing apoptosis [
21].
Genes marked in blue have a more complex and functionally richer profile. TNFSF13 is more expressed in lung adenocarcinoma than in squamous cell cancer [
22]. SLC34A2, TFAP2A, IGSF10, and HHIP affect metastasis of lung cancer cells [
23]. CLorf74 and TFAP2A promote tumorigenicity. GOLM1 regulates lung cancer cell proliferation. Low RILPL2 expression, high PCAT19 expression, TNFSF13 protein overexpression, and high HMGB3 expression resulted in lower patient survival [
22]. Most of the other blue marker genes are expressed in lung cancer tissues significantly differently from normal tissues, and some of them have been used clinically, such as CDO1 cancer-specific methylation, for lung cancer diagnosis [
24]. Interestingly, we found that PLPP3 and PPAT have been reported to be associated with patient smoking status in the “ex > 1 year” group, which corroborates the reliability of our results [
25,
26].
2.2. The Gene Pairs with High Accuracy Possess a Top Individual Gene
The MI and the sample classification accuracies of 732,580 gene pairs were subsequently calculated, shown in
Figure 1b. Compared with that of a single gene, the MI of gene pairs increases, and the upper and lower limits of corresponding sample classification accuracies enhance. When the MI is large enough, concretely more than 0.6, the range of sample classification accuracy becomes narrow and approaches 1.
We selected the top 500 gene pairs with high MI to obtain 1000 genes containing duplicates, in which the gene frequency indicates the number of times a gene occurs in the top 500 pairs. We screened out the top 10 genes with the highest frequency. The different gene frequency in different sample groups are shown in
Figure 3. Obviously, in most cases the gene pairs with high sample classification accuracy possess a top individual, such as gene STX11, S1PR1, TGFBR2, TACC1, LRRK2, SRPK1, etc. It is worth noting that in
Figure 3d—squamous cell cancer samples—gene LRRK2 is found in more than 300 of the top 500 gene pairs, which means gene LRRK2 plays a vital role in squamous cell cancer, and gene pairs including gene LRRK2 also have significant influence in squamous cell cancer. LRRK2 has been reported to have critical roles in the lungs of non-human primates and mice [
27,
28].
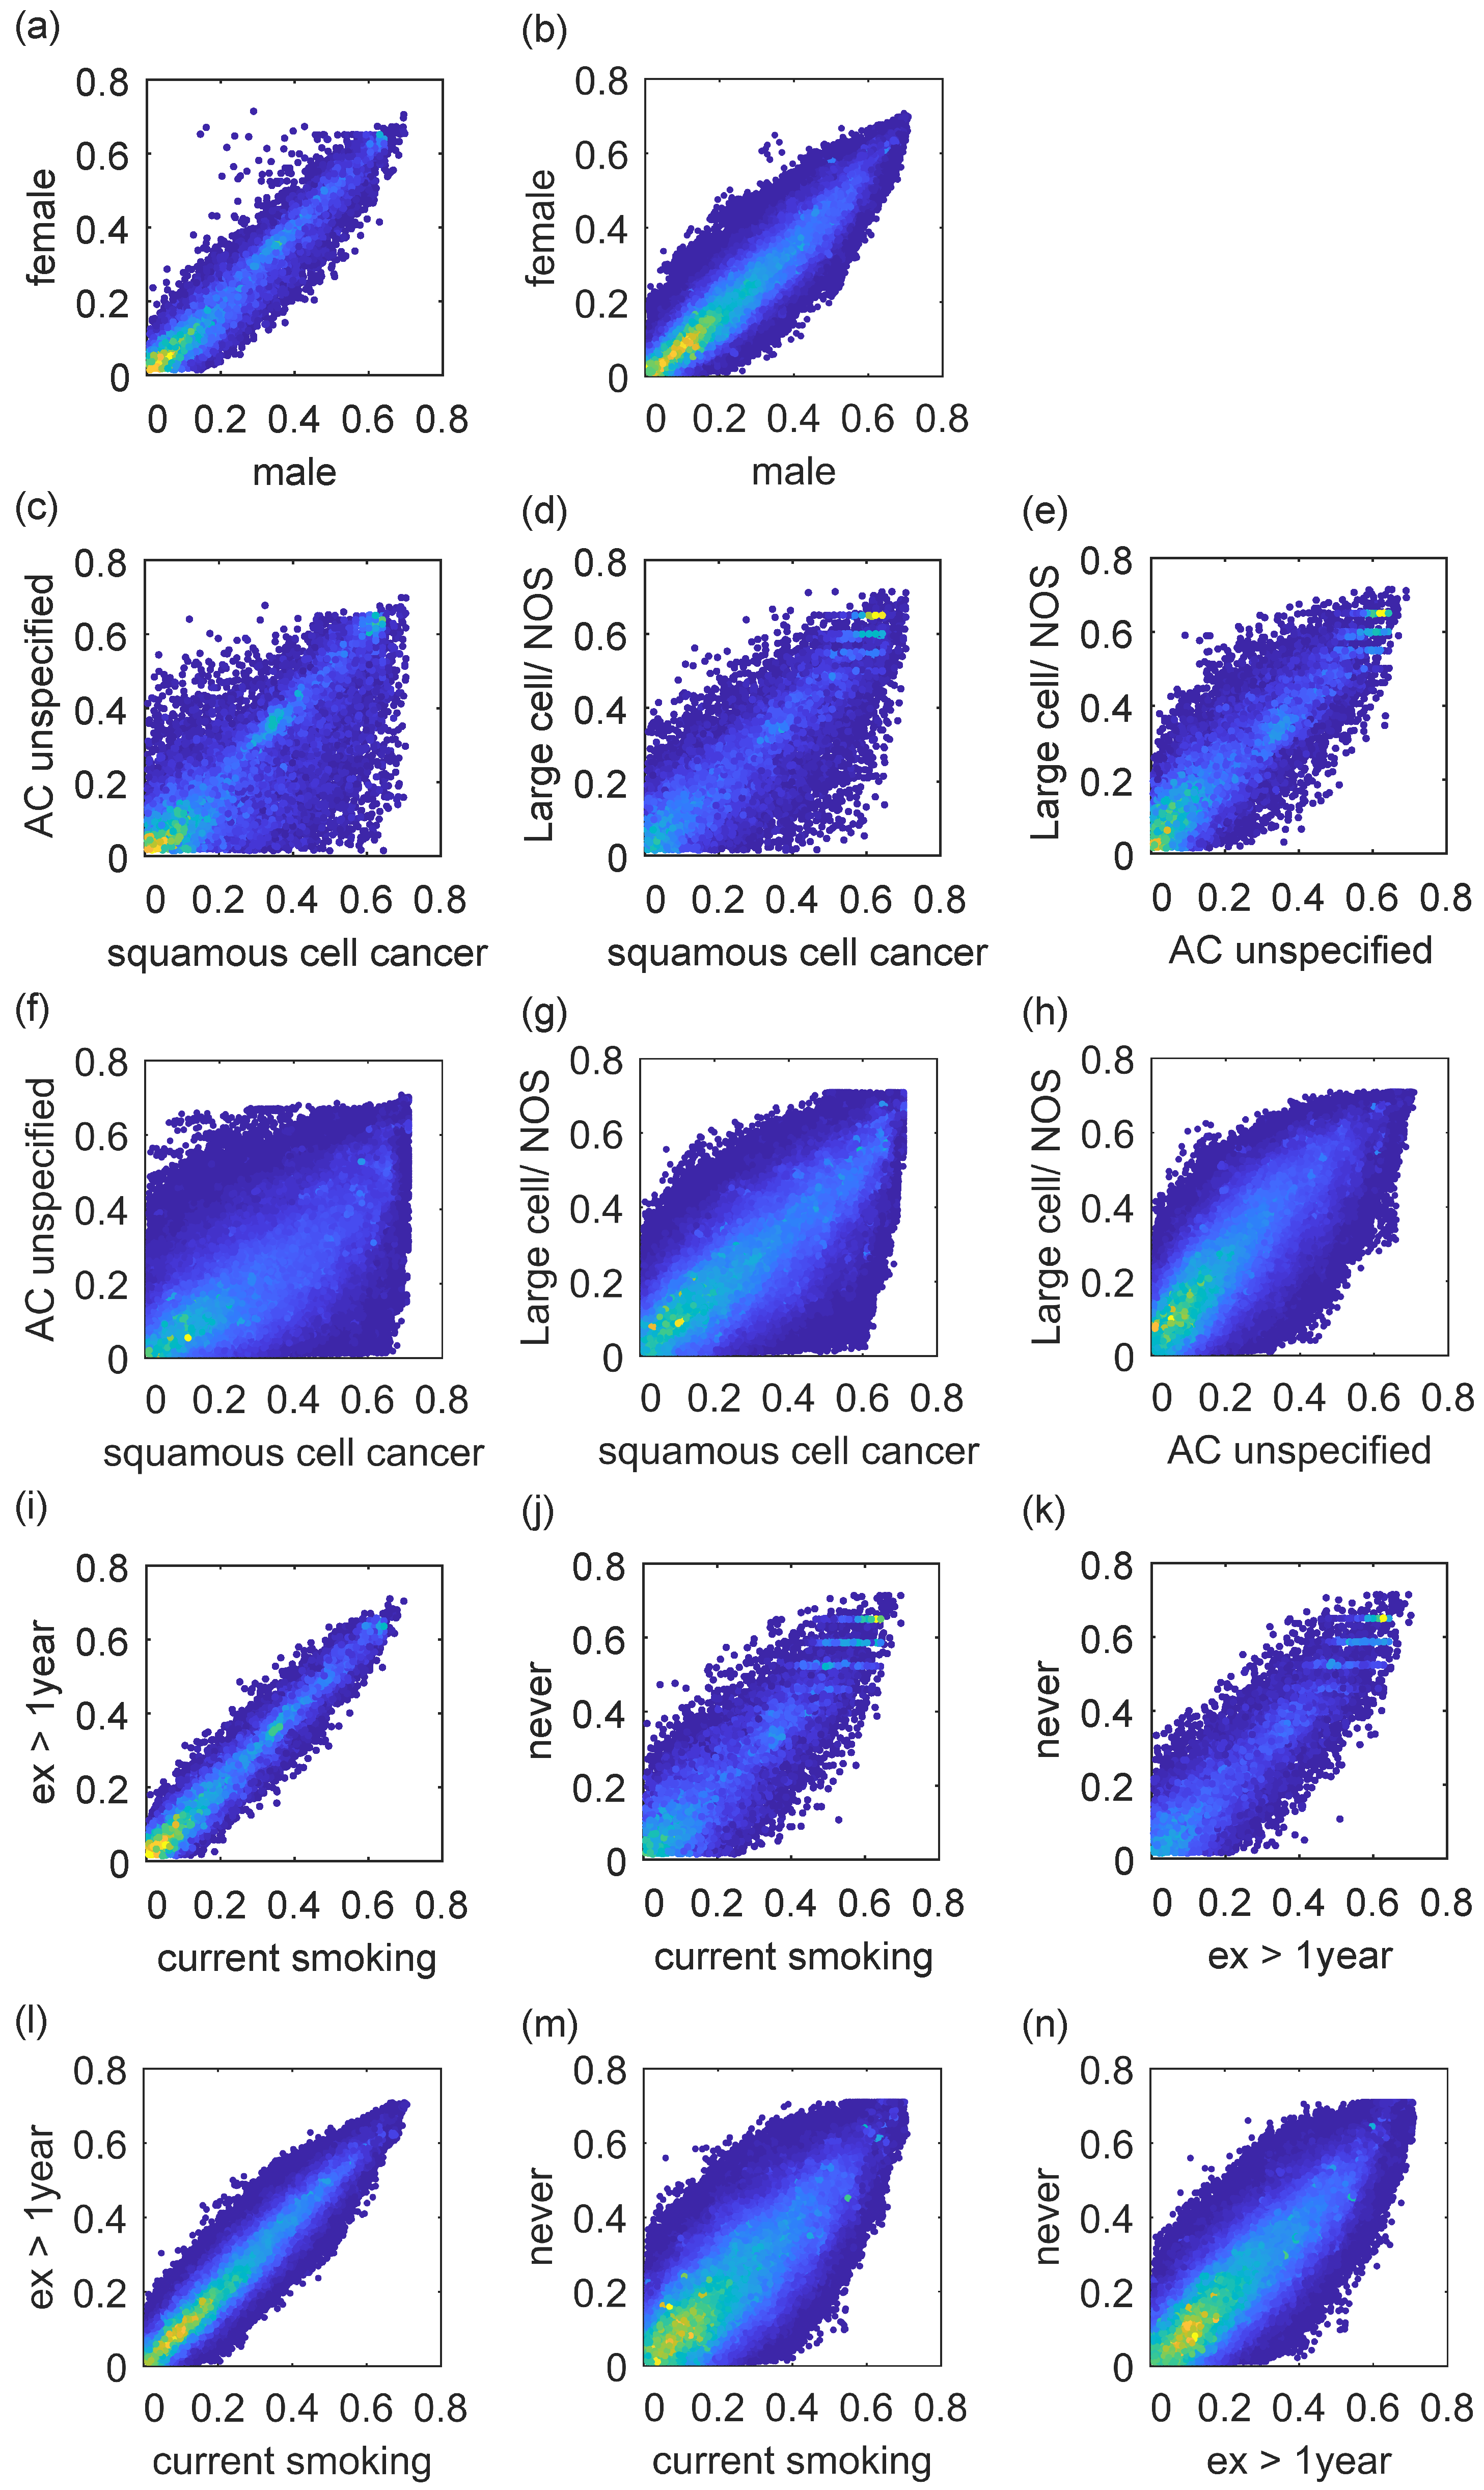
After calculating the MI, we make a comparison between single gene and gene pairs in
Figure 4. According to
Figure 4a,b, the differences of some genes, such as TTTY10, HSFY1, and RBMY1A1, are obvious, and the female patient index is much higher than the male one. However, there are no more studies on gender differences. According to
Figure 4c–h, there are significant differences in gene expression, such as DSC3 and GJB5, among the three histologies, especially in squamous cell cancer. According to
Figure 4i–n, there is a significant difference in smoking or not, but the difference of current smoking and quit smoking over a year is relatively small. Genes such as PLPP3 and PPAT are all associated with smoking status [
25,
26].
2.3. Leading Synergy Detects High-Accuracy Combination of Two Ordinary Individual Genes
We calculated the synergy values and the sample classification accuracies of 732,580 gene pairs. The different synergy–accuracy relationships in different sample groups are shown in
Figure 5 which is the boxplot with synergy grouping at 0.02 intervals. As we can see, the median of sample classification accuracy increases to 80–90% with the increase of the synergy value. Meanwhile, the lower limit of sample classification accuracy increase with the increase of the synergy value.There is a fact that the high accuracy over 90% is less, which is due to the combination of two ordinary individuals. However, this has led to a significant gain in accuracy.
Among the gene pairs with high synergy values, the sample classification accuracy of females is slightly higher than that of males, shown in
Figure 5b,c. In different histology groups, the IQR (Interquartile Range) of accuracy is the lowest in AC unspecified samples, the second in squamous cell cancer samples, and the largest in large cell/NOS samples, shown in
Figure 5d–f. In different smoking conditions, the number of outliers of the sample classification accuracy is the lowest among the current smoking samples, the middle among the samples of ex > 1 year, and the highest among the never smoking samples, shown in
Figure 5g–i.
2.4. Top Synergy Brings a Significant Gain in Accuracy
Although gene pairs with high synergy values rarely have accuracy of more than 90%, there is a significant gain in their accuracy, shown in
Figure 6. When the synergy value of a gene pair is low, the peak probability density of accuracy gain is about 0, and most accuracy gains are in the interval [−0.1, 0.1]. As the synergy value of gene pairs increases, the peak probability density of the accuracy gain shifts to the right to around 0.1, with most in the interval [0, 0.2]. Notable is that there are some gene pairs with high synergy values that have a high accuracy gain, such as COL1A2 and DCN, DCN and MMP2, and PDS5B and B3GNT8, as a small peak at accuracy gain of 0.2 in
Figure 6.
As for probability density curves, the standard deviation reflects the aggregation or fluctuations range in the data. The tall thin type has a small standard deviation, and the short fat type has a large standard deviation. For the gene pair with a higher synergy value, the standard deviation of the accuracy gain of females is lower than that of males. In different histology groups, the standard deviation of the accuracy gain is the lowest in squamous cell cancer samples, the second in AC unspecified samples, and the highest in large cell/NOS samples. In different smoking conditions, the standard deviation of the accuracy gain is the lowest in current smoking samples, the second in samples of ex > 1 year, and the highest in never smoking samples.
Then, we selected the top 30 gene pairs with high synergy and labelled their sample classification accuracies in
Figure 7. It is common to discover that some genes have a strong synergy. For example, gene RHOG appears in at least two pairs of top synergy in most sample groups. RHOG is a member of the Rho family of small GTPases, whose mRNA expression levels are particularly high in the lungs [
29]. It has been shown that GRHL2 suppresses tumor metastasis by regulating the transcriptional activity of RHOG in NSCLC and that inhibition of RHOG effectively inhibits the invasion and migration of human lung adenocarcinoma cells [
30]. TLN1 expression levels in patients with squamous cell cancer of the lung are almost three times higher than those in patients with lung adenocarcinoma. DDX39B in the “male” group is associated with androgen receptor. RPL15, VIRMA, and MDH2 are found to be associated with the proliferation or migration of lung cancer cells [
31].
3. Discussion
Accurate prediction of disease prognostic outcome is a very urgent clinical need, while disease early detection may lead to a more favorable prognosis, as interventions initiated before clinical manifestations would be more effective than those offered at later stages of the disease, thereby delaying the growth of cancer. In this work, we use information theory to study the collaboration between genes and specific NSCLC samples. Lung cancer remains the leading cause of death by cancer. The MI and sample classification accuracy of gene and gene pair are analyzed firstly, and high MI can help screen genes with high sample classification accuracy, such as STX11, S1PR1, TACC1, LRKK2, SRPK1, etc. Remarkably, some genes, such as TTTY10, HSFY1, and RBMY1A1, are different in gender, and some genes, such as PLPP3 and PPAT, are correlated with smoking status. Then, the synergy and sample classification accuracy of gene pairs are analyzed, and high synergy can help screen a high accuracy gene pair within a low accuracy single gene, such as the strong synergistic effect of genes between COL1A2 and DCN, DCN and MMP2, and PDS5B and B3GNT8. These can be guidance for gene-targeted therapy and combined diagnosis of non-small-cell lung carcinoma.
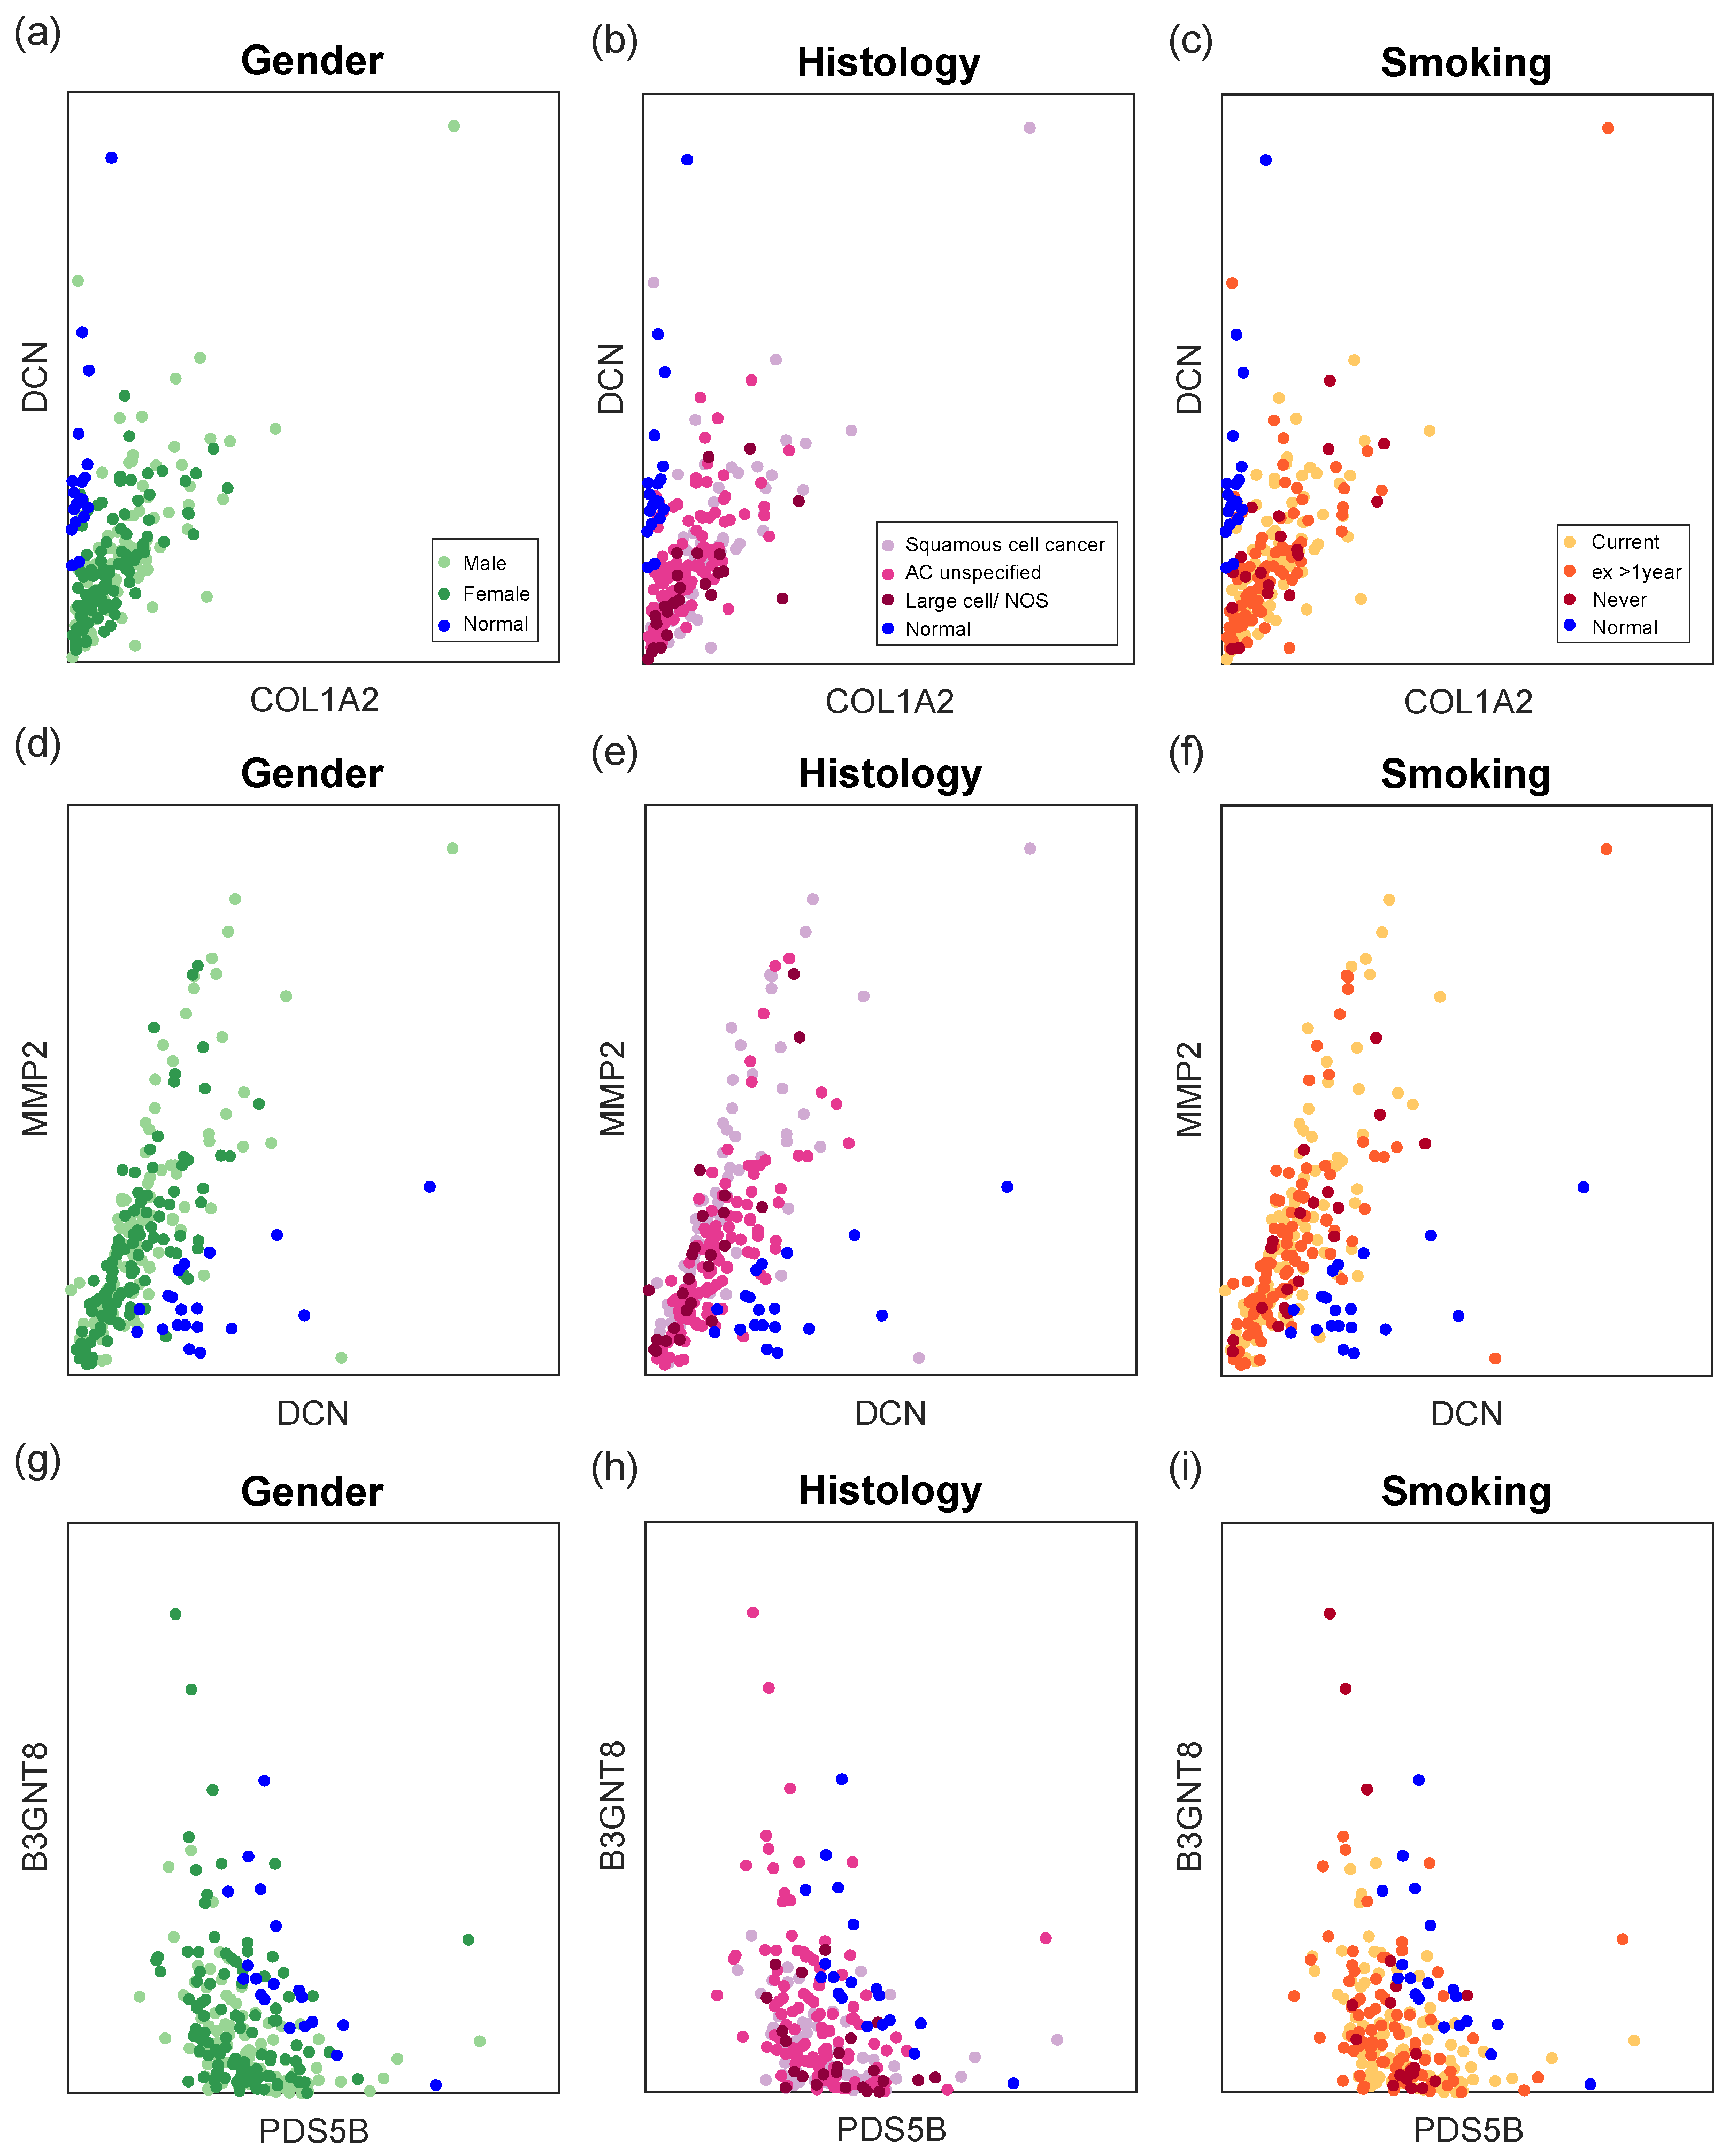
The expression of top synergy gene pairs is illustrated in
Figure 8 to make it clear that these gene pairs can better differentiate disease samples from normal samples than individual genes. In general, normal samples have almost zero COL1A2 expression and high DCN expression, as well as low MMP2 expression. Moreover, NSCLC cells benefit from downregulation of PDS5B and B3GNT8 [
32,
33]. In addition, our results show that PDS5B and B3GNT8 have some negative correlation. The association of these genes with NSCLC has been studied accordingly, and the synergy-based information gain of gene pairs should be given more emphasis in the future.
Synergy exists both around us and within us. Synergy can produce a variety of measurable benefits in complex systems such as economy. Meanwhile, the complexity of life may have to do with functional synergy that it generates. Health and disease are one of the two sides of individual health. From the genetic level, individual genes compete in a cooperative manner, as synergy gives a more complex form of competitive advantage between genes. Then, the cooperative effects give rise to higher levels of causality and action at every scale of life. Thus, the synergy associated with functional differentiation creates a selective environment that in turn favors the evolution of regulatory mechanisms. From the essence of efficiency priority, information sharing can significantly reduce energy consumption by individuals. Therefore, both independent and synergistic pathogenic effects among genes need to be taken into account.
Different genes may play a role in different subtypes and stages. This view is supported by preclinical and clinical research. In particular, neoadjuvant chemotherapy leads to improved prognostic outcomes in patients with resectable NSCLC, such as significantly longer event-free survival and increased chance of complete pathological remission [
34]. From a mathematical and systems biology perspective, identifying the dynamic behavior synergy in complex gene systems will facilitate progress in the study of disease evolution mechanism. It is particularly necessary to conduct mathematical theory and research on the behavioral mechanism of disease transformation and development, and the involvement of multivariate mathematical and physical ideas can bring substantial progress in methodological and applied technological innovations. Nonlinear association measurement across genes is a challenge and also the key to further research. For different data characteristics, such as static data and time series, many tools and methods based on nonlinear dynamics and statistics have been proposed, including Granger causality, convergence cross mapping, and transfer entropy. The information-theory-based metric can be extended to a wider range of applications in light of new requirements, approaching a deep understanding and optimization of individual health.
The general analysis of the whole data set reflects the overall trend of the disease, but similarities and differences between multiple types of samples are easily ignored. In this work, the groups of gender, histology, and smoking history bring different results and meanings. We find that most of the top individual genes that showed differential MI across genders are higher in females, while the majority of top gene pairs showing differential MI across genders are higher in males. As for histology, the differences in MI and synergy become more pronounced. It is worth highlighting the harm of smoking on NSCLC. Our results show a significant distinctness in whether there is a history of smoking, but the difference of current smoking and quit smoking over a year is relatively small. According to the AACR Cancer Progress Report 2022, tobacco use is a major preventable risk factor for cancer. In addition to lung cancer, smoking increases the risk of 17 different types of cancer and the risk of death. Quitting smoking at any age reduces the risk of cancer and death.
4. Methods
4.1. Data Collection
We chose the typical NSCLC data set GSE81089 as our experiment object [
35,
36]. The data set GSE81089 compared RNAseq data of 199 NSCLC tissues to the normal transcriptome, including fresh frozen tumor tissue from 19 paired normal lung tissues and 199 patients diagnosed with NSCLC and surgically treated at the Uppsala University Hospital, Uppsala, Sweden. Each sample had 63,129 readings recorded by emsembl ID. There are several characteristics (shown in
Table 1) of 199 disease samples in data set GSE81089, including gender, histology, smoking, PS.WHO (WHO performance status), stage TNM (Stage according to pTNM). According to the PS.WHO range, there were no significant serious performance conditions among these patients, where 0 represents fully active, 1 represents unable to do strenuous activities, 2 represents able to walk and manage self-care, and 4 represents completely disabled. Moreover, the majority of patients were in early stages, so fewer patients in different stages of the middle and late stages would lead to a data imbalance problem in subgroup studies. Gender, histology, and smoking are typical clinical factors that need to be considered in different situations.
The human gene information is from the NCBI database (
https://ftp.ncbi.nih.gov/gene/DATA/GENE_INFO/Mammalia/Homo_sapiens.gene_info.gz accessed on 16 November 2022). In this file, we obtained 141,567 human genes with entrez IDs, of which 36,506 genes had corresponding ensembl IDs. Among them, 23,918 genes were considered for further analysis by removing those with zero expression or no functional annotation, and the gene–gene interaction information was from the NCBI database (
https://ftp.ncbi.nih.gov/gene/GeneRIF/interactions.gz accessed on 16 November 2022). In this file, we obtained 781,952 human gene interactions involving 19,912 genes. By intersecting the interactions with the screened gene expression data, we obtained 732,580 interactions involving 17,896 genes.
4.2. MI
In information theory, the MI of two random variables is described as the reduced uncertainty of a random variable due to the knowledge of another random variable. Let
X be a discrete random variable set with state
, and probability distributions
. The MI is defined as [
37]:
where the
means the entropy of
X,
is the conditional entropy, and
means the joint entropy. There are accurate methods for estimating MI that avoid problems with “binning” when both data sets are discrete or when both data sets are continuous. The estimation and computation of MI for discrete and continuous variables based on K-nearest neighbors are given as [
38]:
where
is the digamma function. To estimate the MI from our data set, we average
over all data points.
and this method can provide an accurate, non-binning estimation of a discrete data set.
To avoid the error problems caused by small and imbalanced samples and to calculate the MI of gene individuals and gene pairs, we randomly take 15 tumor samples in each group and 15 normal samples for specific MI calculation. To estimate the final MI of 23,918 gene individuals and 732,580 gene pairs, we take the average of 500 times.
4.3. Synergy
Synergy is defined broadly as the combined interdependent effects produced by two or more parts, elements, or individuals. Meanwhile, synergy plays a prominent part in many scientific disciplines. The criterion for synergy should be whether there is a comprehensive effect that cannot be achieved by each part acting alone. We use information-theoretic measures of synergy to determine whether genes cooperate with each other in specific diseases. If D indicates a disease or a phenotype and G represents a sets of n genes, then the synergy value among G with respect to D is defined as [
39]:
This definition considers the effect of all subsets of set G on disease D, and this definition is completely consistent with our description of the synergy value. For the case of binary, the above formula can be written as:
In data set GSE81089, the synergy value is calculated by the above MI of a single gene and gene pairs.
4.4. Accuracy
We have used the SVM classifier with RBF kernel to estimate the classification accuracy of each single gene and each gene pair. Accuracy is used for evaluating classification models. Informally, accuracy is the fraction of predictions where our model was accurate. The classification accuracy is defined as
A true positive
is an outcome where the model correctly predicts the positive class. Similarly, a true negative
is an outcome where the model correctly predicts the negative class.
P is the number of positive samples, and
N is the number of negative samples.
In data set GSE81089, we randomly took 19 tumor samples in each group and 19 normal samples. Among them, we calculated specific sample classification accuracy by randomly selecting 15 tumor samples and 15 normal samples as the training set and 4 tumor samples and 4 normal samples as the test set. To estimate final sample classification accuracy of 23,918 gene individuals and 732,580 gene pairs, we took the average of 100 times.
5. Conclusions
The information-theory-based metric can be extended to a wider range of applications in light of new requirements, approaching a deep understanding and optimization of individual health. In this work, MI and synergy are proposed to identify vital genes via investigating the association of genes with disease status in specific NSCLC samples, revealing diversities in different gender, histology, and smoking situations. It is found that top MI observes genes of high sample classification accuracy. Notably, the gene pairs with high accuracy possess a top individual gene. Further, leading synergy detects a high-accuracy combination of two ordinary individual genes. In particular, top synergy brings a significant gain in accuracy, which serves the treatment need of targeted therapy and combined diagnosis of NSCLC.
Author Contributions
Conceptualization, X.Y., Z.M., Q.H. and B.G.; data curation, Z.M.; formal analysis, X.Y. and Z.M.; funding acquisition, B.G. and Z.Z.; investigation, X.Y. and Q.H.; methodology, X.Y. and Z.M.; project administration, Z.M. and B.G.; resources, Z.M. and B.G.; software, Z.M. and Q.H.; supervision, Z.M., B.G. and Z.Z.; validation, X.Y., Z.M. and Q.H.; visualization, Z.M. and Q.H.; writing—original draft, X.Y.; writing—review ans editing, X.Y., Z.M. and Q.H. All authors have read and agreed to the published version of the manuscript.
Funding
This work was supported by the National Key R&D Program of China (Grant: 2021ZD0201302), the National Natural Science Foundation of China (Grant: U20B2053) and the Key R&D Program of Guangdong Province, China (Grant: 2021B0101420003).
Institutional Review Board Statement
Not applicable.
Informed Consent Statement
Not applicable.
Data Availability Statement
Acknowledgments
The authors are grateful to editors and reviewers for their valuable remarks, comments and advice, that help to improve the quality of the manuscript.
Conflicts of Interest
The authors declare no conflict of interest.
References
- Sung, H.; Ferlay, J.; Siegel, R.L.; Laversanne, M.; Soerjomataram, I.; Jemal, A.; Bray, F. Global cancer statistics 2020: GLOBOCAN estimates of incidence and mortality worldwide for 36 cancers in 185 countries. CA A Cancer J. Clin. 2021, 71, 209–249. [Google Scholar] [CrossRef] [PubMed]
- Herbst, R.S.; Morgensztern, D.; Boshoff, C. The biology and management of non-small cell lung cancer. Nature 2018, 553, 446–454. [Google Scholar] [PubMed]
- Inamura, K. Lung cancer: Understanding its molecular pathology and the 2015 WHO classification. Front. Oncol. 2017, 7, 193. [Google Scholar] [CrossRef] [PubMed] [Green Version]
- Michelotti, A.; de Scordilli, M.; Bertoli, E.; De Carlo, E.; Del Conte, A.; Bearz, A. NSCLC as the paradigm of precision medicine at its finest: The rise of new druggable molecular targets for advanced disease. Int. J. Mol. Sci. 2022, 23, 6748. [Google Scholar] [CrossRef]
- Yang, S.R.; Schultheis, A.M.; Yu, H.; Mandelker, D.; Ladanyi, M.; Büttner, R. Precision medicine in non-small cell lung cancer: Current applications and future directions. In Proceedings of the Seminars in Cancer Biology; Elsevier: Amsterdam, The Netherlands, 2022; Volume 84, pp. 184–198. [Google Scholar]
- Richtmann, S.; Wilkens, D.; Warth, A.; Lasitschka, F.; Winter, H.; Christopoulos, P.; Herth, F.J.; Muley, T.; Meister, M.; Schneider, M.A. FAM83A and FAM83B as prognostic biomarkers and potential new therapeutic targets in NSCLC. Cancers 2019, 11, 652. [Google Scholar] [CrossRef] [Green Version]
- Wang, H.; Wang, Z.; Zhang, G.; Zhang, M.; Zhang, X.; Li, H.; Zheng, X.; Ma, Z. Driver genes as predictive indicators of brain metastasis in patients with advanced NSCLC: EGFR, ALK, and RET gene mutations. Cancer Med. 2020, 9, 487–495. [Google Scholar] [CrossRef] [Green Version]
- Xu, J.; Nie, H.; He, J.; Wang, X.; Liao, K.; Tu, L.; Xiong, Z. Using machine learning modeling to explore new immune-related prognostic markers in non-small cell lung cancer. Front. Oncol. 2020, 10, 550002. [Google Scholar] [CrossRef]
- Wang, F.; Su, Q.; Li, C. Identidication of novel biomarkers in non-small cell lung cancer using machine learning. Sci. Rep. 2022, 12, 1–15. [Google Scholar]
- Sugihara, G.; May, R.; Ye, H.; Hsieh, C.h.; Deyle, E.; Fogarty, M.; Munch, S. Detecting causality in complex ecosystems. Science 2012, 338, 496–500. [Google Scholar] [CrossRef]
- Mi, Z.; Guo, B.; Yin, Z.; Li, J.; Zheng, Z. Disease classification via gene network integrating modules and pathways. R. Soc. Open Sci. 2019, 6, 190214. [Google Scholar] [CrossRef] [Green Version]
- Mi, Z.; Guo, B.; Yang, X.; Yin, Z.; Zheng, Z. LAMP: Disease classification derived from layered assessment on modules and pathways in the human gene network. BMC Bioinform. 2020, 21, 1–20. [Google Scholar] [CrossRef] [PubMed]
- Della Corte, C.M.; Sen, T.; Gay, C.M.; Ramkumar, K.; Diao, L.; Cardnell, R.J.; Rodriguez, B.L.; Stewart, C.A.; Papadimitrakopoulou, V.A.; Gibson, L.; et al. STING pathway expression identifies NSCLC with an immune-responsive phenotype. J. Thorac. Oncol. 2020, 15, 777–791. [Google Scholar] [CrossRef] [PubMed]
- Gao, X.; Cai, Y.; Wang, Z.; He, W.; Cao, S.; Xu, R.; Chen, H. Estrogen receptors promote NSCLC progression by modulating the membrane receptor signaling network: A systems biology perspective. J. Transl. Med. 2019, 17, 1–15. [Google Scholar]
- Niemira, M.; Collin, F.; Szalkowska, A.; Bielska, A.; Chwialkowska, K.; Reszec, J.; Niklinski, J.; Kwasniewski, M.; Kretowski, A. Molecular signature of subtypes of non-small-cell lung cancer by large-scale transcriptional profiling: Identification of key modules and genes by weighted gene co-expression network analysis (WGCNA). Cancers 2019, 12, 37. [Google Scholar] [CrossRef] [Green Version]
- Metodieva, S.N.; Nikolova, D.N.; Cherneva, R.V.; Dimova, I.I.; Petrov, D.B.; Toncheva, D.I. Expression analysis of angiogenesis-related genes in Bulgarian patients with early stage non-small cell lung cancer. Tumori J. 2011, 97, 86–94. [Google Scholar] [CrossRef]
- Lin, S.F.; Wu, C.C.; Chai, C.Y. Increased FLI-1 Expression is Associated With Poor Prognosis in Non–Small Cell Lung Cancers. Appl. Immunohistochem. Mol. Morphol. 2016, 24, 556–561. [Google Scholar] [CrossRef]
- Niu, C.; Liang, C.; Guo, J.; Cheng, L.; Zhang, H.; Qin, X.; Zhang, Q.; Ding, L.; Yuan, B.; Xu, X.; et al. Downregulation and growth inhibitory role of FHL1 in lung cancer. Int. J. Cancer 2012, 130, 2549–2556. [Google Scholar] [CrossRef] [PubMed]
- Li, Q.G.; He, Y.H.; Wu, H.; Yang, C.P.; Pu, S.Y.; Fan, S.Q.; Jiang, L.P.; Shen, Q.S.; Wang, X.X.; Chen, X.Q.; et al. A normalization-free and nonparametric method sharpens large-scale transcriptome analysis and reveals common gene alteration patterns in cancers. Theranostics 2017, 7, 2888. [Google Scholar] [CrossRef] [PubMed] [Green Version]
- Abdelwahab, O.; Awad, N.; Elserafy, M.; Badr, E. A feature selection-based framework to identify biomarkers for cancer diagnosis: A focus on lung adenocarcinoma. PLoS ONE 2022, 17, e0269126. [Google Scholar]
- Zhang, Y.; Hu, K.; Qu, Z.; Xie, Z.; Tian, F. ADAMTS8 inhibited lung cancer progression through suppressing VEGFA. Biochem. Biophys. Res. Commun. 2022, 598, 1–8. [Google Scholar] [CrossRef]
- Qian, Z.; Qingshan, C.; Chun, J.; Huijun, Z.; Feng, L.; Qiang, W.; Qiang, X.; Min, Z. High expression of TNFSF13 in tumor cells and fibroblasts is associated with poor prognosis in non–small cell lung cancer. Am. J. Clin. Pathol. 2014, 141, 226–233. [Google Scholar] [CrossRef] [Green Version]
- Wu, K.; Liao, X.; Gong, Y.; He, J.; Zhou, J.K.; Tan, S.; Pu, W.; Huang, C.; Wei, Y.Q.; Peng, Y. Circular RNA F-circSR derived from SLC34A2-ROS1 fusion gene promotes cell migration in non-small cell lung cancer. Mol. Cancer 2019, 18, 1–6. [Google Scholar] [CrossRef] [PubMed]
- Wrangle, J.; Machida, E.O.; Danilova, L.; Hulbert, A.; Franco, N.; Zhang, W.; Glöckner, S.C.; Tessema, M.; Van Neste, L.; Easwaran, H.; et al. Functional Identification of Cancer-Specific Methylation of CDO1, HOXA9, and TAC1 for the Diagnosis of Lung CancerCDO1, HOXA9, and TAC1 Methylation for the Diagnosis of Lung Cancer. Clin. Cancer Res. 2014, 20, 1856–1864. [Google Scholar] [CrossRef] [Green Version]
- Nema, R.; Shrivastava, A.; Kumar, A. Prognostic role of lipid phosphate phosphatases in non-smoker, lung adenocarcinoma patients. Comput. Biol. Med. 2021, 129, 104141. [Google Scholar] [CrossRef] [PubMed]
- Goswami, M.T.; Chen, G.; Chakravarthi, B.V.; Pathi, S.S.; Anand, S.K.; Carskadon, S.L.; Giordano, T.J.; Chinnaiyan, A.M.; Thomas, D.G.; Palanisamy, N.; et al. Role and regulation of coordinately expressed de novo purine biosynthetic enzymes PPAT and PAICS in lung cancer. Oncotarget 2015, 6, 23445. [Google Scholar] [CrossRef] [PubMed] [Green Version]
- Fuji, R.N.; Flagella, M.; Baca, M.; S. Baptista, M.A.; Brodbeck, J.; Chan, B.K.; Fiske, B.K.; Honigberg, L.; Jubb, A.M.; Katavolos, P.; et al. Effect of selective LRRK2 kinase inhibition on nonhuman primate lung. Sci. Transl. Med. 2015, 7, 273ra15. [Google Scholar] [CrossRef]
- Herzig, M.C.; Kolly, C.; Persohn, E.; Theil, D.; Schweizer, T.; Hafner, T.; Stemmelen, C.; Troxler, T.J.; Schmid, P.; Danner, S.; et al. LRRK2 protein levels are determined by kinase function and are crucial for kidney and lung homeostasis in mice. Hum. Mol. Genet. 2011, 20, 4209–4223. [Google Scholar] [CrossRef] [Green Version]
- Vincent, S.; Jeanteur, P.; Fort, P. Growth-regulated expression of rhoG, a new member of the ras homolog gene family. Mol. Cell. Biol. 1992, 12, 3138–3148. [Google Scholar]
- Pan, X.; Zhang, R.; Xie, C.; Gan, M.; Yao, S.; Yao, Y.; Jin, J.; Han, T.; Huang, Y.; Gong, Y.; et al. GRHL2 suppresses tumor metastasis via regulation of transcriptional activity of RhoG in non-small cell lung cancer. Am. J. Transl. Res. 2017, 9, 4217. [Google Scholar]
- Zhang, C.; Sun, Q.; Zhang, X.; Qin, N.; Pu, Z.; Gu, Y.; Yan, C.; Zhu, M.; Dai, J.; Wang, C.; et al. Gene amplification-driven RNA methyltransferase KIAA1429 promotes tumorigenesis by regulating BTG2 via m6A-YTHDF2-dependent in lung adenocarcinoma. Cancer Commun. 2022, 42, 609–626. [Google Scholar] [CrossRef]
- Xu, H.; Zhou, W.; Zhang, F.; Wu, L.; Li, J.; Ma, T.; Cao, T.; Lian, C.; Xia, J.; Wang, P.; et al. PDS5B inhibits cell proliferation, migration, and invasion via upregulation of LATS1 in lung cancer cells. Cell Death Discov. 2021, 7, 168. [Google Scholar] [CrossRef] [PubMed]
- Huang, C.; Zhou, J.; Wu, S.; Shan, Y.; Teng, S.; Yu, L. Cloning and tissue distribution of the human B3GALT7 gene, a member of the β1, 3-glycosyltransferase family. Glycoconj. J. 2004, 21, 267–273. [Google Scholar] [CrossRef] [PubMed]
- Forde, P.M.; Spicer, J.; Lu, S.; Provencio, M.; Mitsudomi, T.; Awad, M.M.; Felip, E.; Broderick, S.R.; Brahmer, J.R.; Swanson, S.J.; et al. Neoadjuvant nivolumab plus chemotherapy in resectable lung cancer. N. Engl. J. Med. 2022, 386, 1973–1985. [Google Scholar] [CrossRef]
- Mezheyeuski, A.; Bergsland, C.H.; Backman, M.; Djureinovic, D.; Sjöblom, T.; Bruun, J.; Micke, P. Multispectral imaging for quantitative and compartment-specific immune infiltrates reveals distinct immune profiles that classify lung cancer patients. J. Pathol. 2018, 244, 421–431. [Google Scholar] [CrossRef] [PubMed]
- Goldmann, T.; Marwitz, S.; Nitschkowski, D.; Krupar, R.; Backman, M.; Elfving, H.; Thurfjell, V.; Lindberg, A.; Brunnström, H.; La Fleur, L.; et al. PD-L1 amplification is associated with an immune cell rich phenotype in squamous cell cancer of the lung. Cancer Immunol. Immunother. 2021, 70, 2577–2587. [Google Scholar] [CrossRef] [PubMed]
- Cover, T.M. Elements of Information Theory; John Wiley & Sons: Hoboken, NJ, USA, 1999. [Google Scholar]
- Ross, B.C. Mutual information between discrete and continuous data sets. PLoS ONE 2014, 9, e87357. [Google Scholar] [CrossRef]
- Chatterjee, P.; Pal, N.R. Construction of synergy networks from gene expression data related to disease. Gene 2016, 590, 250–262. [Google Scholar] [CrossRef] [PubMed]
Figure 1.
Scatter diagram between MI and accuracy: (a) MI and accuracy of single gene; (b) MI and accuracy of gene pairs.
Figure 1.
Scatter diagram between MI and accuracy: (a) MI and accuracy of single gene; (b) MI and accuracy of gene pairs.
Figure 2.
Top 30 MI genes in different sample groups. In brackets is the sample classification accuracy of the gene. The orange label indicates that this gene appears over 8 sample groups. The blue label indicates that this gene appears in less than 2 sample groups. The yellow label indicates that this gene has low sample classification accuracy.
Figure 3.
Frequency in top 500 gene pairs in MI for different sample groups: (a) all tumor samples type; (b) male; (c) female; (d) squamous cell cancer; (e) AC unspecified; (f) large cell/NOS; (g) current smoking; (h) smoking ex > 1 year; (i) never smoking.
Figure 3.
Frequency in top 500 gene pairs in MI for different sample groups: (a) all tumor samples type; (b) male; (c) female; (d) squamous cell cancer; (e) AC unspecified; (f) large cell/NOS; (g) current smoking; (h) smoking ex > 1 year; (i) never smoking.
Figure 4.
MI of single gene and gene pairs varied among sample groups: (a) MI of single gene in different gender groups; (b) MI of gene pairs in different gender groups; (c–e) MI of single gene in different histology groups; (f–h) MI of gene pairs in different histology groups; (i–k) MI of single gene in different smoking groups; (l–n) MI of gene pairs in different smoking groups.
Figure 5.
Boxplot of synergy and accuracy of gene pairs for different sample groups: (a) all tumor samples type; (b) male; (c) female; (d) squamous cell cancer; (e) AC unspecified; (f) large cell/NOS; (g) current smoking; (h) smoking ex > 1 year; (i) never smoking.
Figure 5.
Boxplot of synergy and accuracy of gene pairs for different sample groups: (a) all tumor samples type; (b) male; (c) female; (d) squamous cell cancer; (e) AC unspecified; (f) large cell/NOS; (g) current smoking; (h) smoking ex > 1 year; (i) never smoking.
Figure 6.
Density plot of accuracy gain of gene pairs for different sample groups. Each curve corresponds to a synergy range: (a) all tumor samples types; (b) male; (c) female; (d) squamous cell cancer; (e) AC unspecified; (f) large cell/NOS; (g) current smoking; (h) smoking ex > 1 year; (i) never smoking.
Figure 7.
Top 30 synergy gene pairs in different sample groups. In brackets is the sample classification accuracy of the gene. The orange label indicates that this gene appears in at least 2 gene pairs for that sample group. For example, gene RHOG appears 6 times in the top 30 “All”.
Figure 7.
Top 30 synergy gene pairs in different sample groups. In brackets is the sample classification accuracy of the gene. The orange label indicates that this gene appears in at least 2 gene pairs for that sample group. For example, gene RHOG appears 6 times in the top 30 “All”.
Figure 8.
Expressions of top synergy gene pairs in different sample groups. Gene pairs can better differentiate disease samples from normal samples than individual genes. (a–c): COL1A2 and DCN expressions; (d–f): DCN and MMP2 expressions; (g–i): PDS5B and B3GNT8 expressions.
Figure 8.
Expressions of top synergy gene pairs in different sample groups. Gene pairs can better differentiate disease samples from normal samples than individual genes. (a–c): COL1A2 and DCN expressions; (d–f): DCN and MMP2 expressions; (g–i): PDS5B and B3GNT8 expressions.
Table 1.
Characteristics of 199 disease samples in data set GSE81089, including gender, histology, and smoking, PS.WHO (WHO performance status, range 0–4), stage TNM (Stage according to pTNM: 1 = 1a, 2 = 1b, 3 = 2a, 4 = 2b, 5 = 3a, 6 = 3b, 7 = IV).
Table 1.
Characteristics of 199 disease samples in data set GSE81089, including gender, histology, and smoking, PS.WHO (WHO performance status, range 0–4), stage TNM (Stage according to pTNM: 1 = 1a, 2 = 1b, 3 = 2a, 4 = 2b, 5 = 3a, 6 = 3b, 7 = IV).
| Gender | Male | Female |
| No. | 96 | 103 |
| Histology | Squamous Cell Cancer | AC Unspecified | Large Cell/NOS |
| No. | 67 | 108 | 24 |
| Smoking | Current | ex > 1 year | Never |
| No. | 96 | 84 | 19 |
| PS.WHO | 0 | 1 | 2 |
| No. | 120 | 77 | 2 |
| Stage TNM | 1 | 2 | 3 | 4 | 5 | 7 |
| No. | 70 | 45 | 25 | 23 | 33 | 3 |
| Disclaimer/Publisher’s Note: The statements, opinions and data contained in all publications are solely those of the individual author(s) and contributor(s) and not of MDPI and/or the editor(s). MDPI and/or the editor(s) disclaim responsibility for any injury to people or property resulting from any ideas, methods, instructions or products referred to in the content. |
© 2023 by the authors. Licensee MDPI, Basel, Switzerland. This article is an open access article distributed under the terms and conditions of the Creative Commons Attribution (CC BY) license (https://creativecommons.org/licenses/by/4.0/).


 ,
, 


