1. Introduction
Upcast shafts are important elements of mine ventilation. They are used not only to remove outgoing polluted air to the surface but also for organizing technological processes for lowering and lifting mineworkers, rock masses, and various materials. Therefore, the trouble-free operation of upcast shafts throughout the mine’s life is a prerequisite for safe and energy-efficient mining operations.
Numerous experimental data and practical observations of air distribution in mines attest to cases of upcast shaft ventilation violations due to non-stationary physical processes that are associated with condensed moisture accumulation in the shafts. In the presence of a large amount of moisture in the upcast shaft space, water build-up, or water blanketing, may occur. In practice, this effect is expressed in the appearance of thick fog and droplet moisture in the upcast shaft space, which create additional air resistance, resulting in a decrease in air flow through the shaft and an increase in the depression of the main fan, which may lead to vibrations in the main fan or its emergency shutdown.
The first study [
1] that mentions water build-up in upcast shafts was published in 1956. The paper describes the results of the empirical observation of 12 ventilation shafts, in which the main fan depression increased over time and the air flow rate decreased due to the shaft air resistance increasing, caused by the accumulation of condensed water droplets in the air. In [
1], the following mechanism for the water build-up was described. The mine air emanating from the working areas can be completely saturated with moisture by the time it reaches the junction with the upcast shaft. As airflow rises up the shaft, the hydrostatic pressure decreases, resulting in the airflow temperature decreasing. The temperature decrease causes the moisture contained in the air to condense in the form of small water droplets, or mist, and as the air stream moves further, more and more water condenses on these drops, and the droplets increase in size. Droplets of different sizes have different terminal velocities due to different air resistance. If the airflow velocity is less than the droplet terminal velocity, then it will fly down, and if the airflow velocity is greater than the drop terminal velocity, it will be carried to the mine surface. If the airflow velocity is comparable to the drop terminal velocity, then it will be in suspension until it collides with another drop, increasing in size, or collides with the shaft wall. In the latter case, the droplet can either break up into smaller droplets or form part of the water film on the lining surface. The paper [
1] also described a series of laboratory experiments using a physical model of an upcast shaft with a diameter of 0.38 m and a length of 15.5 m. During the experiments, various amounts of air were supplied through the shaft at a velocity ranging from 0 to 18 m/s by adjusting the fan, and 1.26 kg/s of water was injected into the upper or lower part of the shaft. From the experiments, the authors concluded that water build-up occurs to a greater extent when, in addition to the process of condensation of moisture from the air, groundwater from aquifers enters the shaft. Water entering the shaft in its upper part increases the air resistance if the air flow velocity is less than the terminal velocity, which in the laboratory experiment was approximately 10.2 m/s, and does not affect the resistance at velocities greater than the terminal velocity. When water enters the shaft in its lower part, the air resistance increases when the air velocity is greater than the terminal velocity and does not change when the air velocity is less than the terminal velocity. Water entering the shaft at an intermediate point always has a negative effect on air resistance, but the effect will not be as noticeable as in the extreme cases. The author [
1] recommended avoiding air flow velocities in upcast shafts in the range of 7.0 to 12.0 m/s.
According to ref. [
2], water build-up was first discovered in the 1950s in the upcast shaft of one of the mines in the Republic of South Africa, which was ventilated by the main fan, consisting of two fans operating in parallel. Due to the presence of cracks in the shaft support, groundwater from aquifers near the mine surface entered the shaft. The shaft had a water pumping system, consisting of a pump and a pipeline. When the pump failed, a thick fog appeared in the shaft, and the depression of the fans increased significantly. The problem was solved by turning off one of the fans, causing the airflow velocity in the shaft to drop to about 7.0 m/s, the fog in the shaft space to dissipate, and the air resistance of the shaft to decrease. One fan continued to operate until the malfunction in the water pumping system was eliminated, after which the second fan was turned back on.
Another paper [
3] described a case where the exhaust fan in the ventilation system, under conditions of high air humidity, switched to an unstable operation mode, which led to damage to the fan structure and destruction of the blades. The operating point of the fan was in a zone with an air flow velocity of 8.3 m/s. The solution to the problem was to change the rotation angle of the blades so that the fan operating point shifted to a zone with an air flow velocity of 10.4 m/s.
Another article [
4] described several cases of unstable operation of exhaust fans in the presence of water in the upcast shafts, passed by drilling with a diameter of 1.6 to 2.1 m. The velocity of the air flow at which unstable operations of the fans were observed varied from 9.15 m/s to 14.45 m/s. In all the cases described, with a certain periodicity (in all cases, the frequency was different and depended on the size of the water inflows and the velocity of the air flow), the depression of the fans increased, then the air flow rate and fan depression dropped sharply, and water fell in the shafts. After decreasing the shaft air resistance, the normal ventilation mode was restored. Possible solutions to the problem of the unstable operation of the fans include redirecting part of the outgoing flow through another shaft, installing water-catching partitions in the fan drift near the junction with the shaft, and pumping water to the surface or to the sump.
In ref. [
5], the assessment of the air flow critical velocities leading to water build-up in upcast shafts found these to be 7.5–12.5 m/s. The author of the article argued that the source of water in the upcast shaft is the condensation of moisture from the air due to a drop in air temperature as it moves up the shaft. The author of [
6] indicated that the critical velocity of the appearance of water build-up was 8.0 m/s, with the proviso that this is an inaccurate value, since various factors can influence its magnitude. Due to the different air densities at different heights of the shaft, the velocity in the upper part of the shaft can be 10.0 m/s and in the lower part can be 8.0 m/s; therefore, taking into account the margin, the air velocity in the ventilation shafts should be designed so that it does not fall in the range of 7.0–12.0 m/s. Subsequently, many authors referred to, in their works (for example, [
2,
7]), the range of air velocities in ventilation shafts recommended in [
1].
Another article [
8] presented the results of CFD modeling of moisture accumulation in the upcast shaft. The simulation was carried out as a part of an investigation into the causes of the failure of the surface main fan in a mine in South Africa. The model confirmed that at an air flow velocity of 10.1 m/s, there was a gradual accumulation of moisture in the shaft, and at velocities above 12.5 m/s, all moisture was removed from the shaft.
The paper [
9] was the first to give a theoretical description of water build-up in upcast shafts. It presented a one-dimensional mathematical model of water droplet movement in the upcast shaft, and an estimation of the pressure drop depending on the air velocity and the magnitude of water inflows into the shaft was obtained. The maximum contribution to the water build-up pressure drop was achieved at an air flow velocity of 9.22 m/s. In this work, several model simplifications were adopted. First, all droplets had the same maximum diameter at which drop stability is possible. In reality, the droplet moisture in the upcast shaft is distributed according to the droplet size, from small to large, which must be taken into account in modeling. Secondly, a particular case of the water inflow source location at the mouth of the shaft was considered, although in reality the source can be located at any part of the shaft. Thirdly, when calculating the overpressure caused by the presence of droplet moisture in the shaft, only downward flying drops were taken into account, even though upward flying drops also contribute to the overpressure in the shaft and affect the operation of the main fan.
The study [
10] was a continuation of ref. [
9]. In the proposed model, an additional pressure drop was calculated that occurred due to the presence of water inflows into the upcast shaft, taking into account the depth of their source. At the same time, the model took into account the multidirectional movement of droplets depending on their size, assuming a uniform distribution of droplets by mass. However, the obtained value of the air flow velocity in the shaft of about 3 m/s, at which the maximum pressure drop of the water build-up was achieved, turned out to be significantly less than the observed range of 7.0–12.5 m/s.
Thus, the existing approaches to the theoretical description of water build-up in upcast shafts [
9,
10] are incomplete and require improvement, which was the aim of this work. Taking into account the existing data on the size distribution of water droplets, two possible mechanisms for the accumulation of droplet moisture in the air space of the upcast shaft were investigated: condensation and water inflows into the shaft. The validation of the model was carried out based on the experimental data on water build-up available in the literature.
2. Mathematical Formulation of the Water Build-Up Formation in Mine Upcast Shafts
Water build-up occurs when there is a sufficiently large amount of droplet moisture in the atmosphere of the upcast shaft, which creates significant air resistance to the air flow movement. The air will take on the weight of all the droplet moisture in the shaft space, and due to this, a significant pressure drop can occur in the shaft. If we assume that the water build-up in the shaft is a stationary process, the droplet moisture of mass
, kg, located in the shaft, acts on the air flow with a force equal to the weight of all drops. If we correlate this force with the shaft section
, m
2, then we will obtain a part of the depression ∆
P of the main fan that is spent to overcome the additional air resistance of droplet moisture, Pa:
where
is the acceleration of gravity, m/s
2.
There are two reasons for the appearance of moisture in the shaft: moisture condensation in the upstream flow of saturated air and the presence of water inflows into the shaft from aquifers through a leaky shaft lining. In both cases, some of the relatively small droplets are taken out by the upward flow into the fan drift, and some either flow down the shaft walls or fall down in the form of large, heavy drops. Thus, droplet moisture can move both down and up the shaft, depending on the ratio of the weight of each droplet and the aerodynamic drag acting on them from the upward air flow. The maximum water drop diameter is ~6 mm, which is consistent with the meteorological studies [
11] and numerical experiments [
12]. Drops larger than 6 mm will break up under the action of an air flow.
A water droplet reaches its terminal velocity in a fairly short time interval of 2–5 s while moving in the shaft space. The terminal velocity of a water droplet depends on its diameter [
12,
13]. Let us consider the two most well-known empirical formulas that describe terminal velocity as a function of the droplet diameter:
- —
Dependences of droplet terminal velocity on the droplet diameter are shown in
Figure 1.
Figure 1 shows that these two formulas give approximately the same terminal droplet velocities for different droplet diameters. One can see a general pattern: with an increase in the droplet diameter to about 3 mm, its terminal velocity increases, and with a droplet diameter of more than 3 mm, the terminal velocity reaches a constant value. This pattern can be explained as follows. Conventionally, two ranges of drop sizes can be distinguished, each of which has its own aerodynamic drag law. Droplets with a relatively small diameter retain their spherical shape during motion. In this case, it is possible to estimate the terminal velocity of a water droplet by equating the gravity force acting on the droplet to the drag force:
where
is the water density, kg/m
3;
is the air density, kg/m
3; and
is the dimensionless drag coefficient, for a sphere at
:
[
16]. Therefore, droplet terminal velocity is expressed as follows:
A falling droplet retains the shape of a sphere when the droplet surface tension forces exceed inertial forces:
where
is the Weber number,
is the surface tension coefficient of water, N/m. The upper limit of the droplet spherical shape preservation can be set to the condition
. Substituting the corresponding parameters in Formulas (5) and (6) gives the droplet diameter boundary value
mm.
When the air flow’s inertial force becomes commensurate with the surface tension force, a droplet begins to deform. According to Formulas (2) and (3), for drops with a diameter of more than 3 mm, their terminal velocity does not depend on the diameter and is approximately 9.2 ÷ 9.5 m/s. This means that an increase in gravity force, which is proportional to a droplet’s volume, is fully balanced by an increase in aerodynamic drag force, which is proportional to the droplet’s midsection area. If we assume that in this case a droplet has the shape of a rotational ellipsoid [
12,
17] with a horizontal semi-axis
and a vertical semi-axis
, then by equating gravity force to drag force, we obtain the expression:
It follows from (7) that drop terminal velocity can be constant only in the case of = const and this is possible only in the case when the increase in the drop volume is ensured by an increase only in the horizontal size of the droplet. In other words, the larger the droplet, the more it flattens out when it falls in the air.
If the air flow velocity in the shaft is greater than the maximum droplet terminal velocity ≈ 9.3 m/s, then all droplets will be taken out to the surface. If the air flow velocity in the shaft is less than 9.3 m/s, both ascending and falling drops will contribute to the additional resistance of the shaft. Since the direction of the droplet motion depends on the ratio of the air flow velocity and its terminal velocity, and hence on its diameter, the distribution function of the droplet concentration over diameters
should be taken into account in the model. The existing literature lacks data on drop distribution by diameter in upcast shafts. We can use the hypothesis proposed in [
10] regarding the uniform distribution of the concentration of drops by mass in the entire space of the shaft due to the random formation, decay, and merging of drops:
An alternative would be to use existing raindrop distribution functions. By themselves, the distribution functions of drops by diameter
are determined empirically for each specific rain intensity by directly counting the number of drops with diameters
in some way in the interval
) per unit volume [
18,
19,
20,
21]:
where
is the total number of drops per unit volume, and m
−3;
is the maximum droplet diameter, mm.
The generally accepted dimension of raindrop distributions
is m
−3mm
−1 [
18].
Various researchers have obtained different distributions of raindrops by diameter on the basis of the results of raindrop number measurements of different rain intensities
, mm/h. Attempts to formally mathematically describe the obtained distributions have led to a large number of different droplet distribution functions [
17,
18,
19,
20]. The following distribution functions are the most commonly used:
- —
- —
- —
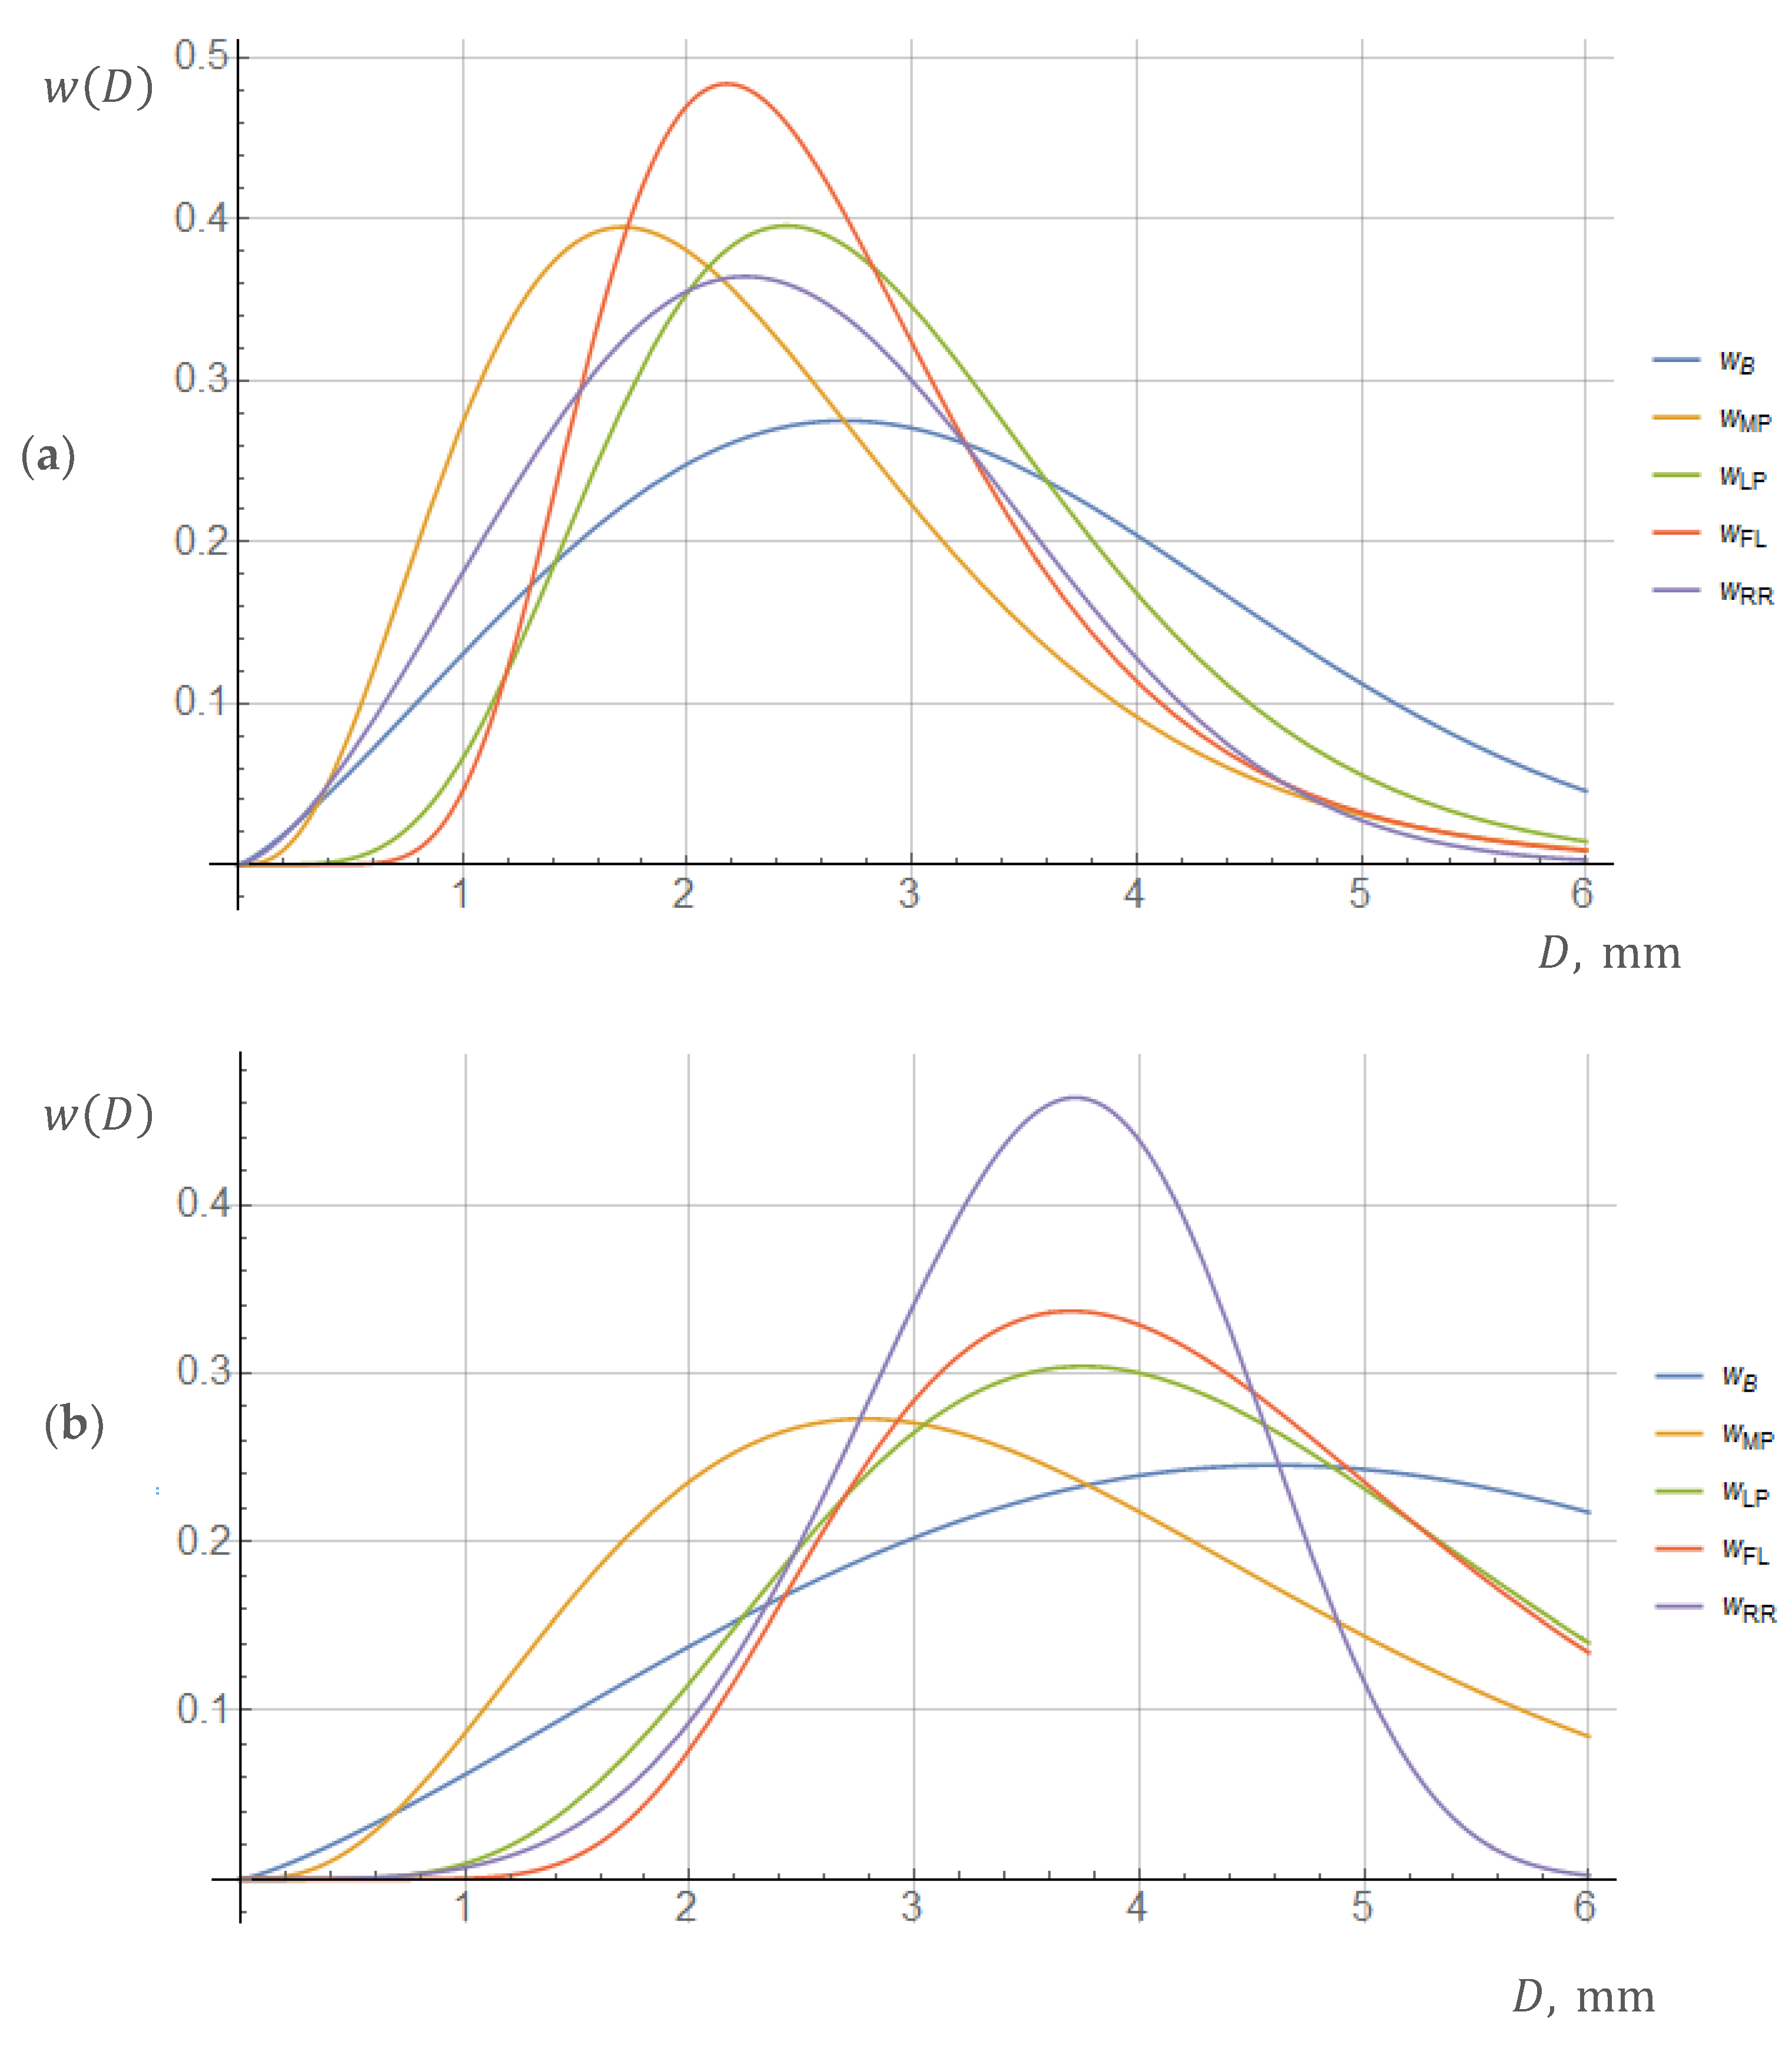
Figure 2 shows the graphs of the distributions (10)–(13) for various values of the intensity
. A tendency for all types of distributions to shift to the right with increasing intensity
was noted, i.e., the greater the intensity, the larger the droplets in the observed volume. In this case, the number of droplets larger than 6 mm was extremely small due to the fact that droplets of a large diameter lose their stability and break up into droplets of a smaller diameter. However,
Figure 2 shows a significant difference between distributions (10)–(11) and (12)–(13). The first two distributions had a large number of droplets of small diameter. The complexity of experimentally taking into account small drops explains the difference. The only reliable way to account for very small raindrops is the method of trapping them in glass cuvettes with castor oil, then photographing and counting the number of drops under a microscope [
18].
However, when calculating the effect of droplet moisture on the air resistance of an upcast shaft, a more important characteristic is the distribution of droplets by mass, or water content
, kg/m
4. The water content density distribution by droplet diameter
describes the water content fraction that falls on the interval of droplet diameters
, where
. The plots of the water content density distribution by droplet diameter, depending on the intensity
, are shown in
Figure 3. A plot of the water content distribution by droplet diameter according to the Rosin–Rammler distribution function
is also shown in
Figure 3. This distribution is usually used in the analysis of particle size reduction and assessment of the dispersed composition of droplets when spraying aerosols [
25]:
where
is the average particle diameter, and
is the distribution index. The values of the parameters
and
, as a rule, are found empirically. The value
is equal to the total fraction of droplets with a diameter less than or equal to
. In this paper, the average diameter
was chosen as the average of distributions (10)–(13), and the distribution index
was chosen in such a way that the water content distribution density
completely fell in the range of diameters from 0 to 6 mm, because according to [
11,
12], the maximum stability diameter of a water droplet is ~6 mm.
Figure 3 shows that despite the fact that different distributions were obtained by different authors in different regions at different times using different methods, these distributions reflect general patterns, namely:
The lines of equal intensity are grouped relatively compactly over almost the entire spectrum of droplet diameters.
The droplet diameter corresponding to the maximum water content varies within a fairly narrow range.
As the intensity increases, the droplet diameter corresponding to the maximum water content increases.
3. Results and Discussion
As mentioned above, there are two reasons for the appearance of moisture in the shaft: moisture condensation and water inflows into the shaft through a leaky shaft lining. To assess the additional depression on the main fan due to the water build-up, it is necessary to separately consider both scenarios for the droplet moisture appearance in the shaft.
3.1. The Water Build-Up Due to Moisture Condensation in the Outgoing Air Flow
Let us consider the situation when the droplet moisture in the shaft is formed only as a result of condensation from the upstream air flow. As the air flow moves up the shaft, its pressure and temperature decrease, causing moisture to condense from the air, whose relative humidity is initially close to 100%. In the process of further movement, the condensed moisture is combined into water droplets. Furthermore, the process of forming drops of various sizes occurs due to the merging of small droplets as well as the breaking of large droplets as a result of interaction with the lining and equipment of the shaft.
The pressure drop in the shaft due to the droplet moisture from condensation, taking into account droplet size distribution, should be calculated as follows:
where
is the shaft depth, m.
Under conditions of stationary moisture exchange, the total removal of moisture from the shaft (through the lower and upper boundaries) becomes equal to the release of moisture due to condensation, i.e., the following condition is met:
where
is the change in the moisture content of the air flow as it rises along the shaft, kg/kg; and
is a critical droplet diameter corresponding to droplet terminal velocity according to the Formulas (2) and (3).
Thus, from Equations (2), (3), (10), and (16), it is possible to determine the pressure drop in the shaft due to droplet moisture because of condensation:
where
m/s is the terminal velocity of drops with a diameter of 6 mm, according to (2) and (3);
is the dimensionless pressure drop in the shaft due to water build-up with the unit
.
To estimate the pressure drop in the shaft due to the condensed droplet moisture, we used the results of experimental measurements in the upcast shaft VS-7 of the Taimyrsky mine (the shaft diameter is 8 m), presented in [
10]. In the course of experimental measurements, the presence of moisture condensation in the shaft from the level of −750 m to the interface with the main fan drift at the level of +190 m was established. The moisture content at the level of −750 m was 0.01788 kg/kg; in the main fan drift, it was 0.01476 kg/kg; therefore,
= 0.00312 kg/kg. Thus, at the air flow rate of 346 m
3/s (air velocity
= 6.9 m/s), the moisture release rate
in the shaft was 1.3 kg/s.
The moisture release rate
, kg/s, is related to the intensity
, mm/h, by the following relationship:
where
is the cross-sectional area of the shaft, m
2; and
is the water density, kg/m
3.
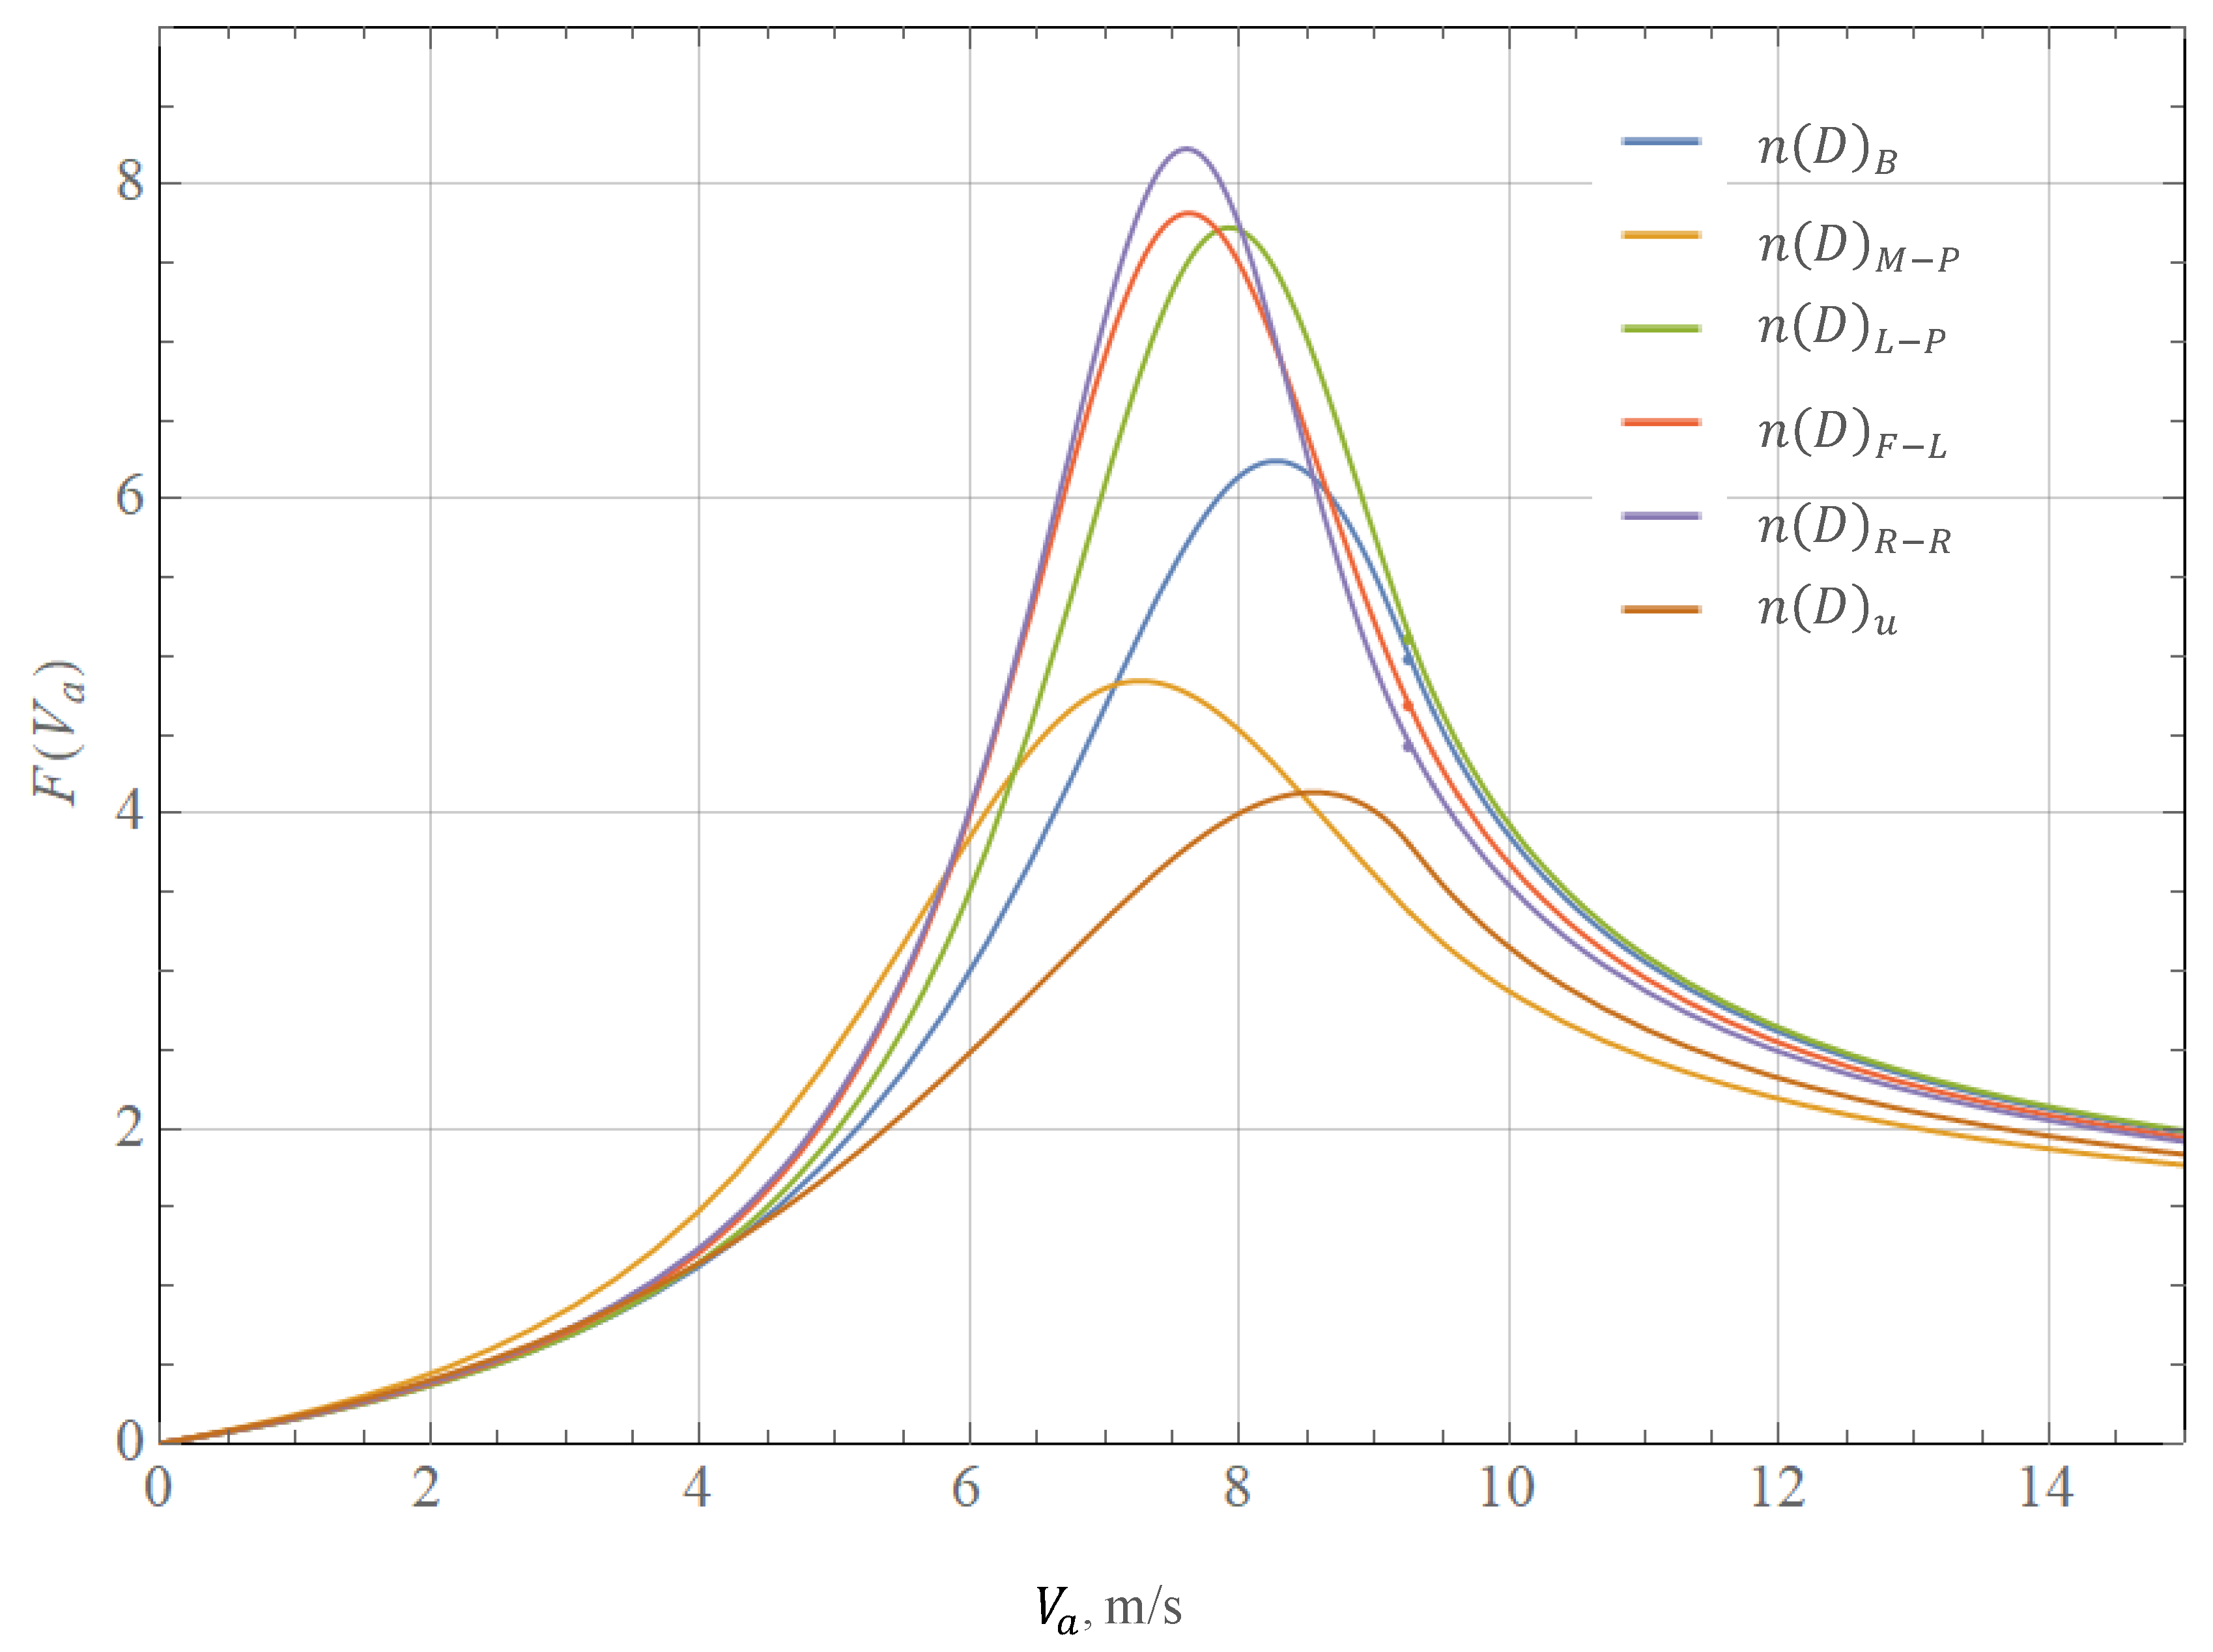
Thus, = 1.3 kg/s corresponds to an intensity = 92 mm/h.
To analyze Formula (17) for different types of droplet distributions, plots of the function
are presented in
Figure 4.
The pressure drop in the VS-7 shaft due to moisture condensation, according to (17), ranged from 116.4 Pa (at = 3.2 for the uniform distribution of droplets by mass) to 245.4 Pa (at = 6.8 for the Rosin–Rammler distribution) depending on the distribution type , while the maximum possible value of the pressure drop (at = 8.2 for the Rosin–Rammler distribution) was 294.9 Pa. The critical velocity leading to the maximum influence of the water build-up on the shaft air resistance varied from 7.2 m/s to 8.6 m/s, depending on the droplet distribution type.
Thus, the resulting pressure drop due to the presence of droplet moisture in the VS-7 shaft was small enough to allow the main fan to go beyond the stable operation zone, which is consistent with other research [
9,
10]. In the case of deeper shafts, the pressure drop due to the water build-up may be greater, which follows from Formulas (13) and (14). Additionally, the effect will be stronger the higher the temperature and relative humidity of the air entering the shaft from the underground levels are (because in this case, when the air flow rises, the relative humidity will reach 100% faster, and after reaching it, more moisture will be released in the case of hotter airflow).
3.2. The Water Build-Up Due to Water Inflows into the Upcast Shaft
In conditions of intensive water inflows through the leaky shaft lining, the additional air resistance of the water build-up can significantly affect the operation of the main fan. It should be noted that the source of water inflows in the upcast shaft can be located at any depth , counted from the surface. A pressure drop due to water inflows is created both by rising drops, the diameter of which is less than the critical one, and by falling drops, the diameter of which is greater than the critical one.
Thus, the pressure drop due to water inflows will have the following form:
Under conditions of stationary moisture exchange, the total removal of moisture from the shaft (through the lower and upper boundaries) becomes equal to the intensity of water inflows into the shaft, i.e., the condition is met:
where
is the intensity of groundwater inflow into the shaft, kg/s.
Thus, from Equations (2), (3), (19), and (20), it is possible to determine the pressure drop in the shaft due to the water inflows:
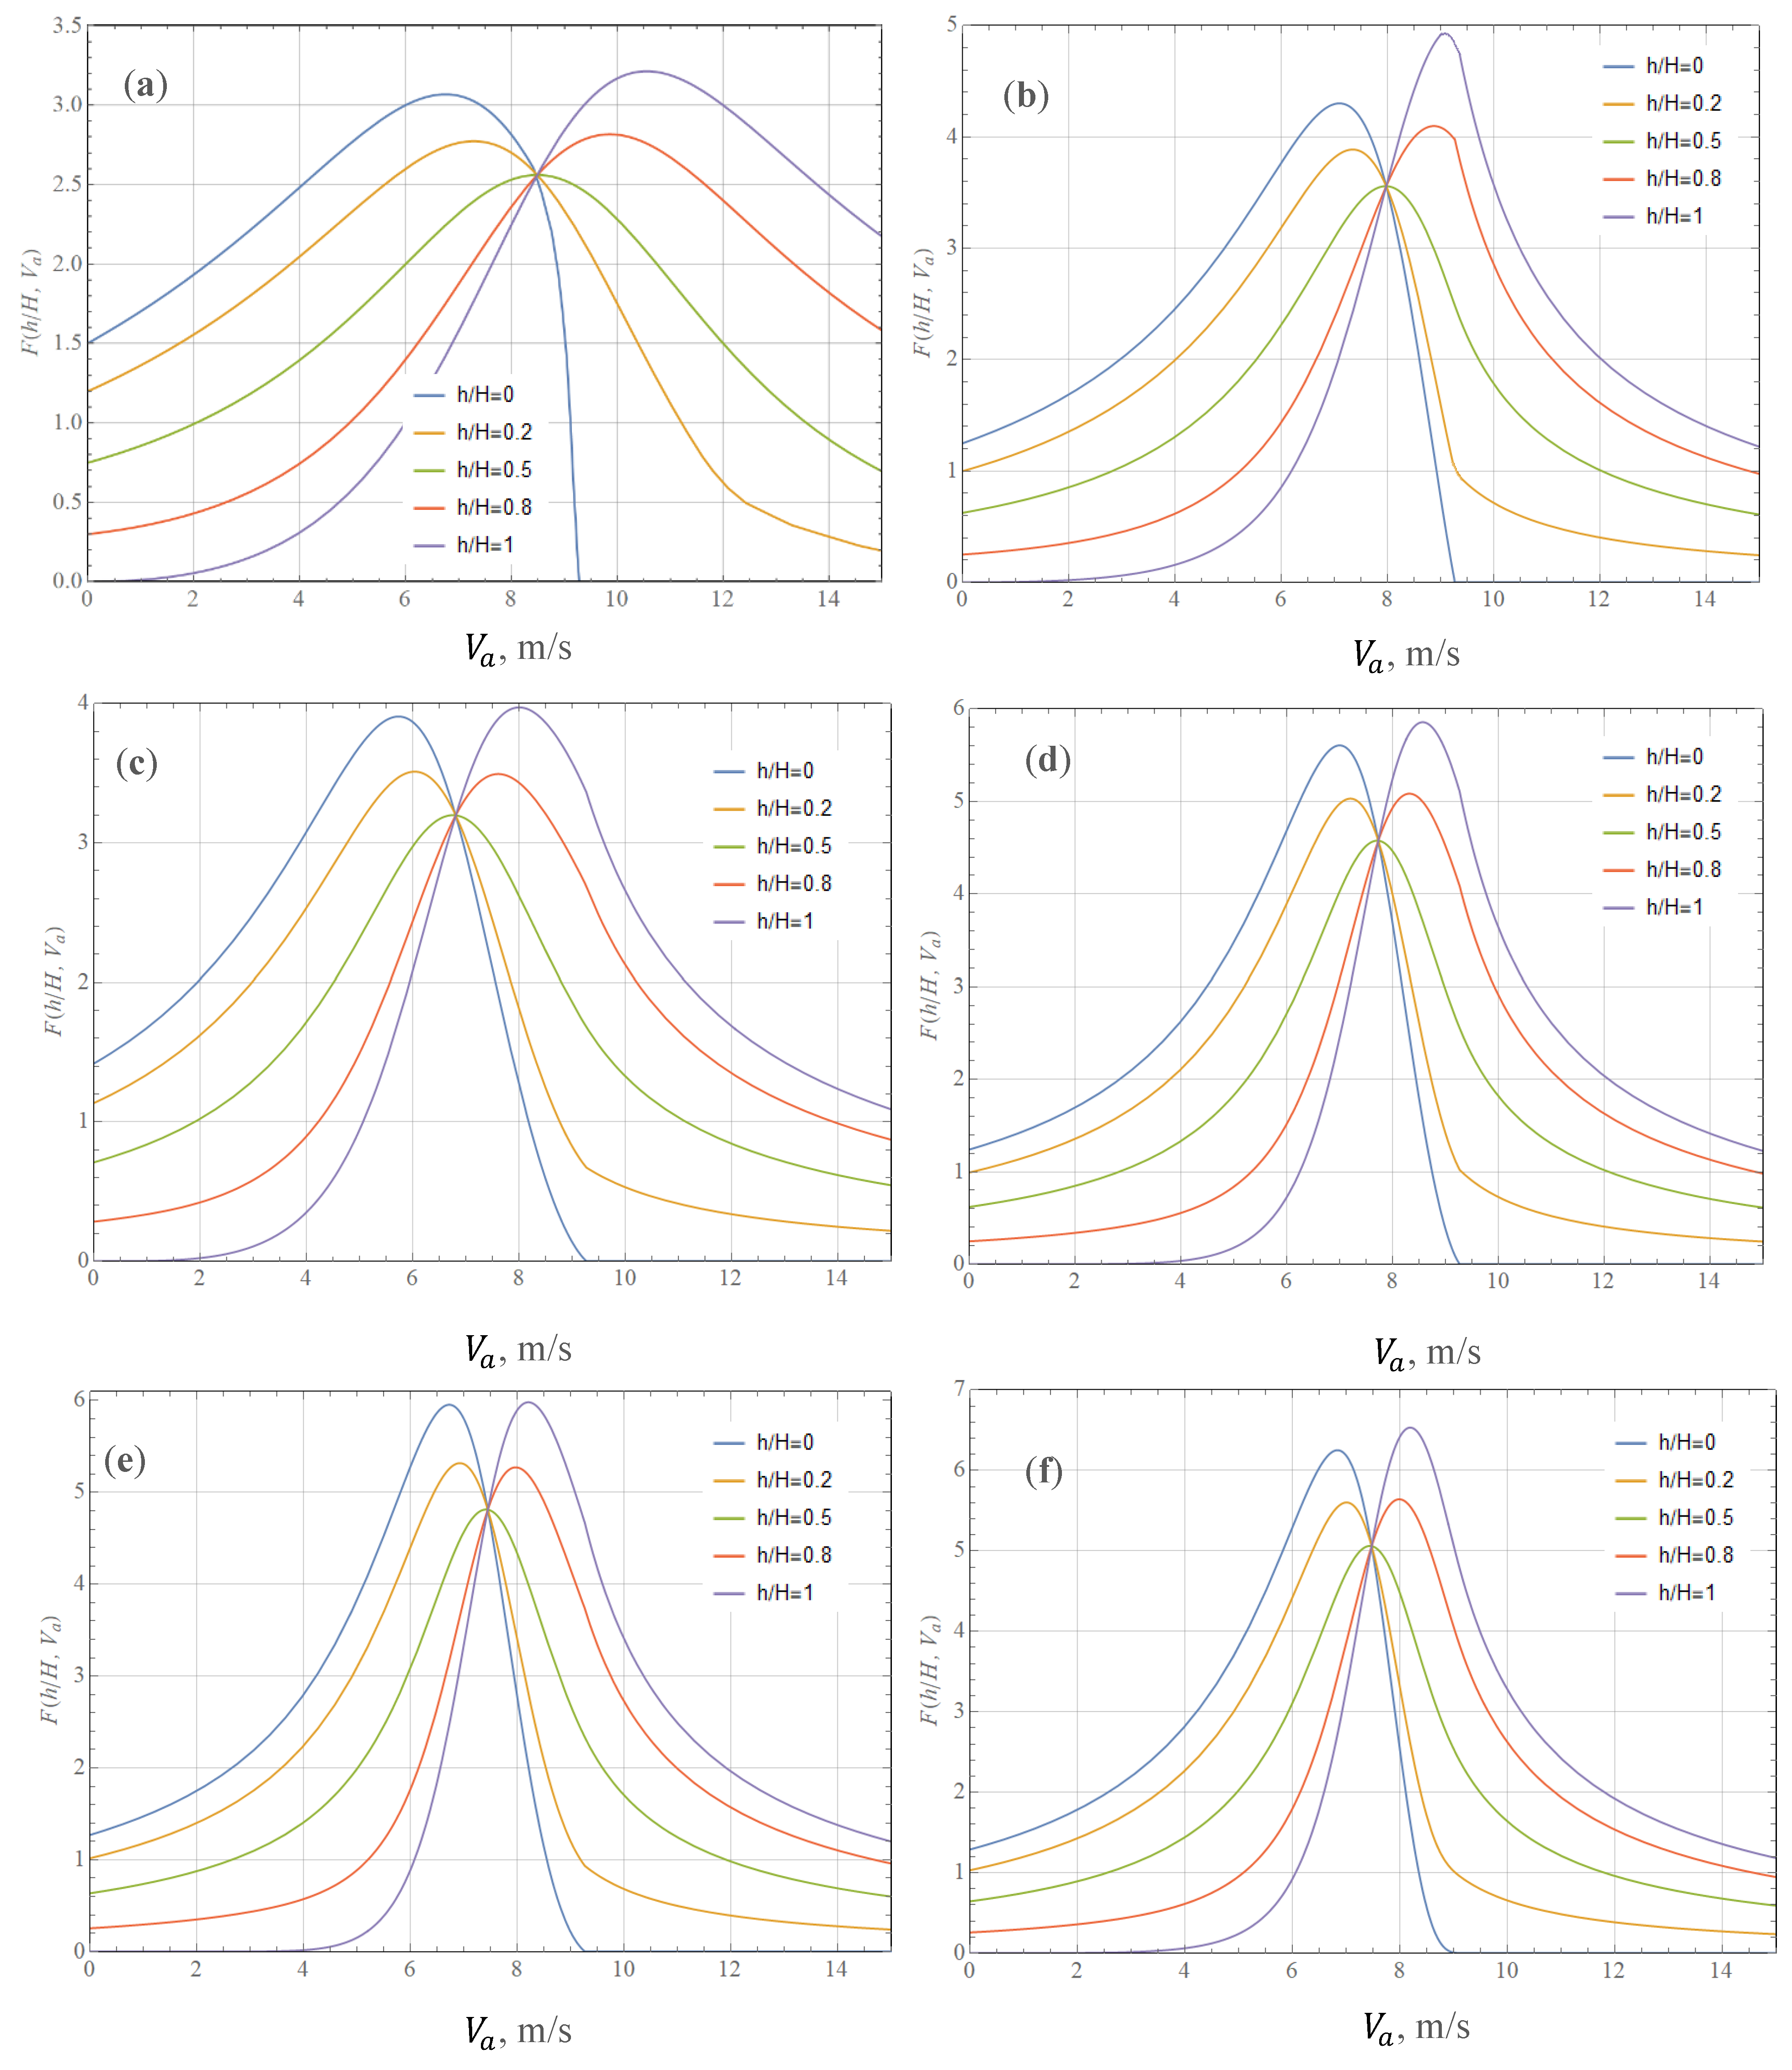
A graphical analysis of the Formula (21) is given in
Figure 5, which shows the dependence of the function
on air flow velocity for various droplet distributions in the case
= 92 mm/h, corresponding to a water inflow of 1.3 kg/s. This function
plays the role of a dimensionless pressure drop with the unit
.
The dependence of the dimensionless pressure drop in the shaft versus the air flow velocity and the depth of the water inflow source for all droplet distribution types has a similar form, differing somewhat from each other in maximum points and function values at these points. In all cases, the influence of the water build-up is greater when the water inflow source is located either in the upper part or in the lower part of the shaft. However, to realize the maximum effect, each limiting case has its own critical air velocity in the shaft. Water entering the shaft at some intermediate point will always increase air resistance, but this effect will be less noticeable than in extreme cases. These conclusions qualitatively agree with the results of a physical experiment, which are presented in [
1].
For the studied case of water inflows with intensity = 92 mm/h ( = 1.3 kg/s):
- —
When groundwater enters the shaft from its upper part, the maximum value of the pressure drop will be from 145.6 Pa (uniform distribution) to 291.3 Pa (Rosin–Rammler distribution), while the critical velocity will vary from 5.8 m/s to 7.0 m/s.
- —
When groundwater enters the shaft from its lower part, the maximum value of the pressure drop will be from 150.3 Pa (uniform distribution) to 310.1 Pa (Rosin–Rammler distribution), while the critical velocity will vary from 8.0 m/s up to 10.5 m/s.
With an increase in the water inflows intensity, both the magnitude of the pressure drop in the shaft and the critical velocities corresponding to the maximum effect of the water build-up will increase due to an increase in the average size of the droplets that make the maximum contribution to the water content. At the same time, the hypothesis of a uniform distribution of droplets by mass proposed in [
10] underestimates the pressure drop of a water build-up by about two times.
Thus, groundwater inflows into the shaft through the leaky shaft lining are a significant factor of the water build-up formation, especially when the outgoing air is already saturated or close to saturation, so it is important to prevent their occurrence. At the same time, water inflows into the shaft through a leaky shaft lining are a controlled parameter and can be minimized by implementing appropriate technical measures. To reduce the water build-up impact on the main fan and the mine ventilation system, the following arrangements are possible:
- —
Sealing of the upcast shaft lining in order to exclude or reduce the intensity of water inflows into the shaft.
- —
Implementation of a water pumping system in the sump and in the main fan drift in order to prevent re-entry of moisture into the shaft space.
- —
Selection of the main fan operation mode, which ensures the movement of the air flow in the shaft at a velocity that excludes the occurrence of water build-up.


