1. Introduction
A network is made up of nodes connected by edges. One of the earliest network science papers pertains to small-world networks [
1,
2,
3]. Watts and Strogatz defined a small world network as a network with a high clustering coefficient and low average shortest path. The classic example of a small world network is the “six degrees of Kevin Bacon” [
4]. The challenge is finding the shortest path between two nodes (a specific actor and Kevin Bacon). It uses the network of Hollywood actors consisting of actors as nodes. Two nodes in the network are connected if they co-starred in the same movie.
This example is also known as the Kevin Bacon Game or The Oracle of Bacon. The Oracle of Bacon uses data from English-language articles in Wikipedia, which has over 128,000 movies and 358,000 actors [
5]. Through this game [
6], Kevin Bacon is often claimed to be the center of the Hollywood actor network. Rob Cross, who wrote Beyond Collaboration Overload, says that the six degrees of Kevin Bacon show that he is well-connected in the film industry. This is because he has acted in a wide range of movies; superhero movies like X-Men: First Class (2011), horror movies like Friday the 13th (1980), action movies like Apollo 13 (1995), animations like Balto (1995), musicals like Footloose (1984), and many more. According to the Internet Movie Database (IMDb), he has starred in 70 films in 17 distinct genres including comedy, action, thrillers, drama, family, musical, and many others [
7]. It is not the raw amount of films that places Kevin in a central position within the network; instead, it is his ability to bridge relationships between genres [
8,
9].
The Kevin Bacon phenomenon inspired us to examine the situation of the Malay language film industry. We focused on the Malay language film industry because Malay is the official language of Malaysia, and the size of the industry is the biggest one in Malaysia. Judging the capacity of an actor is subjective; with different critics having different opinions, few actors achieve unanimous recognition. Therefore, we took a data-driven approach and manually collected data on Malay language film actors within the year 2015 to 2020 with detailed information about their movies and their co-stars to form a database (detailed info in
Appendix A). We assessed the capacity of an actor using different indicators, taking into account the connections formed with their co-stars and the diversity of the film genres.
An important measure of the capacity of an actor is popularity. According to various academic researchers, there are different ways to measure the popularity of an actor. Some classify famous actors as actors that starred in top-grossing films [
10]. We could not utilize the same definition because the Malay film net profit information gleaned from press releases is incomplete. Meanwhile, Jung and Kim (2010) would define popularity as appearing in at least five films in their data sets from 1988 to 1999 [
11]. We utilized this definition of a popular actor (at least five films).
In the Kevin Bacon network, the shortest path was used to calculate the distance between actors in the network [
1]. Through network analysis, we could also measure centralities to identify actors with important social positions in the network. Centralities are one way to measure the importance or popularity of a node; higher centralities indicate higher importance. However, different centralities would capture different definitions of importance in the network.
There are a few different ways to measure the quality of actors. One way is to look at their history of being nominated for or winning an award (for example, the Academy Award, also known as the Oscars) [
10]. However, the complete list of Malaysia’s prestige award winners and nominee actors is unavailable online. Other academic researchers would use The Hollywood Reporter’s Star Power Survey because the survey would include executives and insiders to rank the actors’ talent [
12,
13,
14,
15]. We would take a different strategy due to unavailability of such data, which is through quantifying an actor’s repertoire by the diversity of their film genres measured using Herfindahl–Hirschman Index (HHI) [
16,
17].
Past research of actor networks used English movies [
18,
19], Indian movies [
20], Afrikaans movies [
21] and Russian movies [
22], but as far we know, none exist for Malay language movies. Therefore, we used data of 180 Malay movies collected from various sources including the Malay language Wikipedia, which represents the Malay film industry for the time window of 2015 to 2020 (more information in
Appendix A). In
Section 2, we examine the capacity of actors through their social importance in the network and the number of movies they have acted in. We analyze the actor network by using the centrality measures and common measures of a small world network. In
Section 3, we examine the genre diversity and the actors’ genre diversity evolution over six years. This study shows that the combination of the number of films, network measures, and genre diversity is able to quantify various qualities of an actor.
2. The Actor Network of Malay Language Films
A network
consist of a set nodes
, and a set edges
, written as
[
23,
24]. In our network, actors are taken as nodes. These nodes are connected by an edge if these actors have acted in a movie together. The edges are weighted, and the weight indicates the number of films the actors share (co-films). An adjacency matrix
represents the network.
The co-occurrence network can be represented using the adjacency matrix in Equation (1). The adjacency matrix is
, where
is the number of actors (nodes) and
. Since the actor network is a weighted network,
can take any integer value representing the number of co-films between the actors
and
. A pair of
indicates a film acted by both actor
and
, thus
refers to the number of co-films between
and
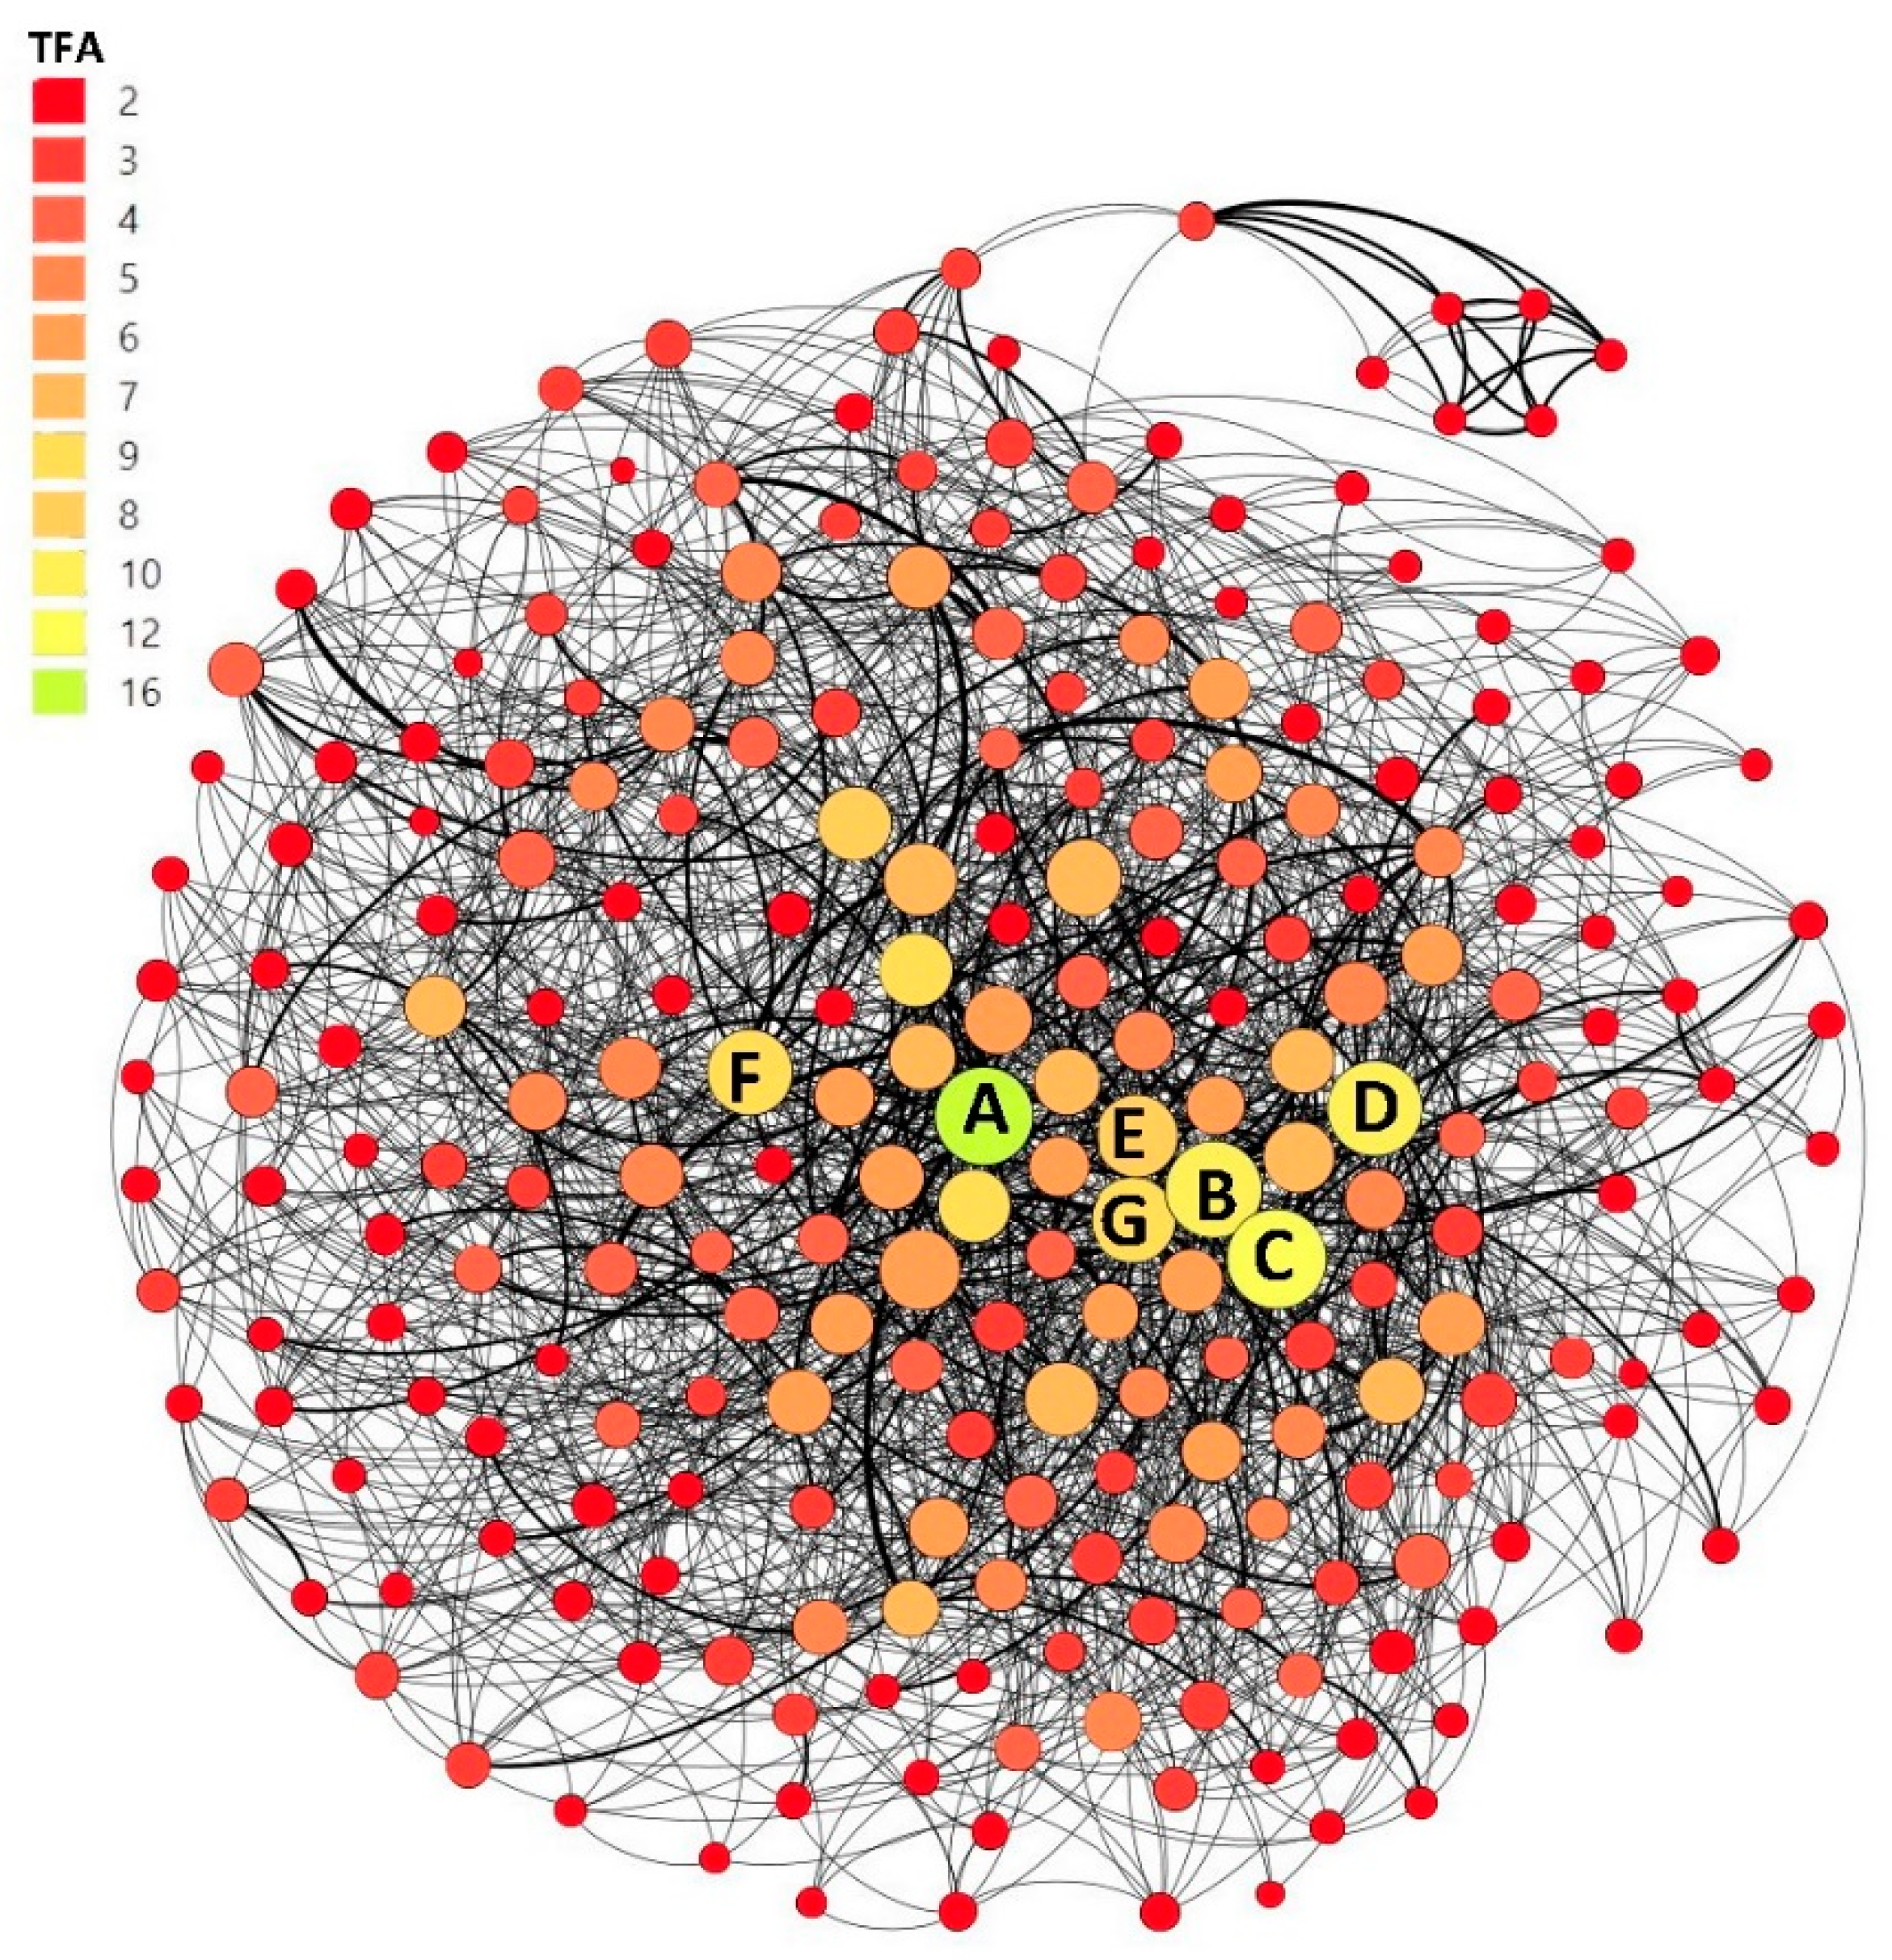
. The Malay (language) film actor network is a weighted network with 243 nodes and 1822 edges, as shown in
Figure 1 and
Figure 2.
Table 1 is a list of variables and definitions utilized in this article.
2.1. Small-World Networks and Average Shortest Path
An actor network is a social network that is expected to have small-world properties [
1] and the candidate for Kevin Bacon should have a low average shortest path. We will compare the actor network to various simulations of Watts–Strogatz small-world networks. Moreover, we calculate the average shortest path for every actor to find the candidate for Kevin Bacon. Our actor network has a density of 0.0619, average shortest path of 2.4798, and clustering of 0.4453 (definitions in
Appendix B). We compared these values to measures on simulated small world networks.
The Watts–Strogatz small-world network, defined as
where
is the number of nodes and
is the average degree in the network (will be explained in
Section 2.2). Meanwhile,
p is the probability of rewiring an edge. If
is zero, the network is regular, and if
is one, the network is random. We used the information from our actor network to simulate
with
and
for various
in the range
. The simulated values of
were iterated 1000 times and the average value for each simulated
is highlighted in
Table 2.
The density of
is 0.0579 for each
and is close to the density of the actor network, which is 0.0619. Since density is the number of edges divided by the maximum number of edges, a real small-world network that rewires should have a constant density. Based on
Table 2,
simulations give a large clustering coefficient and low shortest path for ranges
which are properties of a small-world network. The actor network has a lower average shortest path than
simulations, but a higher clustering coefficient in general. However, in this sense, the actor network is comparable to a small-world network.
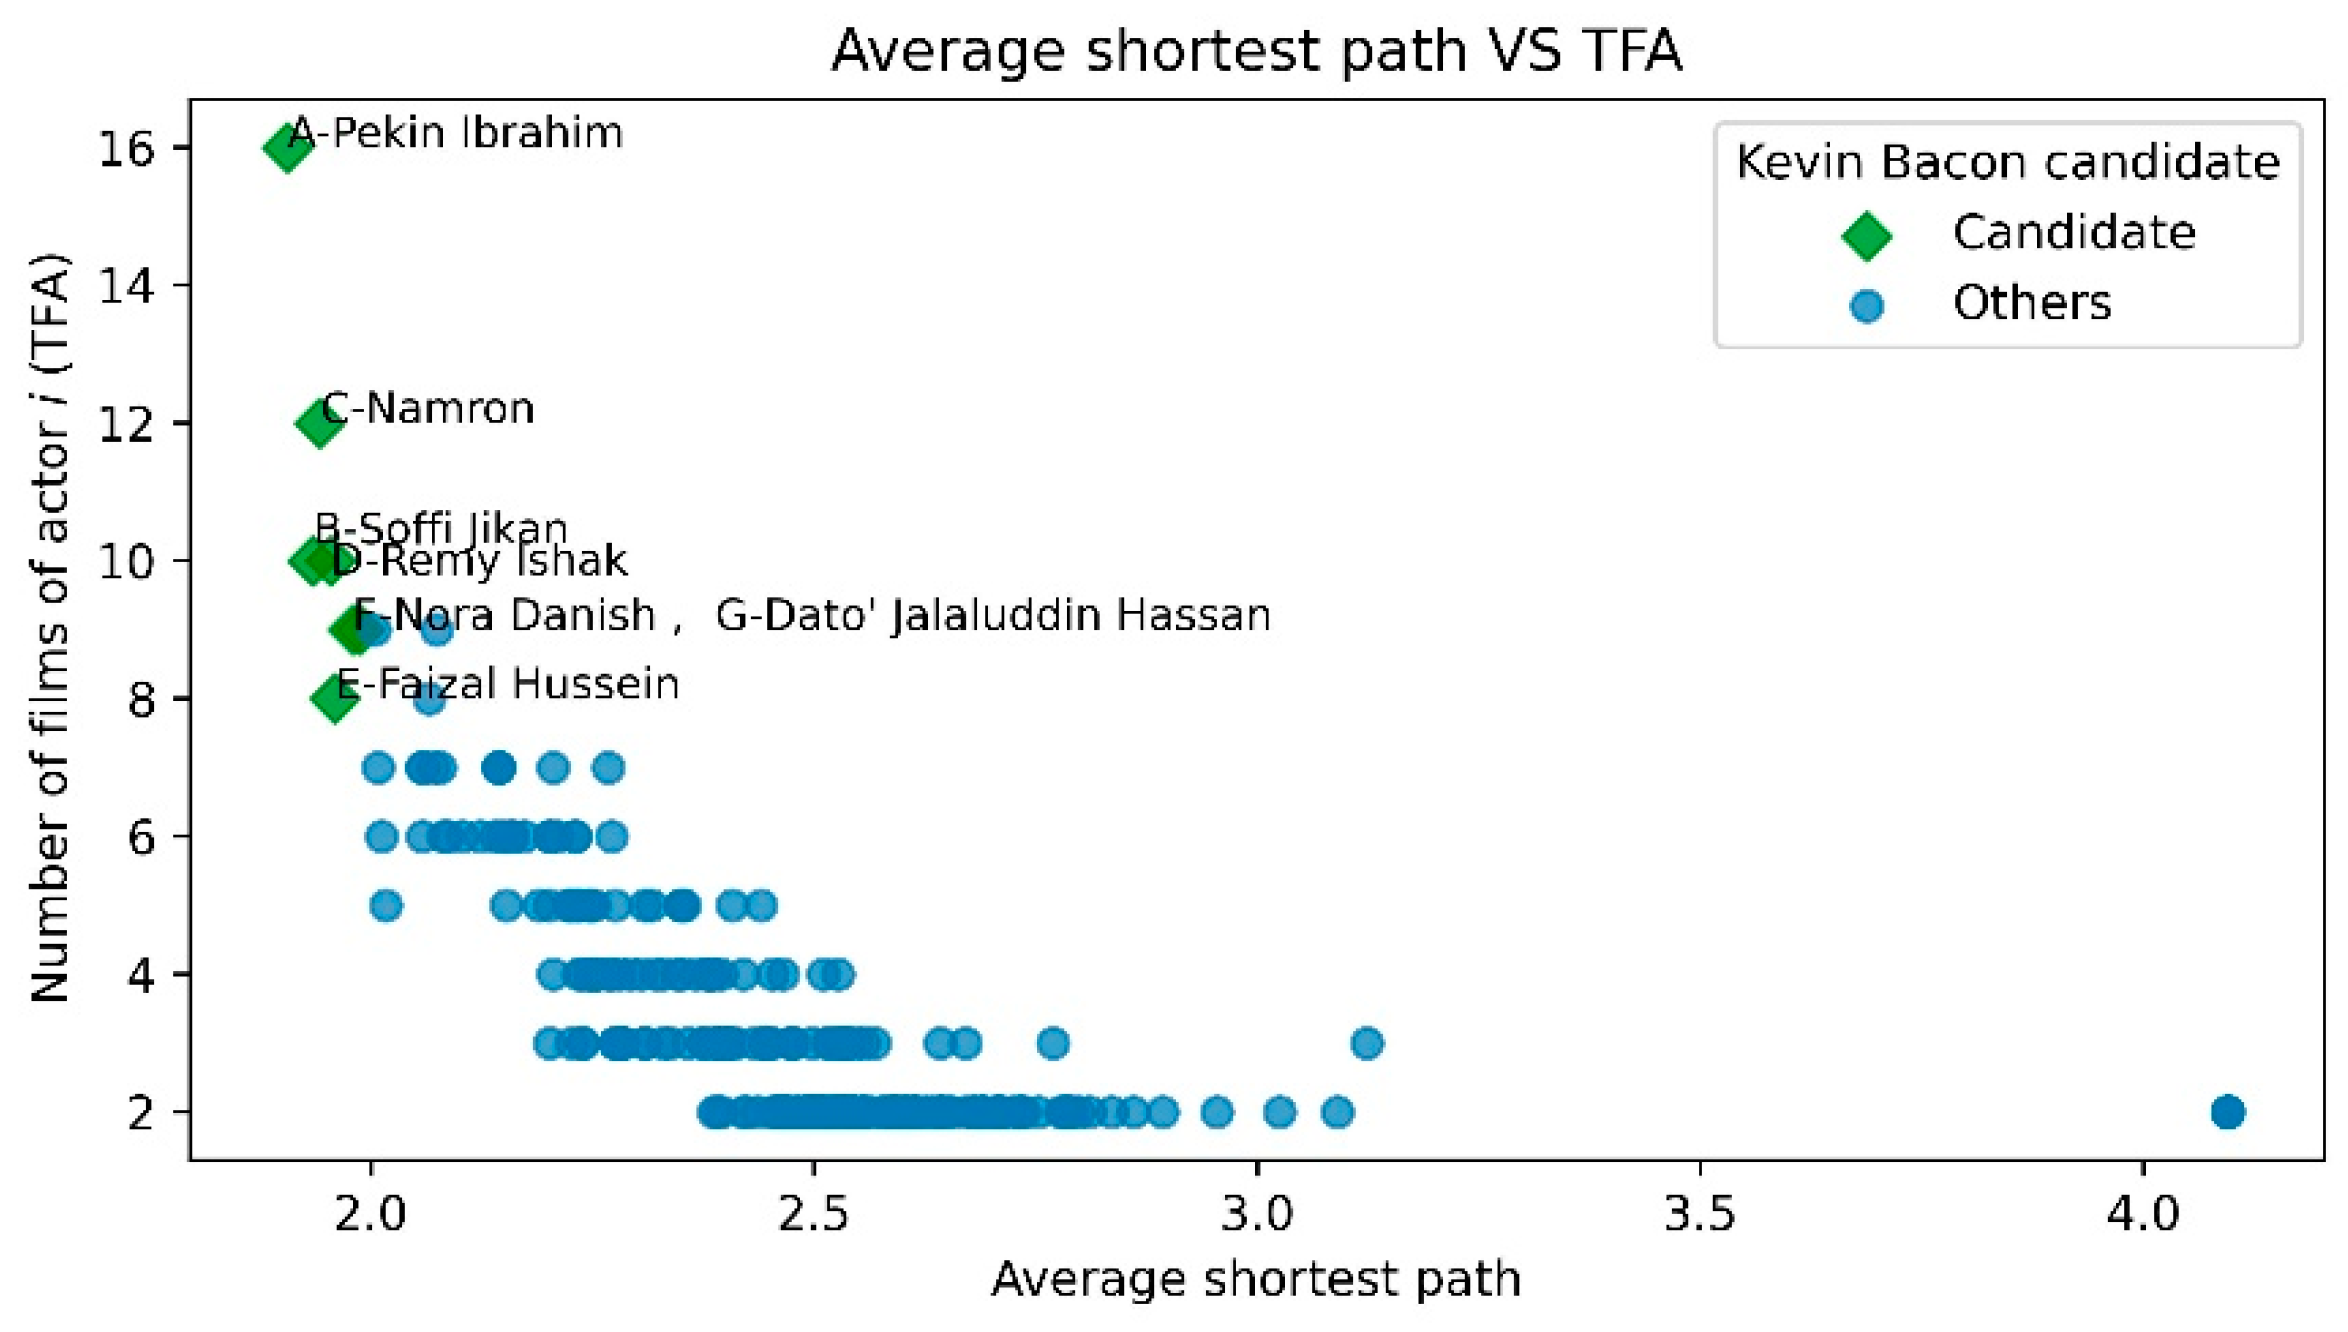
In the search for the ‘Kevin Bacon’ of our network, we investigate the shortest path [
1] between actors. We calculated the average shortest path (definition in
Appendix B) for every actor and visualized it against TFA in
Figure 3.
We pick seven actors with the lowest average shortest path to be the candidates for “Kevin Bacon” of our network. Since Kevin Bacon was chosen due to his low average shortest path, then it seems that Pekin Ibrahim should be the “Kevin Bacon” of our actor network. However, we shall also consider other measures. We will highlight these seven actors in our next subsection to see their respective centrality values.
2.2. Degree Centrality and Strength Centrality
Degree, strength, closeness, betweenness, and eigenvector centrality are all examples of centrality measures, each of which can be used to identify important nodes in a network but with different interpretations of importance. In this study, we will only use degree centrality, strength, and betweenness centrality (the formula explained in
Appendix C). We have also computed closeness and eigenvector centrality (in
Supplementary Materials). However, closeness centrality does not highlight different results from DC and BC, since it serves to quantify proximity of the actors. Meanwhile, eigenvector centrality yields similar results to DC.
High DC nodes are expected to have high TFA. We measured the correlation of DC with TFA and highlighted the difference. We depict the value of DC using the size of the nodes in the network, while the color of the nodes signifies their TFA, as shown in
Figure 1. DC measures an actor’s connection in the network, which would calculate how many other actors they have co-acted with. The seven candidates for “Kevin Bacon” (labelled as A, B, C, D, E, F, and G) have a bigger size of nodes in the network indicating high DC. The actors with high DC are generally actors with high TFA, since the more an actor works, the more connection he or she will make with their co-actors.
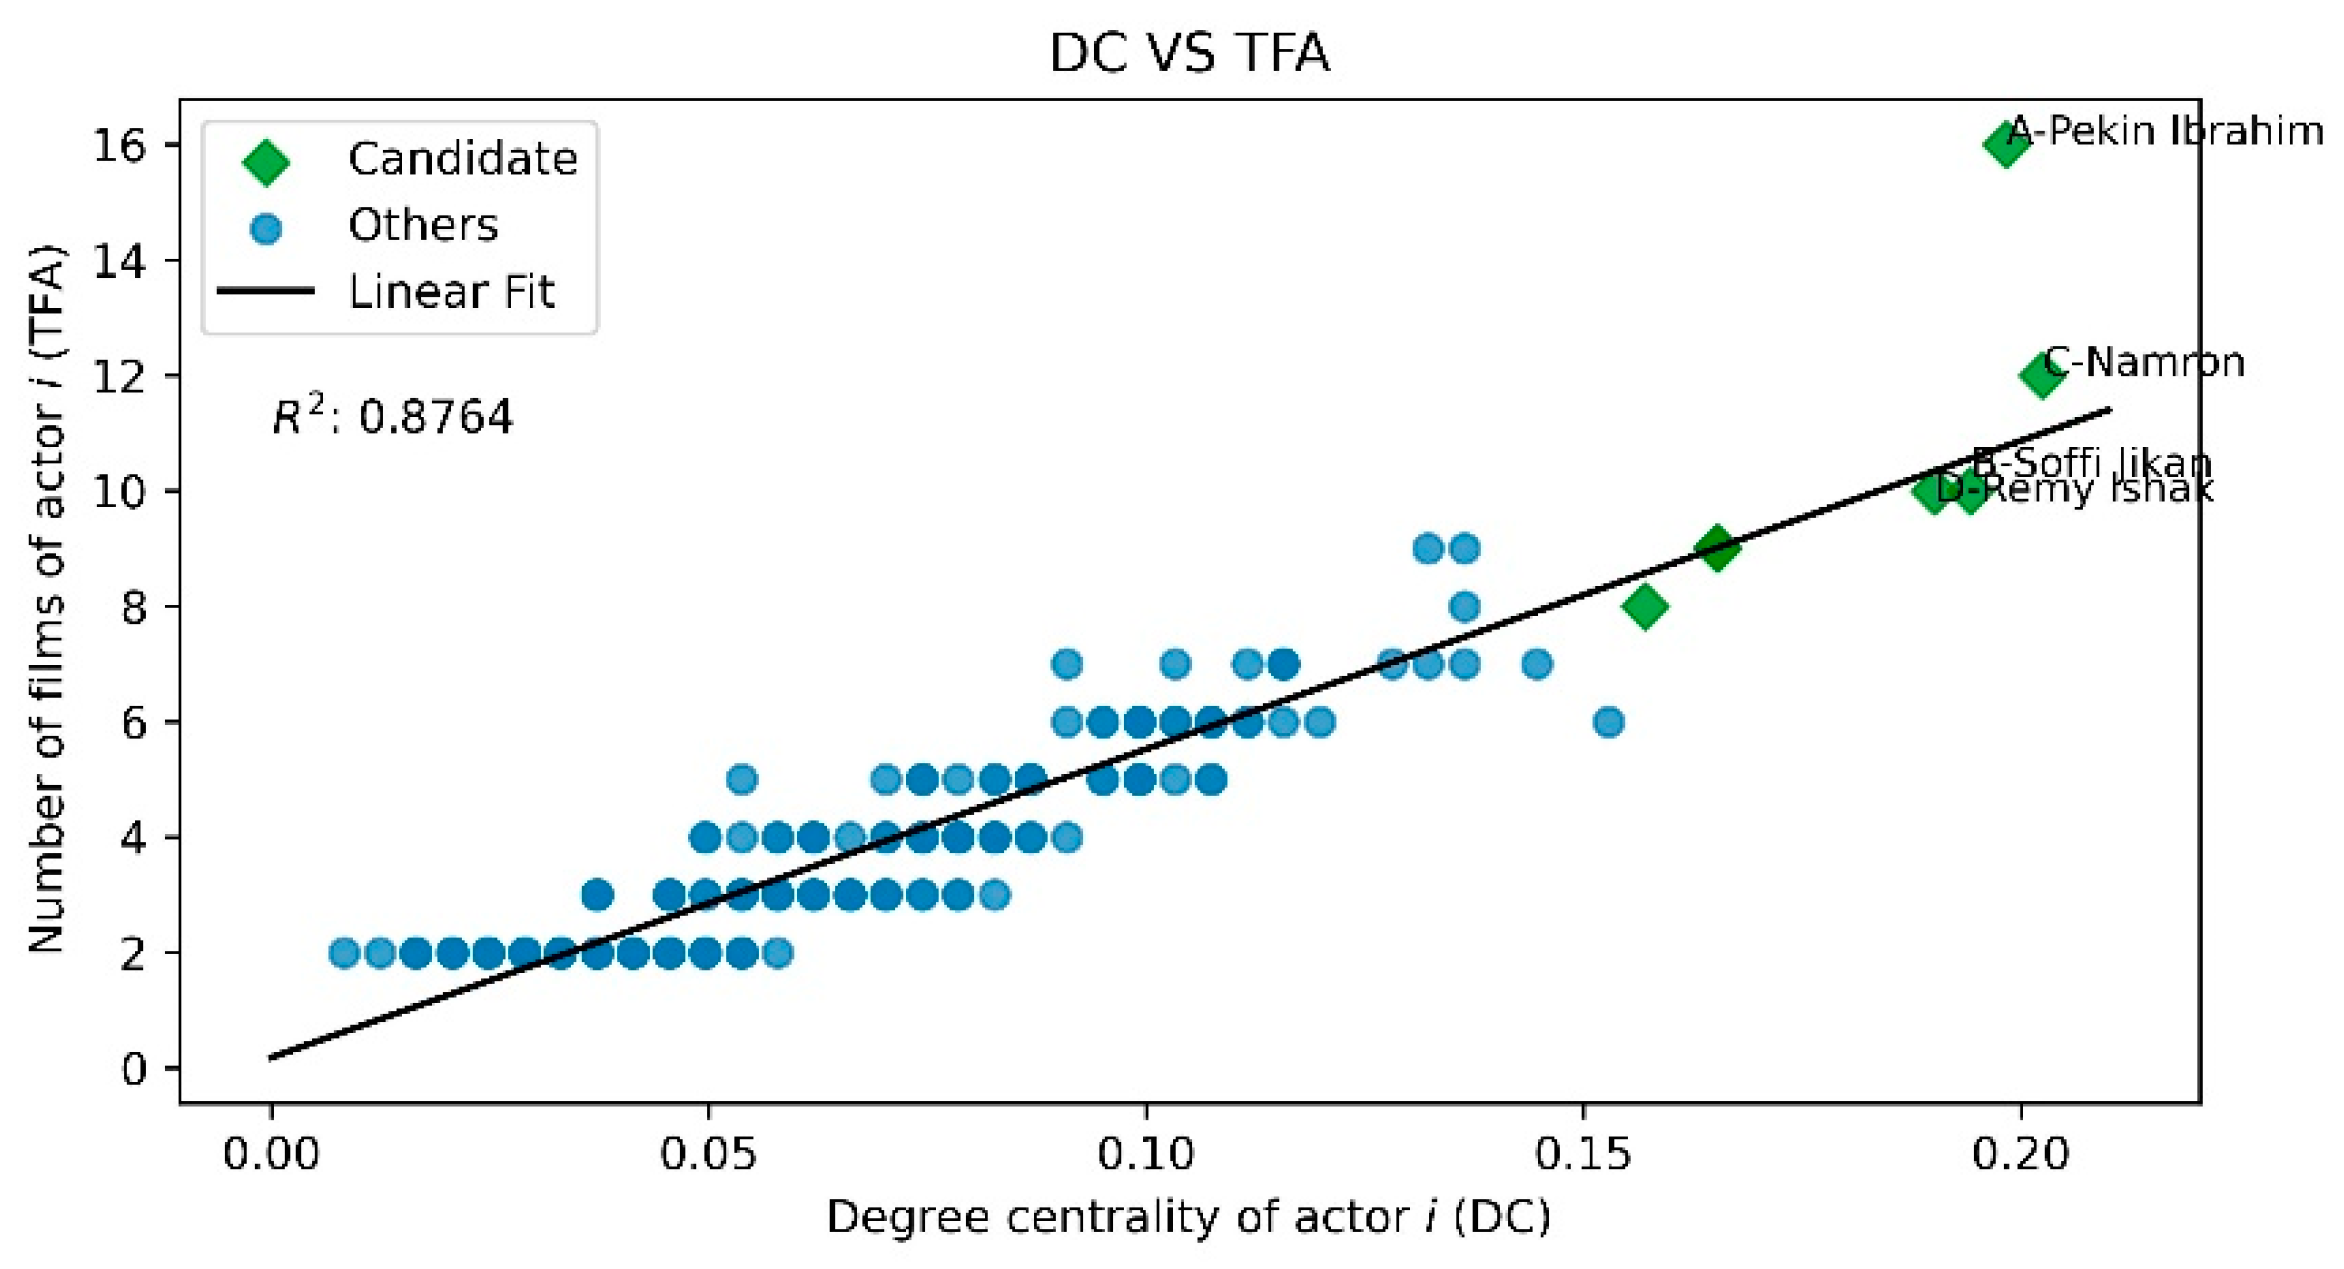
Figure 4 shows a linear relationship between the TFA and the DC. As the TFA goes up, so does the DC. The high coefficient of determination (
) also supports the variation in DC, which explains 87.64 percent of the TFA. The top four actors with high DC, whose names are labelled in
Figure 4, have significantly higher DC than other actors but only a slight difference between them. There are a few differences, for example, A: Pekin Ibrahim is connected to 48 actors, B: Soffi Jikan is connected to 47 actors, C: Namron is connected to 49 actors, and D: Remy Ishak is connected to 46 actors, indicating that these four actors have a relatively similar number of connections with co-actors in the network despite differences in TFA.
Although Pekin Ibrahim has a high TFA, he has less connections than Namron, which has a lower TFA but a higher DC. Meanwhile, Remy Ishak and Soffi Jikan have the same TFA but different DC because of the different numbers of actors that connect to them. Many other actors had the same TFA but had a different DC, as shown in
Figure 4. DC may be affected by the number of actors per movie (the size of the movie ensemble or available data). The average number of actors working together in a film in our dataset is seven. This ranges between two to nine actors per film, with a standard deviation of 1.8667.
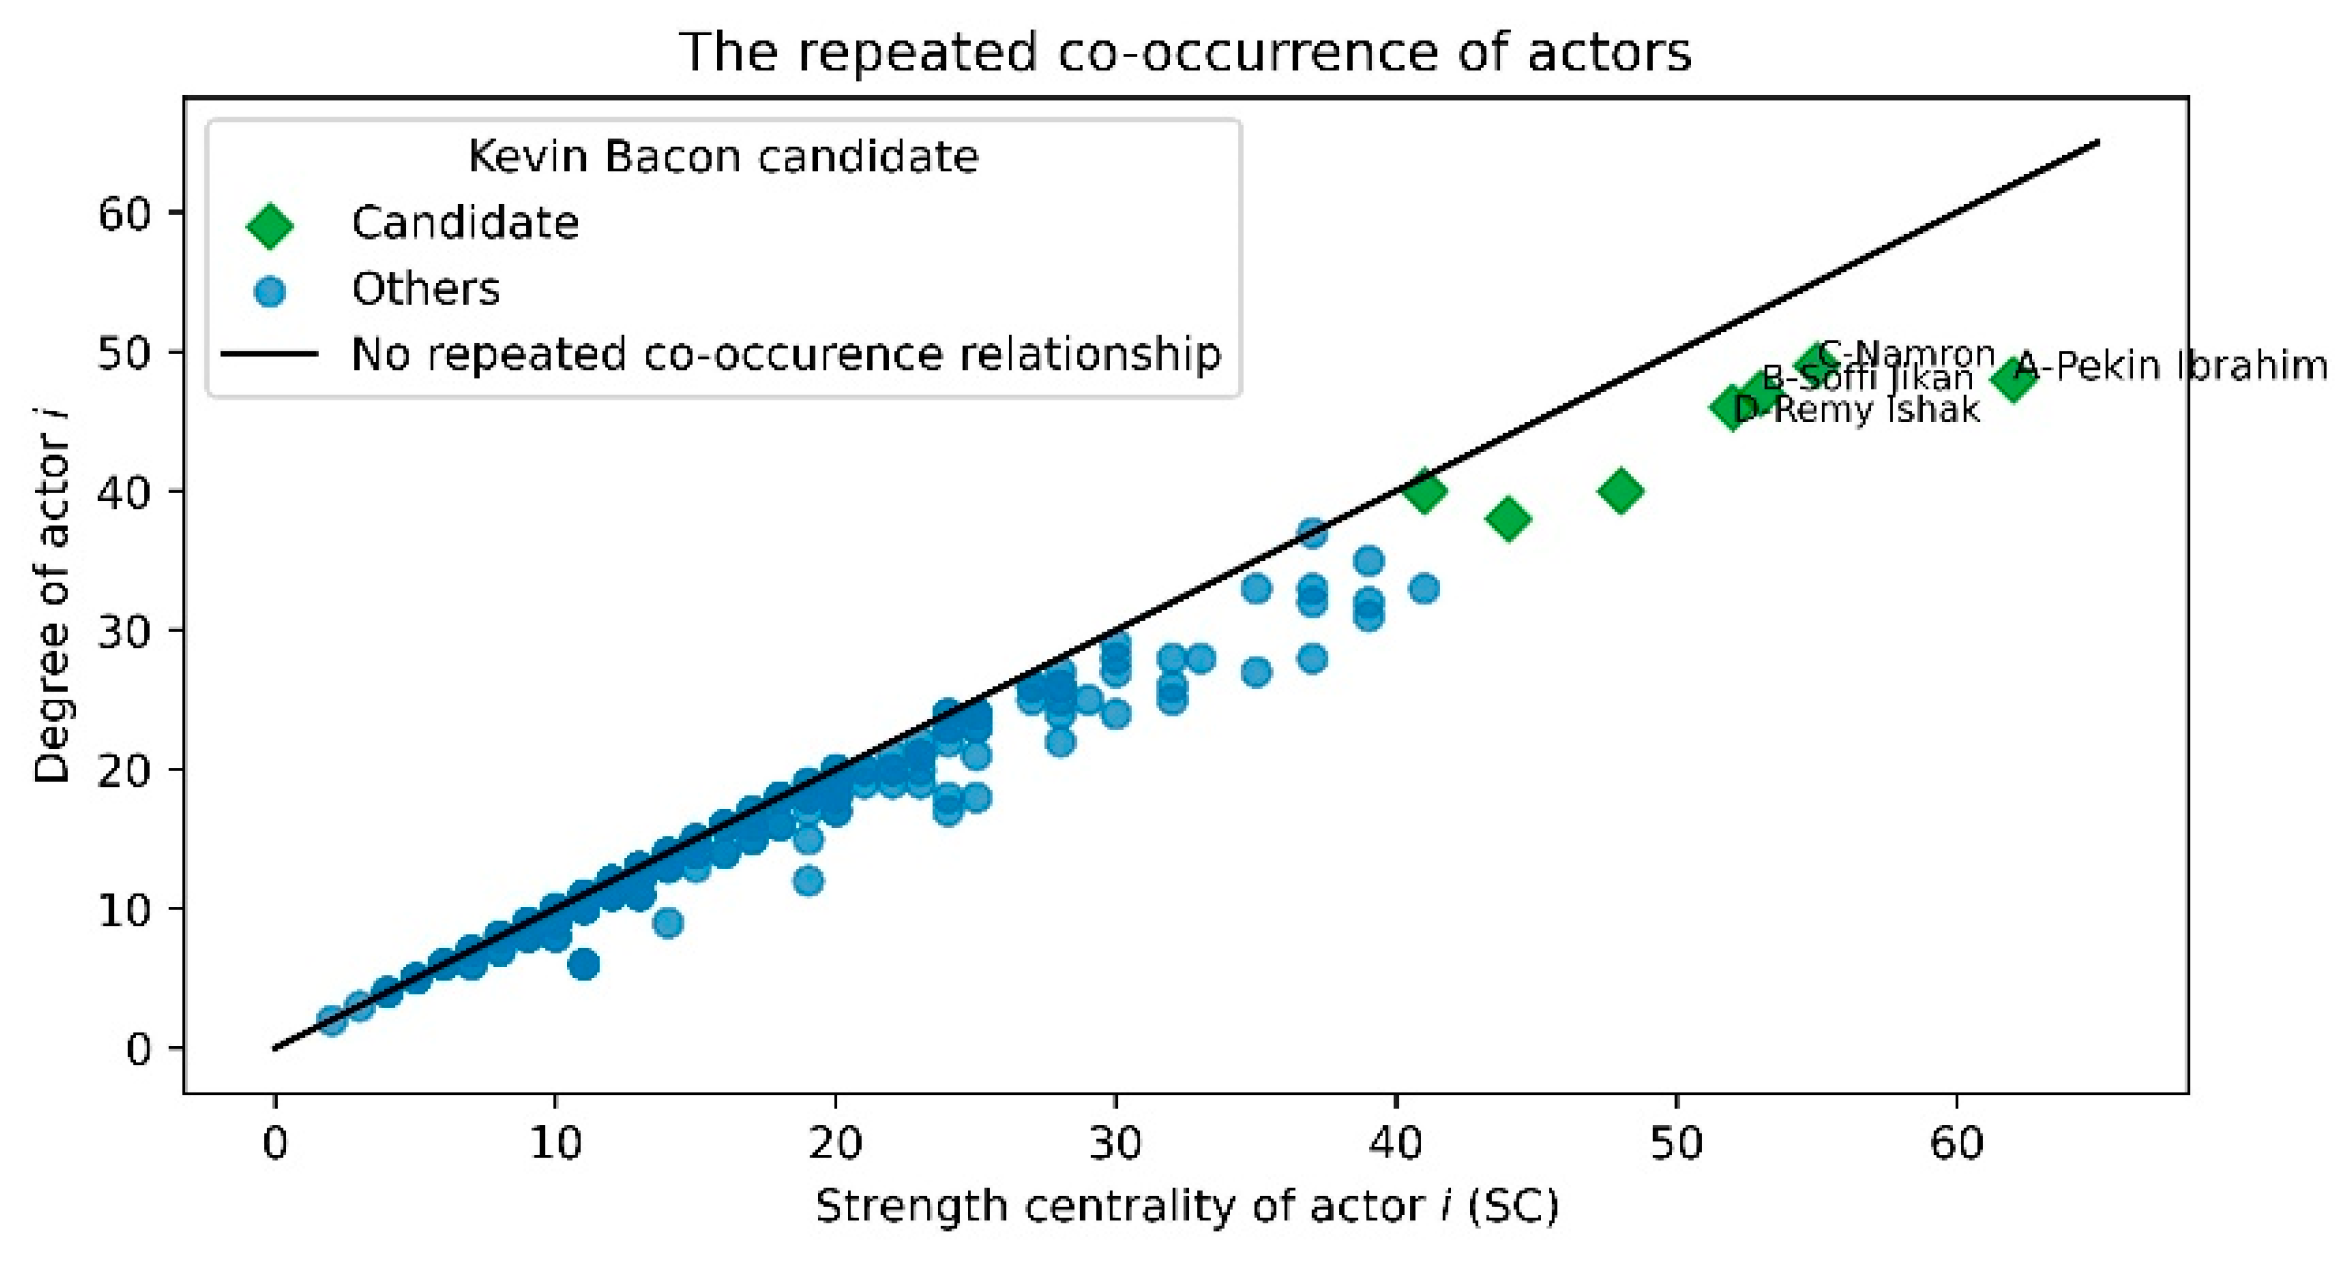
High SC nodes are nodes that have repeated co-occurrence relationships. We measured SC (definition in
Appendix C), which quantifies the frequency of co-occurrence (working together in a movie) between actors highlighted in
Figure 5 where it is plotted against degree. The actor will have no repeated co-occurrence relationship if their SC is the same as their degree (black line in
Figure 5). The further the value is from the black line, the more an actor have repeated co-occurrence with other actors.
Figure 5 highlights that higher degree generally corresponds to higher SC. However, the actor with the highest SC is A-Pekin Ibrahim instead of the actor of highest degree C—Namron. Using degree, we can see that Pekin Ibrahim has worked with 48 different co-stars. His SC is 62, which means Pekin Ibrahim has 14 repeated co-occurrences with 11 actors. Meanwhile, Namron has worked with 49 different actors and his SC is 55 which means Namron has six repeated co-occurrences with six actors.
Therefore, SC highlights the experience of an actor in working repeatedly with the same co-star. High SC actors can build connections with more co-stars, and possibly develop chemistry which may improve the quality of acting.
2.3. Betweenness Centrality
High BC nodes would be the connectors or the middlemen in the network. We assessed the high BC nodes to investigate what makes them the connectors.
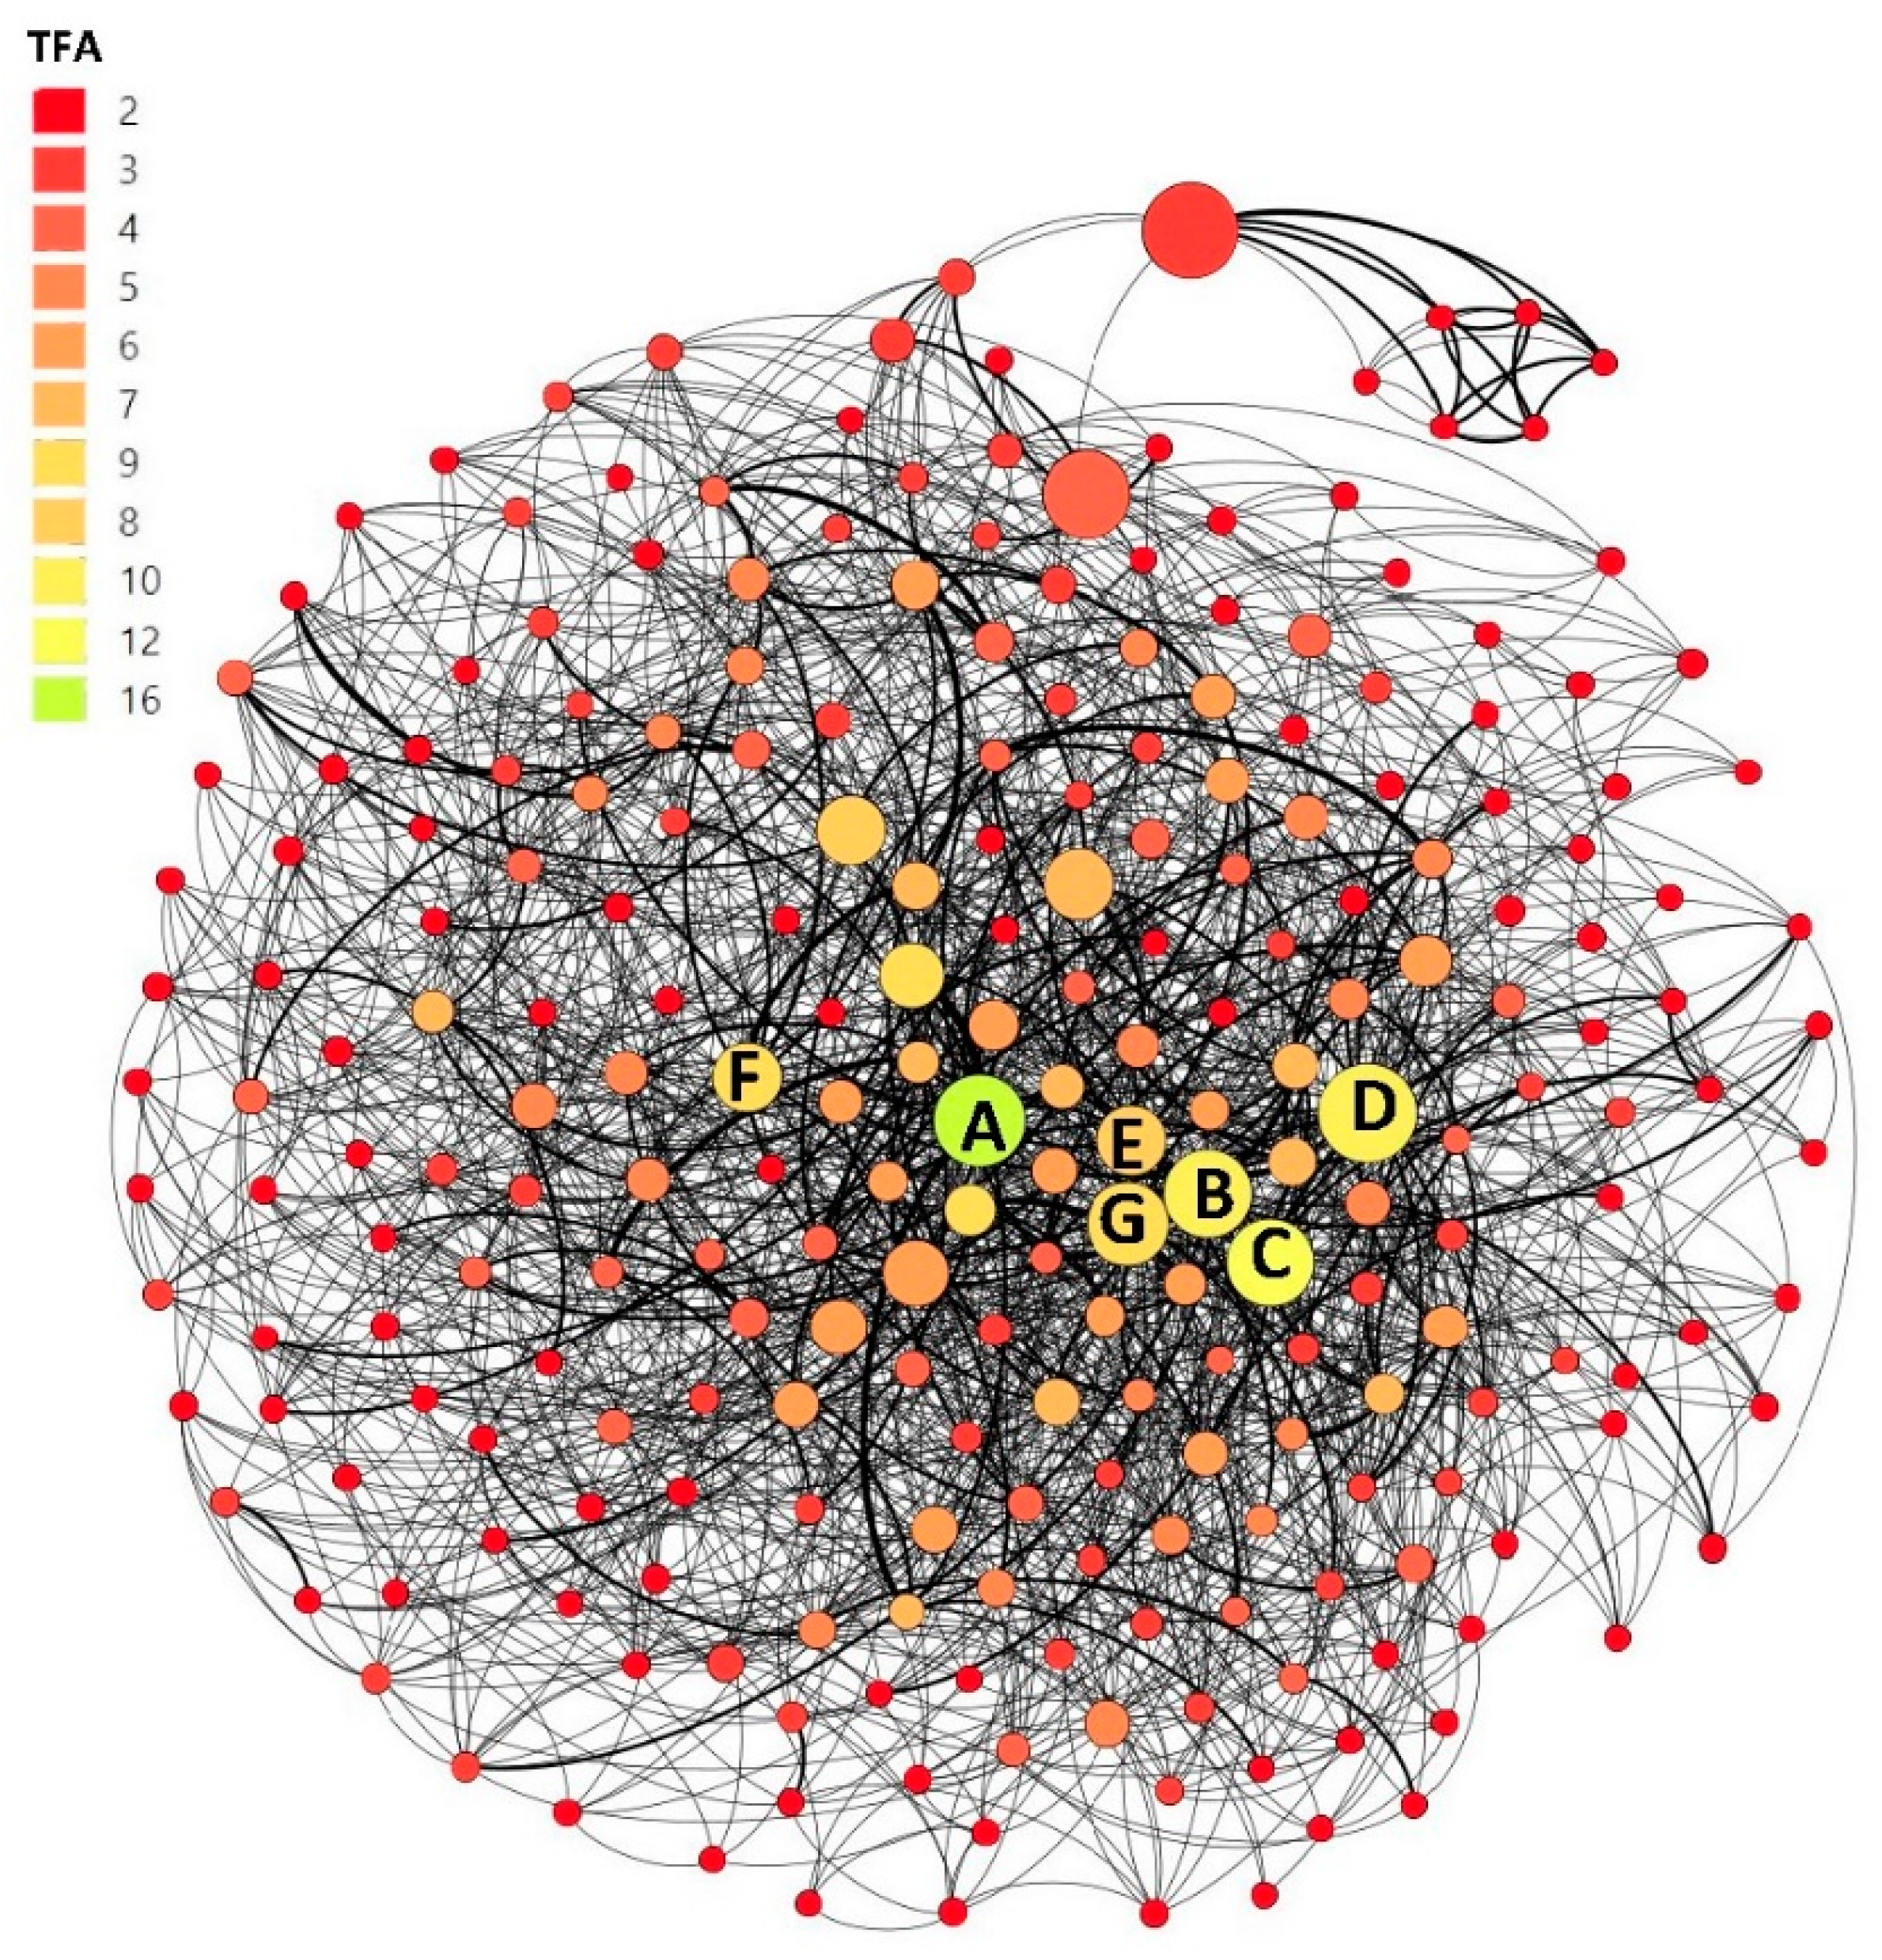
The output of BC differs from DC since nodes with a higher BC are connectors. Without some actors with high BC (for example, the large node at the top of the network in
Figure 2), some actors could be disconnected. Without some high BC actors, it is difficult for a relationship to exist between the other actors that are not directly connected. Notice that some actors with a high BC have a low TFA (red nodes). The actors with high BC may connect groups of actors that do not work in many films. BC could highlight the actors that bridge two different groups of actors from different films and act as a liaison between them. Most of the seven candidates have high BC, however there are the others (non-candidate actors) that have significantly higher BC.
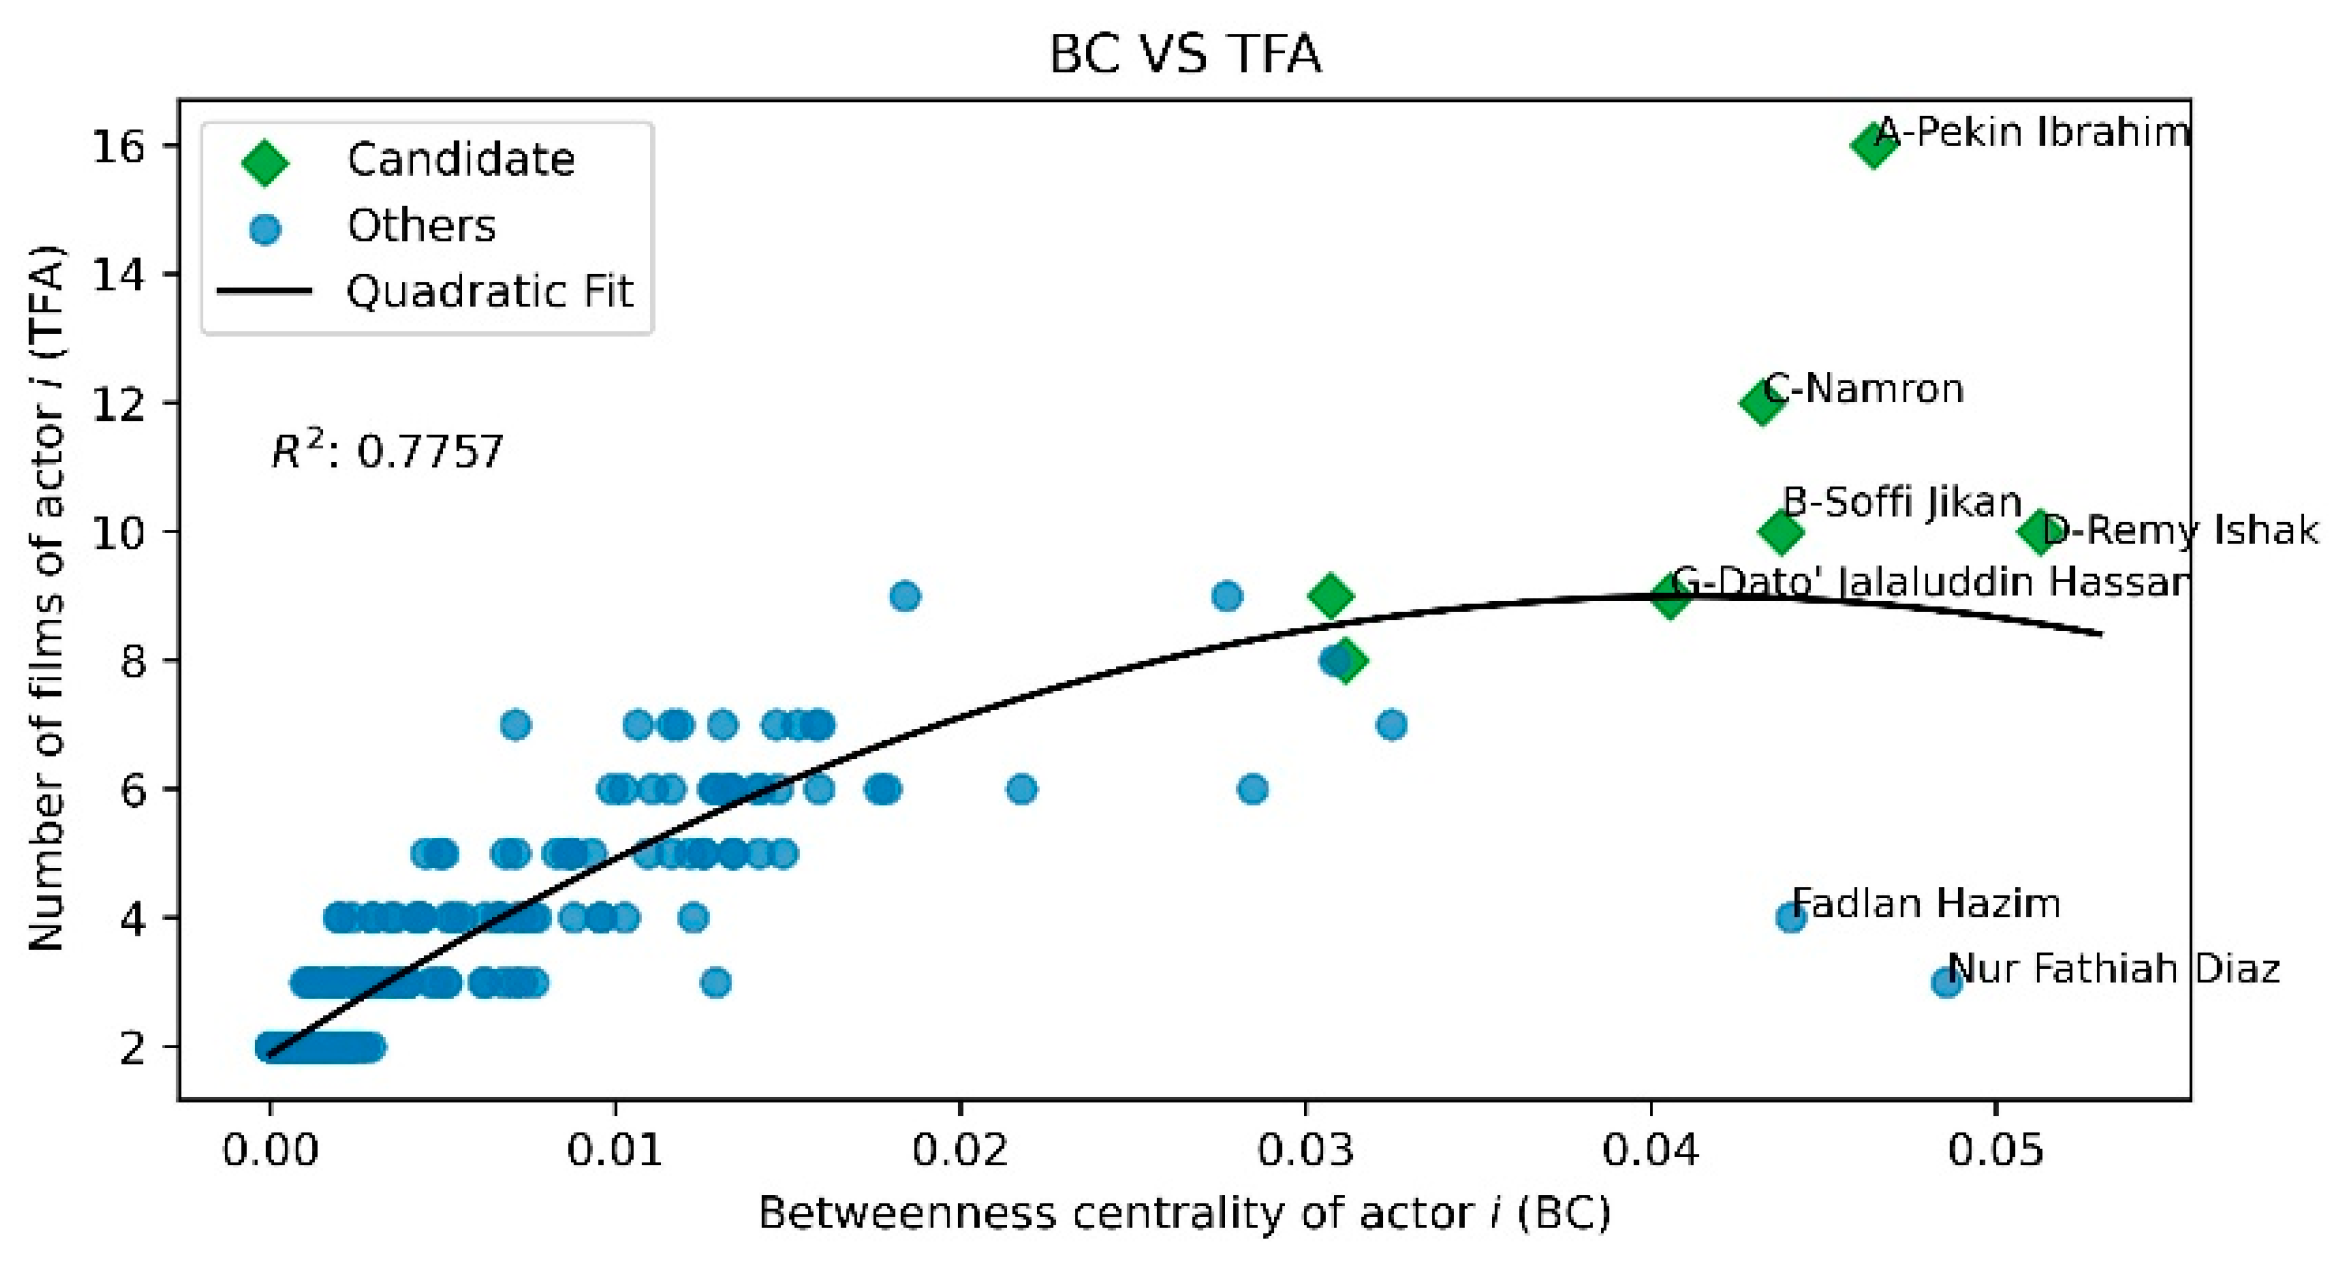
Figure 6 shows BC plotted against TFA. The relationship is well fitted by a quadratic fit, with higher
, compared to linear and log fit. We group the high BC actors (with BC more than 0.035) into three groups based on their TFA as labelled in
Figure 6.
The first group is comprised of Pekin Ibrahim and Namron (actors A and C in
Figure 2 and
Figure 6). These actors stand out as exceptions because they have been in many films—16 and 12 movies, respectively (both of them are the candidate of “Kevin Bacon”). They may be acting with the same actors repeatedly, thus resulting in a lower BC compared to actors like Remy Ishak (also labelled as D) and Nur Fathiah Diaz, who have a higher BC (despite having a lower TFA than Pekin Ibrahim and Namron). Namron, who has a relatively high TFA, has a lower BC than Remy Ishak, Nur Fathiah Diaz, and Pekin Ibrahim.
The high BC actors in the second group have relatively expected TFA based on the quadratic fit. Soffi Jikan, Remy Ishak and Dato’ Jalaluddin Hassan are these actors (actors B, D, and G, respectively, in
Figure 2 and
Figure 6) and also the candidates for “Kevin Bacon”. Remy Ishak has the highest BC as he is a connector for different co-actors from different types of movies in the network. He has worked in 10 films over five genres, one of which is an animation film. Thus, he connects voice actors with other actors from four different types of movies. Soffi Jikan has 10 films similar to Remy Ishak but with a lower BC, because Soffi Jikan only acted in three different genres, which are action (two films), comedy (seven films), and thriller (one movie). Therefore, he is only a connector for three different groups of actors. Meanwhile, Dato’ Jalaluddin Hassan has nine movies over six genres. Although he has acted in more genres than Soffi Jikan, his BC is lower. That means there are a smaller number of actors that depend on him to connect in the actor network compared to Soffi Jikan.
The third group are high BC actors with a low TFA. These actors are Nur Fathiah Diaz and Fadlan Hazim, who have appeared in three and four films, respectively. Both are not the candidate for “Kevin Bacon”, as their average shortest path is more than two (blue circles). They make up the cluster on the top part of the network with bigger and darker nodes in
Figure 2. These are voice actors mainly working in animation films and sometimes in other types of movies. They bridge seemingly unrelated groups of actors, such as those who provide the voices for animated films and those who specialize in horror films (and other genres). Voice actors have a restricted number of films to work on, due to the industry’s limited production of animation films, but because they also work in other genres of films, they become connectors with high BC. Thus, BC highlights the social importance of actors in bridging relationships among co-actors in the network especially from various genres.
2.4. The Kevin Bacon of Our Actor Network
The Kevin Bacon of our actor network should have relatively high quality (TFA, DC, SC, and BC). We compare the quality of actors with their average shortest path to pick the best candidate as our Kevin Bacon.
We now consider TFA, DC, SC, and BC to nominate high-quality actors as the “Kevin Bacon” of the Malay language film actor network. TFA, DC, and SC can be taken as a popularity measure, and BC as a measure of social importance. The analysis in
Section 2 highlights that four actors are consistently high in DC, SC, and BC. These actors are Pekin Ibrahim, Soffi Jikan, Namron, and Remy Ishak (also labelled as A, B, C, and D, respectively).
Table 3 is the average shortest path of the four actors in increasing order.
Pekin Ibrahim has the smallest average shortest path, the highest TFA and SC, but Namron has the highest DC and Remy Ishak has the highest BC. DC and BC give different results compared to TFA, which means the metrics capture different aspects of quality.
Since Kevin Bacon was chosen due to his low average shortest path, Pekin Ibrahim is a likely candidate. He has the smallest average shortest path, the highest TFA, the highest SC, and relatively high DC and BC. This means that Pekin Ibrahim is more closely connected to other actors, has high popularity, high experience in working repeatedly with the same co-stars, and social importance in the actor network.
Pekin Ibrahim is a Malay actor that won the best male actor at the 2016 Malaysia Film Festival (FFM; Malay: Festival Filem Malaysia), and he was nominated numerous times before that [
25]. FFM is presented by the National Film Development Corporation Malaysia, also known as FINAS. It is the governing agency for the Malaysian film industry [
26]. FFM is said to be the most prominent award ceremony and FFM’s awards are voted by award-winning writers, filmmakers, movie columnists, and writers within the industry [
27]. Pekin Ibrahim as the “Kevin Bacon” of our actor network is a high-quality actor.
3. Genre Diversity
Good actors tend to work in different types of films. We calculated the genre diversity for every actor using Normalized Herfindahl–Hirschman Index and grouped them into diverse and non-diverse.
Kevin Bacon has many films, and he is also diverse in his genre [
8,
9]. BC highlights that connectors between various groups are important. Thus, we investigate the genre diversity of Malay film actors. We want to investigate the quality of actors in terms of their capability to act in different genres. Genre diversity analysis captures an actor’s tendency to act in the same or diverse genres, thus quantifying the ability of an actor to perform in multiple film genres.
In this study, we utilized HHI, a measure from economics and finance that measures market concentration and assesses market competition levels in the industry. However, we used the Normalized Herfindahl–Hirschman Index (NHHI) that was derived from the original HHI [
16,
17]. Since HHI depends on the number of genres of an actor, HHI will not be suitable for comparing different actors having an unequal number of films. Refer to
Appendix D for information and example calculation of NHHI. High NHHI does not imply that actors are diverse in all 11 genres (we explain the classification of the genre in
Appendix A), but rather indicates that actors are diverse within the genre of films in which they have appeared.
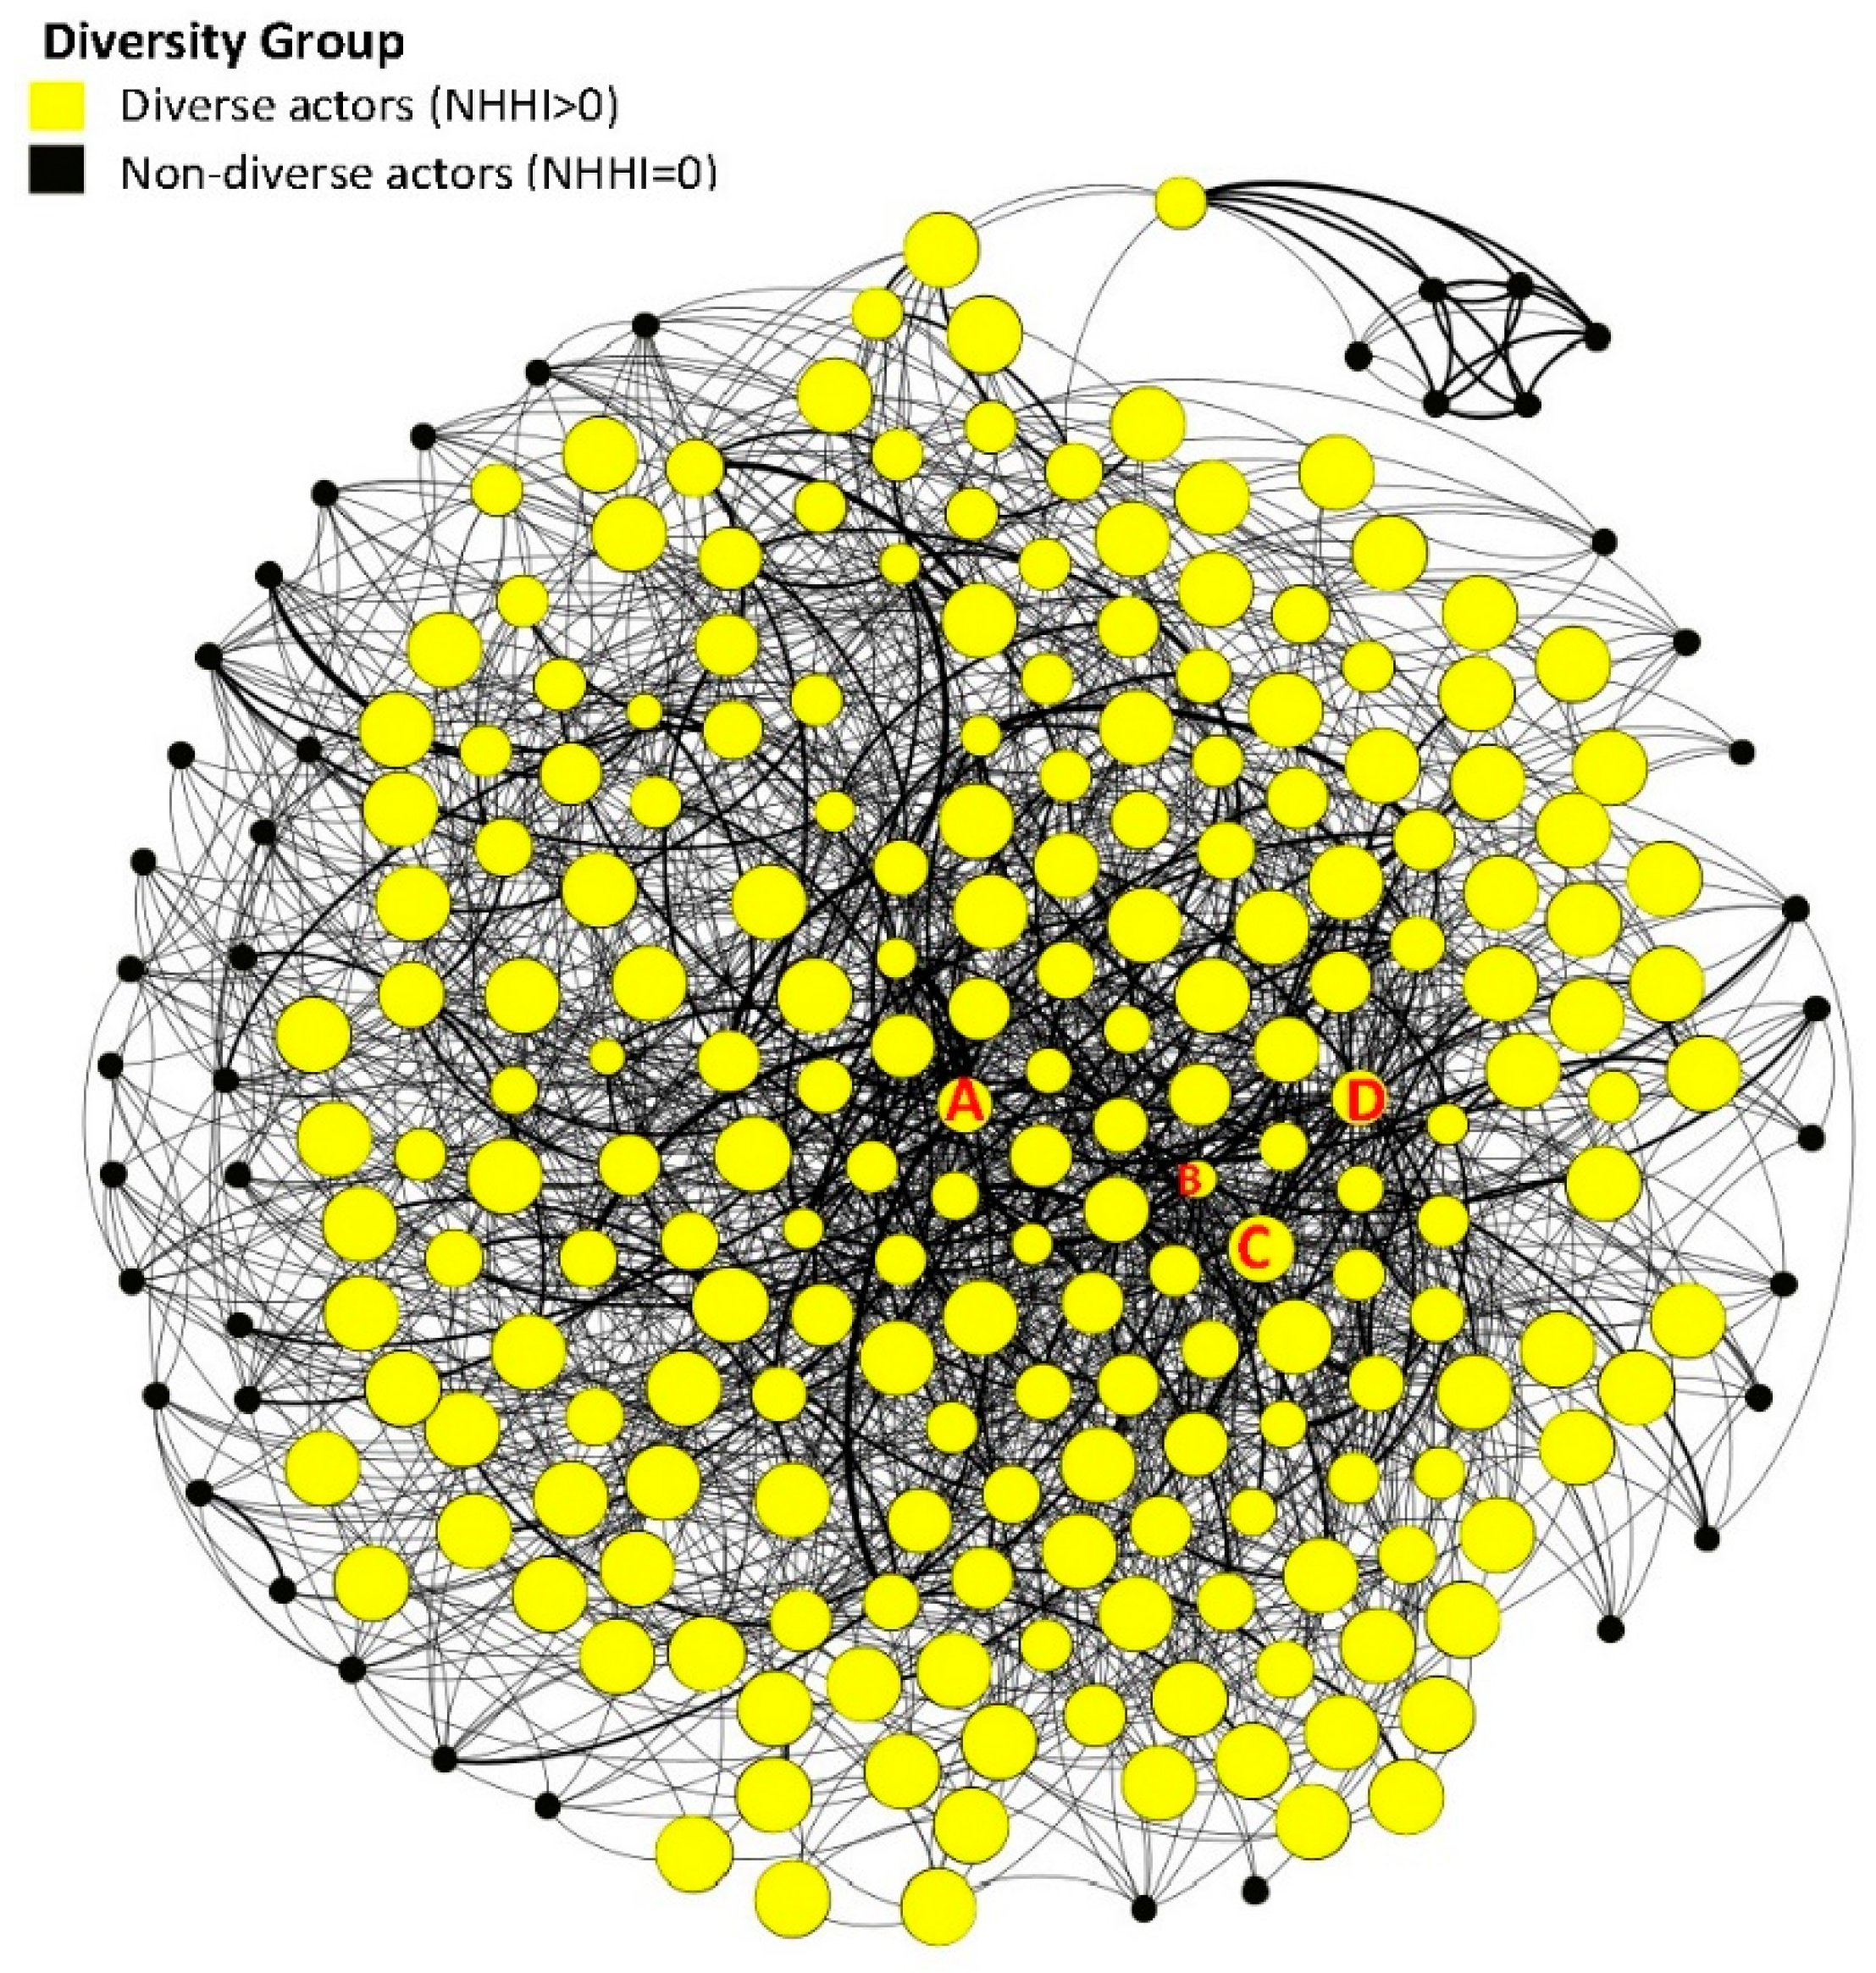
We explore the NHHI for all actors with at least two movies.
Figure 7 shows two groups of actors: the diverse (yellow nodes) and the non-diverse (black nodes). Non-diverse actors consist of actors with an NHHI of zero, while diverse actors have NHHI of more than zero. There are 200 actors in a diverse group, with 98 of them having NHHI of one, meaning they acted in an equal number of movies in each genre they acted in, but they have a TFA less than four movies. Meanwhile, others (102 of 200 actors) have some degree of genre diversity with a TFA more than three films. The non-diverse group had 43 actors with an NHHI value of zero, so they acted in only one movie genre with a TFA less than four movies.
Now we will look at NHHI for four actors from
Table 3, labelled as actors A, B, C, and D. Among them, the actor with the highest NHHI is C: Namron (NHHI is 0.9833 and TFA is 12), followed by actor D: Remy Ishak (NHHI is 0.925 and TFA 10), actor A: Pekin Ibrahim (NHHI is 0.9206 and TFA 16), and actor B: Soffi Jikan (NHHI is 0.69 and TFA is 10). This shows most of them are diverse in their genre. Soffi Jikan has a relatively low NHHI score since he acted in mostly comedy movies, in contrast to Remy Ishak, who has the same TFA but acted in more varying genres.
Next, we look at the genre diversity of the two voice actors that have the high BC from
Section 2.3. Fadlan Hazim has an NHHI of 0.9375 and TFA of four, while Nur Fathiah Diaz has an NHHI of 0.8889 and a TFA of three. Both have high genre diversity even though they have a low TFA. Fadlan Hazim acted in three genres while Nur Fathiah Diaz acted in two genres, hence highlighting some correlation between NHHI and BC.
The Actors Diversify throughout the Six Years
The actors should be more diversified over the years. We compare their NHHI in the first year (between 2015 to 2020) with their NHHI in 2020.
We analyzed the actors’ genre diversity evolution over several years of working in the industry by comparing their NHHI in the first year (between 2015 to 2020) with their NHHI in 2020. This evolution can describe the trend of actors in diversifying their movie genres. The first year of actor , denoted as , is the year the actor has his first film(s) between 2015 to 2020, and the NHHI in year is denoted as NHHI(). differs from the debut year because the debut year is defined as an actor’s first film, which could be before 2015. The year only considers the first film(s) in the period from 2015 to 2020. For example, some would have their first film(s) in 2015 (), while others could have their first film(s) in 2017 (). Meanwhile, the NHHI is calculated based on the cumulative films over the six years.
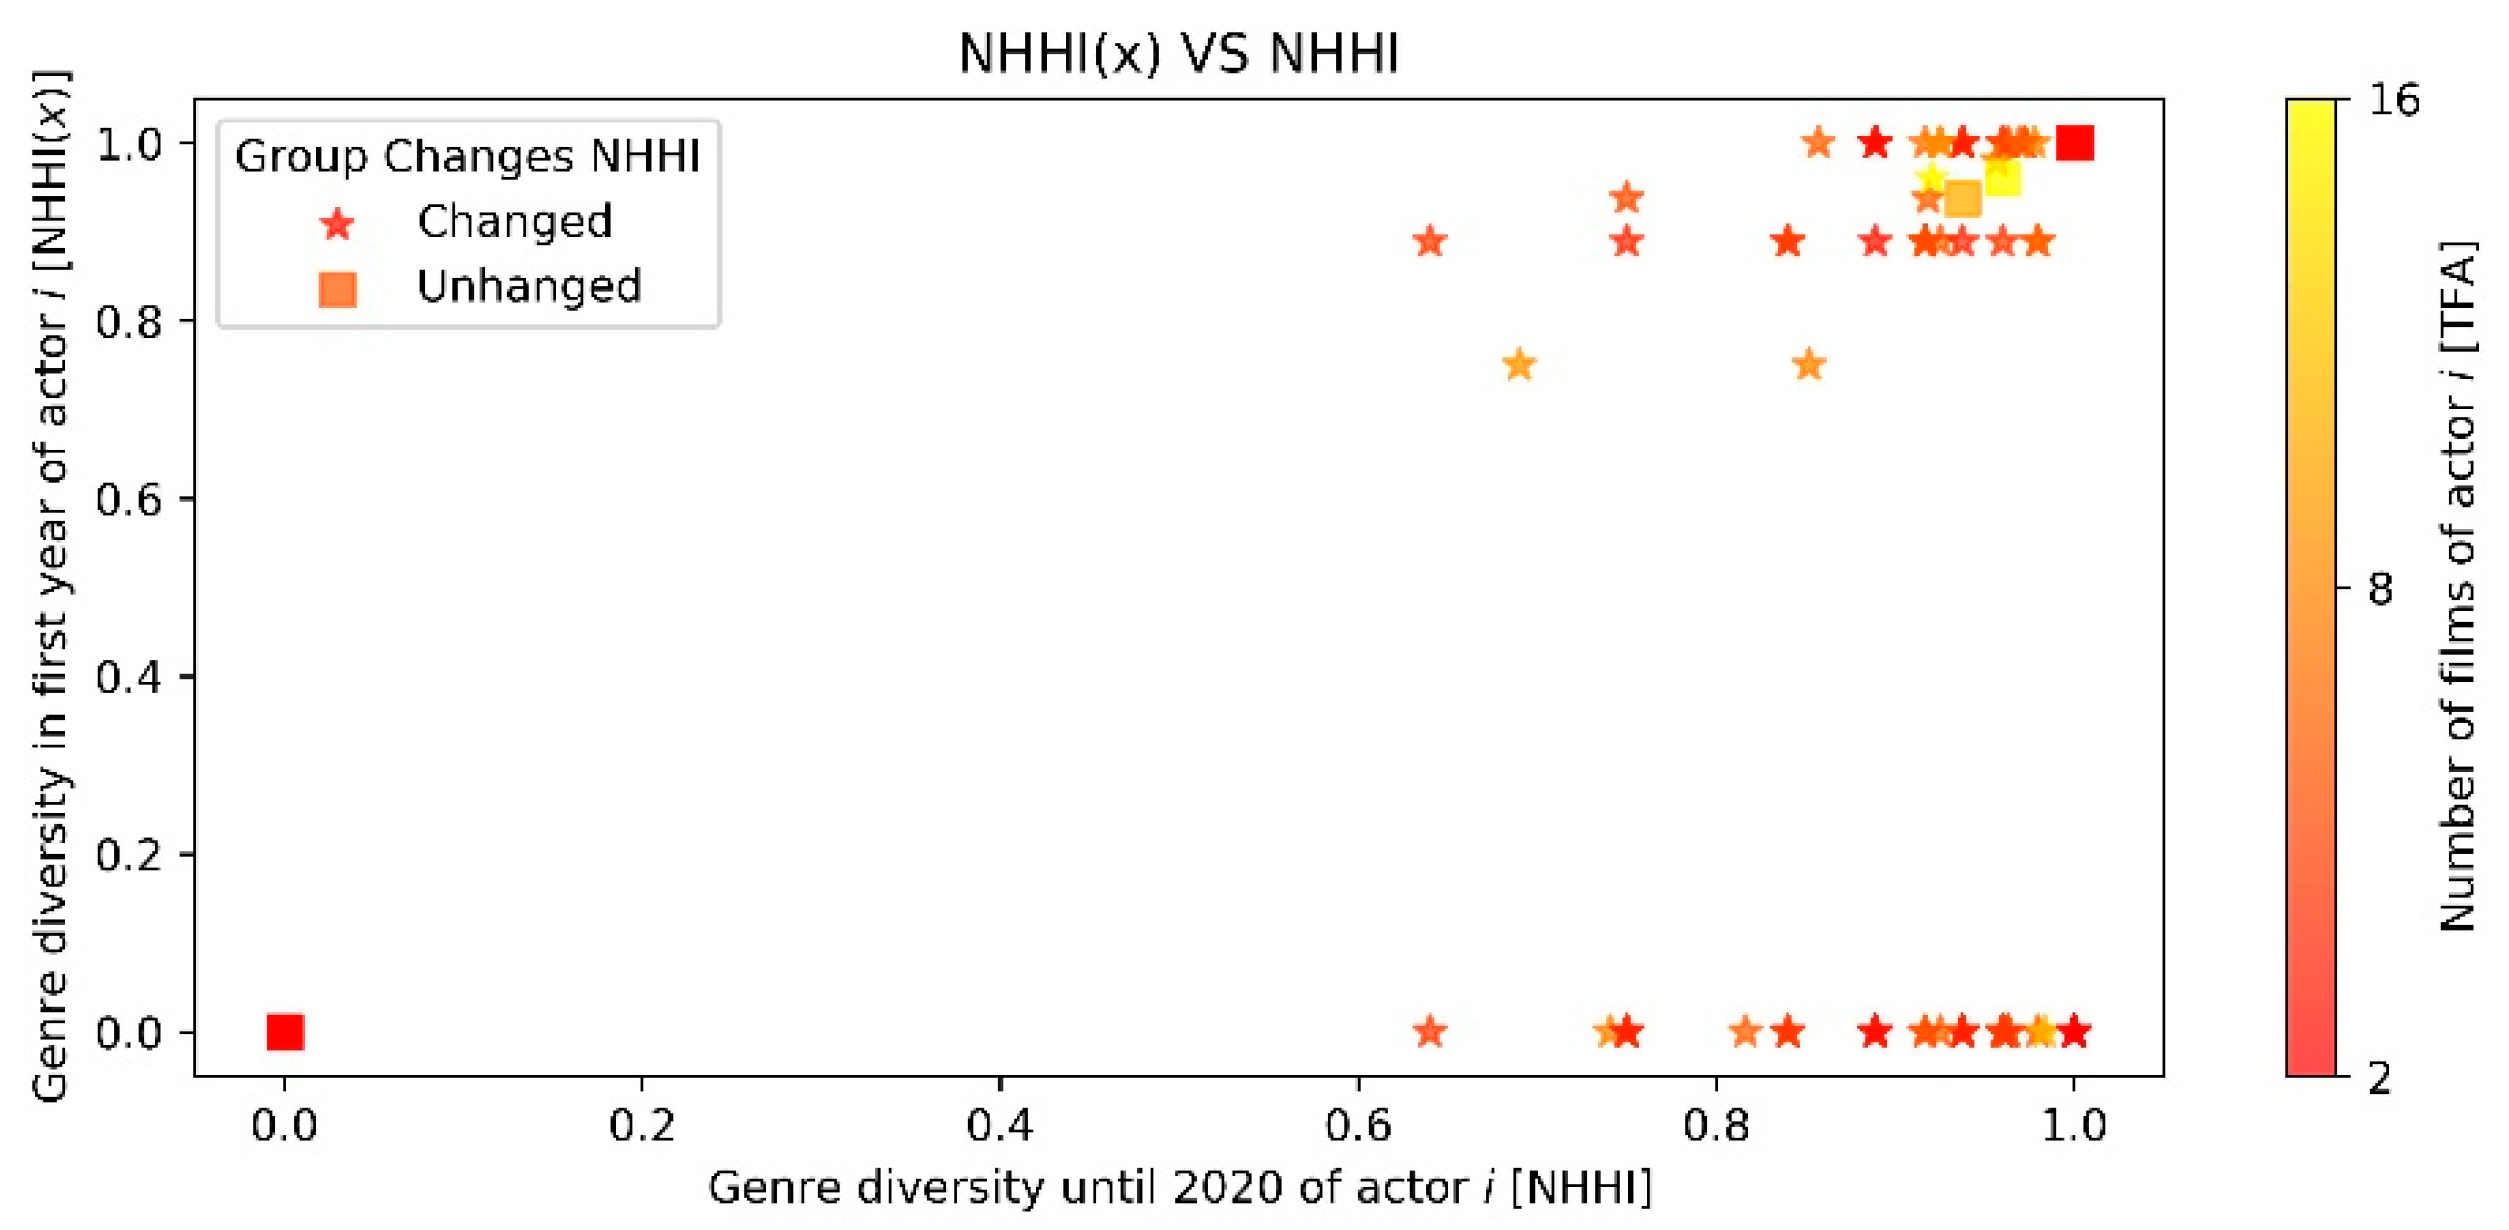
Figure 8 shows their NHHI(
), which is computed based on their film(s) in year
, plotted against their NHHI, which is computed based on the cumulative movies of an actor in year
until 2020. Since TFA directly affects NHHI, we include it as the color of the scatter points. The brighter points are the actors with a high number of films. Note that the actors with a higher NHHI have higher genre diversity. This comparison shows two groups of actors: those that do not change their genre diversity (square), and the other group is those that have changed their genre diversity (star).
Sixty-five actors have unchanged NHHI (square) when their NHHI() are compared with NHHI. These actors only worked in year . There are 20 actors with an NHHI value of one, one actor with an NHHI value of 0.96, one actor with an NHHI value of 0.9375, and 43 actors with an NHHI value of zero.
178 actors have changed their NHHI (star). This group consists of 35 actors with a decreasing NHHI and 143 actors with an increasing NHHI when compared to their NHHI(). A decrease in NHHI means that the actor has a lower NHHI than their NHHI(), which means they have lower genre diversity in the films they acted in overall. Meanwhile, the increase in NHHI indicates the opposite.
The 35 actors with a decreasing NHHI have TFAs from 3 to 16. Most of these actors have a high NHHI(), which means they already started with a high genre diversity so they could work in the same genre they have acted in for their next movies. Meanwhile, the 143 actors with an increasing NHHI have a TFA from two to 12. Although most of them have a relatively high NHHI(), they could achieve a higher NHHI causing their genre diversity to increase by 2020. This means we have 143 actors who have diversified their films. Therefore, most Malay language film actors in our data set diversified their careers.
4. Discussion and Conclusions
The film industry is worth billions of dollars annually across the world, and while Hollywood, Bollywood, and China dominate in terms of number of films produced, Malaysia has its own film industry. While relatively small, the Malaysian film industry is the subject of academic work such as studies about film languages [
28], ideology [
29,
30], representation of social culture [
31,
32,
33], and the industry itself [
34,
35,
36,
37]. However, it is hard to find an analysis of Malaysian actors themselves. Thus, this is one of the earliest studies pertaining to the relationships between actors in Malaysia.
This article attempts to quantify the quality of actors, using these measures: number of films (TFA), centralities (degree centrality (DC), strength centrality (SC) and betweenness centrality (BC)), and genre diversity (NHHI). TFA, DC, and SC of actors can be taken as popularity measures, BC indicates the actors’ social importance, and NHHI captures actors’ capability in diversifying their movie genre.
Actors are a central element of the film industry and can be cast based on the expected audience they will draw to the movie. It has been claimed that producers and directors emphasize physique rather than talent [
38]. Therefore, it would be useful to have some metrics that can define the quality or talent of an actor. Pekin Ibrahim does not always play the lead character but has a high quality based on our metrics. Furthermore, our metrics also show that Namron is the most famous (the highest DC) and Remy Ishak has high social importance (the highest BC) in our actor network.
Actors with high DC and SC could help with the social aspect of getting jobs in the movie industry. The actors with high connections in the network might be able to give tips, help to get an introduction, or even refer other actors for a casting audition. As actors that are connected have co-starred in the film together, they would know each other’s capacity as an actor. The more people that know them, the higher their chances are of getting a job. Moreover, actors with a high SC have many repeat collaborations, possibly improving familiarity and acting quality.
We also captured actors that became the “middleman” connecting groups of actors from different types of films using BC. Actors with a high BC have more actors depending on them to connect them with other actors, resulting in more power or potential influence. BC uncovered that the “middlemen” in the Malay language film network are the actors that have worked in animation movies alongside other types of films. They connect the voice actors with other actors in the network. Being the “middleman” is a different kind of social importance in the social network. Actors with high BC serve as middlemen connecting different groups of actors. These middlemen do not necessarily have a high number of connections, but more importantly, they have diversified connections linking various group in the network. Other actors might rely on them to make connections with a different actor group.
Past studies highlight that BC would measure different aspects compared to other centralities [
23,
24,
39,
40,
41]. For example, Refs. [
23,
24,
41] shows that high BC nodes are more likely to become the super spreader compared to other centralities. When applied to an actor network, high BC nodes have the potential to be the best spreader of information, perhaps spreading news of job availability and opportunities to various actor groups. Ref. [
39] demonstrates that high BC nodes have the most access to various important positions in the network. Meanwhile, Ref. [
40] shows that the high BC nodes have greater informal power over other nodes that have formal authorities and administrative power in the network. Therefore, in the actor network, a high BC actor has the upper hand in terms of having access to actors from different actor groups and possibly different types of movies. They may have the experience of working with the co-stars from different types of films that most of the others may not have.
Some members of the public perceive the quality of acting as declining, and some actors tend to agree that new actors are the cause of this decline [
42]. However, using NHHI to measure genre diversity demonstrates that most Malay film actors diversify their work overtime. The actors are becoming more diverse (143 out of 243), meaning they are more capable as they work more. Some directors also tend to work with the same actors for different films, as they already know the actor’s credibility in acting [
43]. We used NHHI to measure the actors’ genre diversity, but there are many other diversity indices, including entropy like the Shannon index and Gini-Simpson index, originating from information theory, engineering, and physics [
44] that could be the subject of future research.
This study only has data on actors working in films from 2015 to 2020. As a result, it only reflects on what occurred within that time window. If the data set is expanded a few years back to include more works from actors that debuted before 2015, it would make our analysis more complete. It would be helpful to complement our analysis with data from social media interactions to complete missing pieces in this big picture about the popularity of actors. After all, it is difficult to see the social relationships among Malay film actors because it is difficult to see the public influences on actors, the film’s growth, and the social media attention. Furthermore, it is not easy to quantify because social media is expansive, and it would require a standalone study.
The actor network can be expanded to deal with more issues in the future with additional data, such as the revenue of films or the annual income of actors, to associate it with highest-grossing films or best-paid actors. Malay language films have its strength. For example, animated films are popular in Malaysia and in neighboring Indonesia [
45], possibly leading to animation movie actors being the hidden connectors of the Malay language film industry. The current trend shows more demand for historical films after Mat Kilau: Kebangkitan Pahlawan broke into cinema [
46]. Perhaps in the future, as the Malay film industry becomes more diversified, the actors would have more chances to act in more diverse genres. Therefore, the genre diversity would increase. Moreover, investigating industries based on other languages in Malaysia will also be interesting.
Previously, we analyzed the network of movies [
37] connected by actors where the nodes represent Malay language films, and two films are connected if the same actors worked in both films. The main finding in [
37] highlights that Malay films tend to cluster together by director and genre of the films. Therefore, it would be an interesting future direction to analyze the relationship of actors and directors through the network of actors, since directors may influence the frequency of co-occurrence between actors. Moreover, it would also be interesting to build a network of actors, directors, and important people in the Malay film industry to really capture the dynamics of the industry. Nonetheless, this dataset will be the first step toward further analyses. Full data and coding is available at Github (link provided in the Data Availability Statement).
In conclusion, after analyzing this novel dataset, the main finding is that most of the actors (143 actors, 58.85%) diversify their work over time, and that BC and NHHI complements the characterization of an actor that DC, TFA, and SC does not capture. We suggest that the quality of actors should be measured by TFA, DC, SC, BC, and NHHI where these metrics capture many different dimensions of an actor. Centralities from network analysis and genre diversity can help us understand the quality of film actors in addition to the well-known metrics of small world networks. Hopefully, this study can help future studies better understand actors and the film industry.


