
Integration of Fuzzy Ontologies and Neural Networks in the Detection of Time Series Anomalies

Abstract
:1. Introduction
- In the long-term preservation of a certain trend;
- In frequent changes of tendencies;
- In changing the frequency of the series;
- In the value of the indicator below or above, a certain threshold value for a long period of time.
- Detection of anomalous time series from database time series [18].
- Methods for searching for anomalies based on the analysis of only the original time series;
- Anomaly search methods based on comparison of the original time series with reference time series.
2. Hybrid Time Series Anomaly Search Algorithm
- ConvLSTM1D is an LSTM layer. All input and output transformations within ConvLSTM1D are convolutional transformations.
- Conv1DTranspose is the transposed convolutional layer.
- Fuzzification of anomalous TS data. Fuzzification involves the interpretation of clear anomalous x0 values as a fuzzy point.
- Composition of the input variable and the conditional part of the SWRL rules contained in the ontology: x0 ◦ Ai, y0 ◦ Bi. The ontology contains a set of SWRL rules that contain fuzzy modifiers. If the fact is given by a fuzzy point, then at this stage the corresponding degree of membership is calculated.
- Calculation of fuzzy implication
3. Applying a Domain Ontology
- Classes of the subject area;
- Class of anomalous values;
- Relationships between classes of the subject area;
- Auxiliary relation, which confirms the truth of the judgment about the anomaly of the time series;
- Variables [57].
- “Well” includes the corresponding real domain objects.
- “Measurement” includes time series values that correspond to objects of the “Metrics” class.
- “Metrics” includes objects that establish a relationship between a “Measurement” and some domain metric.
- Checking the completeness of rig metrics data.
- Checking the value of the petrophysical index for reaching the threshold value of 0.5.
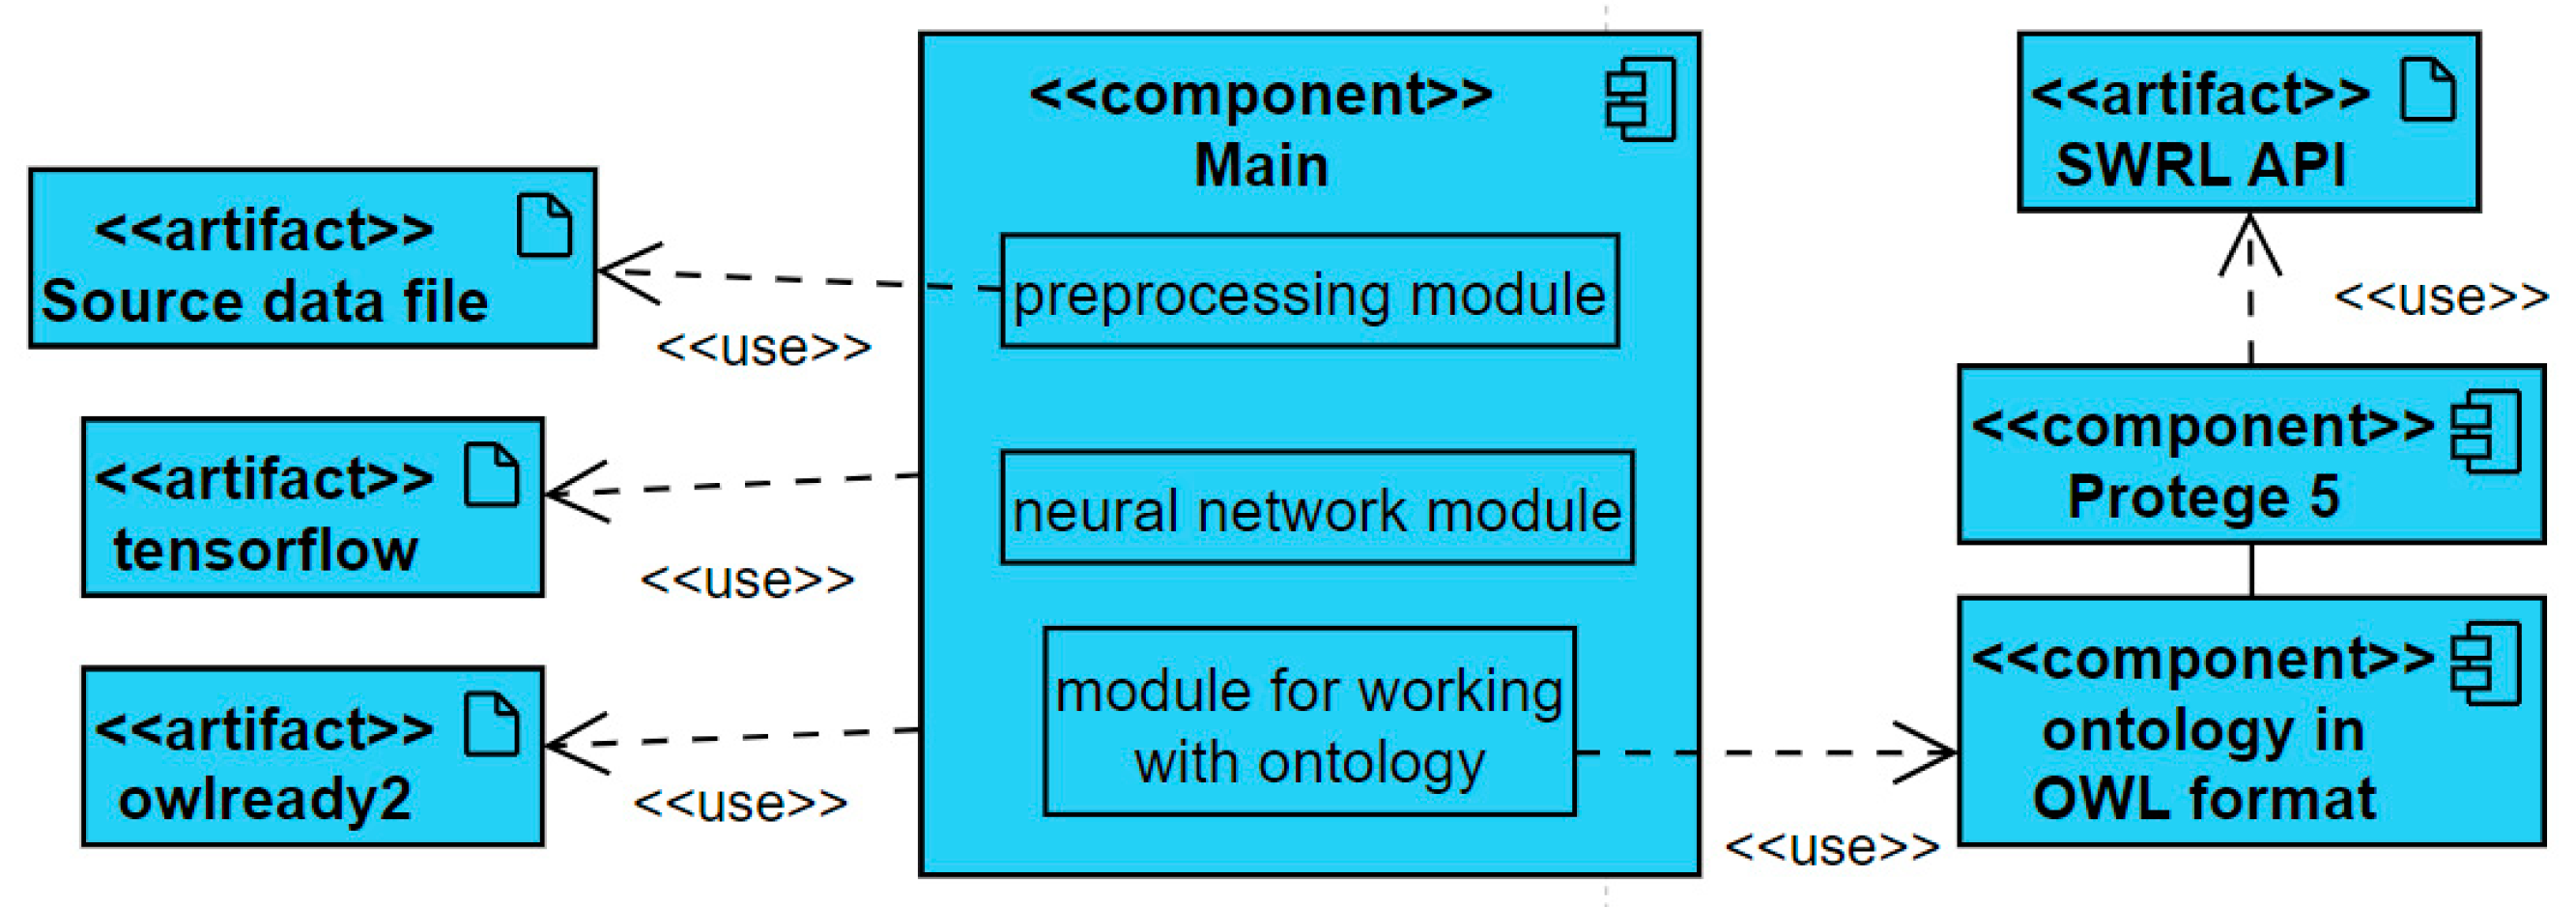
4. Time Series Anomaly Search Software System
- OWLReady2 provides ontology processing in Python. The owlready2 library is used to unload and load ontology classes, objects, and relations from external sources.
- The sqrlb library functions are used for validation. The individual is put true in the identity property if all predicates are true.
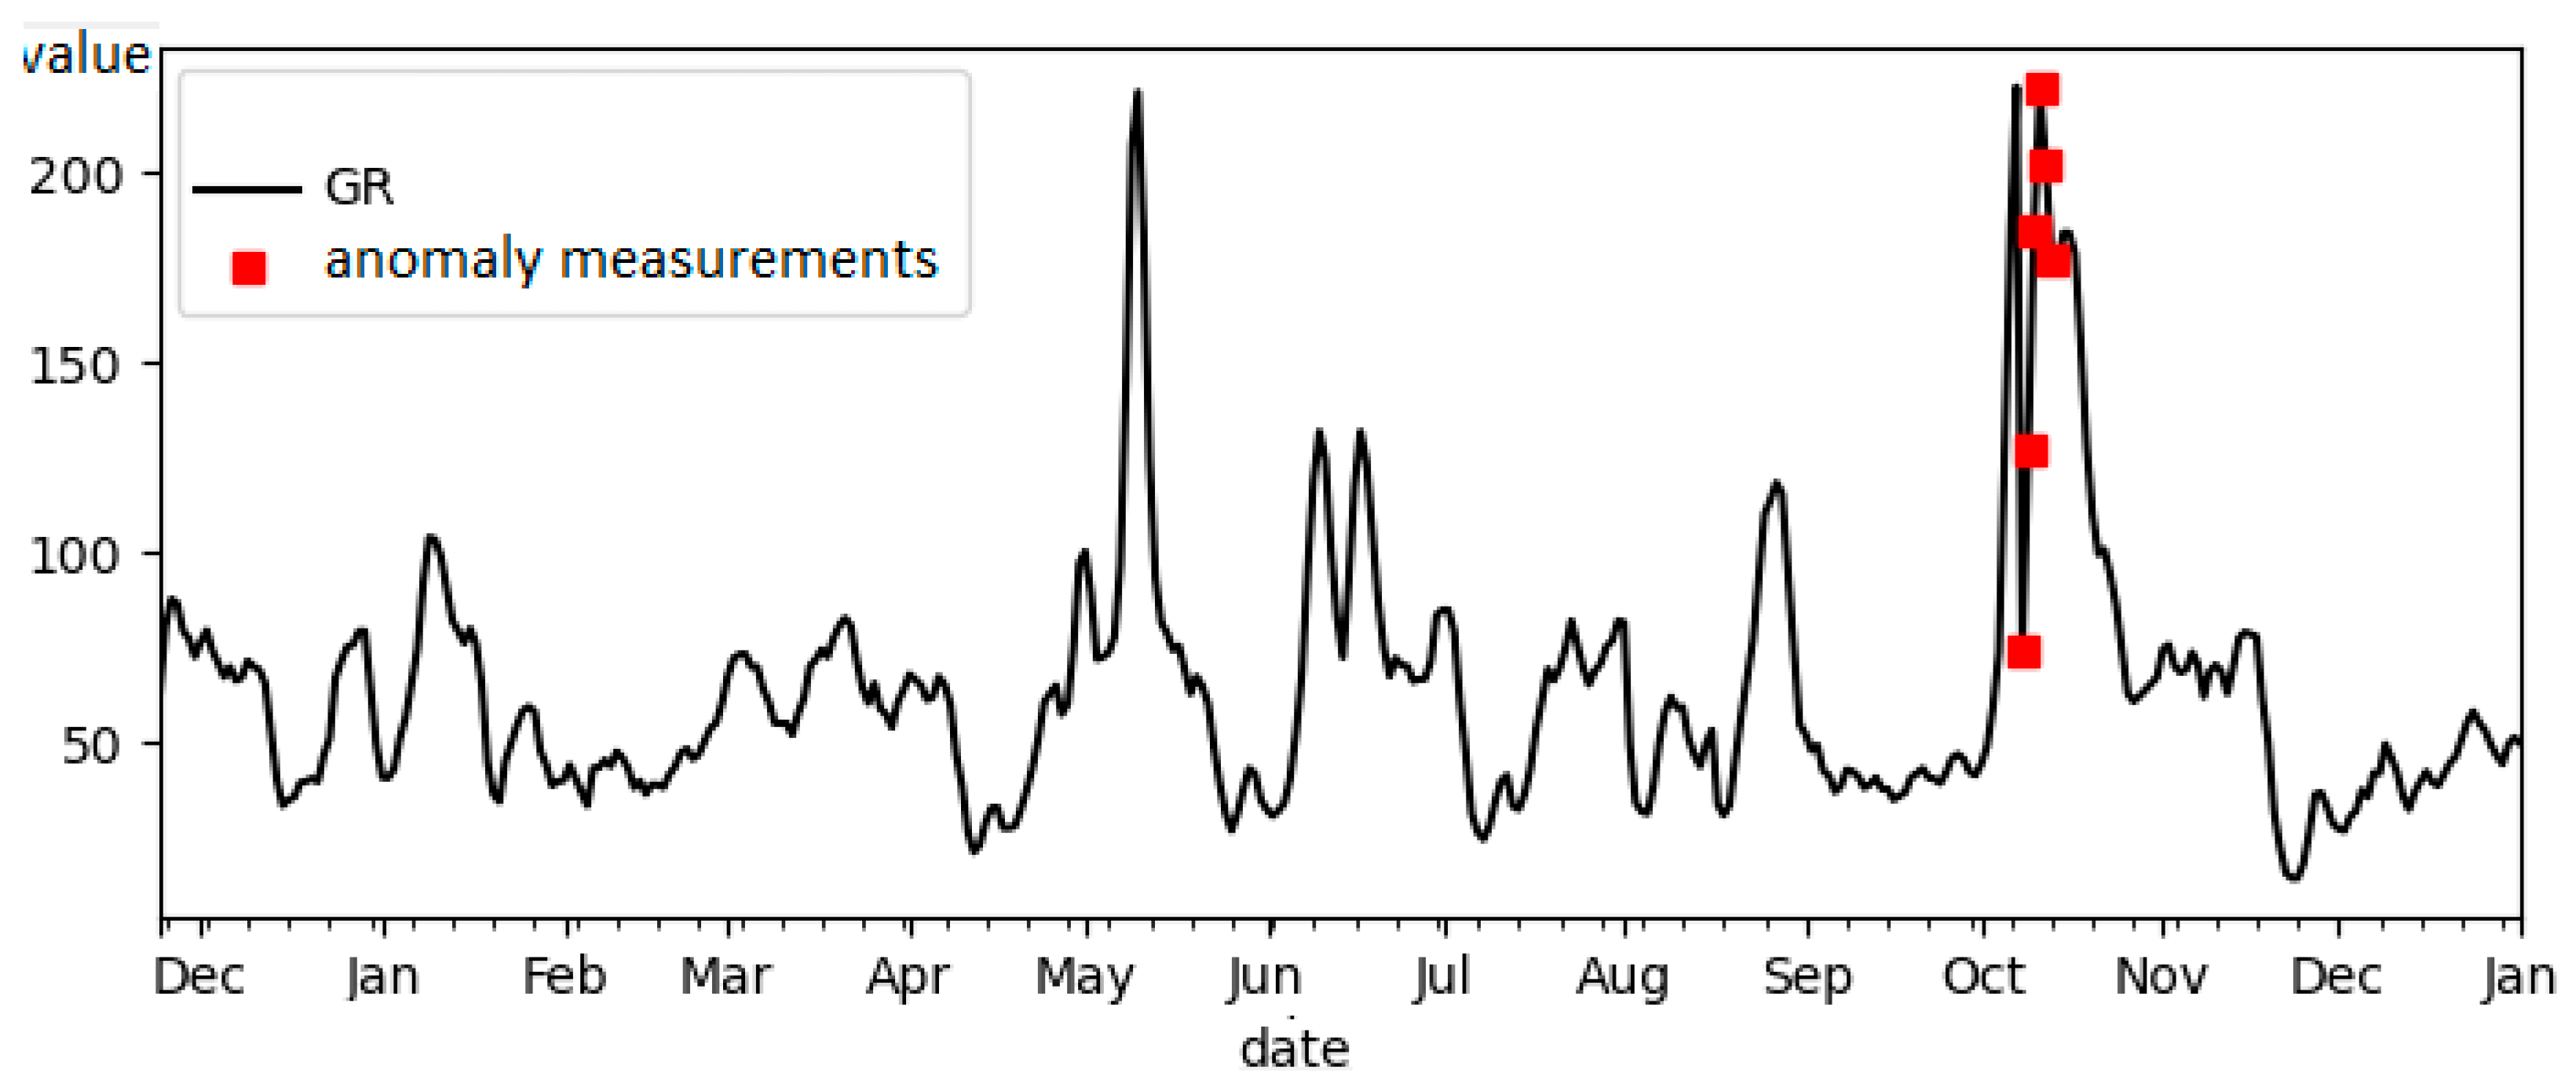
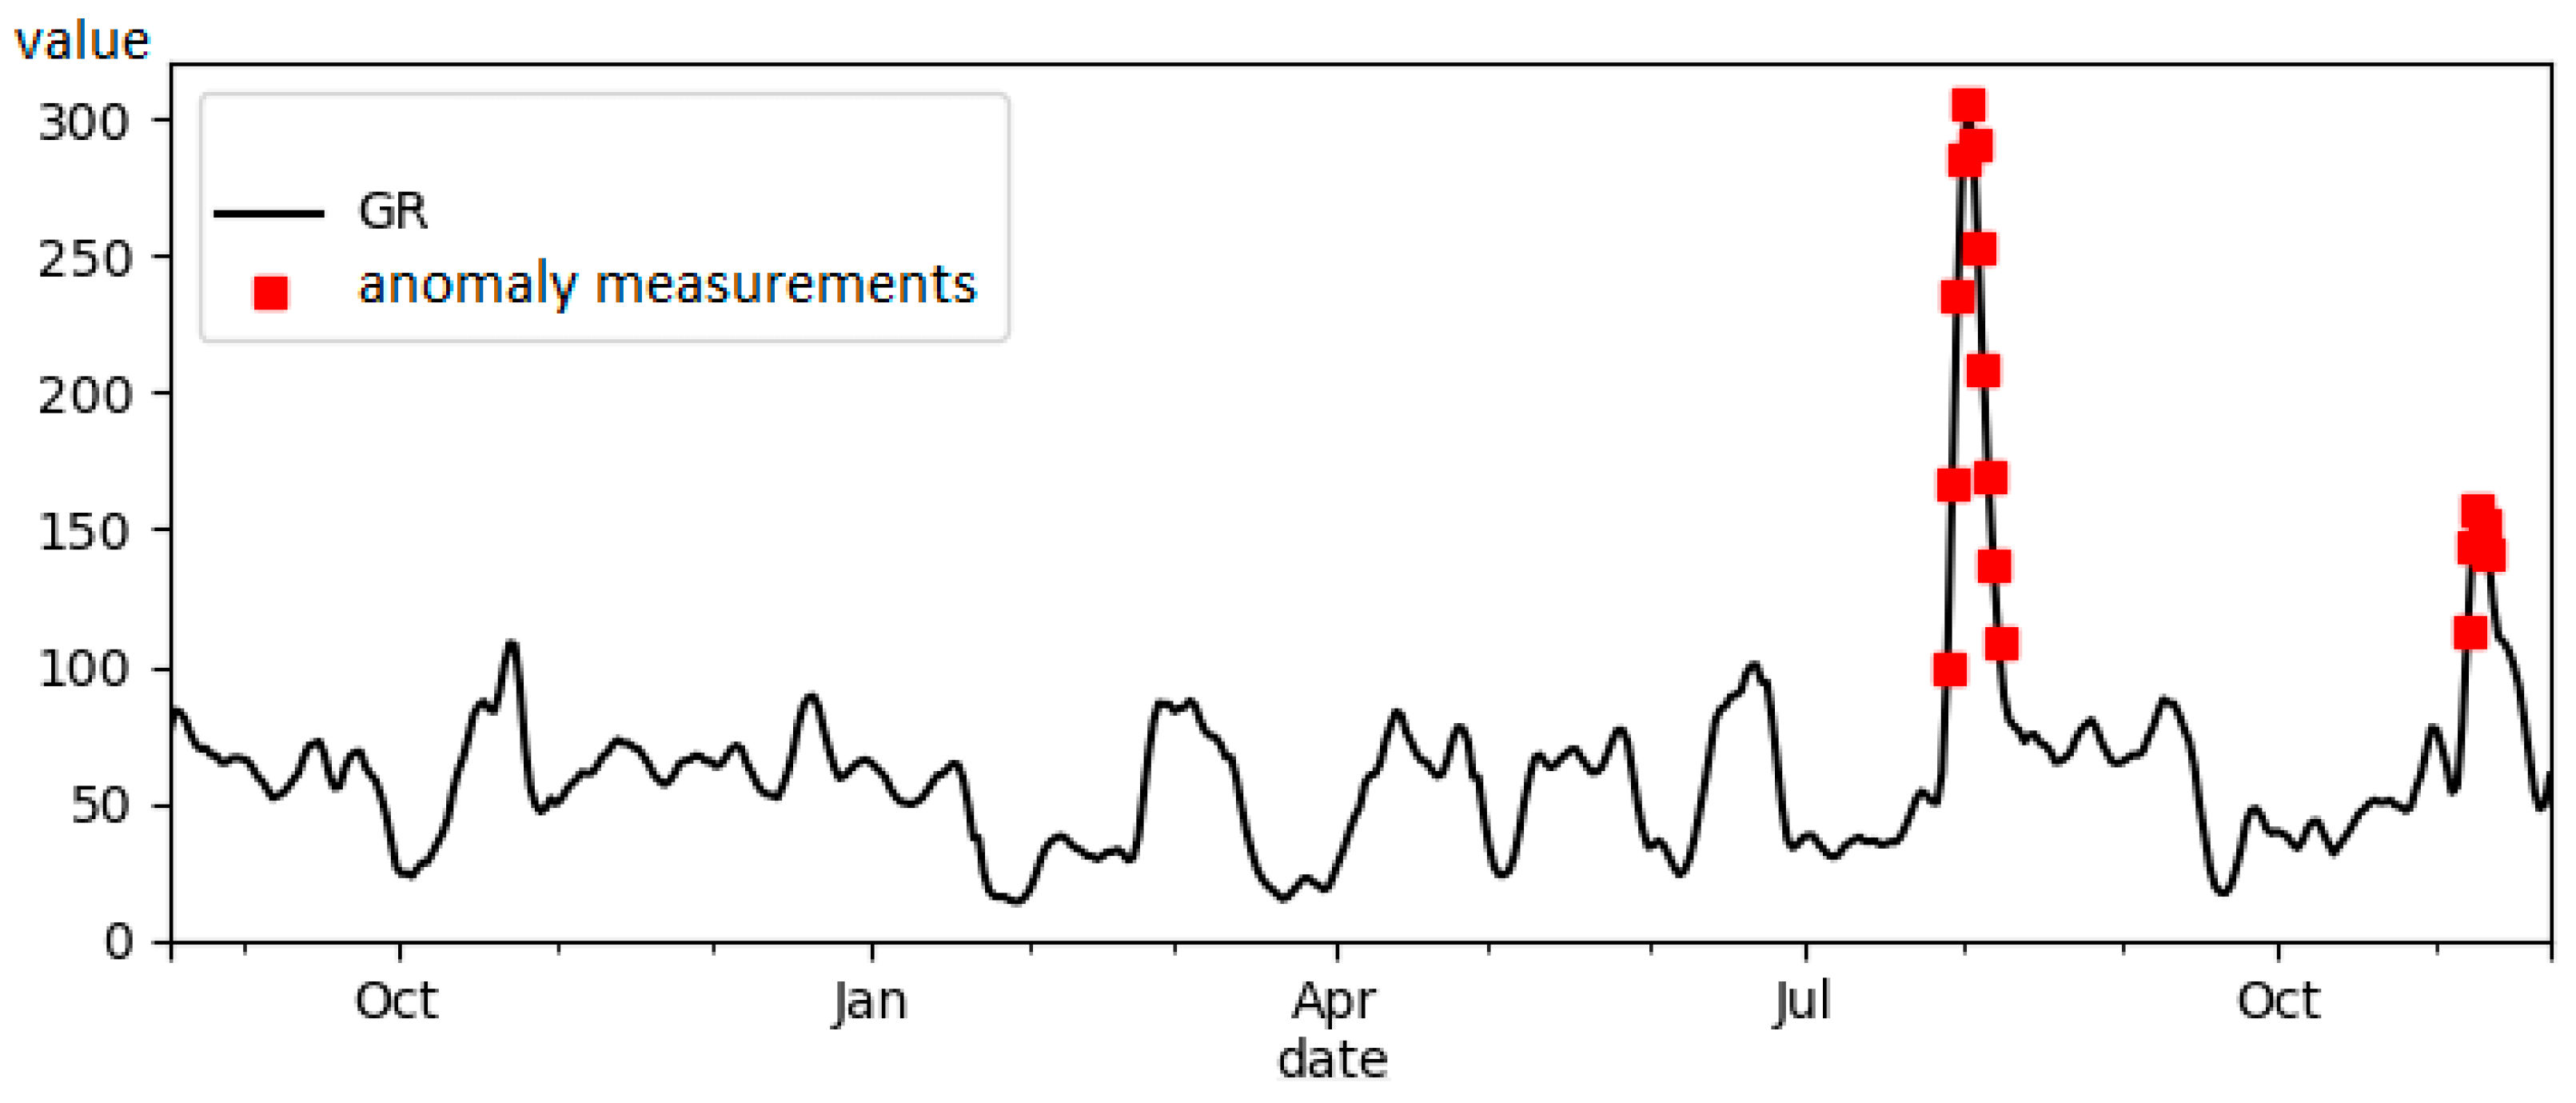
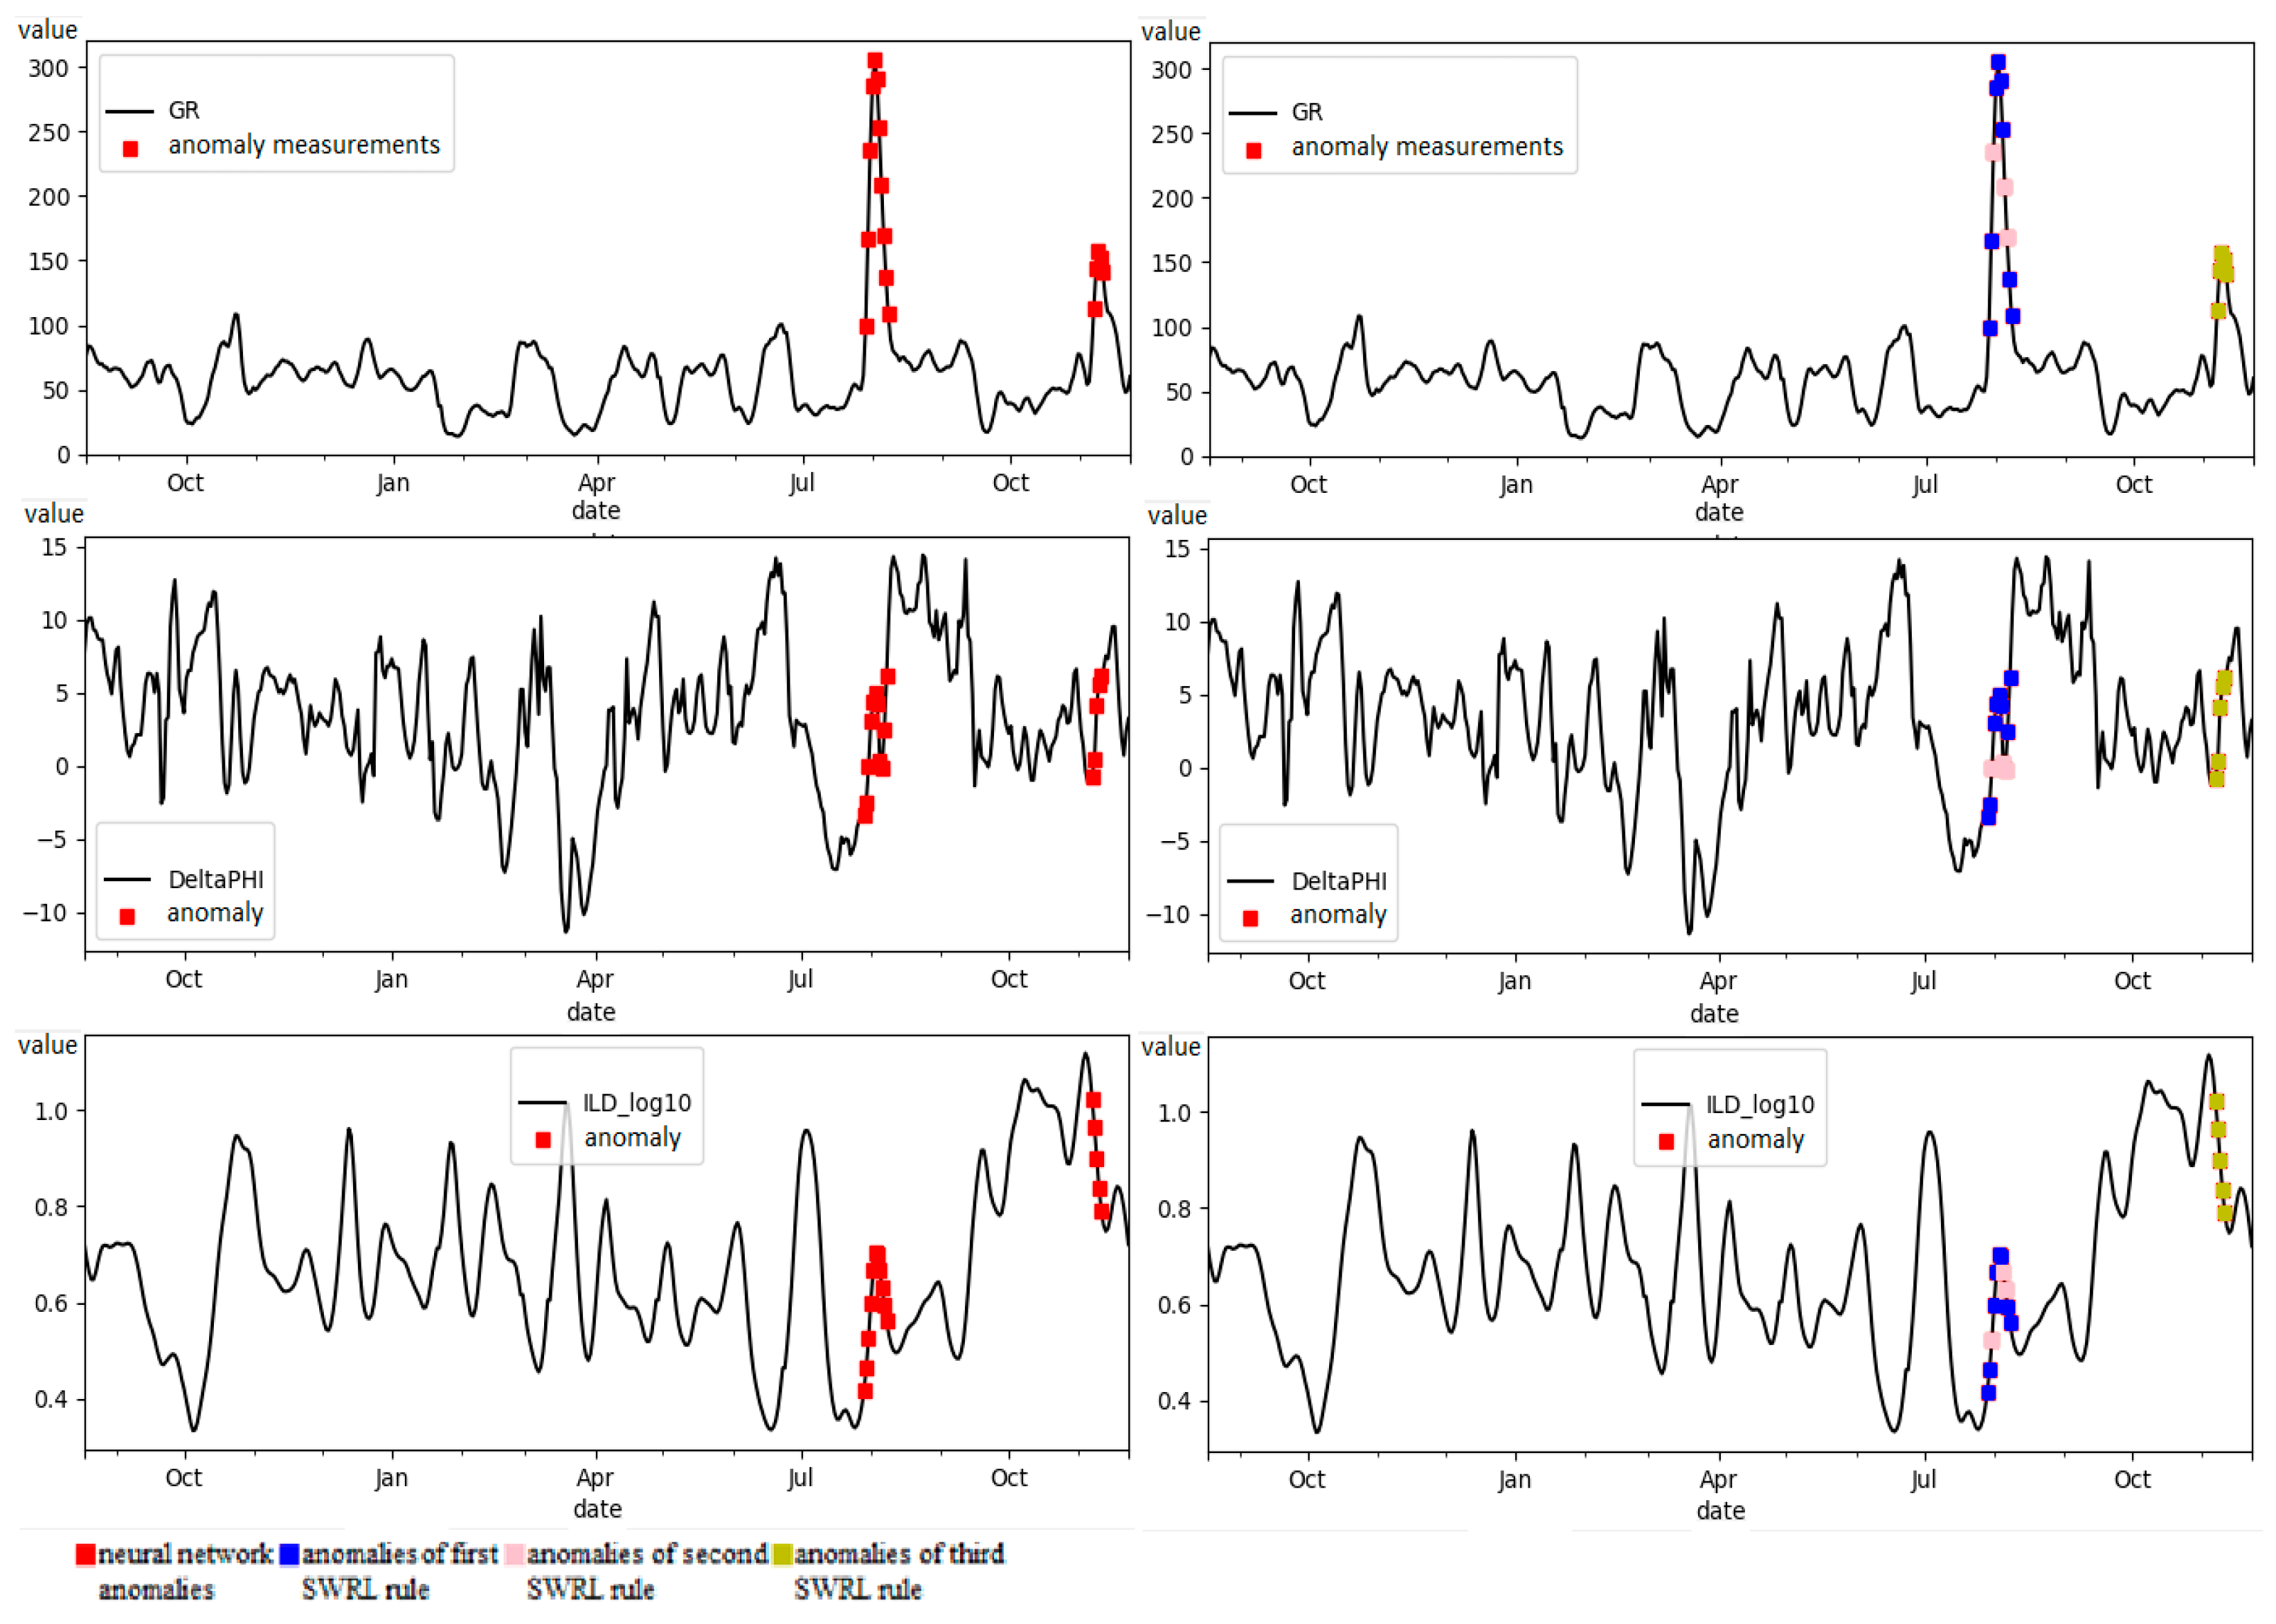
5. Experiments
- GR—measure gamma emission;
- Delta PHI—porosity index in petrophysics;
- ILD_log10—resistivity measurement.
- The algorithm takes into account the specifics of the subject area when searching for anomalies in time series. A particular value is anomalous in one subject area, but not in another. The use of neural networks does not solve this problem, and since it is based on training data, training data may not be enough. An ontology stores the knowledge of experts in a given subject area.
- The algorithm showed high efficiency (but not maximum) in accordance with the MAE metric.
- Experts develop an ontology of the subject area, in particular, experts develop a set of SWRL rules that filter anomaly search results using a neural network. This approach is labor intensive. Therefore, we plan to develop an approach for automated extraction of rules from text resources.
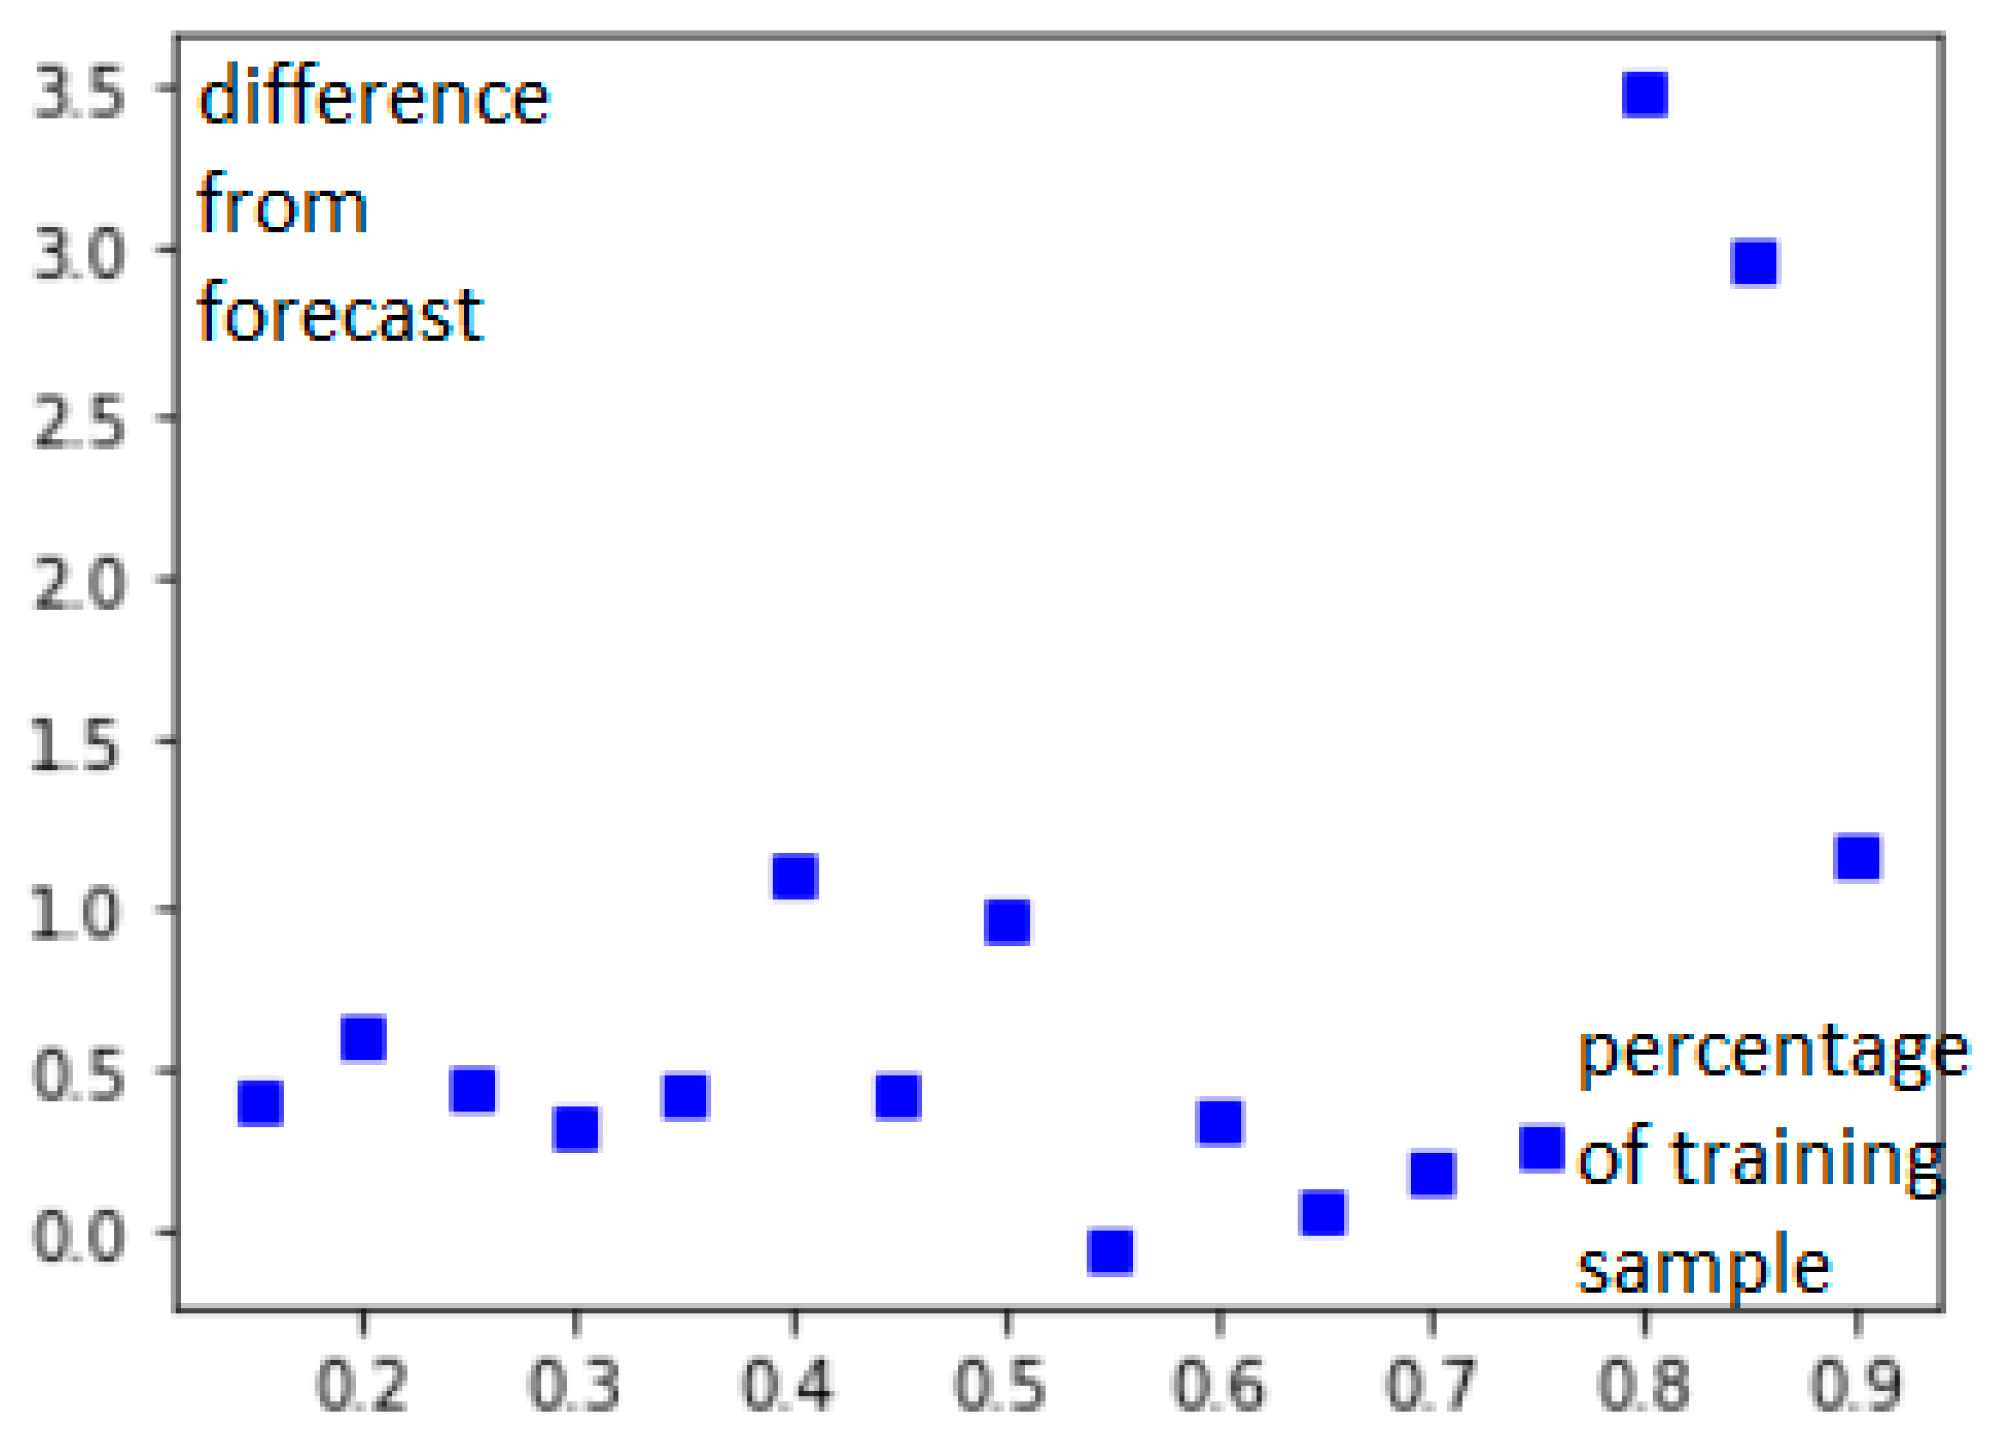
- The efficiency of anomaly detection at the first stage of the algorithm (using neural networks) depends on the quality of the training sample. Therefore, the approach works more efficiently on large data samples. This problem is partially solved by taking into account the regularities of the subject area, embedded in the ontology.
6. Conclusions
- Using an ontology together with neural networks allows you to semantically filter anomaly search results. Using only machine learning algorithms does not solve the problem in which a particular value is anomalous in one subject area, but not in another. Using only machine learning does not fully solve the problem, since it is based on training data, training data may not be enough. An ontology stores the knowledge of experts in a given subject area. Thanks to this, the developed algorithm can be transferred from one subject area to another: to find deviations in the traffic of computer networks, in the oil pressure of helicopter units, in weather temperature, etc. It is just the ontology that is needed to be changed.
- The algorithm showed high efficiency (but not maximum) in accordance with the MAE metric. It is possible to modify the architecture of the neural network to improve efficiency.
Author Contributions
Funding
Institutional Review Board Statement
Informed Consent Statement
Data Availability Statement
Conflicts of Interest
References
- Zhao, X.; Zhang, L.; Cao, Y.; Jin, K.; Hou, Y. Anomaly Detection Approach in Industrial Control Systems Based on Measurement Data. Information 2022, 13, 450. [Google Scholar] [CrossRef]
- Aggarwal, C. On abnormality Detection in Spuriously Populated Data Streams. In Proceedings of the 5th SIAM Data Mining Conference, Newport Beach, CA, USA, 21–23 April 2005; pp. 80–91. [Google Scholar]
- Du, W.; Fang, L.; Peng, N. Lad: Localization anomaly detection for wireless sensor networks. J. Paral. Distrib. Comput. 2006, 66, 874–886. [Google Scholar] [CrossRef]
- Hickinbotham, S.; Austin, J. Novelty Detection in Airframe Strain Data. In Proceedings of the International Conference on Pattern Recognition, Barcelona, Spain, 15 December 2000; pp. 536–539. [Google Scholar]
- Budalakoti, S.; Srivastava, A.; Otey, M. Anomaly detection and Diagnosis Algorithms for Discrete Symbol Sequences with Applications to Airline Safety. In Proceedings of the IEEE International Conference on Systems, Man, and Cybernetics, Montreal, QC, Canada, 7–10 October 2007; Volume 37. [Google Scholar]
- Krupski, J.; Graniszewski, W.; Iwanowski, M. Data Transformation Schemes for CNN-Based Network Traffic Analysis: A Survey. Electronics 2021, 10, 2042. [Google Scholar] [CrossRef]
- Wen, T.; Keyes, R. Time series anomaly detection using convolutional neural networks and transfer learning. arXiv 2019, arXiv:1905.13628. [Google Scholar]
- Hwang, R.-H.; Peng, M.-C.; Huang, C.-W.; Lin, P.-C.; Nguyen, V.-L. An Unsupervised Deep Learning Model for Early Network Traffic Anomaly Detection. IEEE Access 2020, 8, 30387–30399. [Google Scholar] [CrossRef]
- Scholkopf, B.; Williamson, R.; Smola, A.; Shawe-Taylor, J.; Platt, J. Support vector method for novelty detection. Adv. Neural Inf. Process. Syst. 2000, 12, 582–588. [Google Scholar]
- Hurdle, E.E.; Bartlett, L.M.; Andrews, J.D. System Fault Diagnostics Using Fault Tree Analysis. In Proceedings of the 16th Conference on Advances in Reliability Technology Symposium (ARTS), Leics, UK, 3 April 2005; pp. 203–222. [Google Scholar]
- Korbicz, J.; Kowal, M. Intelligent Systems in Technical and Medical Diagnostics; Springer: Dordrecht, The Netherlands, 2013; p. 530. [Google Scholar]
- Keogh, E.; Lonardi, S.; Chiu, B.Y.C. Finding Surprising Patterns in a Time Series Database in Linear Time and Space. In Proceedings of the 8th ACM SIGKDD International Conference on Kowledge Discovery and Data Mining, Edmonton, AB, Canada, 23–26 July 2002; pp. 550–556. [Google Scholar]
- Campbell, C.; Bennett, K. A linear programming approach to novelty detection. Adv. Neural Inf. Process. Syst. 2000, 13. [Google Scholar]
- Zhu, W.; Beroza, G.C. PhaseNet: A Deep-Neural-Network-Based Seismic Arrival Time Picking Method. Geophys. J. Int. 2018, 216, 261–273. [Google Scholar] [CrossRef] [Green Version]
- Wu, W.; He, L.; Lin, W.; Su, Y.; Cui, Y.; Maple, C.; Jarvis, S.A. Developing an Unsupervised Real-Time Anomaly Detection Scheme for Time Series with Multi-Seasonality. IEEE Trans. Knowl. Data Eng. 2020, 34, 4147–4160. [Google Scholar] [CrossRef]
- Thill, M.; Konen, W.; Bäck, T. Time Series Encodings with Temporal Convolutional Networks. In International Conference on Bioinspired Methods and Their Applications; Springer: Berlin/Heidelberg, Germany, 2020; pp. 161–173. [Google Scholar]
- Marín, G.; Casas, P.; Capdehourat, G. Rawpower: Deep learning based anomaly detection from raw network traffic measurements. In Proceedings of the ACM SIGCOMM 2018 Conference on Posters and Demos, Budapest, Hungary, 20–25 August 2018; pp. 75–77. [Google Scholar]
- Park, D.; Hoshi, Y.; Kemp, C.C. A Multimodal Anomaly Detector for Robot-Assisted Feeding Using an LSTM-Based Variational Autoencoder. IEEE Robot. Autom. Lett. 2018, 3, 1544–1551. [Google Scholar] [CrossRef] [Green Version]
- Dridi, A.; Boucetta, C.; Hammami, S.E.; Afifi, H.; Moungla, H. STAD: Spatio-Temporal Anomaly Detection Mechanism for Mobile Network Management. IEEE Trans. Netw. Serv. Manag. 2020, 18, 894–906. [Google Scholar] [CrossRef]
- Tajer, A.; Veeravalli, V.V.; Poor, H.V. Outlying sequence detection in large data sets: A data-driven approach. IEEE Signal Process. Mag. 2014, 31, 44–56. [Google Scholar] [CrossRef]
- Chandola, V.; Banerjee, A.; Kumar, V. Anomaly detection for discrete sequences: A survey. IEEE Trans. Knowl. Data Eng. 2010, 24, 823–839. [Google Scholar] [CrossRef]
- Dean, D.A.; Goldberger, A.L.; Mueller, R.; Kim, M.; Rueschman, M.; Mobley, D.; Sahoo, S.; Jayapandian, C.P.; Cui, L.; Morrical, M.G.; et al. Scaling Up Scientific Discovery in Sleep Medicine: The National Sleep Research Resource. Sleep 2016, 39, 1151–1164. [Google Scholar] [CrossRef] [PubMed] [Green Version]
- Chiu, B.; Keogh, E.; Lonardi, S. Probabilistic discovery of time series motifs. In Proceedings of the Ninth ACM SIGKDD International Conference on Knowledge Discovery and Data Mining, Washington, DC, USA, 24–27 August 2003; pp. 493–498. [Google Scholar]
- Bicego, M.; Murino, V.; Figueiredo, M.A. A sequential pruning strategy for the selection of the number of states in hidden Markov models. Pattern Recognit. Lett. 2003, 24, 1395–1407. [Google Scholar] [CrossRef]
- Hadjieleftheriou, M.; Kollios, G.; Tsotras, V.J.; Gunopulos, D. Efficient Indexing of Spatiotemporal Objects. In Advances in Database Technology—EDBT 2002: 8th International Conference on Extending Database Technology Prague, Czech Republic, 25–27 March 2002; Springer: Berlin/Heidelberg, Germany, 2002. [Google Scholar]
- Salvador, S.; Chan, P. Learning States and Rules for Detecting Anomalies in Time Series. Appl. Intell. 2005, 23, 241–255. [Google Scholar] [CrossRef] [Green Version]
- Shmueli, G.; Fienberg, S.E. “Current and Potential Statistical Methods for Monitoring Multiple Data Streams for Bio-Surveillance”, Statistical Methods in Counter-Terrorism; Wilson, A., Olwell, D., Eds.; Springer: Berlin/Heidelberg, Germany, 2006. [Google Scholar]
- Rebbapragada, U.; Protopapas, P.; Brodley, C.E.; Alcock, C. Finding anomalous periodic time series: An application to catalogs of periodic variable stars. arXiv 2009, arXiv:0905.3428. [Google Scholar] [CrossRef]
- Ozkan, H.; Ozkan, F.; Kozat, S.S. Online Anomaly Detection Under Markov Statistics with Controllable Type-I Error. IEEE Trans. Signal Process. 2015, 64, 1435–1445. [Google Scholar] [CrossRef]
- Que, J.; Tsui, F.-C. Rank-based spatial clustering: An algorithm for rapid outbreak detection. J. Am. Med. Inform. Assoc. 2011, 18, 218–224. [Google Scholar] [CrossRef]
- Bishop, C.M. Neural Networks for Pattern Recognition; Oxford University Press: Oxford, UK, 1995. [Google Scholar]
- Que, J.; Tsui, F.-C. Spatial and Temporal Algorithm Evaluation for Detecting Over-The-Counter Thermometer Sale Increases during 2009 H1N1 Pandemic. Online J. Public Health Inform. 2012, 4, ojphi.v4i1.3915. [Google Scholar] [CrossRef] [Green Version]
- Cheng, H.; Tan, P.; Potter, C.; Klooster, S. Detection and characterization of anomalies in multivariate time series. In Proceedings of the Ninth SIAM International Conference on Data Mining, Sparks, NV, USA, 30 April—2 May 2009. [Google Scholar]
- Brumley, D.; Poosankam, P.; Song, D.; Zheng, J. Automatic patch-based exploit generation is possible: Techniques and implications. In Proceedings of the 2008 IEEE Symposium on Security and Privacy, Oakland, CA, USA, 18–21 May 2008; pp. 143–157. [Google Scholar]
- Bishop, C.M.; Nasrabadi, N.M. Pattern Recognition and Machine Learning; Springer Science Business Media LLC: New York, NY, USA, 2006. [Google Scholar]
- Bolton, R.J.; Hand, D.J. Statistical Fraud Detection: A Review. Stat. Sci. 2002, 17, 235–255. [Google Scholar] [CrossRef]
- He, H.; Luo, X. A novel HMM-based approach to anomaly detection. J. Inf. Comput. Sci. 2004, 1, 91–94. [Google Scholar]
- Chawla, N.V.; Japkowicz, N.; Kotcz, A. Special issue on learning from imbalanced data sets. ACM SIGKDD Explor. Newsl. 2004, 6, 1–6. [Google Scholar] [CrossRef]
- Joshi, S.S.; Phoha, V.V. Investigating hidden Markov models capabilities in anomaly detection. In Proceedings of the 43rd Annual Southeast Regional Conference—Volume 2; ACM: New York, NY, USA, 2005; pp. 98–103. [Google Scholar]
- Ghosh, S.; Reilly, D.L. Credit card fraud detection with a neural-network. In System Sciences, 1994. In Proceedings of the Twenty-Seventh Hawaii International Conference on System Science, Vol 3, Information Systems: DSS/Knowledge-Based Systems, Los Alamitos, CA, USA, 4–7 January 1994. [Google Scholar]
- Roman, R.C.; Precup, R.E.; Petriu, E.M. Hybrid data-driven fuzzy active disturbance rejection control for tower crane systems. Eur. J. Control. 2021, 58, 373–387. [Google Scholar] [CrossRef]
- Chi, R.; Li, H.; Shen, D.; Hou, Z.; Huang, B. Enhanced P-type control: Indirect adaptive learning from set-point updates. IEEE Trans. Autom. Control 2022, 68, 1600–1613. [Google Scholar] [CrossRef]
- Schmidl, S.; Wenig, P.; Papenbrock, T. Anomaly detection in time series: A comprehensive evaluation. Proc. VLDB Endow. 2022, 15, 1779–1797. [Google Scholar] [CrossRef]
- Wenig, P.; Schmidl, S.; Papenbrock, T. TimeEval: A benchmarking toolkit for time series anomaly detection algorithms. Proc. VLDB Endow. 2022, 15, 3678–3681. [Google Scholar] [CrossRef]
- Boniol, P.; Linardi, M.; Roncallo, F.; Palpanas, T.; Meftah, M.; Remy, E. Unsupervised and scalable subsequence anomaly detection in large data series. VLDB J. 2021, 30, 909–931. [Google Scholar] [CrossRef]
- Chen, R.-Q.; Shi, G.-H.; Zhao, W.-L.; Liang, C.-H. A joint model for IT operation series prediction and anomaly detection. Neurocomputing 2021, 448, 130–139. [Google Scholar] [CrossRef]
- Paparrizos, J.; Kang, Y.; Boniol, P.; Tsay, R.S.; Palpanas, T.; Franklin, M.J. TSB-UAD: An end-to-end benchmark suite for univariate time-series anomaly detection. Proc. VLDB Endow. 2022, 15, 1697–1711. [Google Scholar] [CrossRef]
- Ryzhikov, A.; Borisyak, M.; Ustyuzhanin, A.; Derkach, D. NFAD: Fixing anomaly detection using normalizing flows. PeerJ Comput. Sci. 2021, 7, e757. [Google Scholar] [CrossRef] [PubMed]
- Yarushkina, N.; Andreev, I.; Moshkin, V.; Moshkina, I. Integration of Fuzzy OWL Ontologies and Fuzzy Time Series in the Determination of Faulty Technical Units. In Computational Science and Its Applications—ICCSA 2019. Lecture Notes in Computer Science; Misra, S., Ed.; Springer: Cham, Switzerland, 2019; Volume 11619, pp. 545–555. [Google Scholar] [CrossRef]
- Moshkin, V.; Yarushkina, N.; Moshkina, I. The Intelligent System for Interactive Analysis and Forecasting of Graph Data. In Intelligent and Fuzzy Systems. INFUS 2022. Lecture Notes in Networks and Systems; Kahraman, C., Tolga, A.C., Cevik Onar, S., Cebi, S., Oztaysi, B., Sari, I.U., Eds.; Springer: Cham, Switzerland, 2022; Volume 504, pp. 870–878. [Google Scholar] [CrossRef]
- Malhotra, P.; Vig, L.; Shroff, G.M.; Agarwal, P. Long Short Term Memory Networks for Anomaly Detection in Time Series. In ESANN 2015: European Symposium on Artificial Neural Networks; Computational Intelligence and Machine Learning Bruge; ESANN: Bruges, Belgium, 22–24 April 2015. [Google Scholar]
- Krizhevsky, A. Convolutional Deep Belief Networks on CIFAR-10; University of Toronto: Toronto, ON, Canada, 2010. [Google Scholar]
- Nikolov, T. Recurrent Neural Network Based Language Model; Brno University of Technology: Brno, Czech Republic, 2010. [Google Scholar]
- Sak, H.; Senior, A.; Beaufays, F. Long Short-Term Memory Recurrent Neural Network Architectures for Large Scale Acoustic Modeling; Google Inc.: Mountain View, CA, USA, 2014. [Google Scholar]
- Moshkin, V.; Moshkina, I.; Yarushkina, N. The Software System for Calculating the Aggregated Forecast of Time Series. In Open Semantic Technologies for Intelligent Systems. OSTIS 2021. Communications in Computer and Information Science; Golenkov, V., Krasnoproshin, V., Golovko, V., Shunkevich, D., Eds.; Springer: Cham, Switzerland, 2022; Volume 1625, pp. 152–164. [Google Scholar] [CrossRef]
- Kurilo, D.S.; Moshkin, V.S. Development of a system for hybrid detection of time series anomalies. In Proceedings of the 2022 VIII International Conference on Information Technology and Nanotechnology (ITNT), Samara, Russia, 3–27 May 2022; pp. 1–4. [Google Scholar] [CrossRef]
- Jean-Baptiste, L. Ontologies with Python; Apress: Berkeley, CA, USA, 2020. [Google Scholar]
- Yarushkina, N.; Moshkin, V.; Andreev, I.; Klein, V.; Beksaeva, E. Hybridization of fuzzy inference and self-learning fuzzy ontology-based semantic data analysis. In Proceedings of the First International Scientific Conference “Intelligent Information Technologies for Industry”(IITI’16), Sochi, Russia, 16–21 May 2016. [Google Scholar] [CrossRef]
- Well Log Facies Dataset. Available online: https://www.kaggle.com/datasets/imeintanis/well-log-facies-dataset (accessed on 10 January 2023).


Disclaimer/Publisher’s Note: The statements, opinions and data contained in all publications are solely those of the individual author(s) and contributor(s) and not of MDPI and/or the editor(s). MDPI and/or the editor(s) disclaim responsibility for any injury to people or property resulting from any ideas, methods, instructions or products referred to in the content. |
© 2023 by the authors. Licensee MDPI, Basel, Switzerland. This article is an open access article distributed under the terms and conditions of the Creative Commons Attribution (CC BY) license (https://creativecommons.org/licenses/by/4.0/).
Share and Cite
Moshkin, V.; Kurilo, D.; Yarushkina, N. Integration of Fuzzy Ontologies and Neural Networks in the Detection of Time Series Anomalies. Mathematics 2023, 11, 1204. https://doi.org/10.3390/math11051204
Moshkin V, Kurilo D, Yarushkina N. Integration of Fuzzy Ontologies and Neural Networks in the Detection of Time Series Anomalies. Mathematics. 2023; 11(5):1204. https://doi.org/10.3390/math11051204
Chicago/Turabian StyleMoshkin, Vadim, Dmitry Kurilo, and Nadezhda Yarushkina. 2023. "Integration of Fuzzy Ontologies and Neural Networks in the Detection of Time Series Anomalies" Mathematics 11, no. 5: 1204. https://doi.org/10.3390/math11051204