
Hybrid Whale and Gray Wolf Deep Learning Optimization Algorithm for Prediction of Alzheimer’s Disease

 , , , and
Abstract
:1. Introduction
2. Literature Review
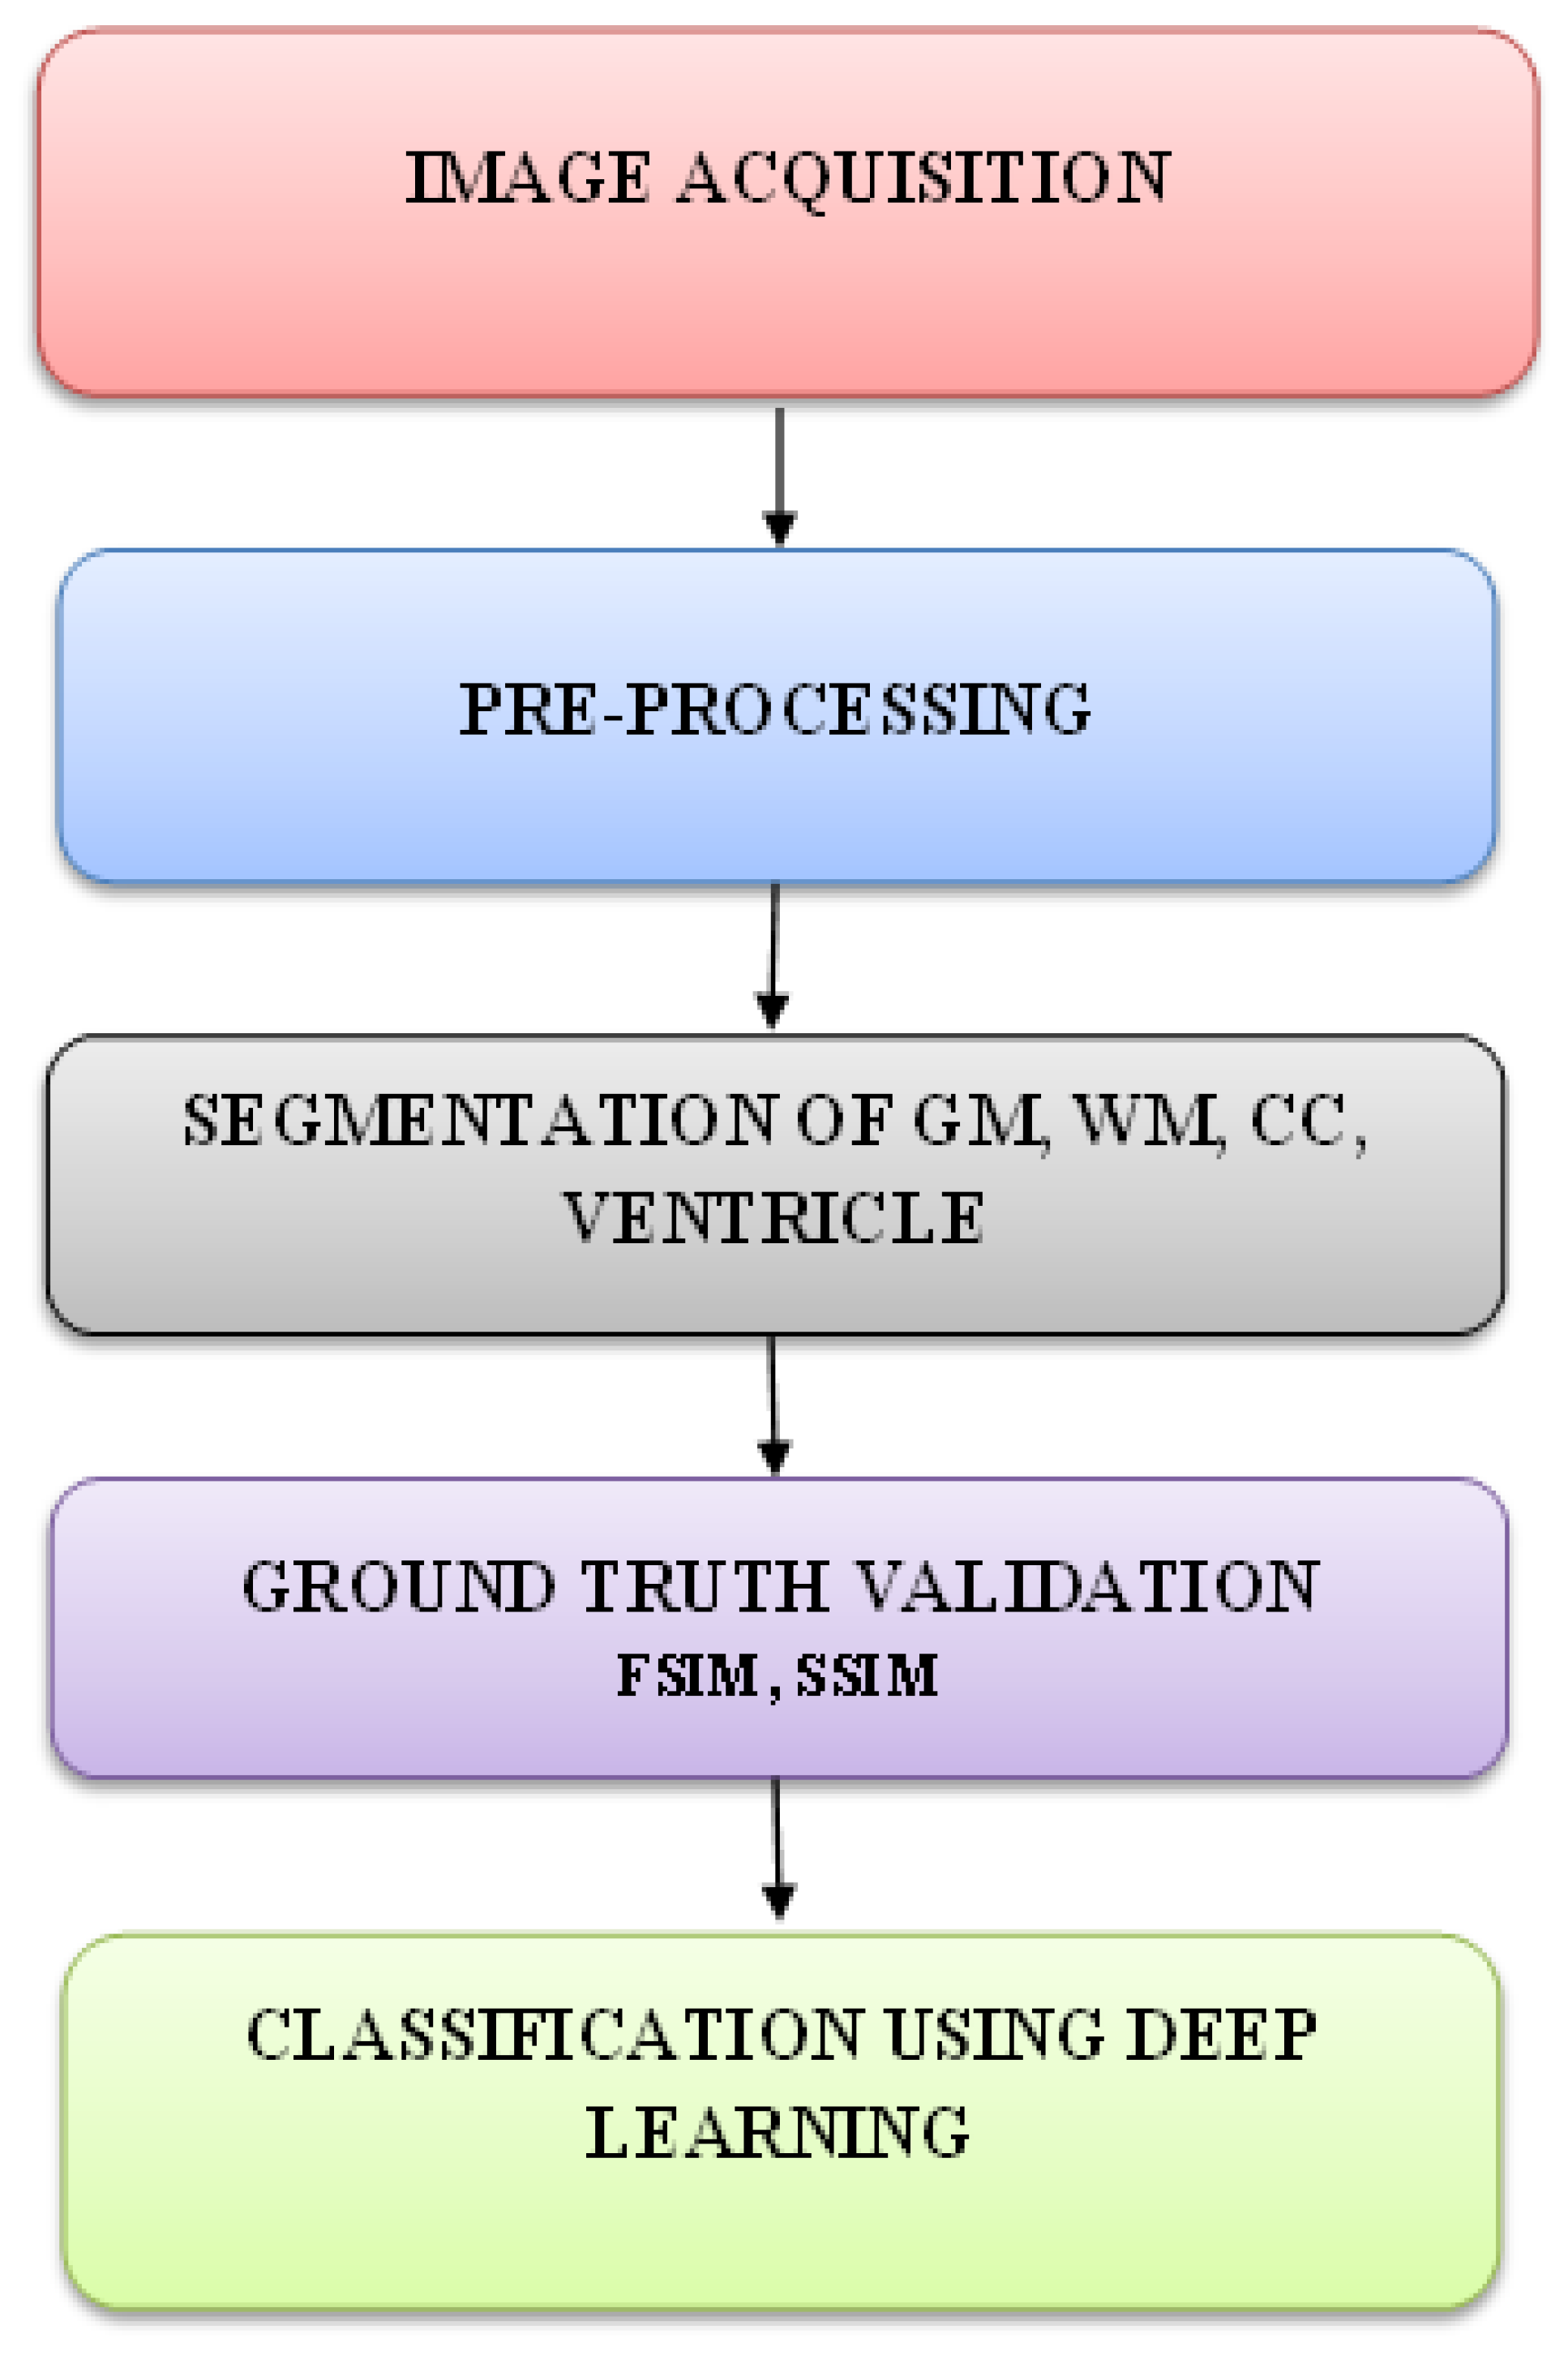
3. Proposed Framework Methodologies
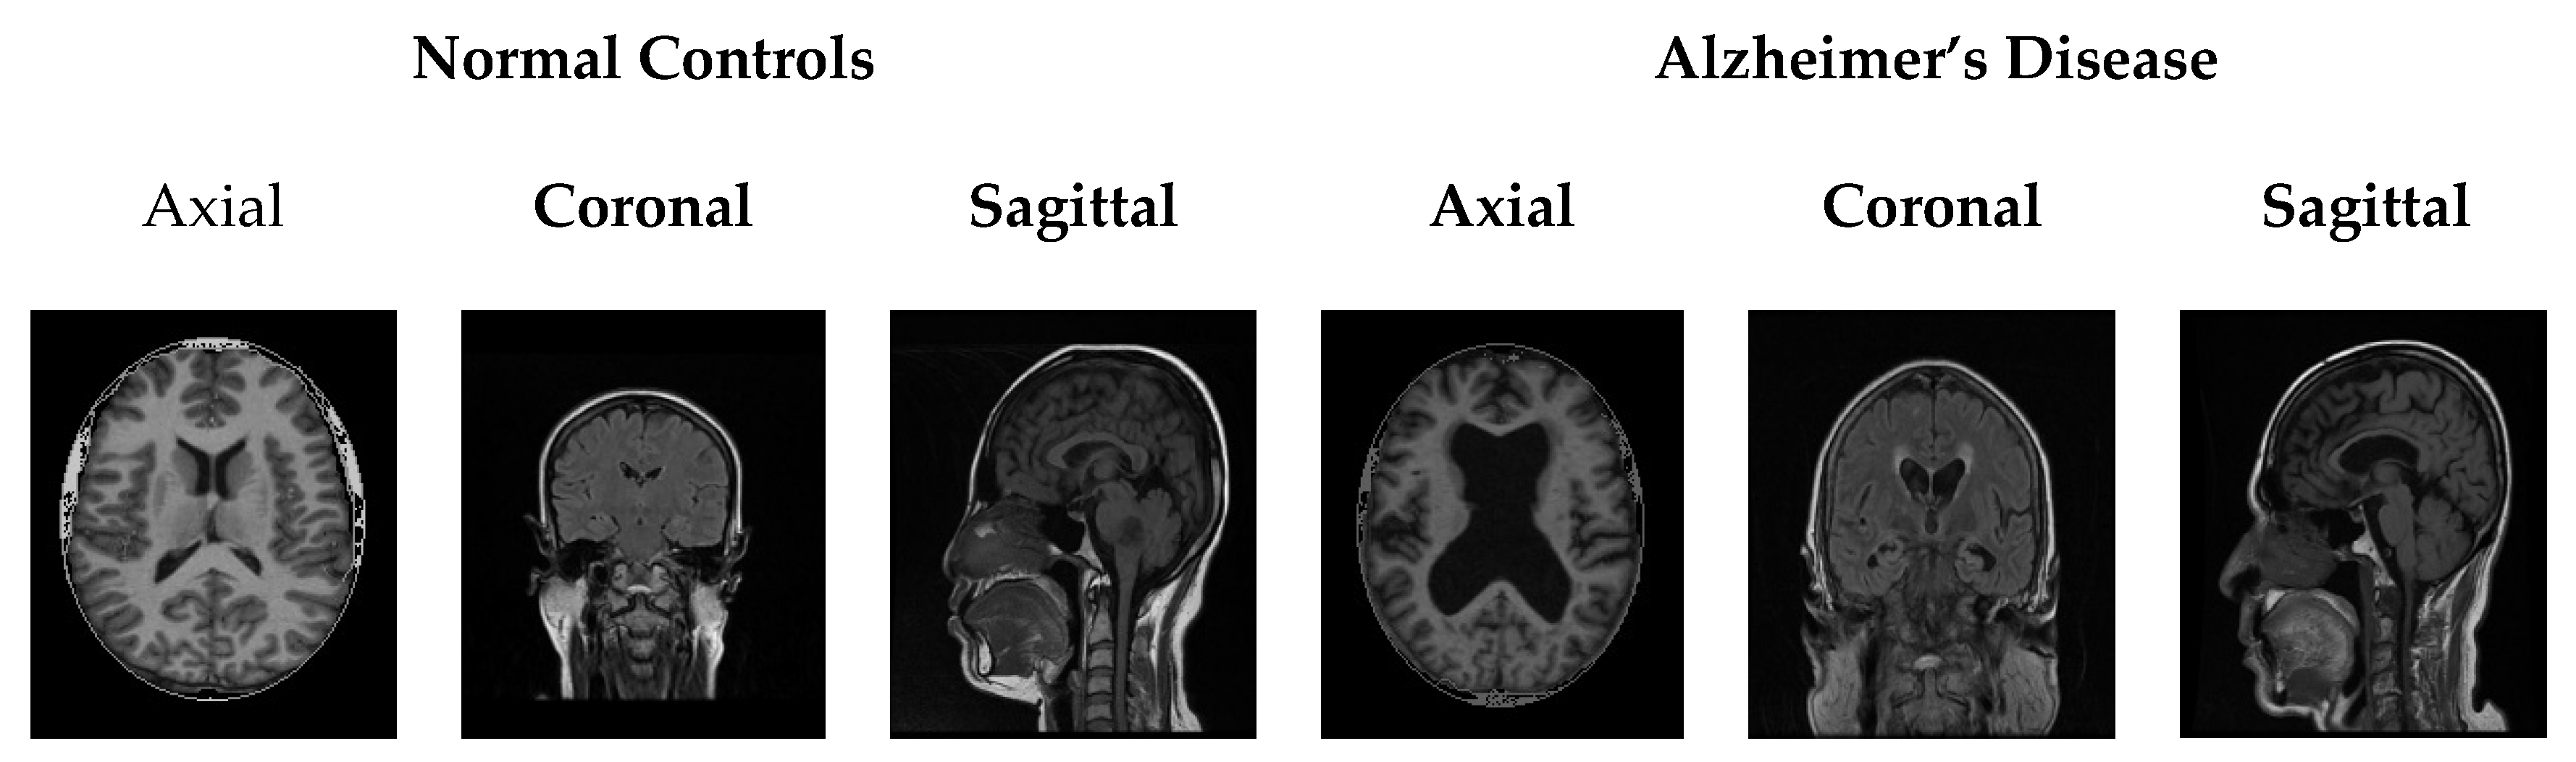
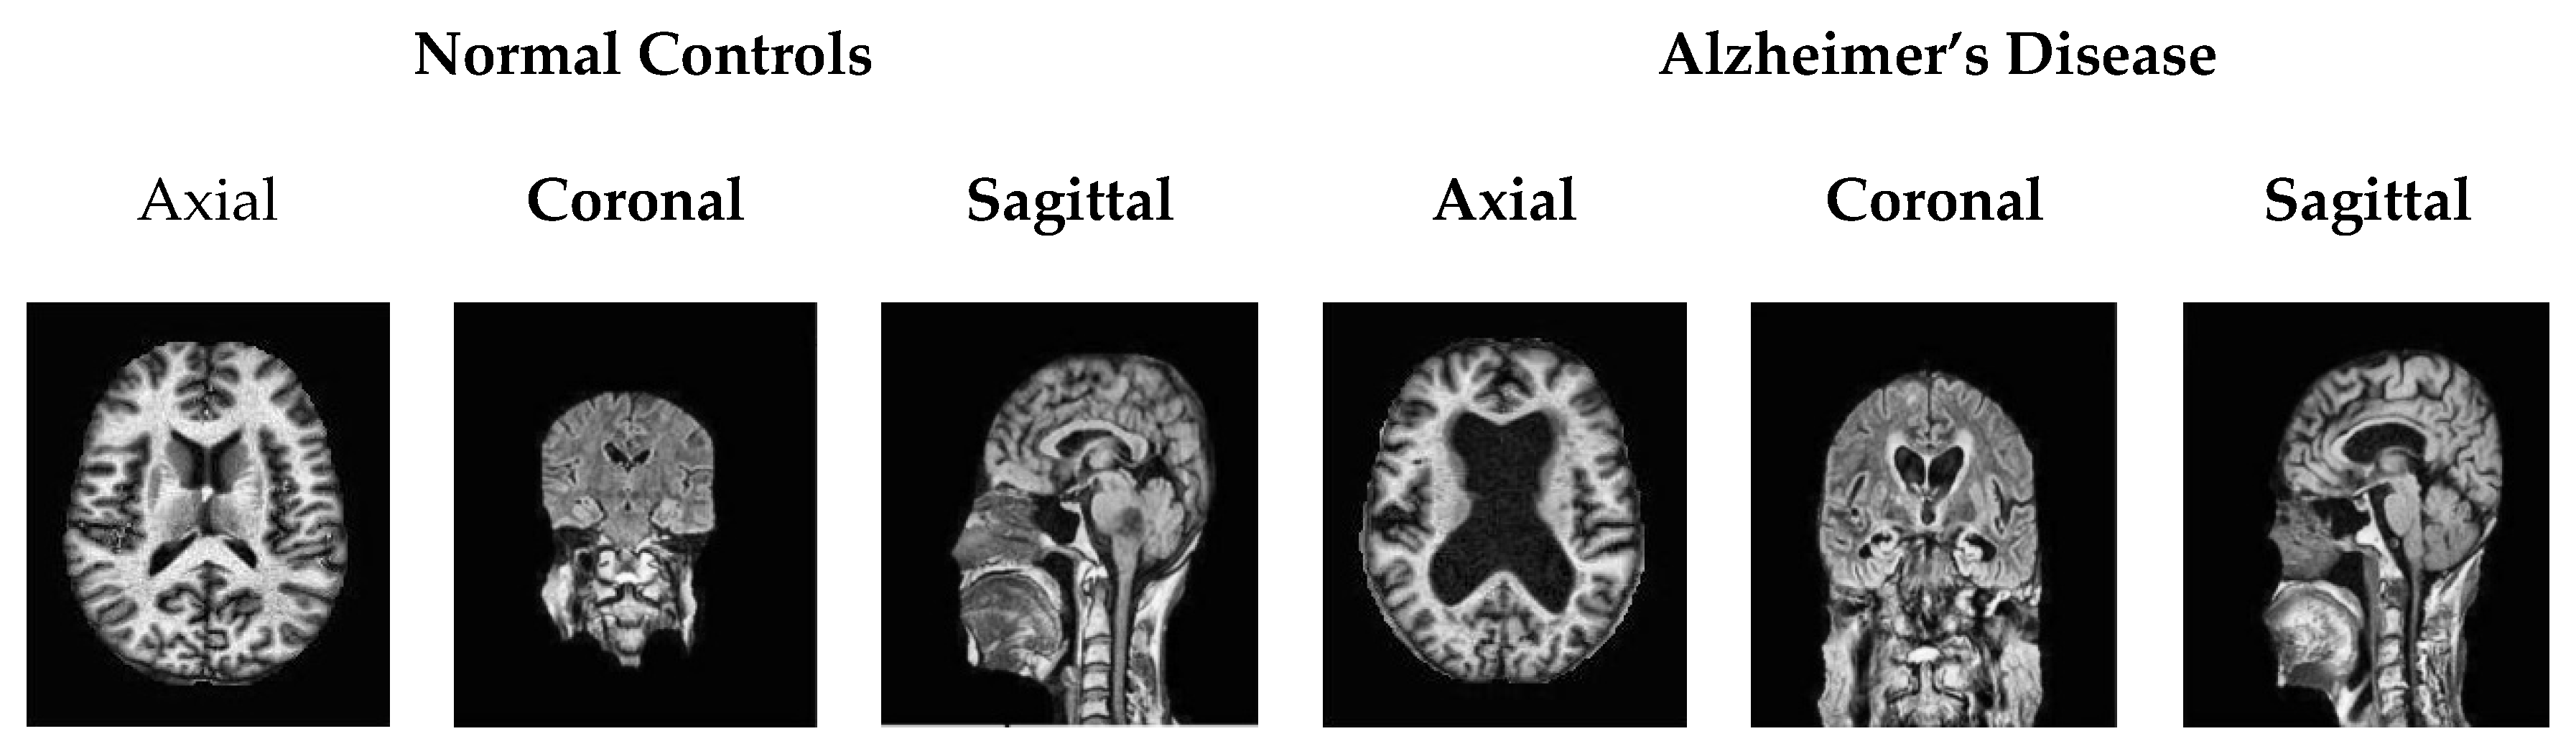
3.1. Dataset Availability
3.2. Preprocessing
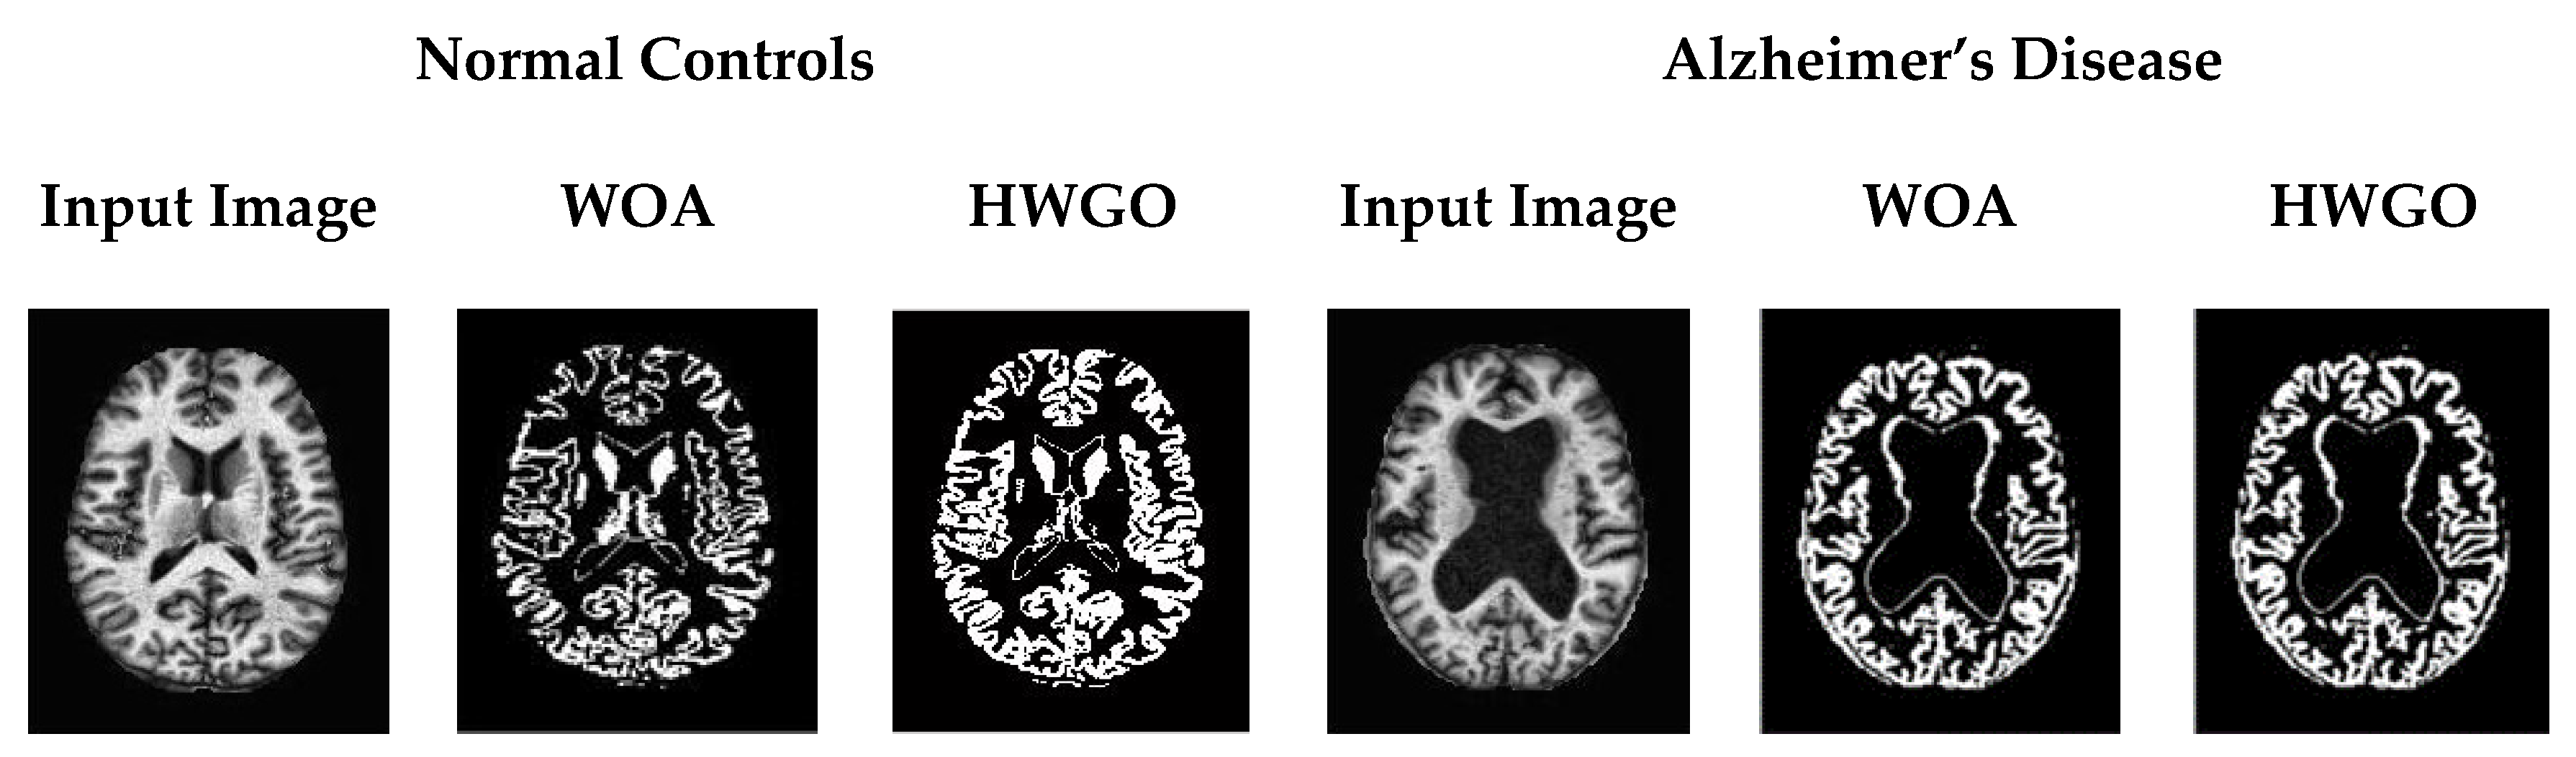
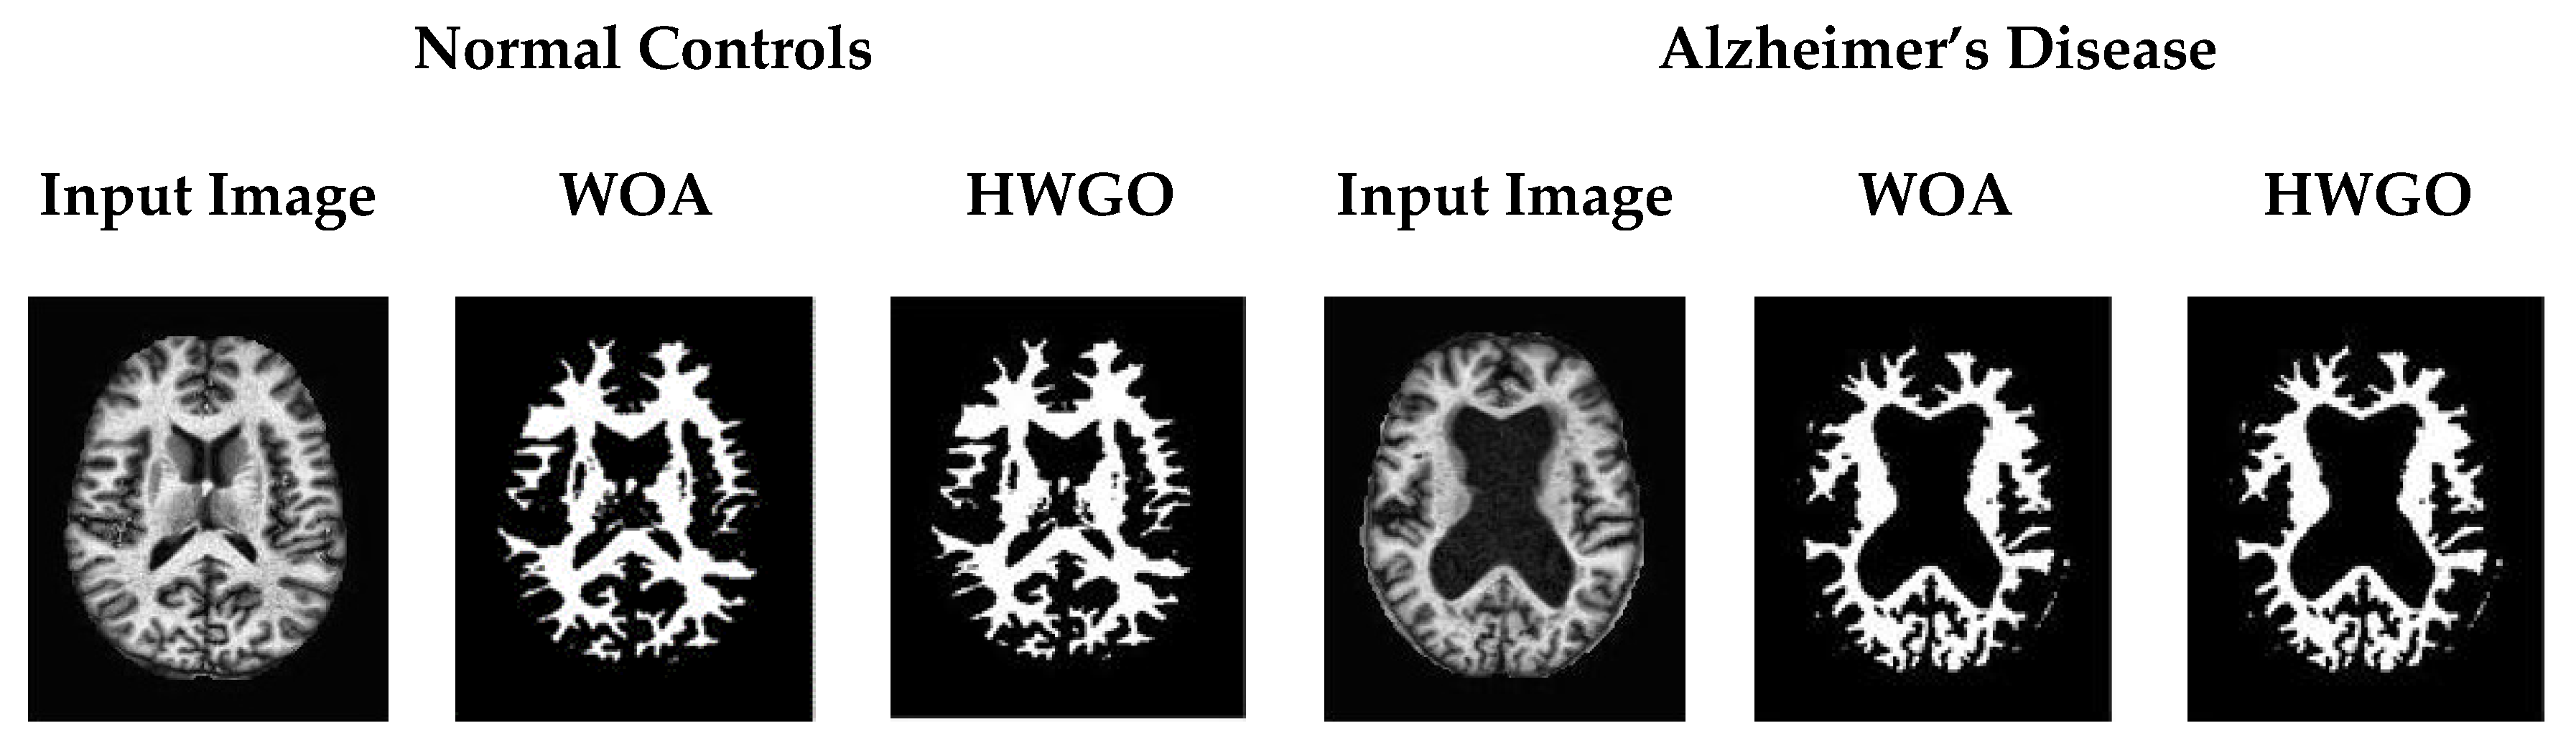
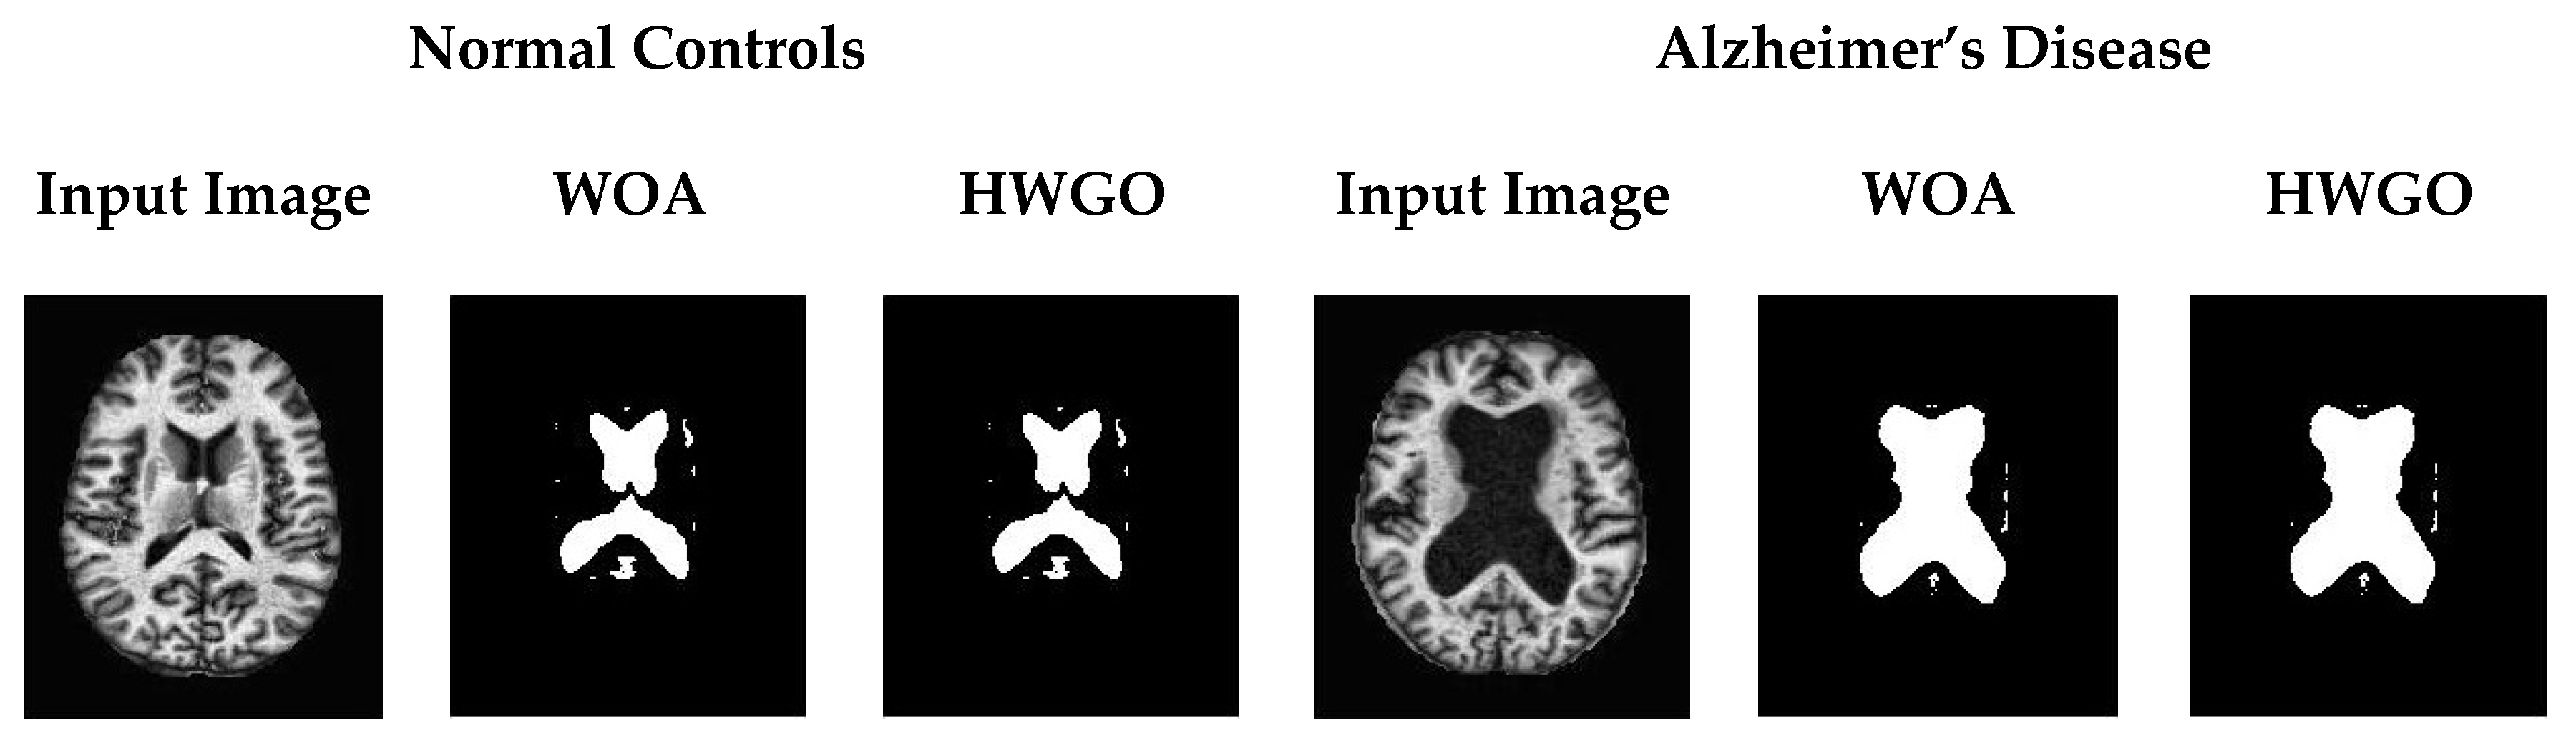
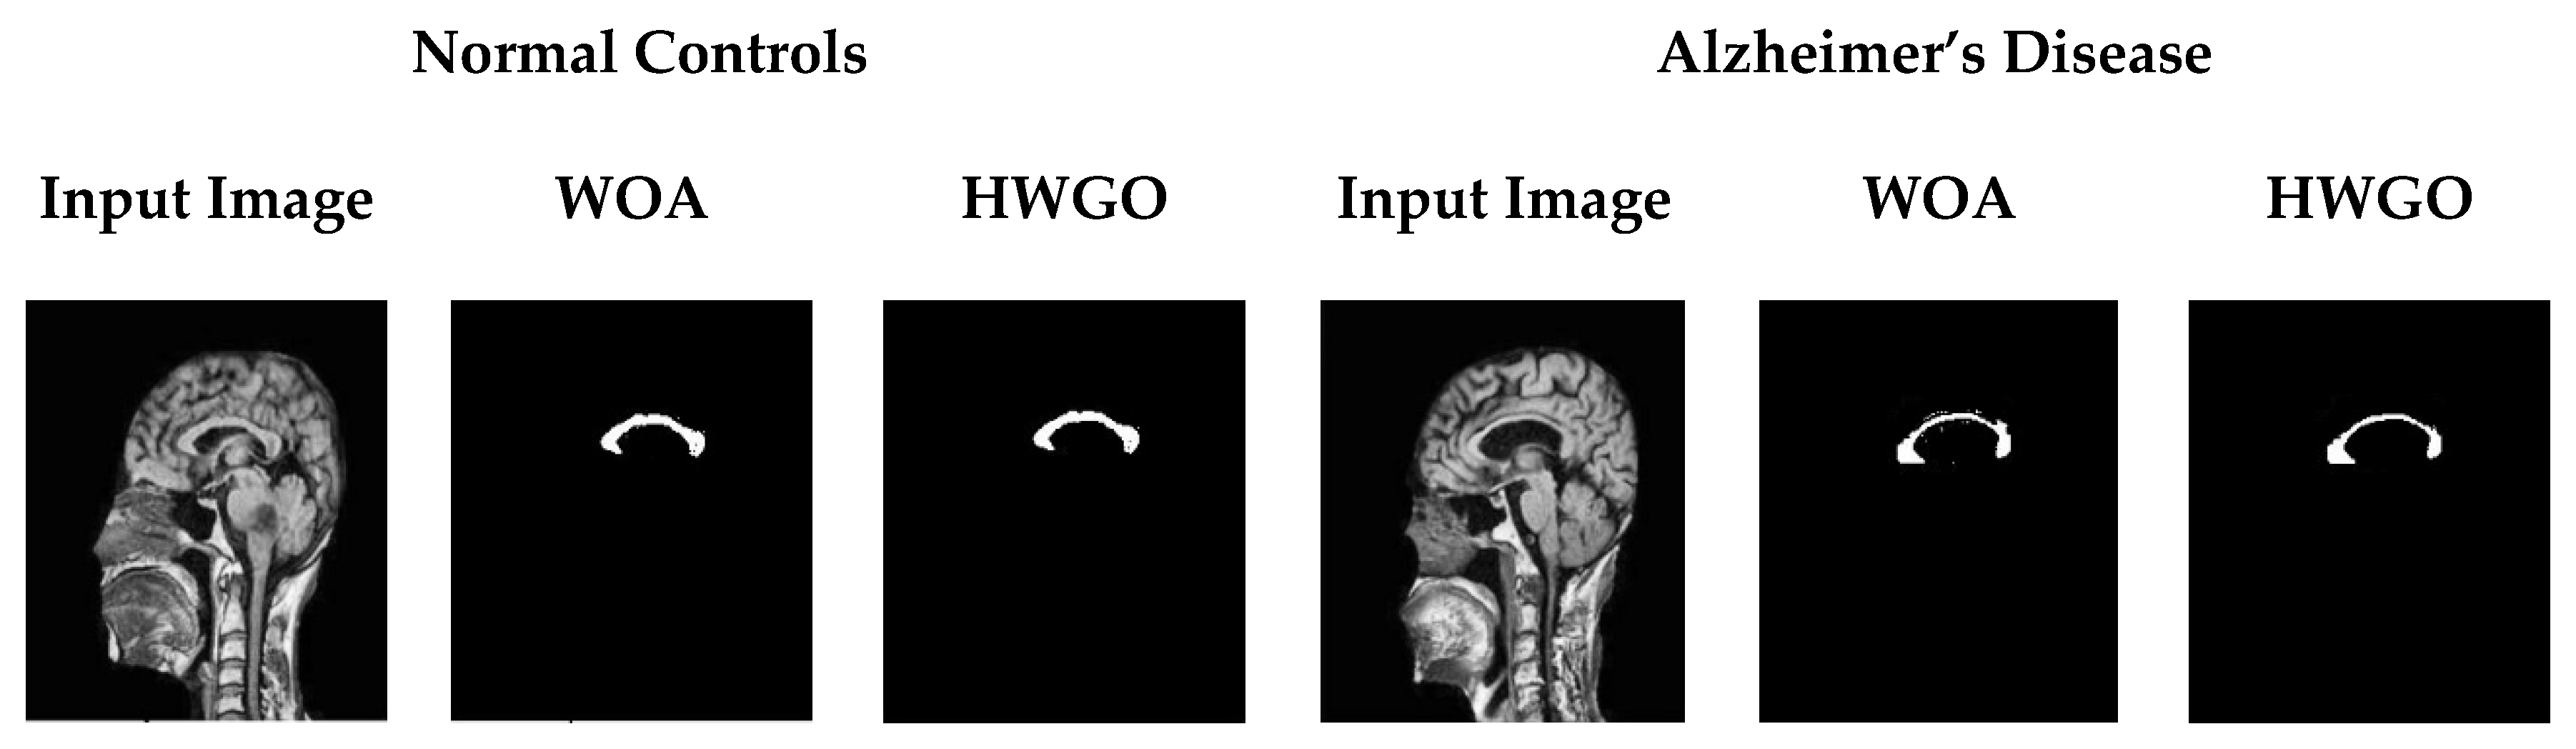
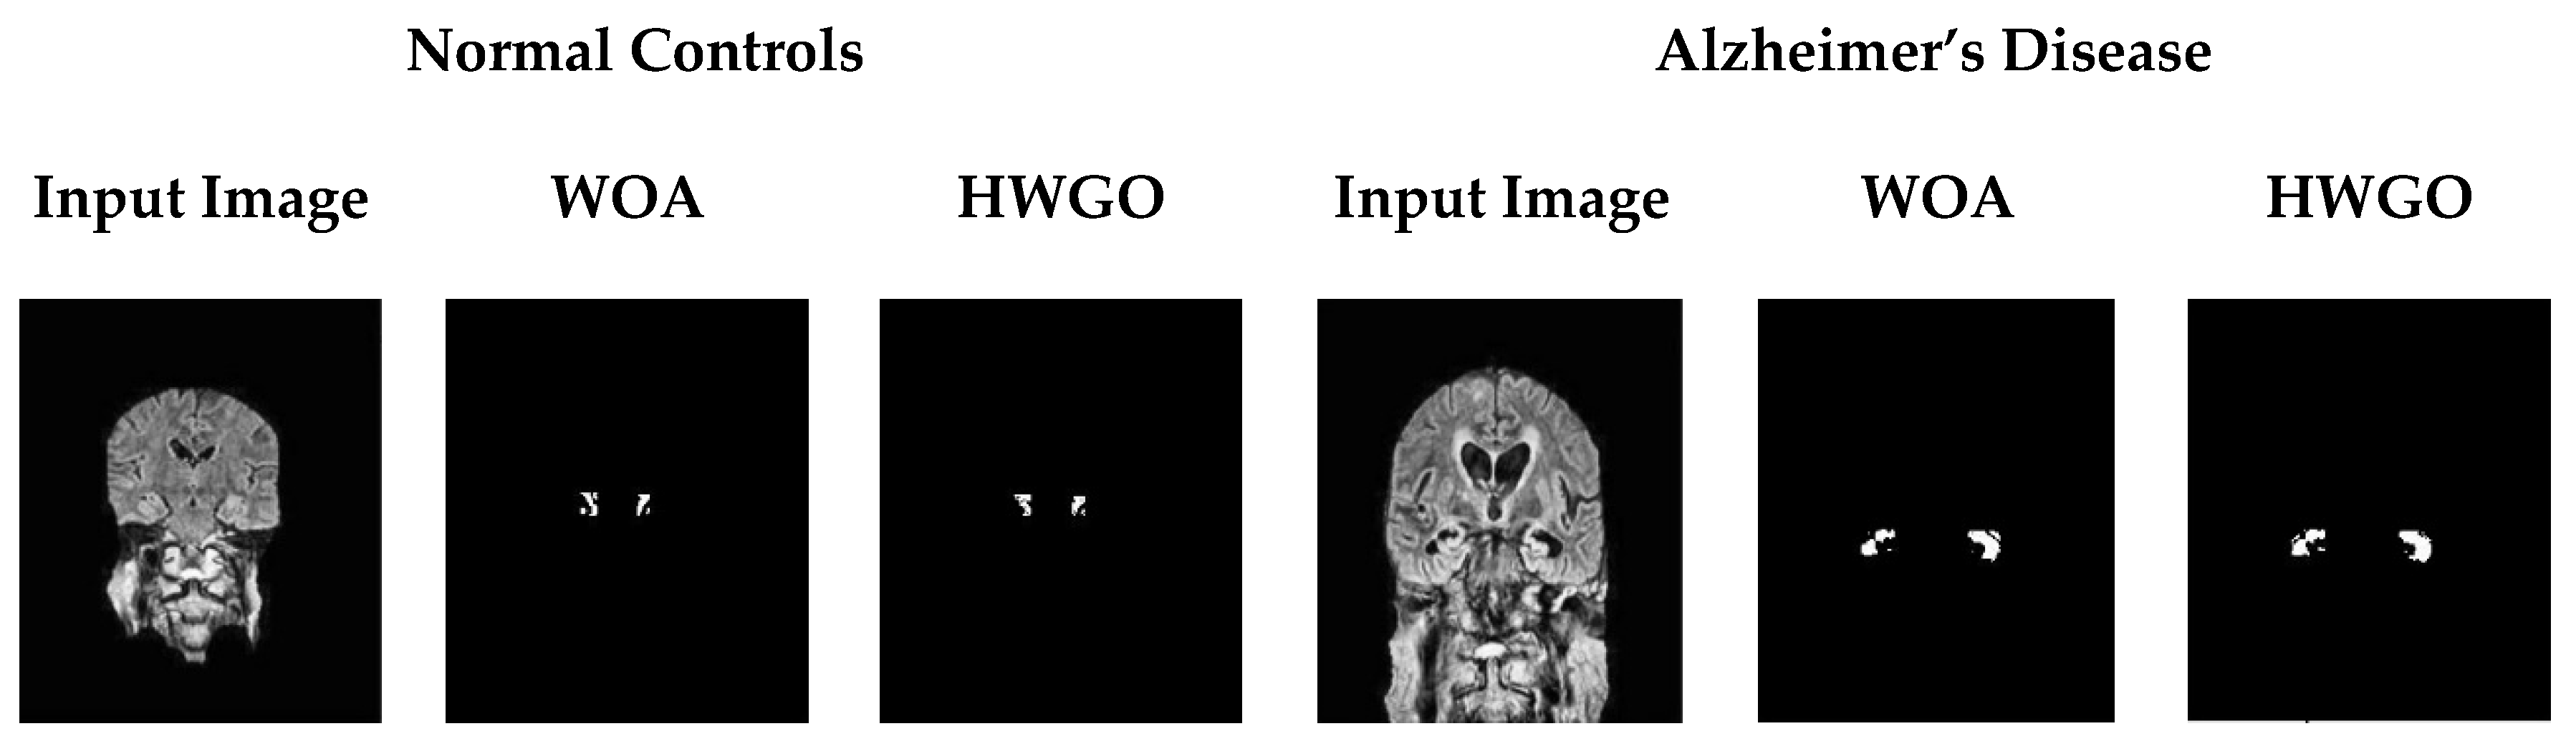
3.3. Segmentation
3.3.1. Whale Optimization Algorithm (WOA)
3.3.2. Gray Wolf Optimization (GWO)
3.3.3. Hybrid WOA and GWO
| Algorithm 1. Pseudocode |
| S1: Initial population of the SA has been generated S2: Determine the fitness function for each search agent. S3: : first best solution S4: : second best solution S5: : third best solution S6: if1 n < max no. of iterations S7: for i = 1 to no. of search agent S8: update the parameters of A, C, a, l, and p S9: if2 (p1 < 0.5) S10: if3 (|A| < 1) S11: search agent position has been updated. S12: else if3 (|A| ≥ 1) S13: random agent selection () and update the search agent position. S:14: end if3 S15: else if2 (p1 ≥ 0.5) and update the position of the search agent. S16: end if2 S17: checks the search agent position whether it has gone outside of the assigned search space. S18: positions of , , are updated. S19: update the number of iterations S20: end if S21: R |
3.3.4. Ground-Truth Validation
3.4. Classification
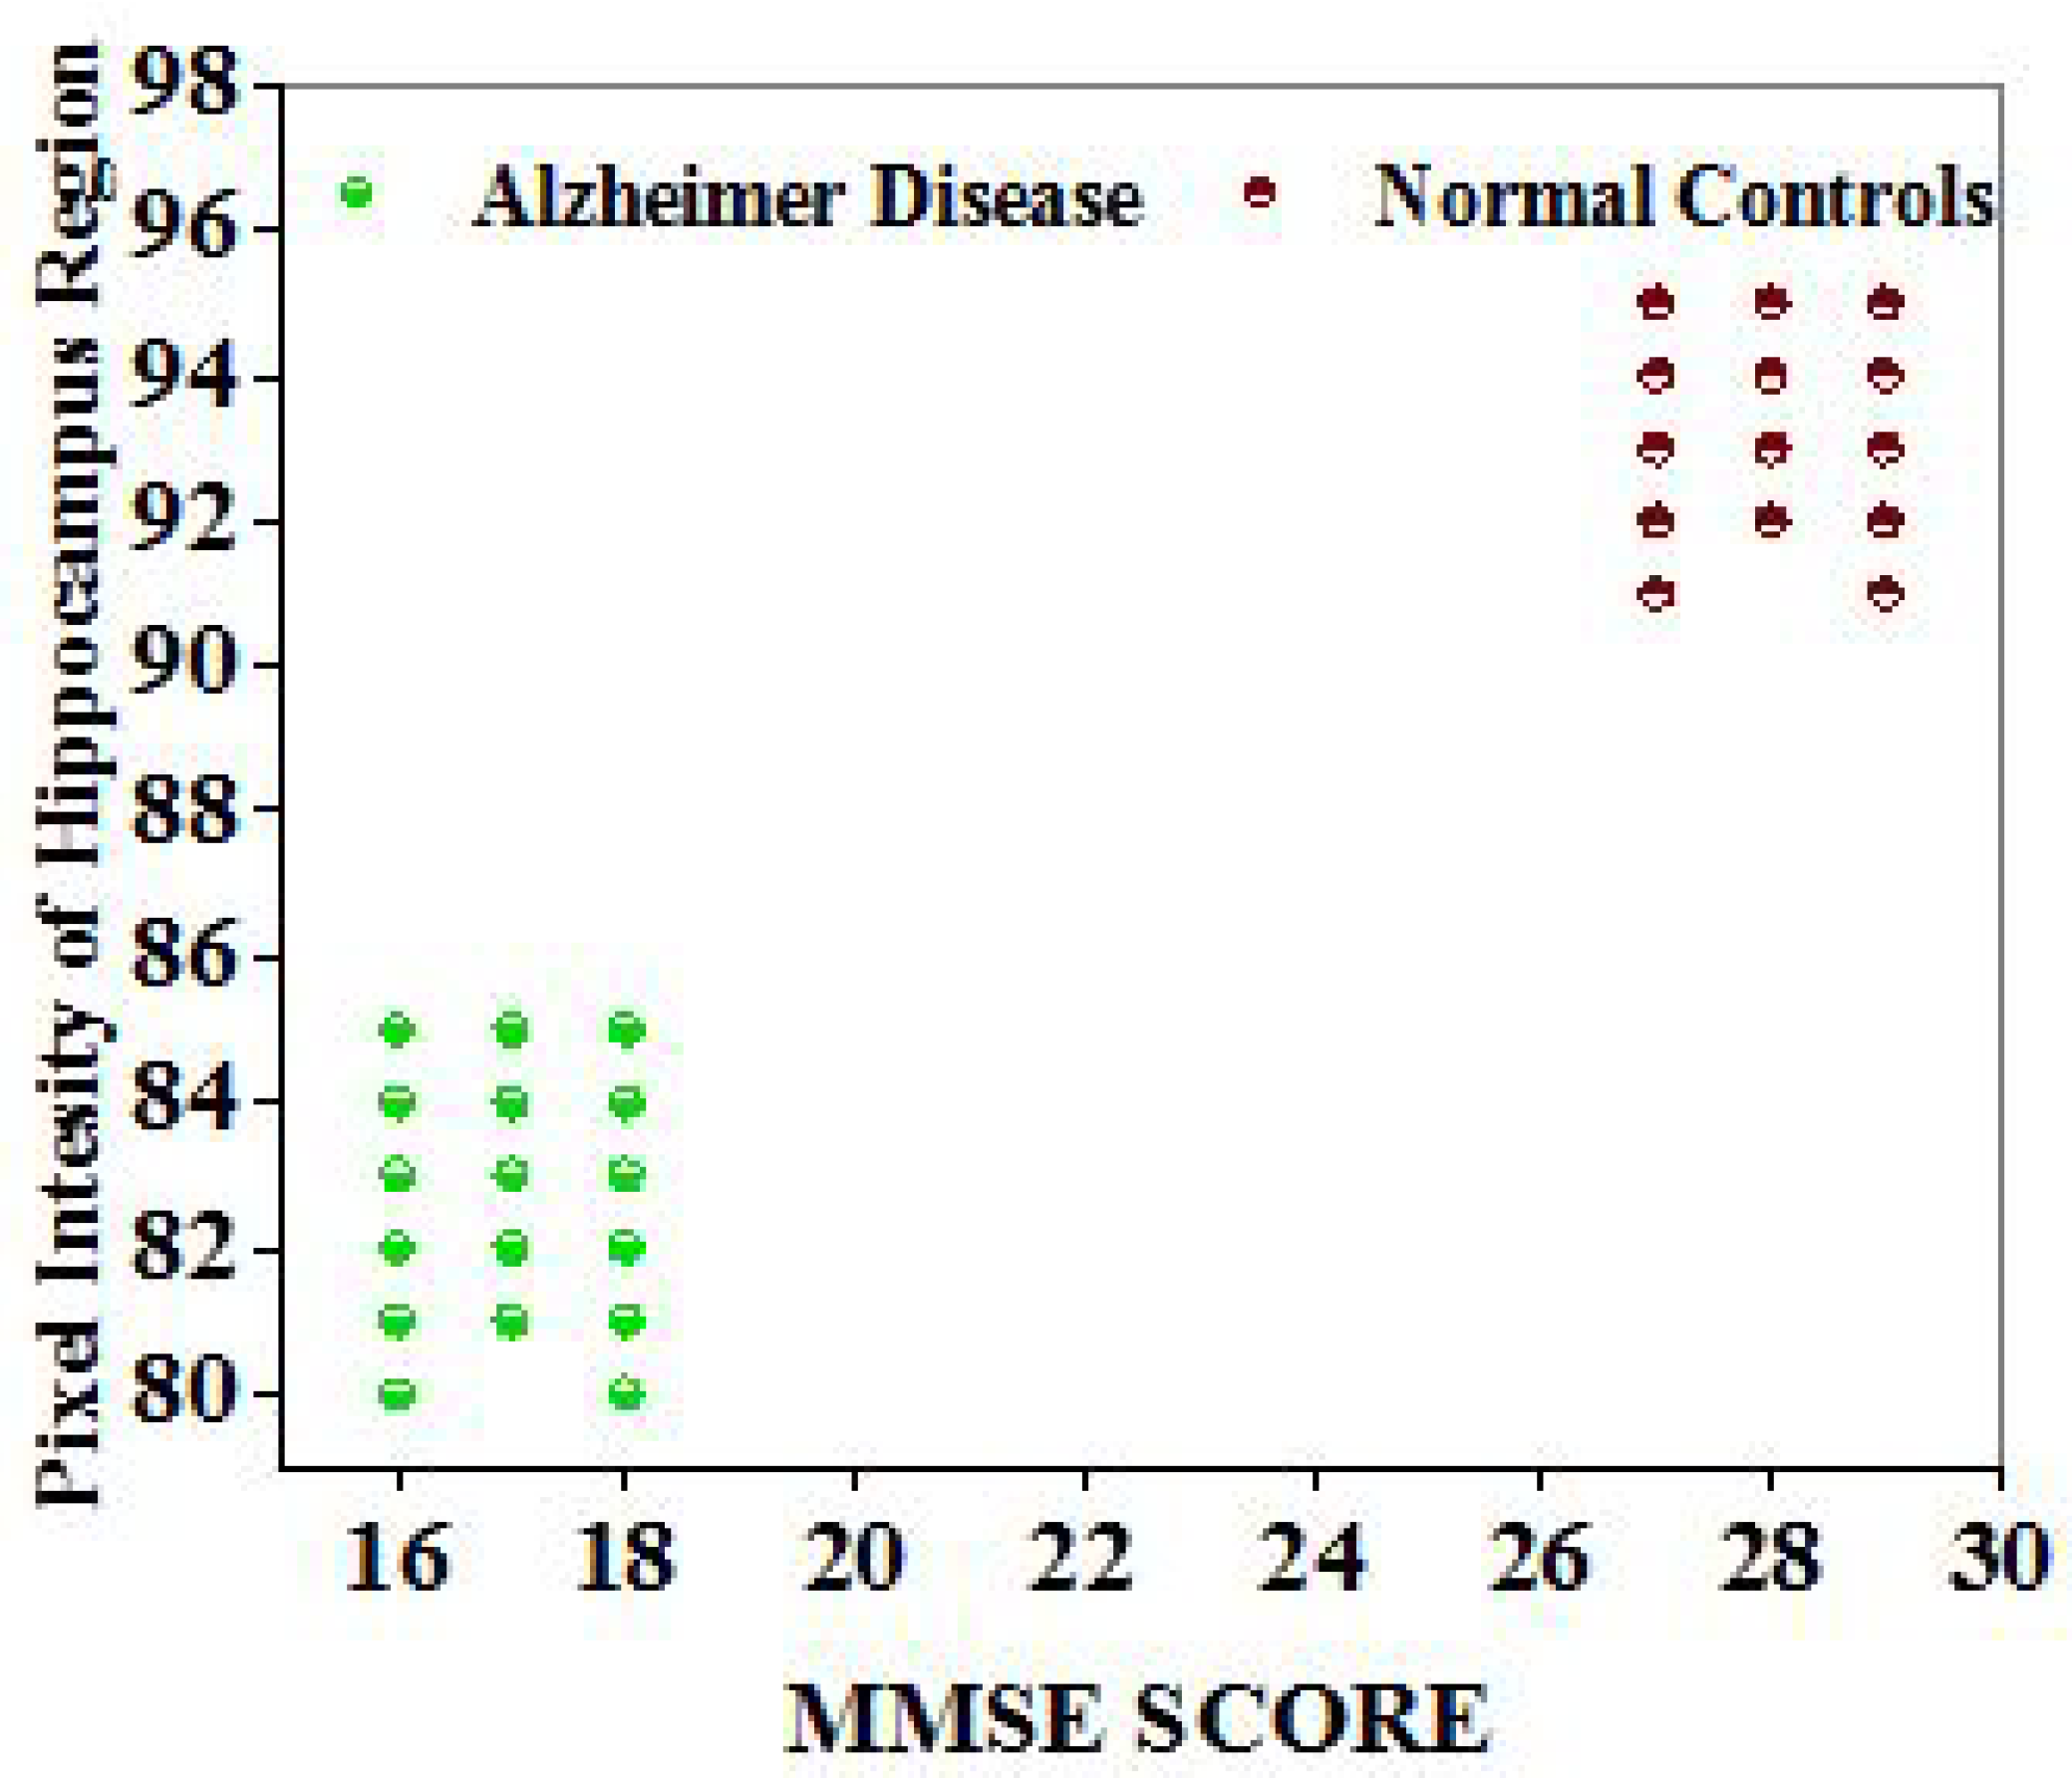
3.5. Clinical Score Validation
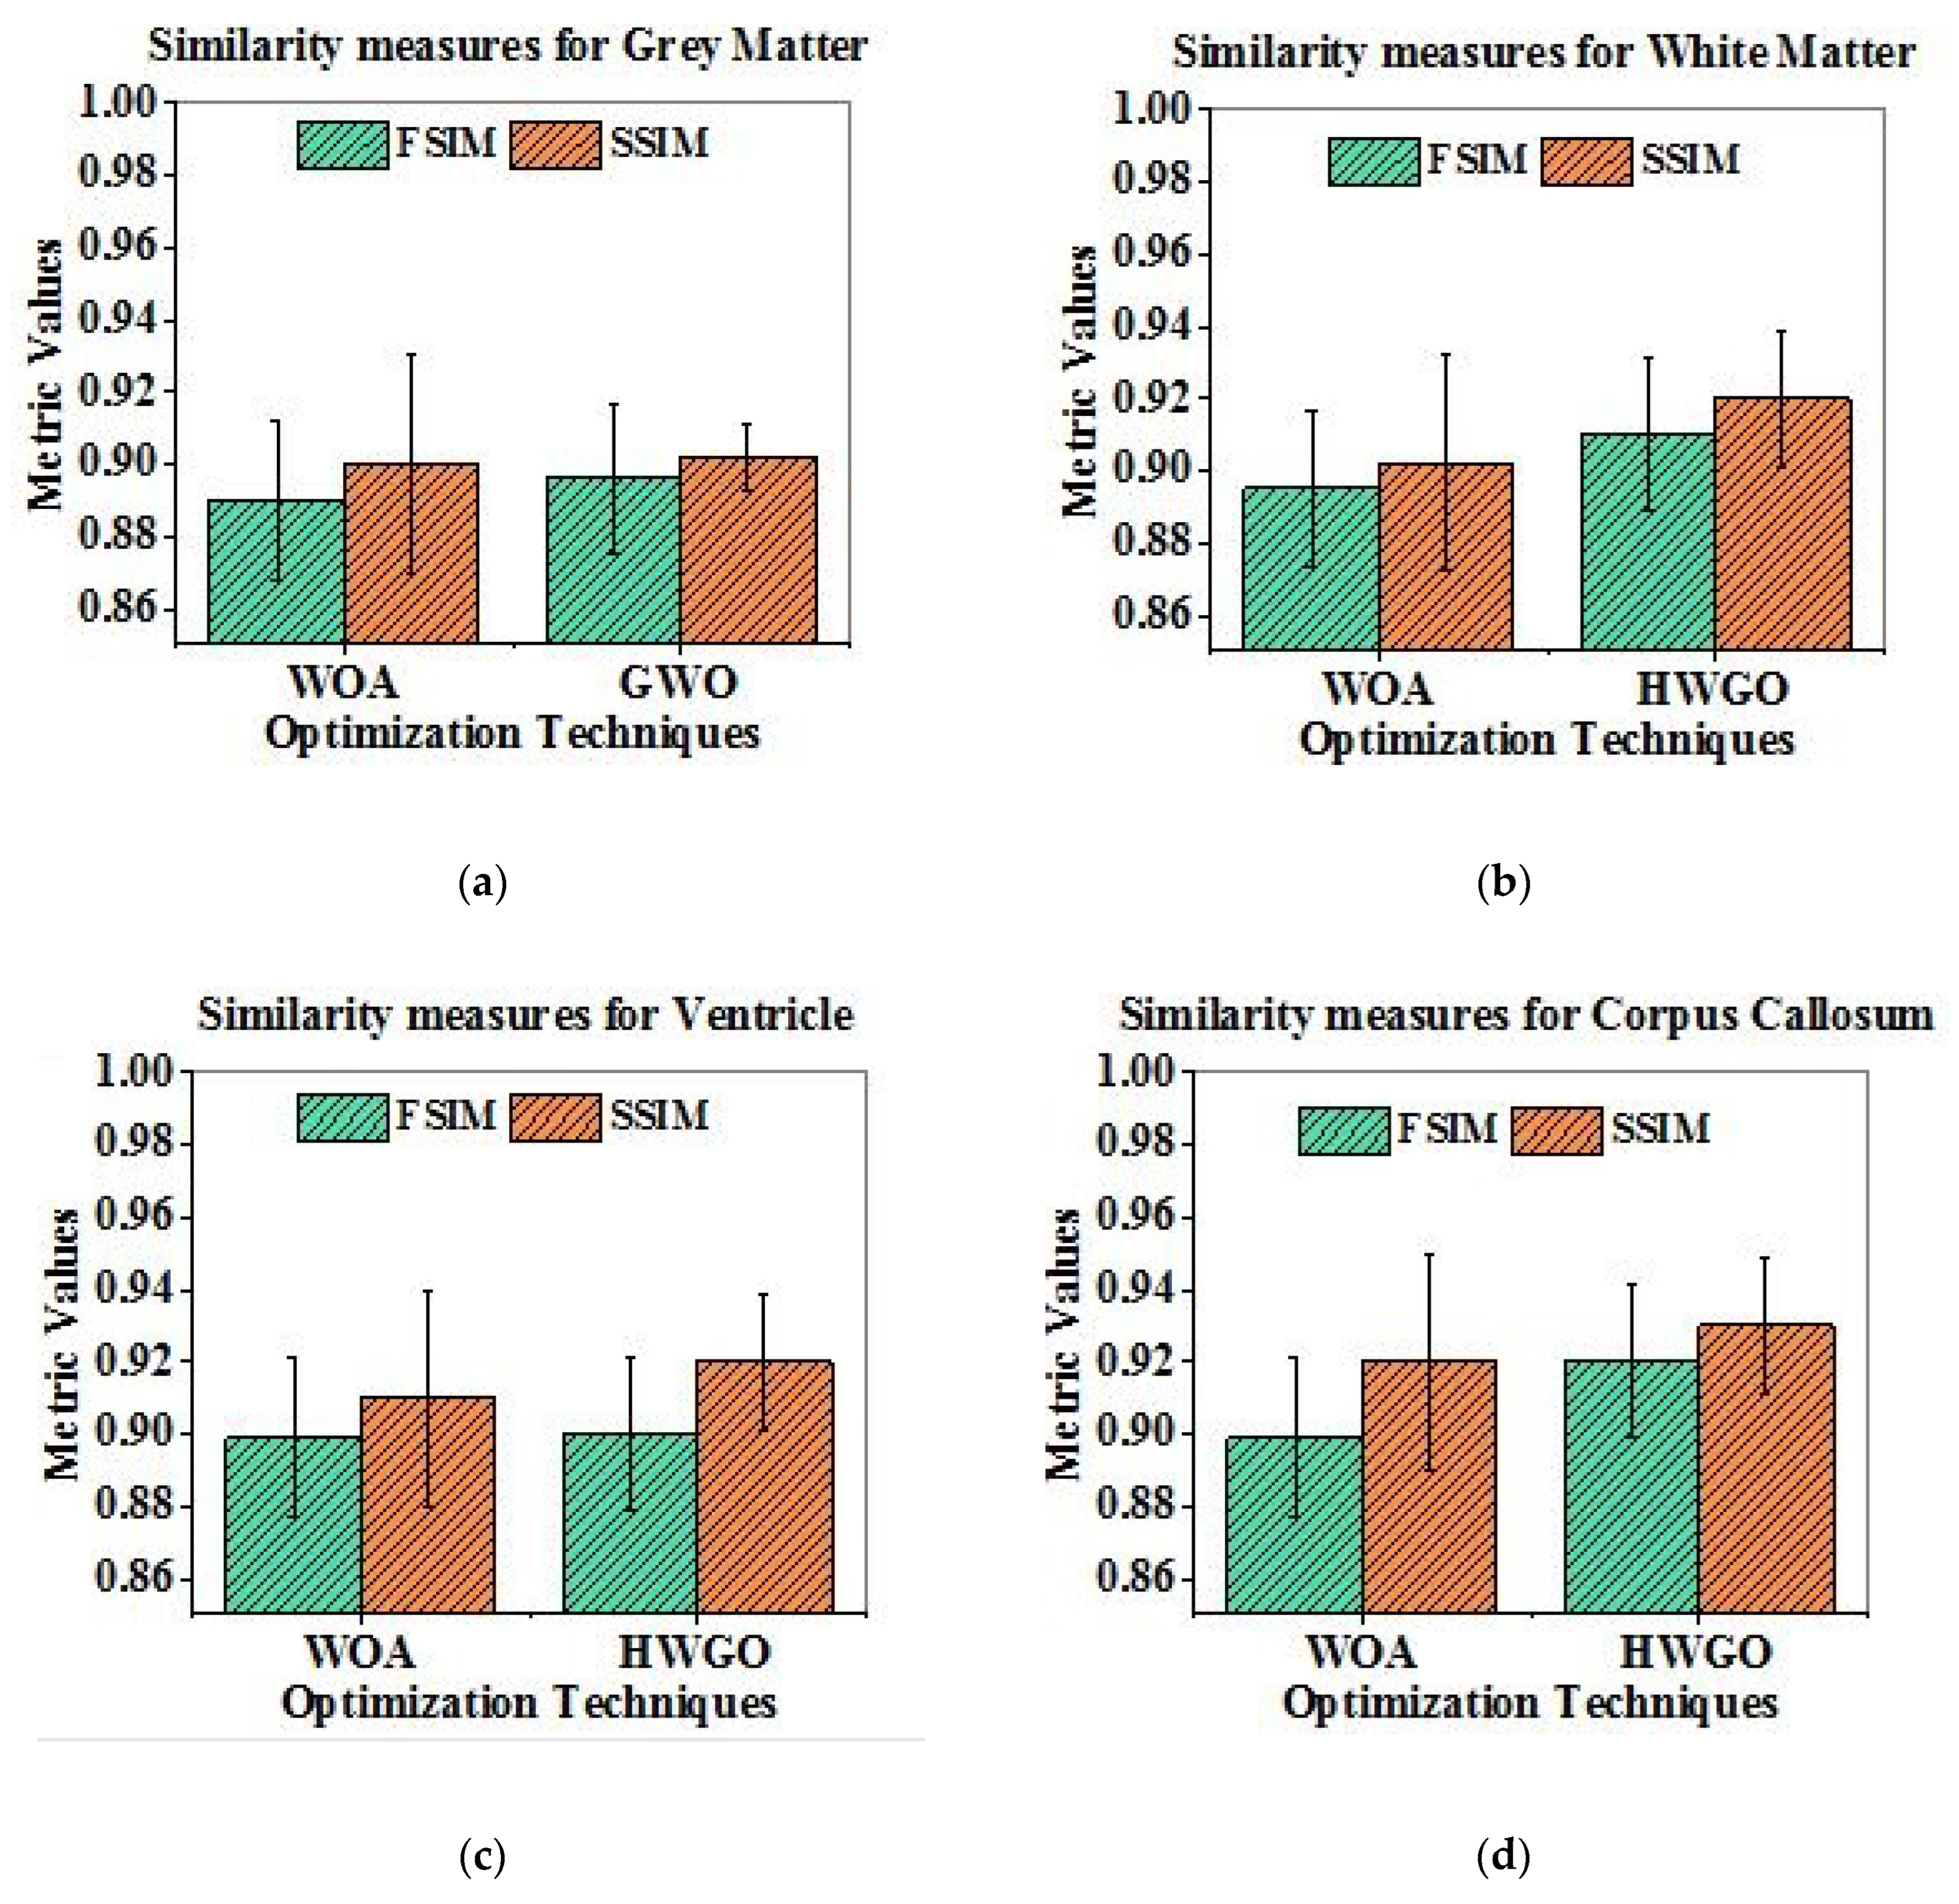
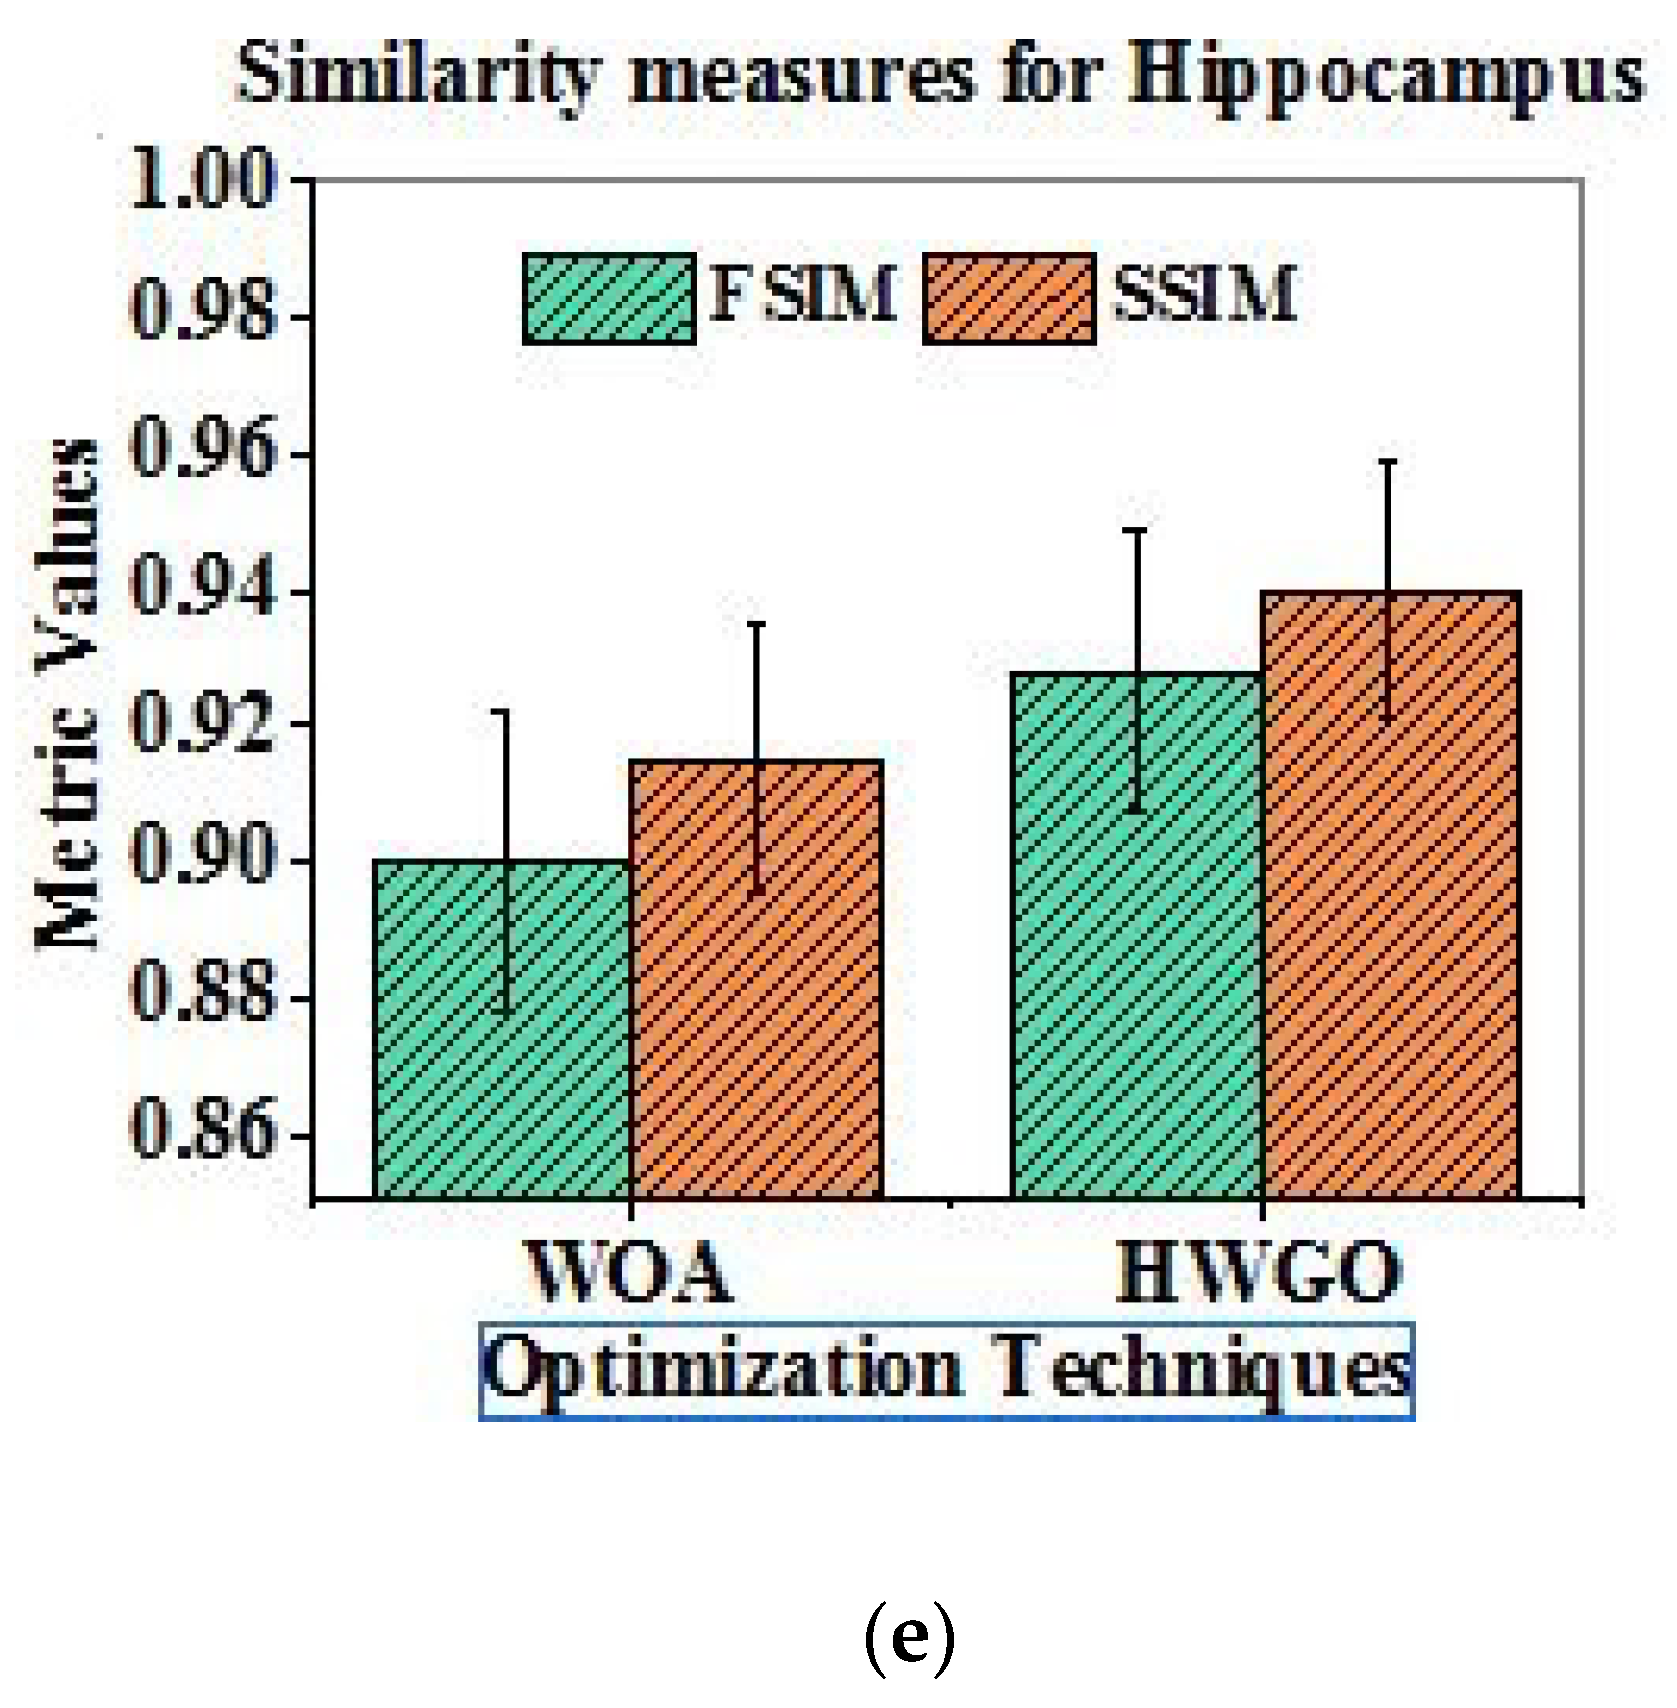
4. Results and Discussion
Implementation of Hybrid Technique
5. Conclusions
Author Contributions
Funding
Institutional Review Board Statement
Informed Consent Statement
Data Availability Statement
Conflicts of Interest
References
- Alzheimer’s Association. Available online: https://www.alz.org/in/dementia-alzheimers-en.asp (accessed on 1 March 2019).
- Dementia Australia 2002. Available online: https://www.dementia.org.au/about-dementia/types-ofdementia/alzheimers-disease (accessed on 1 July 2016).
- Brunnström, H.; Englund, E. Comparison of four neuropathological scales for Alzheimer’s disease. Clin. Neuropathol. 2011, 30, 56–69. [Google Scholar] [CrossRef]
- Serrano-Pozo, A.; Frosch, M.P.; Masliah, E.; Hyman, B.T. Neuropathological Alterations in Alzheimer Disease. Cold Spring Harb. Perspect. Med. 2011, 1, a006189. [Google Scholar] [CrossRef] [Green Version]
- Thal, D.R.; Rüb, U.; Orantes, M.; Braak, H. Phases of Aβ-deposition in the human brain and its relevance for the development of AD. Neurology 2002, 58, 1791–1800. [Google Scholar] [CrossRef]
- Arakeri, M.P.; Reddy, G.R.M. Computer-aided diagnosis system for tissue characterization of brain tumor on magnetic resonance images. Signal Image Video Process. 2013, 9, 409–425. [Google Scholar] [CrossRef]
- Bhandari, A.K.; Singh, V.K.; Kumar, A.; Singh, G.K. Cuckoo search algorithm and wind driven optimization based study of satellite image segmentation for multilevel thresholding using Kapur’s entropy. Expert Syst. Appl. 2014, 41, 3538–3560. [Google Scholar] [CrossRef]
- Holl, J.H. Genetic algorithms. Sci. Am. 1992, 267, 66–73. [Google Scholar]
- Kennedy, J.; Eberhart, R. Particle Swarm Optimization. In Proceedings of the ICNN’95—International Conference on Neural Networks, Perth, Australia, 27 November–1 December 1995; Volume 4, pp. 1942–1948. [Google Scholar] [CrossRef]
- Pham, T.X.; Siarry, P.; Oulhadj, H. An improved particle swarm optimization algorithm for MRI image segmentation. In Proceedings of the 13th Biennal International Conference on Artificial Evolution, Artificial Evolution, Paris, France, 25–27 October 2017; pp. 277–284. [Google Scholar]
- Cao, X.; Miao, J.; Xiao, Y. Medical Image Segmentation of Improved Genetic Algorithm Research Based on Dictionary Learning. World J. Eng. Technol. 2017, 5, 90–96. [Google Scholar] [CrossRef] [Green Version]
- Mirjalili, S. The Ant Lion Optimizer. Adv. Eng. Softw. 2015, 83, 80–98. [Google Scholar] [CrossRef]
- Mirjalili, S.; Lewis, A. The Whale Optimization Algorithm. Adv. Eng. Softw. 2016, 95, 51–67. [Google Scholar] [CrossRef]
- Mirjalili, S. Moth-flame optimization algorithm: A novel nature-inspired heuristic paradigm. Knowl. Based Syst. 2015, 89, 228–249. [Google Scholar] [CrossRef]
- Mirjalili, S. Dragonfly algorithm: A new meta-heuristic optimization technique for solving single-objective, discrete, and multi-objective problems. Neural Comput. Appl. 2016, 27, 1053–1073. [Google Scholar] [CrossRef]
- Dorgham, O.M.; Alweshah, M.; Ryalat, M.H.; Alshaer, J.; Khader, M.; Alkhalaileh, S. Monarch butterfly optimization algorithm for computed tomography image segmentation. Multimed. Tools Appl. 2021, 80, 30057–30090. [Google Scholar] [CrossRef]
- Lin, S.; Jia, H.; Abualigah, L.; Altalhi, M. Enhanced Slime Mould Algorithm for Multilevel Thresholding Image Segmentation Using Entropy Measures. Entropy 2021, 23, 1700. [Google Scholar] [CrossRef] [PubMed]
- Alagarsamy, S.B.; Murugan, K. Ear recognition system using adaptive approach Runge-Kutta (AARK) threshold segmentation with cart classifier. Multimed. Tools Appl. 2019, 79, 10445–10459. [Google Scholar] [CrossRef]
- Saidala, R.K.; Devarakonda, N. Improved Whale Optimization Algorithm Case Study: Clinical Data of Anaemic Pregnant Woman. In Data Engineering and Intelligent Computing; Springer: Cham, Switzerland, 2018. [Google Scholar]
- Mohsen, H.; El-Dahshan, E.-S.A.; El-Horbaty, E.-S.M.; Salem, A.-B.M. Classification using deep learning neural networks for brain tumors. Future Comput. Inform. J. 2018, 3, 68–71. [Google Scholar] [CrossRef]
- Pressman, P.; Rabinovici, G. Alzheimer’s Disease. Encycl. Neurol. Sci. 2014, 122–127. [Google Scholar] [CrossRef]
- Blennow, K.; de Leon, M.J.; Zetterberg, H. Alzheimer’s disease. Lancet 2006, 368, 387–403. [Google Scholar] [CrossRef]
- Puthiyedth, N.; Riveros, C.; Berretta, R.; Moscato, P. Identification of Differentially Expressed Genes through Integrated Study of Alzheimer’s Disease Affected Brain Regions. PLoS ONE 2016, 11, e0152342. [Google Scholar] [CrossRef] [PubMed] [Green Version]
- Frisoni, G.; Beltramello, A.; Weiss, C.; Geroldi, C.; Bianchetti, A.; Trabucchi, M. Linear measures of atrophy in mild Alzheimer disease. Am. J. Neuroradiol. 1996, 17, 913–923. [Google Scholar] [PubMed]
- Villain, N.; Desgranges, B.; Viader, F.; de la Sayette, V.; Mezenge, F.; Landeau, B.; Baron, J.-C.; Eustache, F.; Chetelat, G. Relationships between Hippocampal Atrophy, White Matter Disruption, and Gray Matter Hypometabolism in Alzheimer‘s Disease. J. Neurosci. 2008, 28, 6174–6181. [Google Scholar] [CrossRef] [PubMed]
- Singh, N.; Hachimi, H. A New Hybrid Whale Optimizer Algorithm with Mean Strategy of Grey Wolf Optimizer for Global Optimization. Math. Comput. Appl. 2018, 23, 14. [Google Scholar] [CrossRef] [Green Version]
- Passino, K.M. Biomimicry of bacterial foraging for distributed optimization and control. IEEE Control Syst. Mag. 2002, 22, 52–67. [Google Scholar] [CrossRef]
- Holland, J.H. Adaptation in Natural and Artificial Systems, 1st ed.; University of Michigan Press: Ann Arbor, MI, USA, 1975. [Google Scholar]
- Karaboga, D.; Basturk, B. On the performance of artificial bee colony (ABC) algorithm. Appl. Soft Comput. 2008, 8, 687–697. [Google Scholar] [CrossRef]
- El Aziz, M.A.; Ewees, A.A.; Hassanien, A.E. Whale Optimization Algorithm and Moth-Flame Optimization for multilevel thresholding image segmentation. Expert Syst. Appl. 2017, 83, 242–256. [Google Scholar] [CrossRef]
- Dorigo, M. Ant colony optimization. Scholarpedia 2007, 2, 1461. [Google Scholar] [CrossRef]
- Yang, X.-S.; Deb, S. Cuckoo Search via Lvy flights. In Proceedings of the 2009 World Congress Nature & Biologically Inspired Computing (NaBIC), Coimbatore, India, 9–11 December 2009; pp. 210–214. [Google Scholar] [CrossRef]
- Gharehchopogh, F.S. A comprehensive survey: Whale Optimization Algorithm and its applications. Swarm Evol. Comput. 2019, 48, 1–24. [Google Scholar] [CrossRef]
- Korashy, A.; Kamel, S.; Jurado, F.; Youssef, A.-R. Hybrid Whale Optimization Algorithm and Grey Wolf Optimizer Algorithm for Optimal Coordination of Direction Overcurrent Relays. Electr. Power Components Syst. 2019, 47, 644–658. [Google Scholar] [CrossRef]
- Xiao, Z.; Ding, Y.; Lan, T.; Zhang, C.; Luo, C.; Qin, Z. Brain MR Image Classification for Alzheimer’s Disease Diagnosis Based on Multifeature Fusion. Comput. Math. Methods Med. 2017, 2017, 1–13. [Google Scholar] [CrossRef] [Green Version]
- Jo, T.; Nho, K.; Saykin, A.J. Deep Learning in Alzheimer’s Disease: Diagnostic Classification and Prognostic Prediction Using Neuroimaging Data. Front. Aging Neurosci. 2019, 11, 220. [Google Scholar] [CrossRef] [Green Version]
- Haq, A.U.; Li, J.P.; Khan, S.; Alshara, M.A.; Alotaibi, R.M.; Mawuli, C. DACBT: Deep learning approach for classification of brain tumors using MRI data in IoT healthcare environment. Sci. Rep. 2022, 12, 15331. [Google Scholar] [CrossRef]
- Chitradevi, D.; Prabha, S. Analysis of brain sub regions using optimization techniques and deep learning method in Alzheimer disease. Appl. Soft Comput. 2019, 86, 105857. [Google Scholar] [CrossRef]
- Suresh, S.; Lal, S. An efficient cuckoo search algorithm based multilevel thresholding for segmentation of satellite images using different objective functions. Expert Syst. Appl. 2016, 58, 184–209. [Google Scholar] [CrossRef]
- Suganthi, S.; Ramakrishnan, S. Anisotropic diffusion filter based edge enhancement for segmentation of breast thermogram using level sets. Biomed. Signal Process. Control. 2014, 10, 128–136. [Google Scholar] [CrossRef]
- Vemuri, P.; Jones, D.T.; Jr, C.R.J. Resting state functional MRI in Alzheimer’s Disease. Alzheimer’s Res. Ther. 2012, 4, 1–9. [Google Scholar] [CrossRef] [PubMed]
- Cao, L.; Li, L.; Zheng, J.; Fan, X.; Yin, F.; Shen, H.; Zhang, J. Multi-task neural networks for joint hippocampus segmentation and clinical score regression. Multimed. Tools Appl. 2018, 77, 29669–29686. [Google Scholar] [CrossRef]
- Prabha, S.; Sankaran, K.; Chitradevi, D. Efficient optimization based thresholding technique for analysis of alzheimer MRIs. Int. J. Neurosci. 2021, 133, 201–214. [Google Scholar] [CrossRef]
- Chitradevi, D.; Prabha, S.; Prabhu, A.D. Diagnosis of Alzheimer disease in MR brain images using optimization techniques. Neural Comput. Appl. 2020, 33, 223–237. [Google Scholar] [CrossRef]
- Chitradevi, D.; Prabha, S. Analysis of Alzheimer Disease using Optimization Techniques. In Proceedings of the 2020 Sixth International Conference on Bio Signals, Images, and Instrumentation (ICBSII), Chennai, India, 27–28 February 2020; pp. 1–5. [Google Scholar] [CrossRef]
- Chitradevi, D.; Prabha, S.; Sankaran, K. Brain Hemisphere Analysis Using Genetic Algorithm and Fuzzy Clustering in Alzheimer Disease. In Proceedings of the 2018 International Conference on Communication and Signal Processing (ICCSP), Chennai, India, 3–5 April 2018; pp. 901–905. [Google Scholar] [CrossRef]
- Pang, S.; Jiang, J.; Lu, Z.; Li, X.; Yang, W.; Huang, M.; Zhang, Y.; Feng, Y.; Huang, W.; Feng, Q. Hippocampus Segmentation Based on Local Linear Mapping. Sci. Rep. 2017, 7, 45501. [Google Scholar] [CrossRef] [Green Version]
- Singh, C.; Bala, A. A DCT-based local and non-local fuzzy C-means algorithm for segmentation of brain magnetic resonance images. Appl. Soft Comput. 2018, 68, 447–457. [Google Scholar] [CrossRef]
- Meng, L.; Xiang, J. Brain Network Analysis and Classification Based on Convolutional Neural Network. Front. Comput. Neurosci. 2018, 12, 95. [Google Scholar] [CrossRef] [Green Version]
- Ždímalová, M.; Chatterjee, A.; Kosnáčová, H.; Ghosh, M.; Obaidullah, S.M.; Kopáni, M.; Kosnáč, D. Various Approaches to the Quantitative Evaluation of Biological and Medical Data Using Mathematical Models. Symmetry 2021, 14, 7. [Google Scholar] [CrossRef]


| Particulars | NC | AD |
|---|---|---|
| Number of datasets | 100 | 100 |
| Sex (M/F) | 73/27 | 68/32 |
| Age group | 60.5 ± 5.5 | 67.5 ± 7.5 |
| Clinical Dementia Rate (CDR) | 0 | 1 and 2 |
| Mini-Mental Score Examination value | 26 ± 3.5 | 16 ± 2.5 |
| Parameters | WOA | HWGO | ||||||||
|---|---|---|---|---|---|---|---|---|---|---|
| Ven | GM | WM | CC | HC | Ven | GM | WM | CC | HC | |
| No. of SAs | 100 | 100 | 100 | 100 | 100 | 100 | 100 | 100 | 100 | 100 |
| I | 100 | 100 | 100 | 100 | 100 | 100 | 100 | 100 | 100 | 100 |
| T1 | 8 | 5 | 5 | 10 | 13 | 8 | 5 | 5 | 10 | 13 |
| Statistical Measures | WOA | HWGO | WOA | HWGO | WOA | HWGO | WOA | HWGO | WOA | HWGO |
|---|---|---|---|---|---|---|---|---|---|---|
| GM | WM | Ventricle | CC | HC | ||||||
| Accuracy | 0.88 | 0.91 | 0.89 | 0.91 | 0.89 | 0.91 | 0.912 | 0.934 | 0.92 | 0.94 |
| Sensitivity | 0.89 | 0.90 | 0.89 | 0.90 | 0.89 | 0.90 | 0.90 | 0.915 | 0.90 | 0.93 |
| Specificity | 0.88 | 0.90 | 0.88 | 0.90 | 0.88 | 0.90 | 0.91 | 0.91 | 0.91 | 0.91 |
| Optimization Algorithm | WOA | GWO | HWGO |
|---|---|---|---|
| Number of iterations to attain optimal solutions/maximum number of iterations | 82/100 | 62/100 | 75/100 |
| Time complexity | 30.425 | 23.782 | 26.782 |
Disclaimer/Publisher’s Note: The statements, opinions and data contained in all publications are solely those of the individual author(s) and contributor(s) and not of MDPI and/or the editor(s). MDPI and/or the editor(s) disclaim responsibility for any injury to people or property resulting from any ideas, methods, instructions or products referred to in the content. |
© 2023 by the authors. Licensee MDPI, Basel, Switzerland. This article is an open access article distributed under the terms and conditions of the Creative Commons Attribution (CC BY) license (https://creativecommons.org/licenses/by/4.0/).
Share and Cite
Dhakhinamoorthy, C.; Mani, S.K.; Mathivanan, S.K.; Mohan, S.; Jayagopal, P.; Mallik, S.; Qin, H. Hybrid Whale and Gray Wolf Deep Learning Optimization Algorithm for Prediction of Alzheimer’s Disease. Mathematics 2023, 11, 1136. https://doi.org/10.3390/math11051136
Dhakhinamoorthy C, Mani SK, Mathivanan SK, Mohan S, Jayagopal P, Mallik S, Qin H. Hybrid Whale and Gray Wolf Deep Learning Optimization Algorithm for Prediction of Alzheimer’s Disease. Mathematics. 2023; 11(5):1136. https://doi.org/10.3390/math11051136
Chicago/Turabian StyleDhakhinamoorthy, Chitradevi, Sathish Kumar Mani, Sandeep Kumar Mathivanan, Senthilkumar Mohan, Prabhu Jayagopal, Saurav Mallik, and Hong Qin. 2023. "Hybrid Whale and Gray Wolf Deep Learning Optimization Algorithm for Prediction of Alzheimer’s Disease" Mathematics 11, no. 5: 1136. https://doi.org/10.3390/math11051136