Article

The Study on Mathematical Simulation and Analysis of the Molecular Discrete System of the Sulfurated Eucommia Ulmoides Gum

1
College of Transportation Engineering, Dalian Maritime University, Dalian 116026, China
2
School of Transportation Engineering, Shenyang Jianzhu University, Shenyang 110168, China
3
College of Communication, Tonghua Normal University, Tonghua 134002, China
*
Author to whom correspondence should be addressed.
Mathematics 2023, 11(4), 964; https://doi.org/10.3390/math11040964
Submission received: 6 December 2022 / Revised: 7 February 2023 / Accepted: 8 February 2023 / Published: 13 February 2023
(This article belongs to the Topic Mathematical Modeling of Complex Granular Systems)
(This article belongs to the Section Engineering Mathematics)

Abstract

:
In recent years, sulfurized eucommia ulmoides gum (SEUG) has been used and developed in many fields due to its good properties. The cross-linking degree is crucial to the performance of SEUG. In order to explore the effect of the cross-linking degree on SEUG in depth, this paper combines macroscopic and microscopic techniques, and molecular discrete system models of EUG and SEUG with different cross-linking degrees are calculated by molecular dynamics simulation, and the density and solubility parameters of EUG, glass transition temperature, radial distribution function and mechanical property parameters of SEUG are derived. The results show that (1) the suitable minimum degree of polymerization of EUG is N = 30; (2) the degree of cross-linking has a significant effect on the intramolecular radial distribution of SEUG, but it has a small effect on the intermolecular radial distribution of SEUG; (3) the degree of cross-linking of SEUG should be controlled to be between 40% and 80% because the mechanical properties of SEUG, namely the bulk modulus, shear modulus, elastic modulus, Poisson’s ratio, Corsi pressure, are the best ones. Therefore, the conclusions of this study provide a theoretical basis for engineering practices.
MSC:
97M50

1. Introduction

Due to the urgent need for non-fossil resources, countries have promoted the development of biomass rubber materials to an important position. Many rubber manufacturers and tire manufacturers around the world are actively promoting new resource-intensive and eco-environmentally friendly bio-rubber and bio-based rubber monomers [1]. Consequently, with this information, China also currently regards EUG as the second most important rubber resource and an important sustainable green strategic resource, which has encouraged the progression of the scientific research for its active development. As is widely known, EUG is a natural polymer material that has the same chemical formula as that of natural rubber (NR), both of which are-(C5H8) n-, but they have different molecular structures. The molecular structure expression of NR is cis-1,4-polyisoprene, as shown in Figure 1a, and the molecular structure expression of EUG is trans-1,4-polyisoprene, as shown in Figure 1b. The properties of the two materials are absolutely different due to their different molecular chain configurations. Therefore, natural rubber is an outstanding elastomer at room temperature, while EUG is a hard plastic at room temperature [2]. So, the promotion and application of EUG is limited to the early stage of its development. However, in recent years, the boundaries of EUG application fields have been continuously broadened by multiple explorations by academics.
In the early 1980s, Professor Ruifang Yan of CAS prepared EUG elastomeric rubber successfully by the application of synthetic trans-polyisoprene and a high-temperature compounding process. The results showed that the molecular structure of EUG has a double bond structure and is rich in flexible chains and molecular chain orderliness, and it presents a unique rubber–plastic duality. So these properties could be used to open the double bond structure through vulcanization, and the chemical cross-linking points could be formed by using chemical bond cross-linking. Hence, the crystallization of EUG molecules was suppressed, and elasticity was obtained because of the increasing network structure formed through the action of cross-linking points under the condition of continuous vulcanization. After understanding the mechanism of EUG vulcanization, Professor Ruifang Yan’s team continuously improved and optimized the method of extracting and SEUG and obtained three materials with different degrees of cross-linking and different properties by controlling the critical cross-linking degree, which were: thermoplastic elastomer materials without cross-linking, thermoplastic materials with a low cross-linking degree, and elastomer materials with an overly critical cross-linking degree [2]. Based on Yan’s research, Li et al. continued the study and found that SEUG could replace part of the SBS modifier to become a promising asphalt modifier with an excellent performance in market applications [3,4,5,6,7]. However, Mengyu Zheng found that vulcanization should be moderated, the distance between vulcanization cross-linking points would be too short as it is over-vulcanized, and the formed cross-linking network structure would restrict the free movement of molecular chains, and so, SEUG would show the characteristics of excessive rigidity, which is also not beneficial for producing modified asphalt using SEUG [8]. Therefore, it is very important to choose the degree of vulcanization of SEUG reasonably. Professor Fang Qinghong’s team studied the amount of sulfurizing agent added into EUG, and the results showed that the cross-linking density of EUG decreased slowly with the increase in sulfur when the amount of sulfur was less than 1 phr; when the amount of sulfur was more than 1 phr, the cross-linking density decreased more significantly [9].
In summary, it can be seen that there have been lots of experimental studies on the vulcanization of EUG, and the results are extremely good. Though, the studies on EUG from the microscopic perspective are still lacking for the time being, and the adoption of MS simulation by EUG studies is still a relatively novel practice. Therefore, this paper aims to use MS simulations to examine the effects of different degrees of vulcanization on the molecular structure and mechanical properties of SEUG from a microscopic perspective. Additionally, we also expected to make a certain theoretical contribution to the subsequent development of SEUG as a new bio-based asphalt modifier.

2. Theoretical Basis

Molecular dynamics (MD) simulation is a method based on the combination of classical mechanics and mathematical simulation calculations to study the properties of discrete systems composed of unit molecules or molecular systems, thus providing an important research method to visualize the physical properties of complex phenomena and materials. The MD simulation method was first proposed by Alder and Wainwright [10] in the 1950s to solve the Newton‘s equations of motion of multi-particle systems. After more than half a century of development, it has become a main theoretical method used to study the properties and action principles of microscopic materials.

2.1. Basic Principles

2.1.1. Equations of Motion

Molecular dynamics is based on Newtonian classical mechanics and studies the thermodynamic and kinetic properties of materials from a microscopic point of view by simulating the interactions of microscopic discrete systems composed of populations of atoms or molecules at different moments. The molecular dynamics approach package is based on two assumptions, respectively [11,12]: (1) all of the particle motion processes follow Newton’s classical laws of mechanics; (2) particle motion conforms to the superposition principle and uses Newton’s equations of motion to describe the particle processes, as shown in Equations (1) and (2) [13,14]:
a i = d 2 r i d t 2 = F i m ( i = 1 , 2 ,   ,   n )  
F i = U r i
where F i is the combined force on the i t h particle; r i is the coordinate vector of the particle; m i is the mass of the particle; a i denotes the velocity and acceleration of the particle. U denotes the potential energy of the particle, which is calculated by the potential function.
The use of a potential function to approximate the forces and potentials between atomic pairs greatly simplifies the calculation, allowing the calculation of EUG discrete systems in the condensed state on a larger scale with realistic cooling rates. However, it cannot be implemented without determining distinct potential parameters for different systems.

2.1.2. Boundary Conditions

For a typical polymer material such as EUG, the position of each particle can be found from the initial density distribution n(r) by rounding, and the initial rate can be chosen at random using the Maxwell–Boltzmann rate distribution function, which is limited by the computer’s processing power. During the molecular dynamics simulation, a certain number of particles must be chosen to represent the whole system. Because the model’s ergodicity [15] and boundary effects are not perfect, we use periodic boundary conditions to make it more similar to the real world.
The periodic boundary conditions for the two-dimensional box computing system are depicted in Figure 2a,b, where the box in Figure 2a represents the basic cell, and the surrounding box represents its mirror cell, which has the same organization and motion as those of the basic cell. When a particle overflow box exists, the corresponding mirror particles will enter in the opposite direction, maintaining a constant number of particles in the box. As illustrated in Figure 2, the intermolecular force is calculated using the recent mirror image approach (b). The intermolecular force is obtained from the nearest mirror molecule. The truncated radius method is used to determine the resultant non-bonded remote active force, where the original cell size is greater than twice the truncated radius.

2.1.3. Basic Solution of Motion Equation

When numerical simulations of material systems are performed using the MD method, it is difficult to obtain an analytical solution to the interaction forces between the particles due to their complexity; therefore, finite difference methods are typically used to obtain all of the information regarding their motion and mechanics [14]. Typically, the following algorithms are used:
(1)
Verlet’s algorithm: Using the positions of the first two moments of the particle, Taylor’s formula calculates the position of the following moment. Although this method decreases the complexity of the calculations, the results are inaccurate. In Equation (3), the specific expressions are given [16]:
r i ( t + δ t ) = 2 r i ( t ) r i ( t δ t ) + δ t 2 F i ( t ) m  
where ri(t), t denotes the position and time of particle i, respectively.
(2)
The Velocity Verlet algorithm, which is based on the Verlet algorithm with appropriate improvements to give the position, velocity, and acceleration rate of the particles, while also having the advantages of a greater computational accuracy and a moderate computational volume is now more widely used, and its expression is given by Equations (4) and (5) [17,18].
r i ( t + δ t ) = r i ( t ) + v ( t ) δ t + F ( t ) 2 m δ t 2  
v i ( t + δ t ) = d r i d t = v ( t ) + 1 2 m F ( t ) + F ( t + δ t ) δ t

2.2. Force Field

The force field reflects the interaction between the system’s particles, which is also known as the potential function, and determines the precision of the simulation results. The COMPASS force field [19] in Materials Studio is currently a more comprehensive molecular force field. Due to the fact that the COMPASS force field is the first ab initio force field comprised condensed state properties, various isolated molecules, and empirical data, this force field can accurately predict the structural, vibrational, and thermophysical properties of isolated or condensed state systems in a higher temperature and pressure range, and its applicability extends to nearly all of the covalent molecular systems. On the basis of the COMPASS force field, the COMPASS II force field was further developed as the computer processing power increased [20]. COMPASS force fields and COMPASS II force fields are widely used in the field of materials science due to their generalizability and precision.

2.3. Ensemble

Ensemble is a large collection of systems with constant macroscopic conditions and identical properties, each in a different microscopic state and independent of one another; it is also known as the statistical ensemble. Equilibrium MD simulations must be conducted under a particular ensemble [17,21,22]. The canonical ensemble (NVT) and isothermal–isobaric ensemble (NPT) are frequently used for molecular dynamics simulation of EUG.
(1)
In the canonical ensemble (NVT), the total momentum and the number of particles are kept constant. This is analogous to placing an isolated isoenergetic system in a virtual constant temperature, maintaining both the system and the heat source at a constant temperature, and calibrating the system’s kinetic energy using the particle rate.
(2)
Isothermal–isobaric ensemble (NPT): The number of particles N, the pressure P, and the temperature T are kept constant in this system. However, fluctuations in its system energy E and system volume V are possible.
System synthesis temperature control methods include the Berendsen heat bath and the Nose–Hoover heat bath, among others; system synthesis pressure control methods include the Berendsen method, the Anderson method, the Parrinello–Rahman method, and others. In practical applications, the appropriate system synthesis must be selected based on the simulation systems in use. Typically, two or more system integrations are used for dulcimer systems.

2.4. Simulation Programs

The specific simulation process is shown in Figure 3. After more than half a century of development, now, it has become a major theoretical approach to study the properties and principles of the actions of microscopic materials, and the flow of the molecular dynamics simulations is illustrated in Figure 3.
As can be seen from Figure 3, the specific process of molecular dynamics simulation is to establish the equations of the motion (the potential energy function and the force field) of molecules and atoms according to the given boundary conditions and set the initial conditions (ensemble, temperature, pressure, boundary conditions, etc.) and use the numerical solution of Newton’s equations of motion to obtain the trajectory of the particles, and then compare the microscopic physical quantities (particle coordinates, velocity, energy, etc.) with the macroscopic ones. The purpose of studying the macroscopic properties of materials from the microscopic point of view is achieved by comparing the relationship between the microscopic physical quantities (particle coordinates, velocity, energy, etc.) and the macroscopic measurements (temperature, pressure, specific heat capacity, modulus of elasticity, etc.). Currently, molecular dynamics simulation methods are widely applied in many fields of materials science because they greatly simplify the workload of the experiments.

3. Construction of MS Model of EUG

The microstructure of polymer materials is closely related to their macroscopic properties, and the effects of adjusting the microstructure on the macroscopic properties can be studied. What is the microstructure of EUG, and how does it influence its macroscopic properties? How does vulcanization affect the microstructure of EUG, and how does it influence the macroscopic properties of vulcanized gum? Molecular dynamic simulation was used to investigate this topic in depth, and this is presented in this paper.

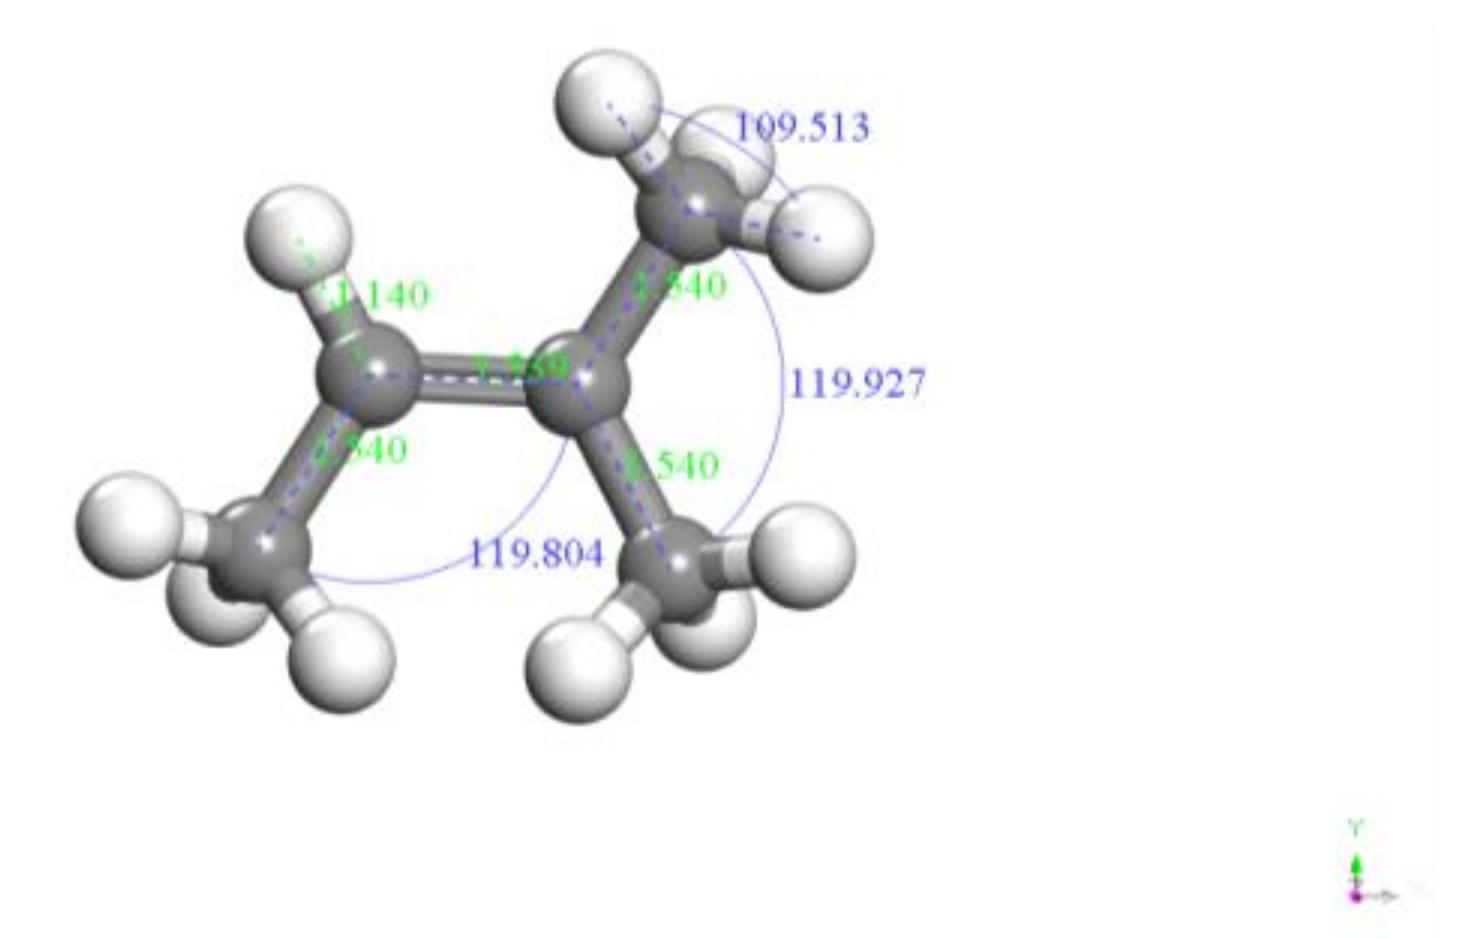
3.1. Composition and Structure of EUG

EUG is a gray, solid particle material in the unsulfurated cross-linking state, which is an essential periodic hydrocarbon polymer, and more than 70% of it is chain structure, and its main component is trans-1,4 polyisoprene, and the molecular structure formula of EUG was drawn using Chem Draw software, as shown in Figure 4. From Figure 4, it can be seen that the repeating monomer unit of EUG is-CH2–CH = C–CH2–, which is a discrete system composed of a large number of isoprene monomers. Additionally, then the molecular structure in Figure 4 was imported into Material Studio 2005 version software, and the molecular structure obtained after structure cleaning and geometry optimization is shown in Figure 5. From Figure 5, the carbon–carbon bond length of the EUG monomer is about 1.540, the hydrocarbon bond length is about 1.140, the carbon–carbon bond angle is about 119°, and the hydrocarbon bond angle is about 109°.
EUG belongs to the condensed polymers, which are characterized by: (1) molecular bonds, which are all covalent, and intermolecular forces, which are generally Van der Waals forces, which include dispersion forces, induction forces, dipole moments, etc.; (2) the molecular structure, which is mainly composed of chain-like microcrystalline cells and folded chains. Whether they are coalesced into solid structures such as chain-like microcells or as folded chains, the relative molecular masses of the condensed polymers are enormous. For the consideration of the computing power, this study assumed that polyisoprene had a simple chain structure, i.e., a polyisoprene single chain composed of multiple isoprene monomers, as shown in Figure 6. Figure 6 is only a schematic diagram of the molecular chain of EUG, but the minimum degree of polymerization of EUG cannot be assumed based on this figure, and the minimum degree of polymerization of EUG is demonstrated subsequently.

3.2. EUG Model Construction and Reliability Verification

The nature of EUG is a polymer composed of a large number of repeating units, therefore, the selection of the degree of molecular chain polymerization is very important in the process of MS molecular simulation, which is directly related to the accuracy of the simulation results and statistical results. Obviously, the larger the molecular chain polymerization degree that is chosen, the higher the simulation accuracy is, but the correspondingly simulation time would be longer, and the comprehensive performance of the computer used by the researcher would need to be higher. In order to improve the efficiency and performance of most computers, it is necessary to choose the minimum polymerization degree that can fully reflect the real performance of the EUG polymer. A number of studies have shown that by varying the polymer length, molecular models of polymers with different lengths were constructed, and by calculating the density (ρ) and solubility parameters (δ), when ρ is close to the actual measured value of density and the value of δ tends to be stable, it means that the degree of polymerization can guarantee the accuracy of the calculation results, and this can be considered as the minimum degree of polymerization of the polymer [23,24].
The specific modeling process is:
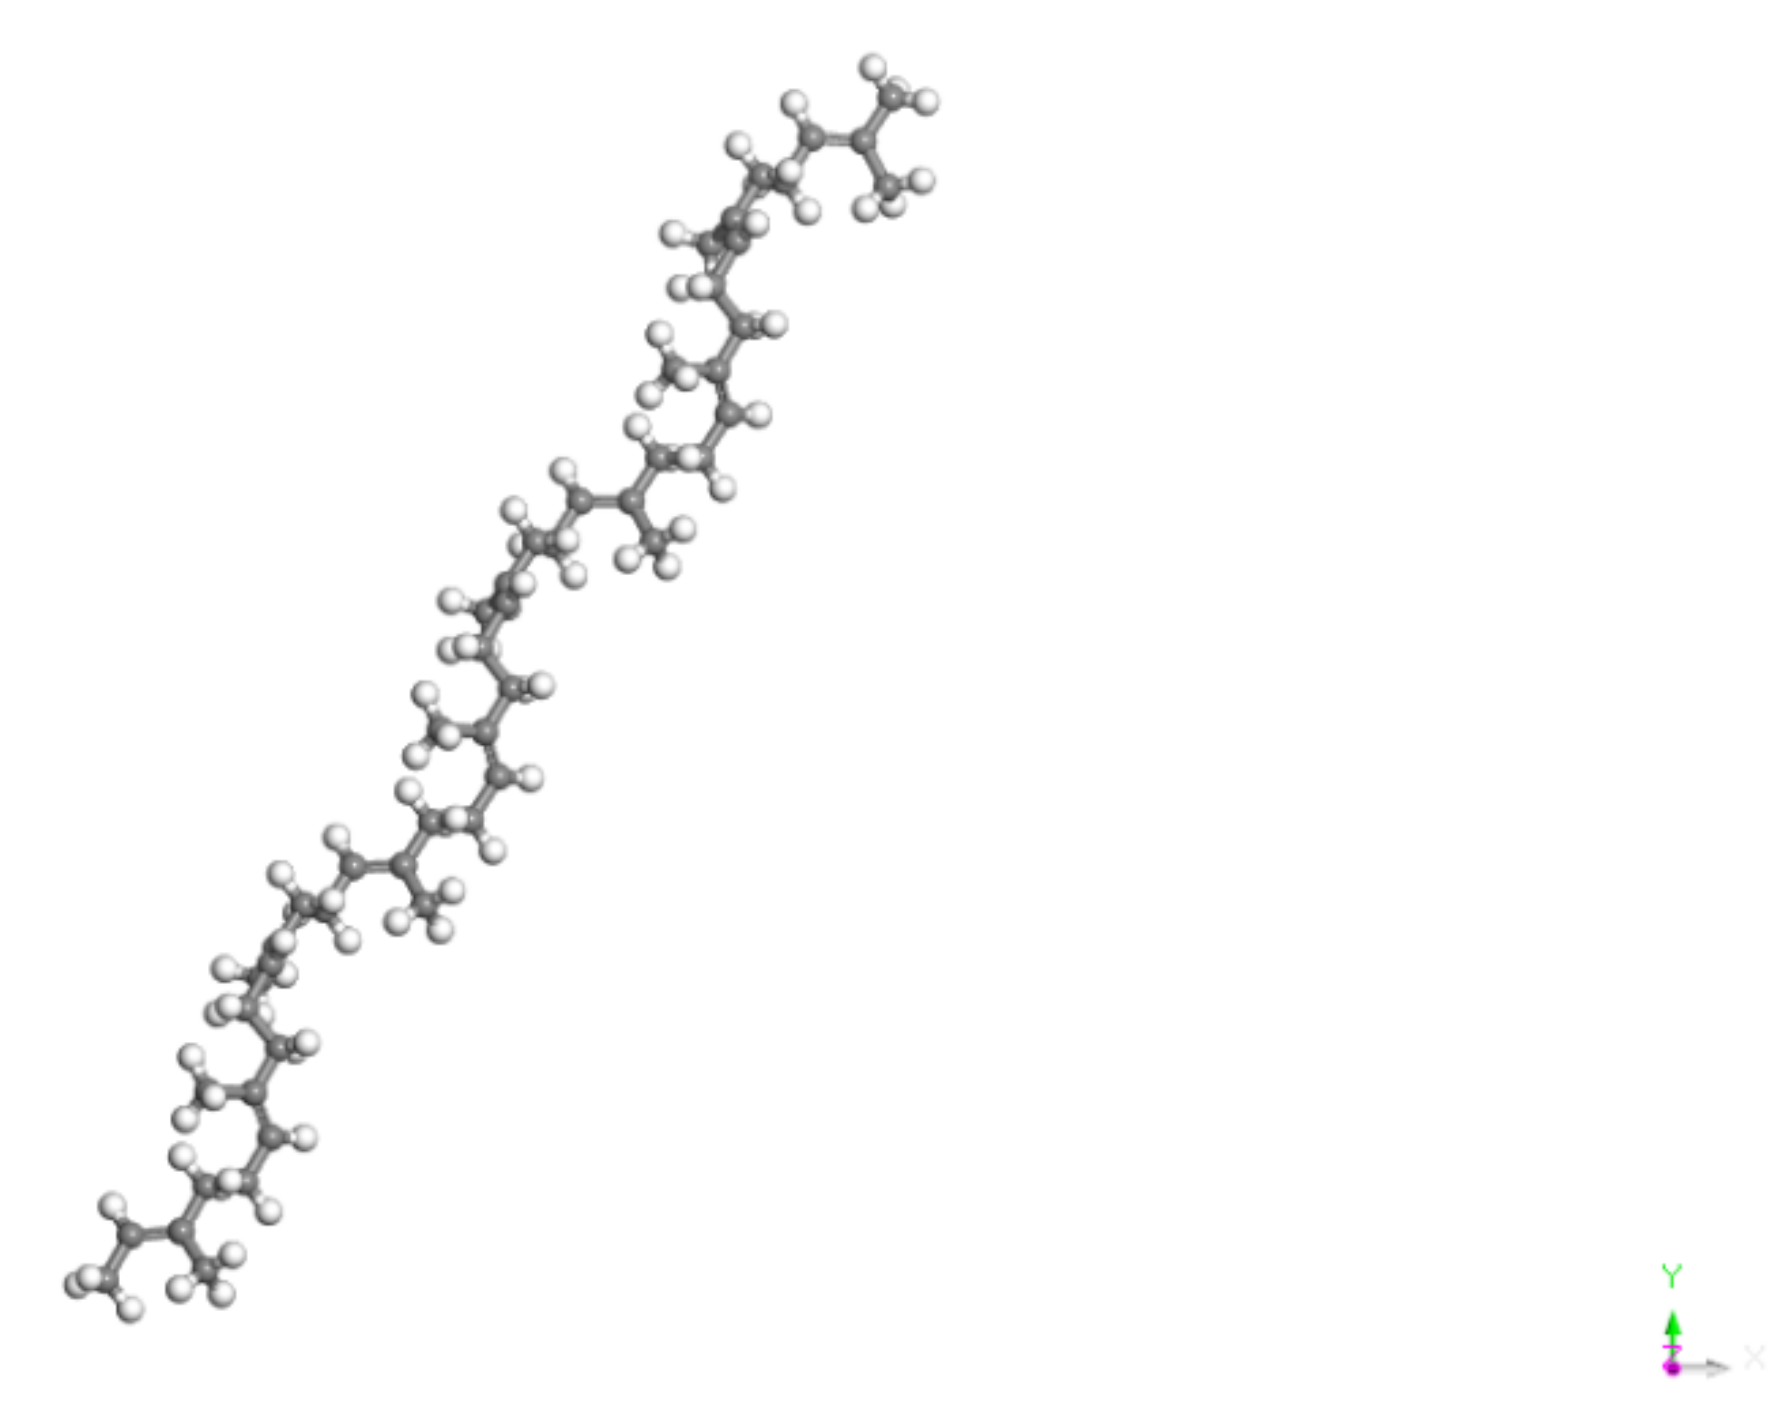
  • Since EUG polymers can reflect the real EUG, it is necessary to determine the minimum degree of polymerization that can reflect the real EUG, utilizing the Materials Visualizer module in MS (Materials Studio 2004) software to construct molecular chain polymerization degrees of 5, 10, 15, 20, 25, 30, 35, 40, 45, and 50, respectively, for EUG molecular models [25,26], with the goal of calculating the solubility parameter (δ) for the polymers of different lengths by varying the length of the polymer. Then, using Forcite, geometry and energy optimization were performed sequentially to find the configuration with the lowest molecular potential energy and to eliminate any local unreasonable structures, such as molecular overlap and offset, that may exist during the modelling process to ensure that subsequent kinetic calculations proceed smoothly [27]. Figure 7 depicts the constructed EUG models with eleven distinct polymerization degrees.
  • On this basis, the lowest energy conformation was selected for annealing in the temperature range of 200–600K with a temperature gradient of 50 K for five cycles at 50 ps.
  • The molecular dynamics of the annealed EUG model were optimized by (1) running molecular dynamics simulations at 50 ps in the NVT ensemble to further relax the EUG chains and (2) running molecular dynamics simulations at 50 ps in the NPT ensemble to achieve kinetic equilibrium.
In the molecular dynamics simulation, the force field was Compass II, and the pressure was set to 0.0001 GPa. The Berendsen method was used for pressure control, the Andersen method was used for temperature control, the Maxwell–Boltzmann distribution was used for the random designation of the starting velocity, and the Van der Waals method was used for the random designation of the starting velocity. The integration algorithm makes use of the Velocity Verlet algorithm, and solving for the Van der Waals non-bonding interactions and electrostatic non-bonding interactions uses atom-based and Ewald methods, respectively; the potential energy makes use of the spherical truncation and long-range summation correction method; the truncation radius is 12.5 Å, the buffer width is 0.05 nm, and the spline width is 0.1 nm. Throughout the simulations, periodic boundary conditions are applied.
The density calculation results of the EUG models with different polymerization degrees obtained by using MS simulation are shown in Figure 8. As can be seen from Figure 8, although the density of EUG with different degrees of polymerization fluctuates slightly, it was basically very close to the empirical value of 0.95 g/cm3. When the degree of polymerization was in the range of 5~10, the difference between the density and the real value was relatively large, but it was still not more than 9%, which was within the acceptable range; when the degree of polymerization was in the range of 15~50, the difference between the density and the real value was relatively small (only 3~5%), and when N = 30, the density ρMD = 0.88 g/cm3 is the closest one to the empirical value ρEx. = 0.93–0.94 g/cm3 [28], with a difference of only 5.4%, which is also highly in line with the actual situation.

3.3. Determination of the Minimum Aggregation Degree of the EUG Model

In order to determine the minimum degree of polymerization of the polymer EUG, it is necessary to resort to the physical quantity of the solubility parameter. The solubility parameter can be calculated by using the cohesion energy density, which can be used to indirectly react to the intermolecular forces through the cohesion energy density or solubility parameter. The cohesion energy (Ecoh) is the energy absorbed by 1 mol of molecules coming together, i.e., the energy required for a substance to overcome the intermolecular forces. Cohesion energy density (CED) is the cohesion energy per unit volume. The cohesion energy density is very useful for predicting the solubility of polymer compounds, and properties such as tensile strength, compressibility, thermal expansion coefficient, and the wettability of the polymers are all related to their cohesion energy density. The solubility parameter δ was obtained by using the square root of the cohesion energy density (CED), which is shown in Equation (6).
δ = C E D = E c o h V = Δ H V R T V
where: ∆HV—molar heat of evaporation; RT—expansion work performed during vaporization; V—molar volume.
The cohesion energy density (CED) and the solubility parameter δ can be accurately calculated by using cohesion energy density in the Forcite module, and the results are shown in Figure 9. From Figure 9, it can be seen that the solubility parameter δ of EUG tended to increase, and then decrease with the degree of polymerization N, and finally it oscillated slightly. The specific process involves: N increasing from 5 to 20, and theδ value increases rapidly with the increase in N. When it reaches 20, the value of δ reaches the maximum value, and then the value of δ starts to drop sharply, and when it reaches 30, the value of δ reaches a very small value, after that, δ starts to level off gradually, and fluctuates slightly up and down, with 16.50 as the median value, but the overall δ tends to be stable. Additionally, when N = 30, δ = 16.525 basically coincides with the experimental value δtest = 16.50, and also, with the literature value δLit. = 16.20~17.0(J/cm3)1/2 [25,26]; the specific parameters are shown in Table 1, so it can be considered that N = 30 is the minimum degree of aggregation of EUG. This conclusion is consistent with Qian Liu et al.’s findings [25]. Additionally, the subsequent simulation would also directly apply this conclusion for the subsequent model computational analysis.
By combining the calculated results of ρ and δ for EUG, it was determined that the molecular dynamics model for EUG is reliable.

4. Construction of SEUG MD Model

After verifying the reliability of the EUG model, this section proposes to use MS for the model construction and molecular dynamics simulation of SEUG with different cross-linking degrees and related properties in order to better study the related properties of vulcanized dulcimer from the perspective of molecular simulation.

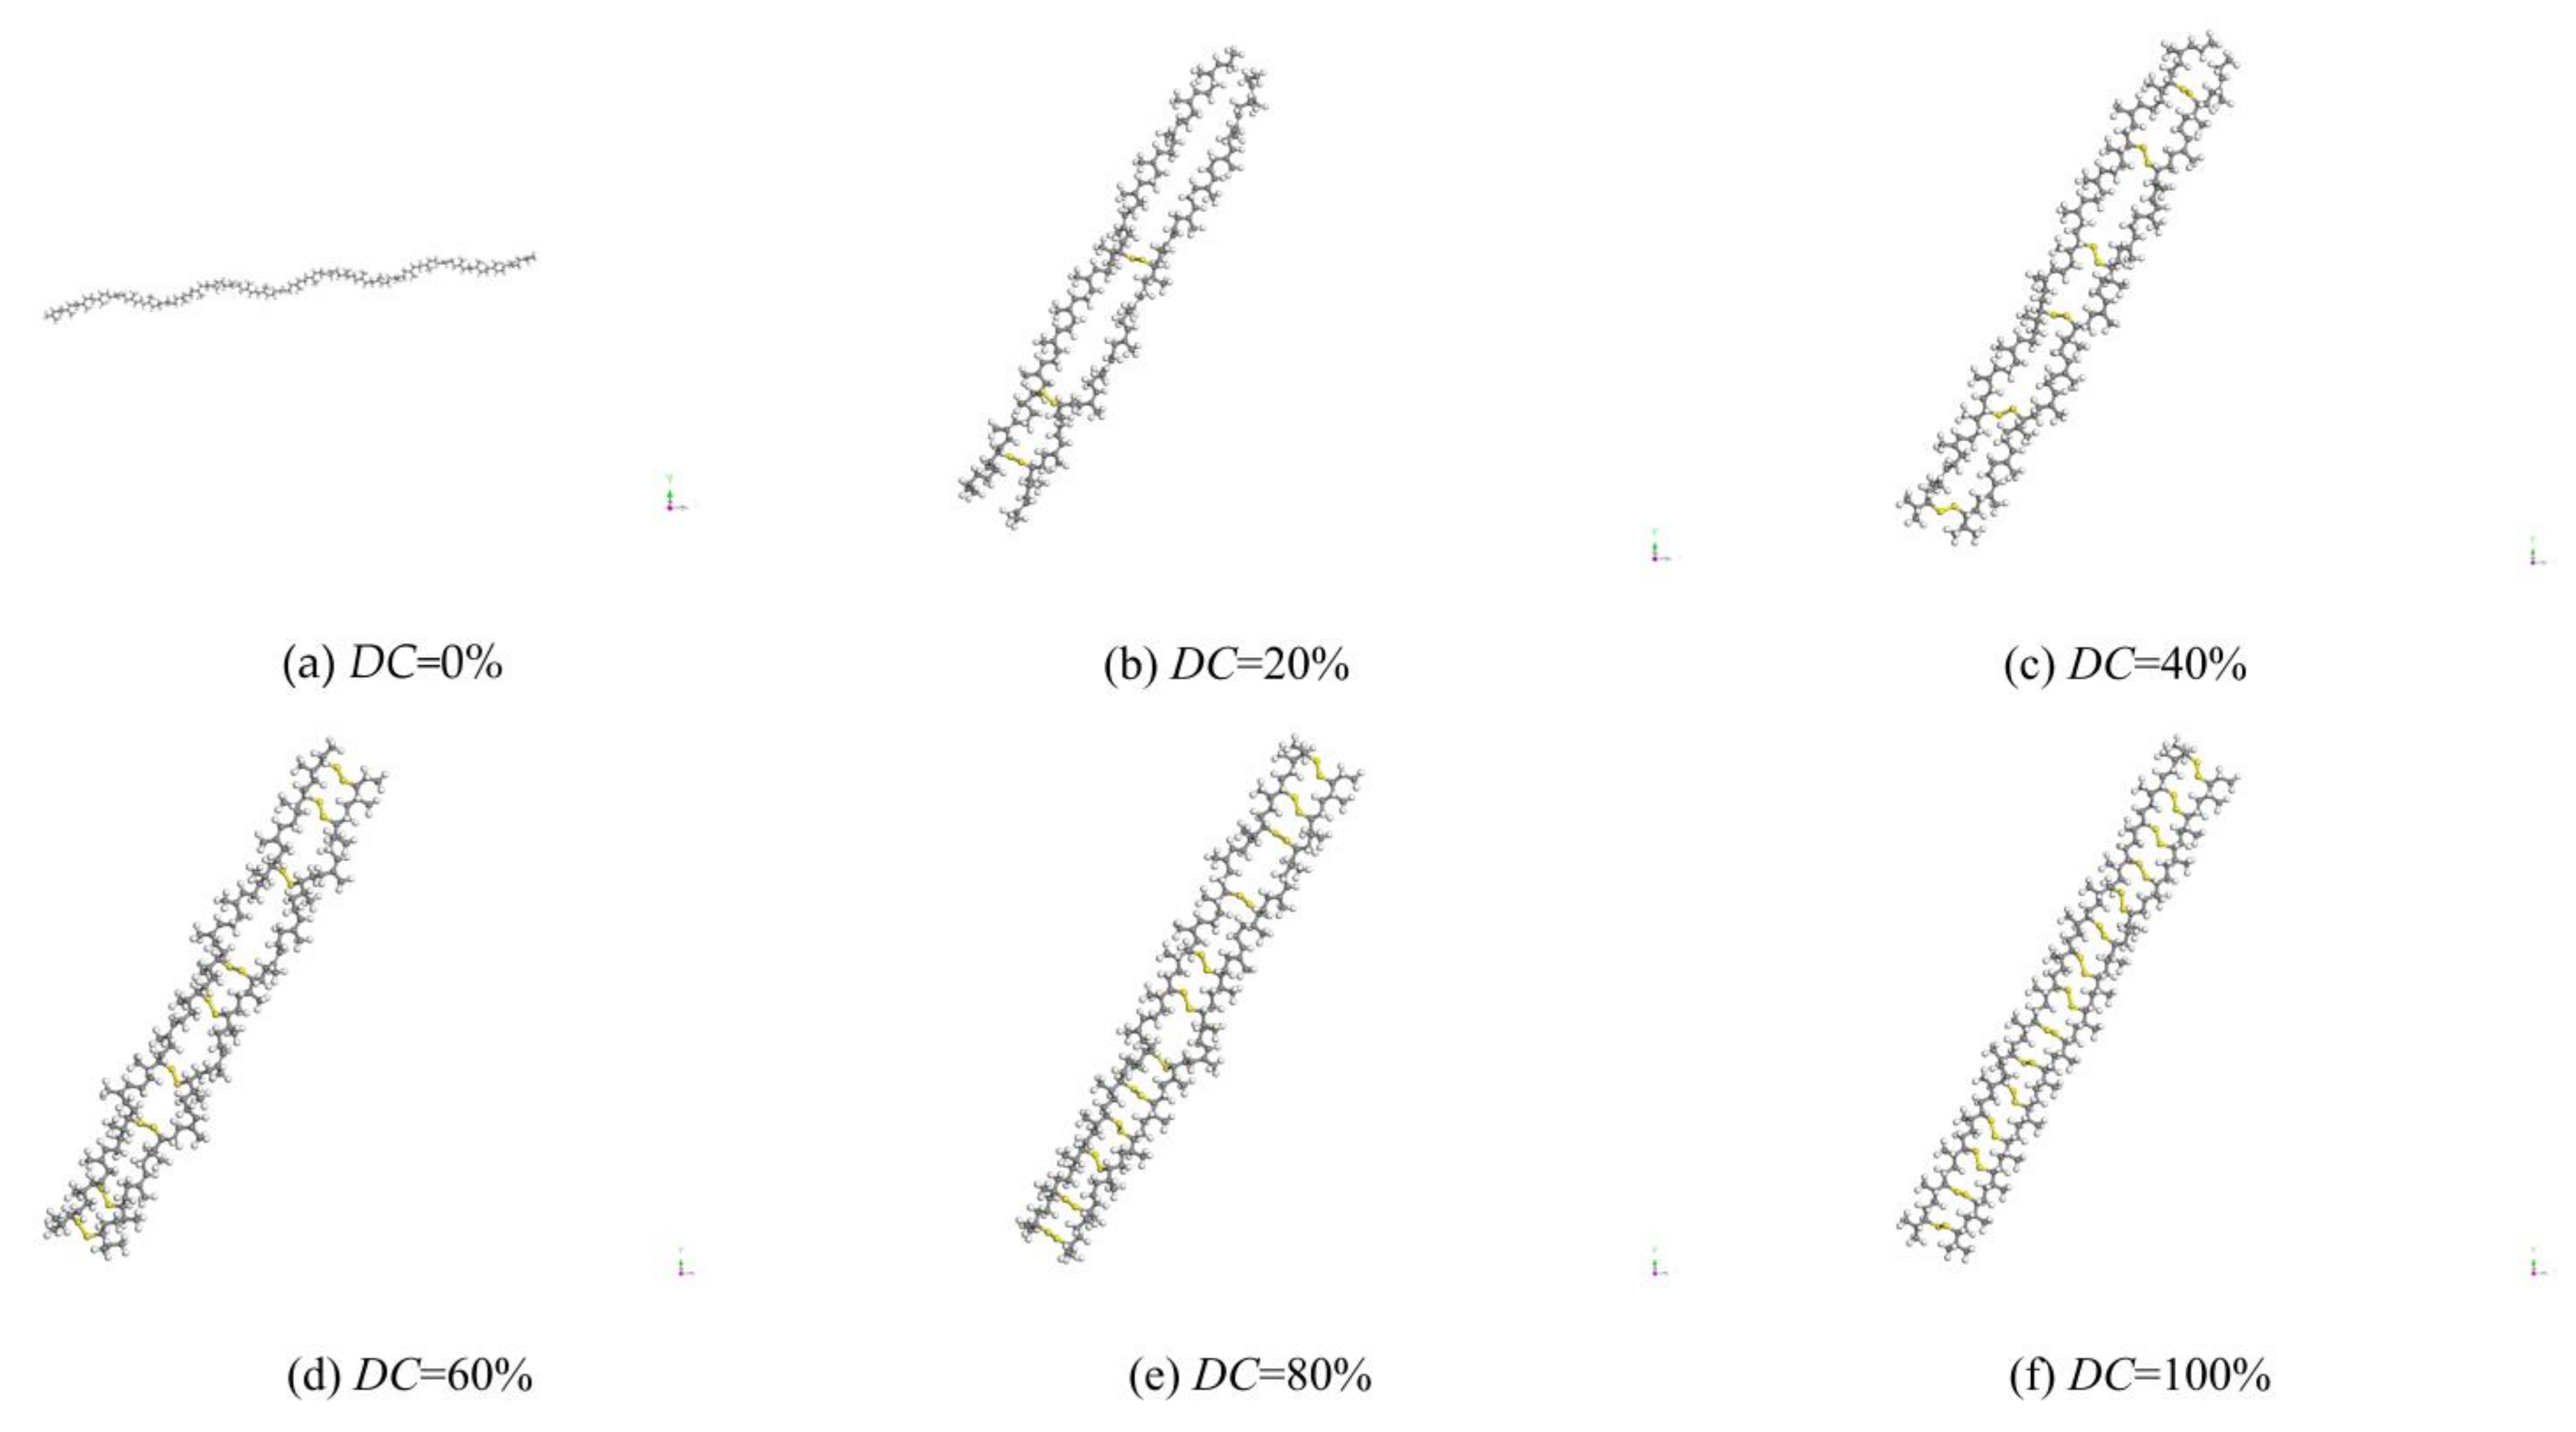
4.1. Construction of SEUG Models

  • The Materials Visualizer module was applied to SEUG single chain models [29] with varying degrees of cross-linking, utilizing sulphur bridges (C-S-S-C) as cross-linking bonds, as illustrated in Figure 10, where the degree of cross-linking is calculated by using Equation (6). Since Packmol [29] has the advantage of a fast computational speed for large system molecules in the packing process, we decided to randomly combine the resulting pdb. files in Packmol into a 100-monomer SEUG model and export it as a pdb. file. The generated SEUG molecular configuration with a 20% cross-linking degree was conformed, as shown in Figure 11.
  • Using the geometry optimization module and energy minimization in the Forcite module, the configuration of SEUG molecules with the lowest molecular potential energy was found.
  • For molecular dynamics optimization, an annealing treatment with a 50 K temperature gradient for 10 cycles and 50 ps in the temperature range of 100 K–600 K was used until a global energy minimum SEUG molecular conformation was found.
  • Using the generated models, molecular dynamics simulations were performed: (1) molecular dynamics simulations at 100 ps in the NVT system further relaxed the EUG molecular chains; (2) molecular dynamics simulations at 100 ps in the NPT system achieved kinetic equilibrium and obtained a stable SEUG molecular structure.
In the simulation of molecular dynamics, the force field was Compass II, the pressure was set to 0.0001 GPa, Berendsen’s method was used for pressure control, Andersen’s method was used for temperature control, the Maxwell–Boltzmann distribution was used for the random designation of the starting velocity, the atom-based method was used to study the Van der Waals action, the integration algorithm was set to 0.0001 GPa, Ewald’s method was used to study the electrostatic action, the Velocity Verlet algorithm was used as the integration algorithm, and a spherical truncation long-range summation correction technique was used for the bit energy, with a truncation radius of 0.85 nm, a buffer width of 0.05 nm, a spline width of 1 nm, and a step size of 1 fs. Throughout the simulations, periodic boundary conditions were used. The equilibrium SEUG model was analyzed and calculated using the Forcite analysis module for solubility parameters, cohesion density energy, and other parameters in order to determine the pertinent properties of SEUG.
D C = 2 N C L N m o n o 100 %
where NCL denotes the total number of cross-linked bonds; Nmono denotes the number of monomers.

4.2. Reliability Verification of SEUG Model

The glass transition temperature Tg can be used to demonstrate that the SEUG model is accurate at various cross-linking levels. At the glass transition temperature, an amorphous polymer transitions from a glassy state to a highly elastic state. It is a crucial indicator of a polymeric material’s stability. Fox and Flory’s specific volume–temperature curve method [30] is one of the most common and reliable methods for determining the glass transition temperature Tg of a material in simulations of molecular dynamics. Below, Tg, the empty volume of the polymer, does not change significantly as the temperature rises; however, when the polymer becomes glassy, the volume changes rapidly. Consequently, NPT simulations were utilized to determine specific volumes at various target temperatures. The segmented linear fitting of the data on both sides of the inflection point produced two straight lines (below and above Tg). The horizontal coordinates of the inflection point were utilized to calculate the glass transition temperature of the material. Figure 12 depicts the temperatures at which the glass transition occurs for various models of cross-linking.
The amount by which each model’s particular volume increases with the temperature can be seen in Figure 12. The “jumping” phenomenon, or the transition from a glass to a highly elastic state, takes place just below the glass transition temperature, whereupon the molecular chain segments start to move. In addition, several models show a tendency for Tg to climb as the DC increases. Figure 13 shows the precise fluctuation relationship between Tg and DC.
Figure 13 shows that Tg increases as the degree of cross-linking increases. When the DC is 0–40%, the Tg of SEUG slowly increases with an increasing DC, indicating that SEUG is in a light cross-linking state, and the formed cross-linking points are insufficient to form a complete cross-linking network structure, but they can only form a local cross-linking network structure. When DC = 40–60%, the rate of Tg of SEUG accelerates with an increasing DC, indicating that SEUG is in a medium cross-linking state at this time, and EUG has formed a complete cross-linking network structure at this time. As the cross-linking degree increases, the Tg of the curve rises further, and the rising speed is obviously accelerated. Tg increases significantly when the DC reaches 80%, demonstrating that SEUG is currently in a strong cross-linking condition. When the cross-linking degree reaches the critical turning point, the crystals of EUG are fully destroyed, all of the intrinsic crystals in SEUG are destroyed, SEUG is completely changed into an elastomer, and Tg decreases to −28.6 °C. According to the findings of Professor Rui-Fang Yan’s study [19], the related mechanical behavior is comparable to that of natural rubber (NR). As a result, the validity of the SEUG MD model can be established.

4.3. Radial Distribution Function of SEUG Model

The radial distribution function (RDF) is an important physical parameter characterizing the distribution properties of the intramolecular and the intermolecular particles of a material. The function g(r) indicates the chance of another molecule or atom appearing in the region around a molecule or atom at a distance of r. The schematic diagram of its physical meaning is shown in Figure 14, and the calculation formula is given in Equation (7) [31]. By calculating g(r), it can be beneficial to determine the internal and intermolecular particle binding and the degree of the orderly distribution of the molecular structure. The larger g(r) is at a certain position, the higher the probability is of other particles appearing there. The intermolecular radial distribution function is used to characterize and reveal the mode and nature of the interactions between the non-bonded atoms, which ranges from 2.6 to 3.1 Å for hydrogen bonds and from 3.1 to 5.0 Å for Van der Waals forces [24].
g ( r ) = d N ρ 4 π r 2 δ r
where ρ represents the density of system and N represents the number of particles in the system.
The intra- and intermolecular radial distribution functions of SEUG with different degrees of cross-linking were calculated as shown in Figure 15 and Figure 16, respectively.
  • Intramolecular C-C radial distribution function of SEUG.
The intramolecular radial distribution function curves of SEUG with different cross-linking degrees basically overlap, and no new characteristic peaks appear when they are comparing with the curve of EUG (DC = 0), and sharper characteristic peaks appear in the following places: in the range of 1.2 Å~3 Å from the central atom, the characteristic peaks appeared in 1.35 Å, 1.53 Å, 1.81 Å, 2.19 Å, and 2.53 Å, respectively. The highest characteristic peaks showed a trend of increasing, then decreasing, and then decreasing again, and when the central atomic distance from the radius exceeded 3 Å, the RDF diagram started to level off until the g(r) value gradually tended to 1 Å. The highest peak occurs at around 1.53 Å, which corresponds to the C-C atomic pair that are directly bonded in EUG, i.e., the interaction forces within the EUG molecule are mainly bonding forces [12]. In addition, characteristic peaks appear at several places, 1.35 Å, 1.81 Å, 2.19 Å, and 2.53 Å, which reflect non-bonded C-C atom pairs. It could be seen that in 2.53 Å~3.0 Å, the DC = 40~100% curve was higher than the DC = 0~20% curve, indicating that there were more non-bonded C-C atoms in DC = 40~100% than there were in DC = 0~20%, indicating that with the intensification of sulfidation, there were more C-C bonds replaced by C-S-S-C, and the molecules were more densely distributed.
2.
Intermolecular C-C radial distribution function of SEUG.
The intermolecular radial distribution functions of SEUG with different degrees of cross-linking are shown in Figure 16.
Figure 16 reveals that the differences between the curves of the intermolecular radial distribution functions of SEUG with various degrees of cross-linking are not statistically significant, indicating that sulfide has no effect on the orderliness of the intermolecular distribution of SEUG with various degrees of cross-linking.

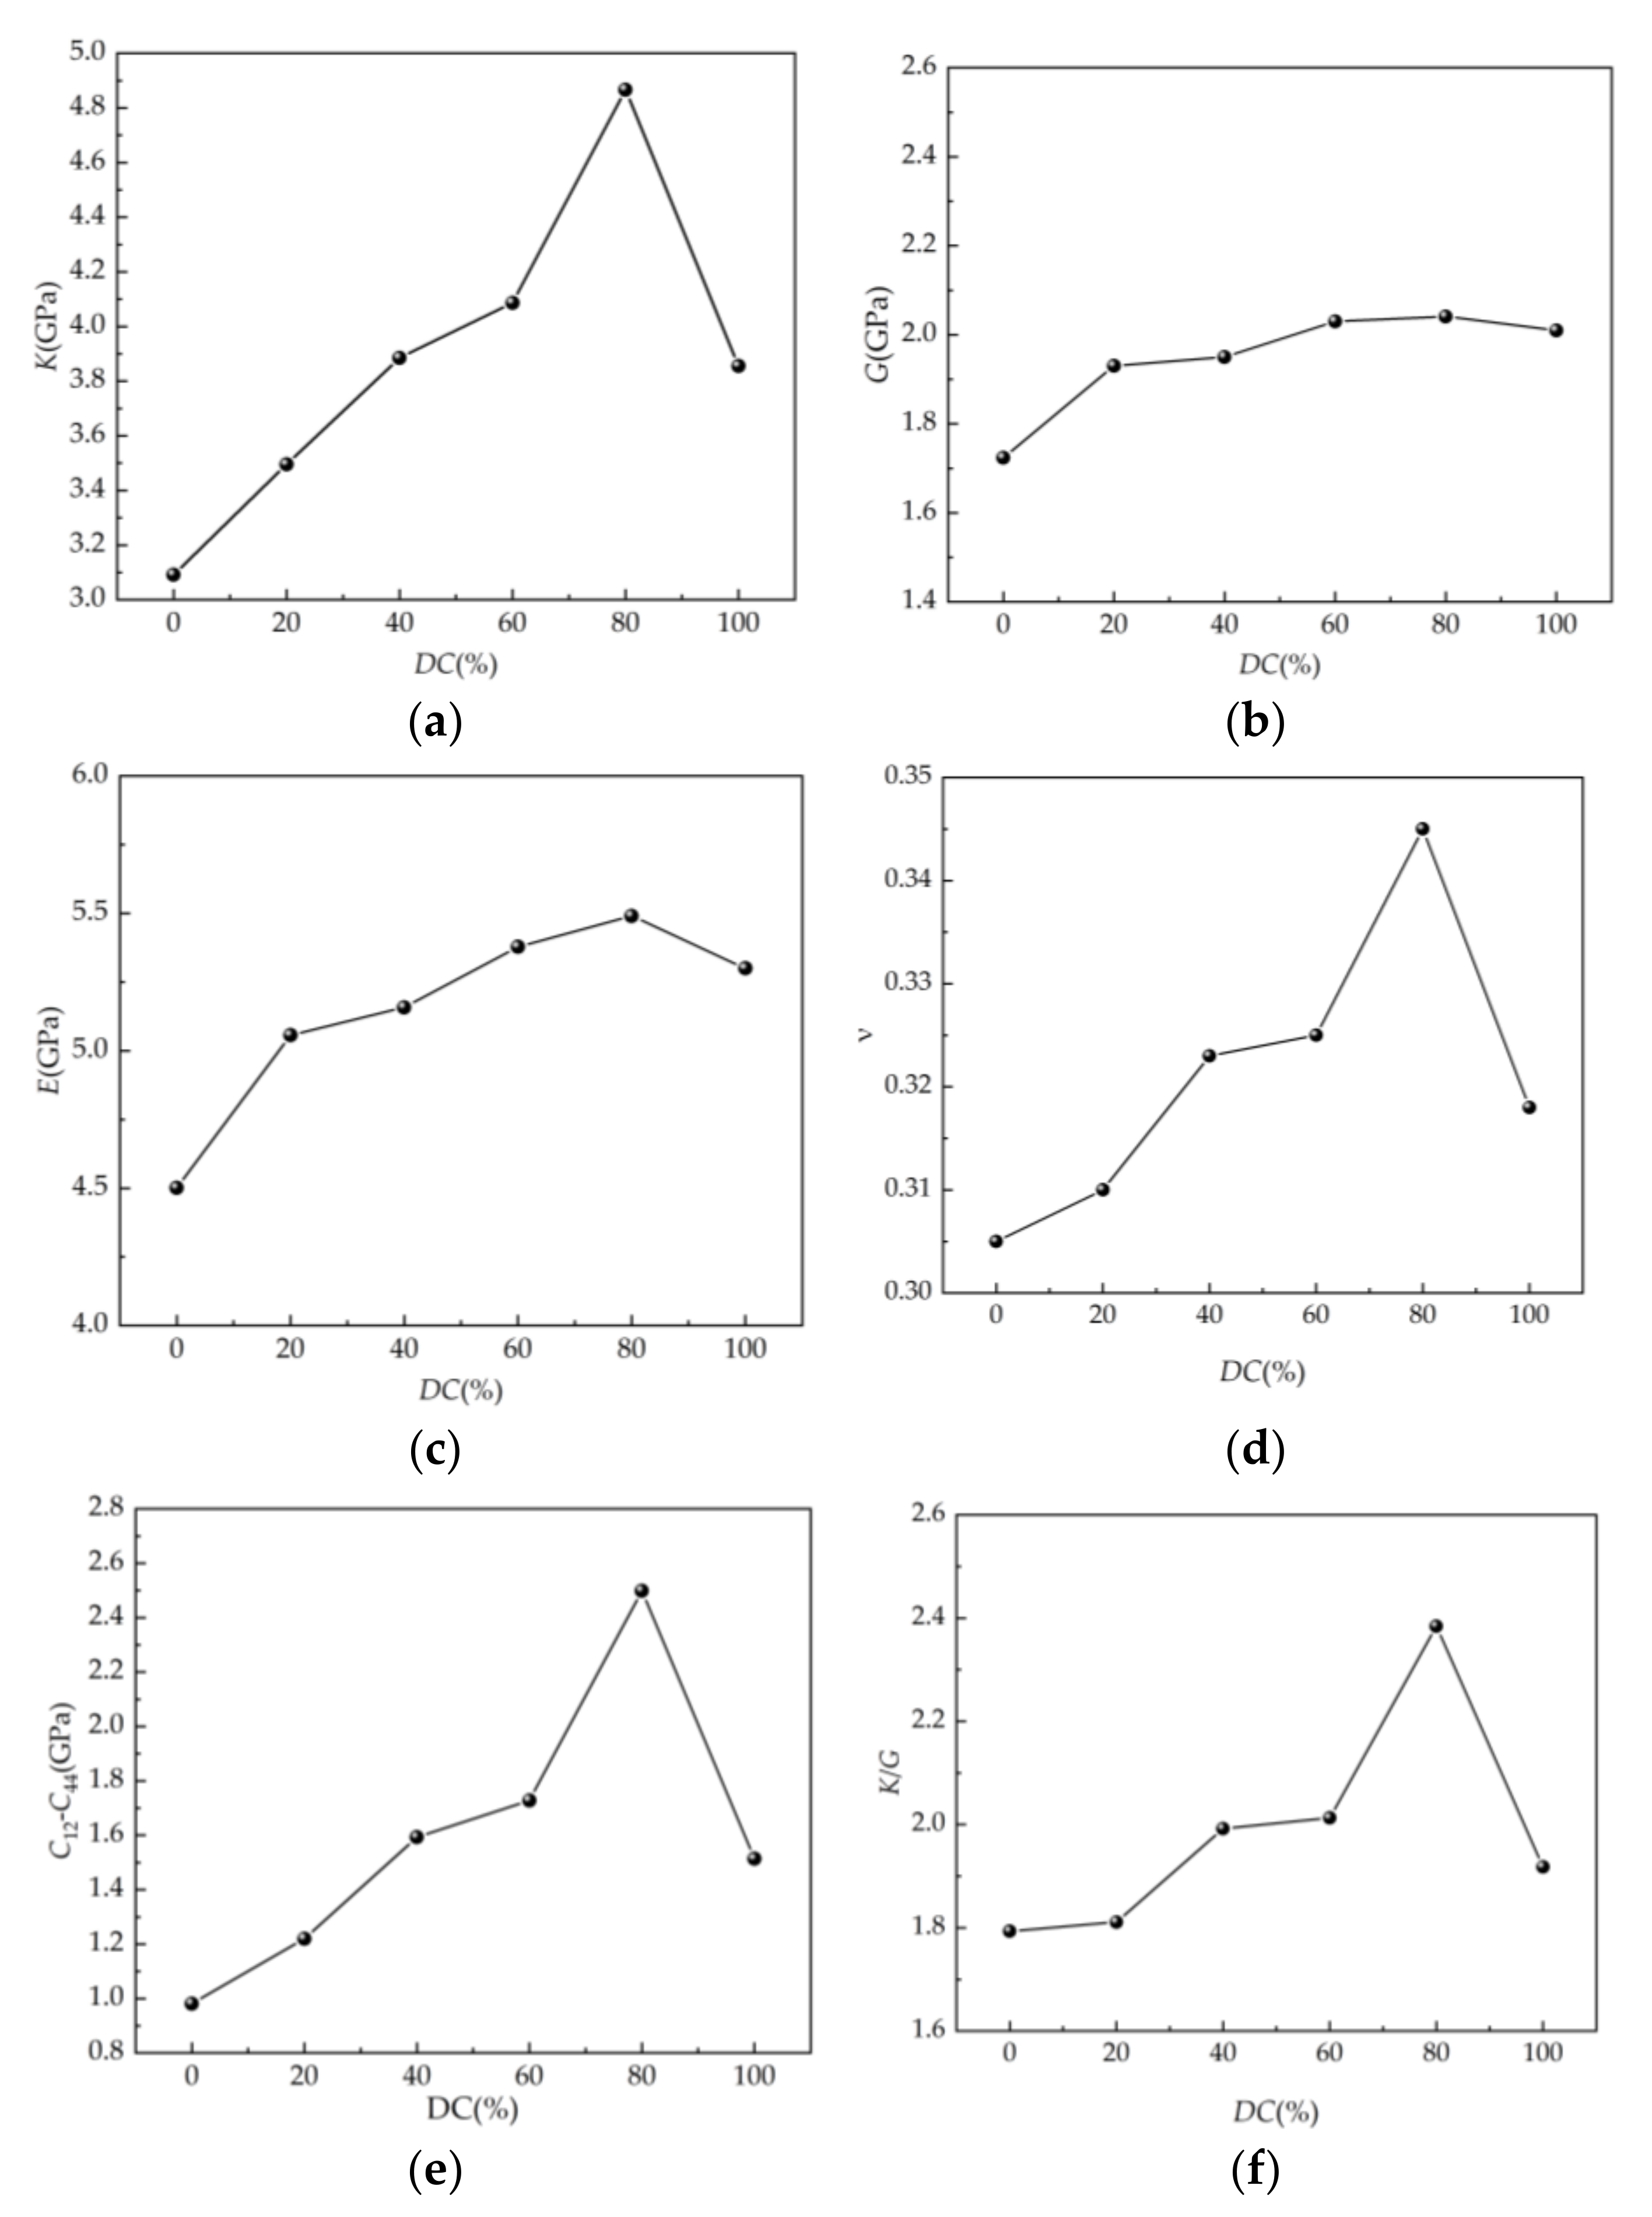
4.4. Mechanical Property Parameters of SEUG Model

Mechanical properties are the material’s resistance to external forces and deformations, which have a significant impact on its preparation, processing, and application. It is possible to calculate the mechanical properties of a material by deriving them from its matrix of elastic coefficients. For anisotropic materials, elastic strain can satisfy this, and there are 21 big, mutually independent elastic constants. In contrast, for isotropic solid materials, there are only two relatively simple, mutually independent elastic constants, C11 and C12. To simplify the computation further, λ and 2μ are assumed to be C11 and C11-C12, respectively, and the formulas of the Lamé constants and elastic coefficient matrix with stress–strain relationships are provided in (9) [32,33].
C i j = λ + 2 μ λ λ 0 0 0 λ λ + 2 μ λ 0 0 0 λ λ λ + 2 μ 0 0 0 0 0 0 μ 0 0 0 0 0 0 μ 0 0 0 0 0 0 μ
where λ and μ are referred to as Lamé constants.
Using the Lamé constants, the elastic moduli of isotropic materials can be determined: bulk modulus (K), shear modulus (G), elastic modulus (E), and Poisson ratio (v), as indicated in Equations (9)–(12) [32,33].
K = λ + 2 3 μ
G = μ
E = μ 3 λ + 2 μ λ + μ
ν = λ 2 λ + μ
To determine the Lamé constants of the SEUG system at various levels of cross-linking, the Mechanical Properties task in Forcite simulates the SEUG molecular model with a stable structure. As shown in Table 2, Equations (9)–(12) are used to calculate the mechanical constants of SEUG at varying degrees of cross-linking.
A measure of the modulus of elasticity E is an important measure of the stiffness of a material; the greater its value is, the more rigid and resistant to deformation the material is. The shear modulus G corresponds to the ratio of shear stress to strain. The bulk modulus K is used to characterize the incompressibility and elasticity of a homogeneous, isotropic solid material. Poisson’s ratio, also known as the transverse deformation factor, is the ratio of transverse strain to longitudinal strain and reflects the transverse deformation of the material. The Corsi pressure (C12-C44) can be used to evaluate the ductility of a material; the higher the value is, the greater the ductility is, conversely, the lower the value is, the greater the brittleness is. K/G, the ratio of bulk modulus to shear modulus, indicates the system’s toughness [34]. The variation pattern of K, G, E, v, C12-C44, and K/G of SEUG with cross-linking degrees are plotted in Table 3, as shown in Figure 17. This was achieved to illustrate the pattern of variation in the mechanical parameters of SEUG with different cross-linking degrees.
Figure 17a–f shows that in the SEUG model, K, G, E, v, C12C44, and K/G exhibit similar trends with varying degrees of cross-linking; they all increase and then decrease as the DC increases. This suggests that at DC = 80%, SEUG has attained the critical degree of cross-linking. This is because, initially, when DC = 0–40%, SEUG was weakly cross-linked, and the vulcanized juniper gum system had not formed a complete cross-linked network structure; with the increasing degree of cross-linking, the cross-linked network expands, and its mechanical properties gradually improve, but the crystalline area in the vulcanized gum system is still dominant, and the overall properties are biased toward plastic; at a DC of 40~80%, SEUG is moderately cross-linked. Although the crystalline area and three-dimensional cross-linked network still coexist in the system, the three-dimensional cross-linked network predominates. As a result, the deformation resistance, plasticity, and toughness of SEUG are significantly enhanced, and SEUG undergoes reversible changes from being amorphous to crystalline or crystalline to amorphous, i.e., rubber–plastic duality. This quality has also been extensively utilized in the development of shape memory materials [35]. When the cross-linking degree of SEUG exceeds the critical cross-linking degree, however, most or all of the crystallization in the system is replaced by the amorphous region, and the excessively cross-linked network structure affects the elastic recovery ability of SEUG, which exhibits the properties of a hard elastomer. In order to achieve more desirable mechanical properties in vulcanizates, it is necessary to control the degree of cross-linking between 40% and 80%, which is consistent with the findings of Yan Ruifang et al. [36].

5. Test

5.1. Materials and Recipes

The basic formulations of vulcanized eucommia ulmoides gum are shown in Table 3.

5.2. Synthesis Process of SEUG

First, the refiner is heated to 70–80 °C, and then the double-roller refining machine is used to refine the plastic. The distance between the double rollers is then increased, and the formula is followed by the addition of Zinc Oxide, ZA, Nano-silica, Naphthenic Oil, and Gummaron Resin, followed by Accelerator CZ and varying amounts of S, and mixed for 3–5 min. The samples were placed on the flat vulcanizer for vulcanization, and the temperature, pressure, and duration were set to 150 °C, 120 MPa, and 35 min, respectively.

5.3. Test of Tensile Strength

The tensile test was conducted using an Instron 3365 tensile tester, and the tensile strength was evaluated in accordance with GB/T528-2009 “Determination of Tensile Properties of Vulcanized Rubber” for a fixed extension, elongation at break, and tensile strength at 23 °C. At least three samples were measured, and the average values were calculated.

5.4. Cross-Link Density Test

Cross-link density is the number of effective web chains per unit volume of thermoset elastomers, and it can be used to quantify the cross-linking degree of the elastomers. The cross-link density of elastomers influences their elastic properties, including the modulus, breaking strength, maximum elongation, and swelling, as well as their dynamic mechanical properties [37]. As an important characterization parameter of the structural properties of the elastomer network, cross-link density has a significant impact on the microstructural and serviceability properties of elastomers. For equilibrium swelling experiments on SEUG [38], n-heptane was chosen based on the principle of similar phase solubility, and the Flory–Huagins theory was used to determine the cross-linking density of SEUG.

5.5. Test Results and Discussion

5.5.1. Tensile Strength

The relationship between the tensile strength of the SEUG and the content of S is shown in Figure 18. From Figure 18, it can be seen that the tensile strength increases with the increase in the S content, and then decreases, and the change pattern is consistent with the mechanical properties of the SEUG model.

5.5.2. Cross-link Density Test

The relationship between the cross-link density of the SEUG and the content of S is shown in Figure 19. From Figure 19, it can be seen that the cross-link density increases with the increase in the S content, and then decreases, and the change pattern is consistent with the mechanical properties of the SEUG model.
In conclusion, increasing the amount of S within a certain range can promote the cross-linking of SEUG and improve the mechanical properties of vulcanized juniper gum; however, increasing the amount of S beyond the critical value is detrimental to the mechanical properties of SEUG. In accordance with the conclusion of the MS simulation, it is possible to demonstrate that the MS simulation of SEUG is effective. Additionally, the optimal dosage of S is 2.5 phr, which is consistent with the conclusion of the study by Mingjun Gang et al. [9].

6. Conclusions

In this paper, the microscopic properties of EUG and SEUG with different degrees of cross-linking were investigated computationally by using the MD simulation method, and the following conclusions were obtained.
  • MD models of EUG with polymerization degrees from 5 to 50 were constructed, and the reliability of the EUG models was verified by calculating the density and solubility parameters of the EUG models with different polymerization degrees. The solubility parameter of 16.50, which is more consistent with the experimental test results and empirical values, was obtained, and furthermore, the minimum polymerization of 30 was determined, which can reflect the real situation of EUG.
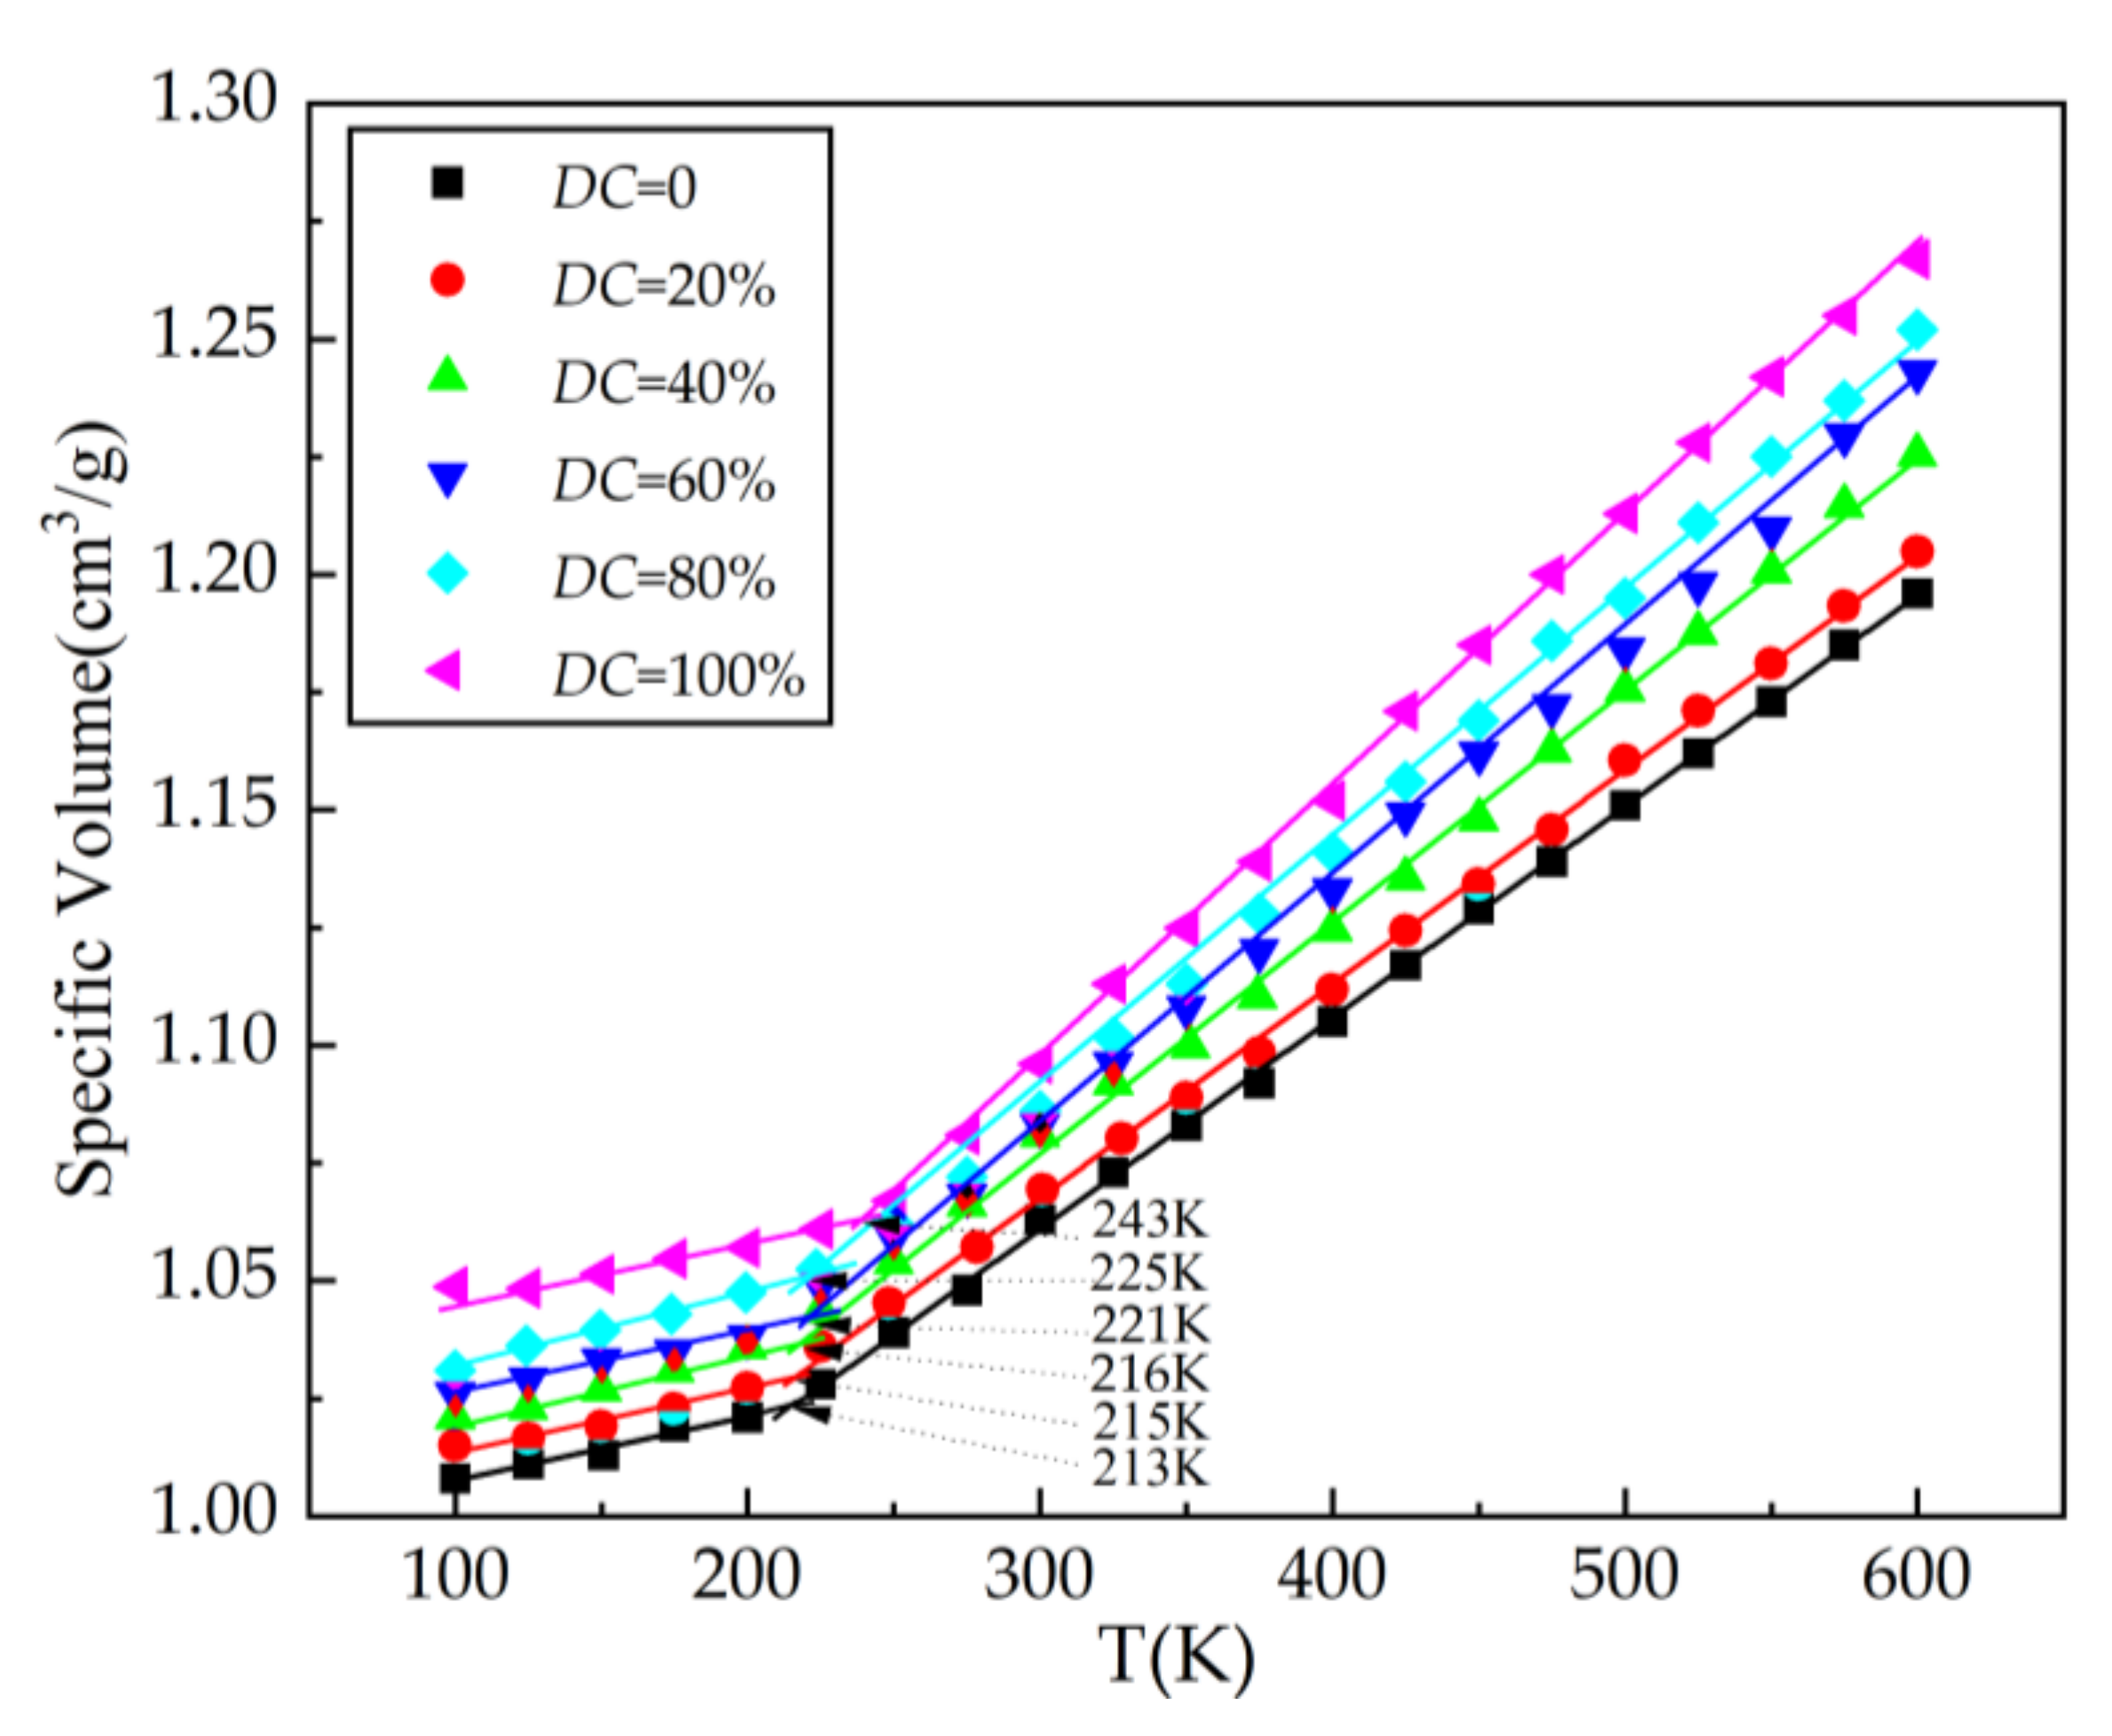
  • SEUGs with cross-linking degrees of 20%, 40%, 60%, 80%, and 100% were constructed to test the effects of different cross-linking degrees on the SEUG performance from a microscopic perspective, and Tg increases with increasing cross-linking degree. When DC is 40%, SEUG is in mild cross-linking, which greatly improves its viscosity. When DC = 40–60%, SEUG is in moderate cross-linking; the Tg of the curve further increases, and the rate of the increase is obviously faster. When DC = 100%, the intrinsic crystals in EUG are all destroyed, SEUG is in the elastic cross-linking stage, and SEUG completely becomes an elastomer, which is consistent with the research conclusion of Professor Yan Ruifang [2]. Therefore, it can be proven that the MD model of SEUG is reliable.
  • The intra- and intermolecular radial distribution function curves of SEUG models with varying degrees of cross-linking were analyzed, and it was determined that sulfidation had a relatively large effect on the intra-molecular radial distribution of SEUG, and that as sulfidation increased, the C-C bond was replaced by the C-S-S-C bond, and the molecular distribution became more dense. The effect on the intermolecular radial distribution was not so apparent because it was mixed with other substances, and this is consistent with the objective evidence.
  • By calculating and analyzing the mechanical property parameters of SEUG with varying degrees of cross-linking, it is demonstrated that from the perspective of the mathematical simulation method, the suitable cross-linking degree of SEUG should be controlled to be between 40% and 80% when SEUG has rubber–plastic duality and the most ideal mechanical properties, which can serve as a reference for the ratio of EUG and cross-linking agent in the vulcanization process of EUG.
  • The variation pattern of vulcanization tensile strength and cross-linking density of SEUG by different degrees of cross-linking with the dosage of S is consistent with the molecular dynamics simulation, which shows that increasing the dosage of S within a certain degree is beneficial to the cross-linking of eucalyptus gum beyond a certain limit, and then it has the opposite effect. It also shows that the simulation of the molecular dynamics of SEUG is effective.

Author Contributions

Conceptualization, S.Y. (Simeng Yan) and N.G.; methodology, S.Y. (Simeng Yan), N.G. and X.J.; validation, S.Y. (Simeng Yan), Z.C. and S.Y. (Sitong Yan); writing—original draft preparation, S.Y. (Simeng Yan). All authors have read and agreed to the published version of the manuscript.

Funding

This research was supported by the Natural Science Foundation of China (51308084); the China Postdoctoral Science Foundation (2020M670731); the Fundamental Research Funds for the Central Universities (3132017029); the “Double Tops” Construction Special Project of Dalian Maritime University (BSCXXM021); the Science Foundation of Dalian, China (2020JJ26SN062); the Foundation of Liaoning Educational Committee (LJKMZ20220922).

Data Availability Statement

Not applicable.

Acknowledgments

The author also thanks the Dalian Maritime University, Tonghua Normal University and Shenyang Jianzhu University. The author also thanks all the editors, and anonymous reviewers for their improvements.

Conflicts of Interest

The authors declare no conflict of interest.

References

  1. Sun, S.Q.; Zhang, J.C.; Zhang, L.Q. Research Progress in Biorubber. Polym. Bull. 2013, 4, 42–50. [Google Scholar]
  2. Yan, R.F. The gutta-percha material engineering-the theoretical basis for commercial development. Chem. Technol. Mark. 1999, 7, 3–4. [Google Scholar]
  3. Zhao, J.L.; Li, Z.G. Optimized Design and Research on Performance of Asphalt Modified by Eucommia Ulmoides Gum. Highway 2013, 10, 189–193. [Google Scholar]
  4. Li, Z.G.; Deng, X.Y.; Shen, J.X. Test and Research on Effect of Eucommia Ulmoides Gum Blending with SBS Modified Asphalt. Highway 2008, 8, 217–220. [Google Scholar]
  5. Chen, Z.Q.; Li, Z.G. Study on the vulcanization cross-linking degree of eucommia gum for asphalt modification. Highway 2013, 8, 267–270. [Google Scholar]
  6. Deng, X.Y.; Li, Z.G.; Huang, Y.X.; Luan, Y. Improving mechanism and effect analysis of sulfurated and grafted Eucommia Ulmoides Gum modified rubber asphalt. Constr. Build. Mater. 2017, 148, 715–722. [Google Scholar] [CrossRef]
  7. Li, N. Study on Preparation, Property Characterization and Modification Mechanism of Vulcanized Eucommia Ulmoides Gum Modified Asphalt. Master’s Thesis, Nanjing Forestry University, Nanjing, China, 2021. [Google Scholar]
  8. Zheng, M.Y.; Ni, F.A.; Gu, X.Y. Study of vulcanized dulcimer for asphalt modification. Mod. Transp. Technol. 2009, 6, 14–17. [Google Scholar]
  9. Gang, M.J.; Guo, Y.Z.; Shi, X.T.; Zhang, J.B. Effect of sulfur dosage on the performance of bio-based dulcimer. Chem. Enterp. Manag. 2019, 17, 25–26. [Google Scholar]
  10. Yi, B. Study on Rubber Modified Asphalt Based on Molecular Simulation Technology. Master’s Thesis, Xinjiang University, Xinjiang, China, 2020. [Google Scholar]
  11. Habasaki, J.; Casalini, R.; Ngai, K.L. Molecular Dynamics Study of Thermodynamic Scaling of the Glass-Transition Dynamics in Ionic Liquids over Wide Temperature and Pressure Ranges. Phys. Chem. B 2010, 114, 3902–3911. [Google Scholar] [CrossRef]
  12. De Arenaza, I.M.; Meaurio, E.; Coto, B.; Sarasua, J.R. Molecular dynamics modelling for the analysis and prediction of miscibility in polylactide/polyvinilphenol blends. Polymer 2010, 51, 4431–4438. [Google Scholar] [CrossRef]
  13. Dai, X.R.; Zhao, J.J.; Xun, X.X.; Liu, Y.; Qiao, X.S. Advances in Molecular Dynamics Simulation of Glass Structures and Properties Calculation. J. Chin. Ceram. Soc. 2021, 49, 2691–2709. [Google Scholar]
  14. Alipour, P.; Toghraie, D.; Karimipour, A.; Hajian, M. Molecular dynamics simulation of fluid flow passing through a nanochannel: Effects of geometric shape of roughnesses. J. Mol. Liq. 2019, 275, 192–203. [Google Scholar] [CrossRef]
  15. Shao, J. Asymptotic Behavior and Ergodicity for the Time Inhomogeneous Diffusion Process. Nanjing University of Aeronautics and Astronautics. Master’s Thesis, Nanjing University, Nanjing, China, 2019. [Google Scholar]
  16. Yan, S.R.; Shirani, N.; Zarringhalam, M.; Toghraie, D.; Nguyen, Q.; Karimipour, A. Prediction of boiling flow characteristics in rough and smooth microchannels using molecular dynamics simulation: Investigation the effects of boundary wall temperatures. J. Mol. Liq. 2020, 306, 112937. [Google Scholar] [CrossRef]
  17. Alipour, P.; Toghraie, D.; Karimipour, A.; Hajian, M. Modeling different structures in perturbed Poiseuille flow in ananochannel by using of molecular dynamics simulation: Study the equilibrium. Phys. A Stat. Mech. Its Appl. 2019, 515, 13–30. [Google Scholar] [CrossRef]
  18. Jolfaei, N.A.; Jolfaei, N.A.; Hekmatifar, M.; Piranfar, A.; Toghraie, D.; Sabetvand, R.; Rostami, S. Investigation of thermal properties of DNA structure with precise atomic arrangement via equilibrium and non-equilibrium molecular dynamics approaches. Comput. Methods Programs Biomed. 2020, 185, 105–169. [Google Scholar] [CrossRef]
  19. Sun, H. COMPASS: An ab Initio Force-Field Optimized for Condensed-Phase Applicationss Overview with Details on Alkane and Benzene Compounds. J. Phys. Chem. B 1998, 102, 7338–7364. [Google Scholar] [CrossRef]
  20. Sun, H.; Jin, Z.; Yang, C.; Akkermans, R.L.; Robertson, S.H.; Spenley, N.A.; Miller, S.; Todd, S.M. COMPASS II: Extended coverage for polymer and drug-like molecule databases. J. Mol. Model. 2016, 22, 47. [Google Scholar] [CrossRef]
  21. Wen, Y.H.; Zhu, R.Z.; Zhou, F.X. An overview on molecular dynamics simulation. Adv. Mech. 2003, 33, 65–73. [Google Scholar]
  22. Zhao, S.; Li, J.F.; Zhou, Y.H. Molecular Dynamics Simulation and Its Application in the Materials Science. Mater. Rev. 2007, 21, 5–8. [Google Scholar]
  23. Yang, J.; Guo, N.S.; Guo, X.Y.; Wang, Z.; Fang, C.; Chu, Z. Adhesion of Foamed Asphalt-Aggregate Interface Based on Molecular Dynamics. Mater. Rep. 2021, 35 (z2), 138–144. [Google Scholar]
  24. Akten, E.D.; Mattice, W.L. Monte Carlo Simulation of Head-to-Head, Tail-to-Tail Polypropylene and Its Mixing with Polyethylene in the Melt. Macromolecules 2001, 34, 3389–3395. [Google Scholar] [CrossRef]
  25. Liu, Q.; Yue, H.; Jiang, H.; Chen, C. Molecular Dynamics and Dissipative Particle Dynamics Simulation of TPI/NR Blends. Mater. Rep. 2012, 26, 141–145. [Google Scholar]
  26. Zhuang, C.Q.; Yue, H.; Zhang, H.J.; Liu, Q. Molecular Simulation of the Glass Transition Temperature for Guatta-Percha. J. Funct. Polym. 2010, 23, 409–412. [Google Scholar]
  27. Li, T.R. Molecular Dynamics Simulation Study of the Structure and Mechanical Properties of the Main Components of Cement. Master’s Thesis, Shenzhen University, Shenzhen, China, 2019. [Google Scholar]
  28. Xin, X. Preparation and Characterization of New Trans-polyisoprene Latex. Master’s Thesis, Qingdao University of Science and Technology, Qingdao, China, 2018. [Google Scholar]
  29. Aleksandr, V.; Tommy, L.; Cornelia, B. Thermal Conductivities of Crosslinked Polyisoprene and Polybutadiene from Molecular Dynamics Simulations. Polymers 2021, 13, 315. [Google Scholar]
  30. Fu, Y.Z.; Liu, Y.Q.; Zhang, L.Y. Molecular simulation of the glass transition of different configuration of polypropylene. J. Mol. Sci. 2009, 25, 1–4. [Google Scholar]
  31. Yang, J. Adhesion of Foamed Asphalt—Aggregate Interface Based on Molecular Dynamics Simulation. Master’s Thesis, Dalian Maritime University, Dalian, China, 2022. [Google Scholar]
  32. Zhao, Z.Y.; Zhao, X. Electronic, optical, and mechanical properties of Cu2ZnSnS4 with four crystal structures. J. Semicond. 2015, 36, 52–64. [Google Scholar] [CrossRef]
  33. Li, F.Z. Study on Compatible Mechanism and Properties of Blend Systems from Eucommia Ulmoides Gum and Common rubber. Ph.D. Thesis, Xi’an University of Technology, Xi’an, China, 2019. [Google Scholar]
  34. Tang, C.; Zhang, S.; Zhang, F.Z.; Li, X.; Zhou, Q. Simulation and Experimental about the Thermal Aging Performance Improvement of Cellulose Insulation Paper. Trans. China Electrotech. Soc. 2016, 31, 68–76. [Google Scholar]
  35. Leng, Z.J.; Yue, P.P.; Chen, J.; Hao, X.; Peng, F. Research Progress on Modification and Application of Natural Eucommia ulmoides Gum. Biomass Chem. Eng. 2021, 55, 49–58. [Google Scholar]
  36. Yan, R.F.; Xue, Z.H. The High Elastic Vulcanizate of Gutta-Percha And Its Vulcanizing-Elasticity Mechanisium. China Elastomerics 1991, 3, 12–15. [Google Scholar]
  37. Xu, S.L.; Zhang, Y.Y.; Wang, M. Comparative study of cross-link density determination methods for silicone rubber. China Rubber Ind. 2017, 64, 624–626. [Google Scholar]
  38. Wang, Z.L.; Zhang, Z.Y. Rubber test methods (53). Rubber Plast. Resour. Util. 2015, 3, 32–42. [Google Scholar]
Figure 1. Macromolecular structures of NR and EUG. (a) The chemical structure of NR; (b) the chemical structure of EUG.
Mathematics 11 00964 g001
Figure 2. Schematic diagram of periodic boundary conditions. (a) In the three-dimensional example, molecules can freely traverse the faces of each multidimensional data set; (b) Intermolecular forces adopt the nearest mirror method.
Mathematics 11 00964 g002
Figure 3. The flow chart of MD simulation method.
Mathematics 11 00964 g003
Figure 4. Molecular structure fluxes of EUG.
Mathematics 11 00964 g004
Figure 5. Geometrically optimized EUG model.
Mathematics 11 00964 g005
Figure 6. Single chain molecular structure of EUG.
Mathematics 11 00964 g006
Figure 7. MS models of EUG with different polymerization degrees. (a) EUG model with aggregation degree of 5; (b) EUG model with aggregation degree of 10; (c) EUG model with aggregation degree of 15; (d) EUG model with aggregation degree of 20; (e) EUG model with aggregation degree of 25; (f) EUG model with aggregation degree of 30; (g) EUG model with aggregation degree of 35; (h) EUG model with aggregation degree of 40; (i) EUG model with aggregation degree of 45; (j) EUG model with aggregation degree of 50.
Mathematics 11 00964 g007aMathematics 11 00964 g007b
Figure 8. Density of EUG models with different degrees of aggregation.
Mathematics 11 00964 g008
Figure 9. MD simulated and experienced values of solubility parameters for different degrees of polymerization of EUG.
Mathematics 11 00964 g009
Figure 10. Vulcanized dulcimer chains with different cross-linking degrees. (a) SEUG molecular chain model with 0% cross-linking degree; (b) SEUG molecular chain model with 20% cross-linking degree; (c) SEUG molecular chain model with 40% cross-linking degree; (d) SEUG molecular chain model with 60% cross-linking degree; (e) SEUG molecular chain model with 80% cross-linking degree; (f) SEUG molecular chain model with 100% cross-linking degree.
Mathematics 11 00964 g010
Figure 11. SEUG discrete system consisting of 100 SEUG monomers cross-linked with C-S-S-C bonds (DC = 20%).
Mathematics 11 00964 g011
Figure 12. Specific volume versus temperature for each system model.
Mathematics 11 00964 g012
Figure 13. Tg of SEUG with different degrees of cross-linking.
Mathematics 11 00964 g013
Figure 14. Diagram of particle radial distribution function.
Mathematics 11 00964 g014
Figure 15. Intramolecular radial distribution functions of SEUG with different degrees of cross-linking.
Mathematics 11 00964 g015
Figure 16. Intermolecular radial distribution functions of SEUG with different degrees of cross-linking.
Mathematics 11 00964 g016
Figure 17. Relationship between cross-linking degree and mechanical parameters: (a) relationship between cross-linking degree and bulk modulus; (b) relationship between cross-linking degree and shear modulus; (c) relationship between cross-linking degree and elastic modulus; (d) relationship between cross-linking degree and Poisson ratio; (e) relationship between cross-linking degree and C12-C44; (f) relationship between cross-linking degree and K/G.
Mathematics 11 00964 g017
Figure 18. The relationship between the content of S and tensile strength.
Mathematics 11 00964 g018
Figure 19. Relationship between the content of S and cross-link density.
Mathematics 11 00964 g019
Table 1. Solubility parameters of EUG with a polymerization degree of 30.
PolymerDegrees of PolymerizationNetMassδMD
(J/cm3)1/2
δLit.
(J/cm3)1/2
δtest
(J/cm3)1/2
EUG302045.5916.52516.20~17.016.50
Table 2. Mechanical properties of SEUG model cross-linked with different cross-linking degrees.
DC Content (%)C12
(GPa)
C44
(GPa)
C12-C44
(GPa)
K
(GPa)
G
(GPa)
E
(GPa)
νK/G
02.705 1.724 0.981 3.092 1.724 4.501 0.305 1.793
203.150 1.930 1.220 3.495 1.930 5.057 0.310 1.811
403.543 1.950 1.593 3.885 1.950 5.158 0.323 1.992
603.758 2.030 1.728 4.086 2.030 5.378 0.325 2.013
804.540 2.041 2.499 4.867 2.041 5.491 0.345 2.384
1003.524 2.010 1.514 3.855 2.010 5.300 0.318 1.918
Table 3. Basic formula of SEUG.
EUGSZinc OxideStearic Acid
(ZA)
Accelerator
CZ
Nano-SilicaNaphthenic OilGummaron Resin
100Variants 4.51.51204.54.5
units: phr.
Disclaimer/Publisher’s Note: The statements, opinions and data contained in all publications are solely those of the individual author(s) and contributor(s) and not of MDPI and/or the editor(s). MDPI and/or the editor(s) disclaim responsibility for any injury to people or property resulting from any ideas, methods, instructions or products referred to in the content.

