1. Introduction
Darwinian theory about the origin of species [
1] suggests that there is competition for existence between organisms, the fittest ones will survive, while unfit species tend to become extinct; that is, competition plays a central role in biological evolution and drives the development of species from a low to a high level, and also from simple to complex forms. However, in real world scenarios, there is not always a competitive relationship between species and cooperation is also a very common behavior [
2,
3]. Such behaviour includes cooperative actions during the migration of birds, collaborative behaviors during the process of moving stones in ants, and coordinating acts during hunting behaviors for some members of African tribes. Therefore, how to understand ubiquitous cooperating phenomena in nature and human society is crucial and has become one of the top 25 scientific problems confronting us in the twenty-first century [
4].
At present, evolutionary game theory (EGT) provides a powerful mathematical framework for us to probe into the evolution of cooperation [
5,
6,
7]. In evolutionary game theory, game players are not assumed to be totally rational individuals who can update or change their strategy choices through imitating other neighboring players based on the specific rules; thus, EGT offers a brand new perspective on the evolution of cooperation between agents. To mimic different conflicts or circumstances faced by players, various game models can be embedded into the EGT in order that the evolution of cooperation can be deeply analyzed. For example, typical two-player game models, including the prisoner’s dilemma game (PDG) [
8,
9,
10,
11,
12,
13,
14] and the snowdrift game (SDG) [
15], are often used to resolve social dilemmas that individuals may confront under realistic conditions. In addition, how to deploy or distribute the public resource is also a significant issue for social governance. Hamburger [
16] formally proposed the N-person prisoner’s dilemma model in 1973, where the public goods game (PGG) [
17,
18] is also utilized. For some realistic or specific environments, other game models have also been applied to solve real problems, such as the boxed-pigs game [
19], the chicken game [
20], the cake-sharing game [
21], the pirate game [
22] and others.
To be specific, Nowak declared that the main mechanisms to enhance the evolution of cooperation can be summarized in terms of five rules, which include kin selection, direct or indirect reciprocity, group selection, and spatial or network reciprocity [
23]. Among them, beyond well-mixed populations, Nowak and May [
24] originally combined the spatial lattice with EGT to investigate collective cooperation behavior based on the classic PDG. They found that, in the spatial lattice, cooperative behaviors can exist since many cooperative participants can form close clusters to defend the invasion of defectors, thus promoting the spread of cooperative behaviors. As a further step, Nowak et al. reviewed related progresses in the field of EGT and focused on studies in spatially structured populations with a finite size [
25]. Subsequently, various network topologies, such as the small-world network [
26], scale-free network [
27], random network [
28] and interdependent network [
29], were combined with evolutionary game theory to explore how cooperation can be evolved within a networked population. In addition, some specific mechanisms for understanding the role of various factors and uncertainties in the evolution of cooperation have also been proposed by many scholars, including reputation [
30,
31,
32,
33,
34], noise interference [
35], punishment [
36,
37,
38,
39,
40], reward [
41,
42], interaction diversity [
43,
44,
45,
46] and others.
In reality, gaming cost has always been an indispensable factor for players during strategy selection. As an example, in the two-person donation game [
47], the cooperator pays the cost
c to bring the payoff
b to their opponent, so the payoff matrix of the donation game is
in the snowdrift game, the cooperator pays the cost
c of shoveling snow, while the defector does not pay the cost, and the corresponding payoff matrix is
in the public goods game, the cooperator pays the cost
c to the public pool for the collective benefit, where
N denotes the number of all individuals in the public goods game and
means the number of cooperators within this PGG group, and then the payoff obtained by the defector is
, while the cooperator’s payoff is
, which is smaller than that of the defector. The above-mentioned costs are all necessary ones encountered inside the game and these costs are only paid by cooperators. However, does there exist any cost for players to participate in the game process outside the game? To address this issue, Masuda [
48] put forward a kind of game participation cost, such as in the PDG where two players interact. As long as they participate in this game, a participant will bear a game participation cost regardless of whether the participant is a cooperator or a defector. Their results indicate that the participation cost is irrelevant in homogeneous networks, including the well-mixed population and regular lattice, but, in heterogeneous networks, the participation cost will destroy the reciprocity of networks. Subsequently, Jun and Atsuo [
49] re-examined the results presented by Masuda [
48], and found that the influence of participation cost on transmission dynamics in heterogeneous networks is not the same as that in [
48] and that participation cost is helpful to cooperation in some specific cases. For instance, the cost of game participation contributes to network reciprocity in scale-free networks to a larger average degree in the weak prisoner’s dilemma.
In the past, various strategy imitation rules have been studied. An extensively adopted strategy updating method is the Fermi updating rule, where strategy update is determined by, and only by, payoff or fitness comparison between a pair of players in the current game round. In the Fermi rule, it is shown that an inferior strategy with lower benefit is more willing to learn from a superior strategy within the system. However, it seems one-sided and inaccurate to regard this strategy as an inferior strategy or a superior strategy based only on the benefits to an individual in a certain round. To utilize more information during previous game rounds, Lu et al. [
50] studied the influence of memory effects on the evolution of cooperation in the spatial prisoner’s dilemma game and found that a moderate memory length was the most conducive to the emergence and evolution of cooperation. Furthermore, Attila and Matjaž [
51] used a Fermi-like update rule to discuss the evolution of cooperation in the prisoner’s dilemma in a lattice network, where they performed payoff or fitness comparison by considering the average gains of individuals relative to their own neighbors who shared the same strategies with their opponents. It was found that this novel payoff or fitness comparison significantly improved the level of cooperation within the population. To more realistically simulate the game decisions of players, we try to combine the abovementioned mechanisms to further enhance the level of cooperation, and propose an improved prisoner’s dilemma game model on the regular lattice to investigate the evolution of cooperation, where any individual not only relies on the original Fermi update rule to update their strategies, but also on the new Fermi update rule with a complementary probability. Under this improved Fermi rule, thestrategy update for an agent depends on the average payoff among some selected players within the population. In addition, any individual needs to pay a specific cost if they want to obtain this information. We not only thoroughly analyze the influence of complementary probability on evolutionary dynamics, but also discuss, in depth, the impact of information acquired by individuals and the acquisition cost on evolutionary dynamics.
The rest of this paper is organized as follows: Firstly, we introduce our model in detail in
Section 2. Then, in
Section 3, many numerical simulations undertaken are described and the experimental results are analyzed and carefully explained. Finally,
Section 4 summarizes the main contributions of this work and presents promising outlooks for the future.
2. Game Model
Our model starts from a regular lattice satisfying cyclic boundary conditions. At the beginning, players are randomly distributed onto each intersection point of the lattice,. Then half of them are randomly selected and set as cooperators (C, represented by the transposition of column vector ), while the rest are set as defectors (D, represented by the transposition of column vector ).
In the model, each player will play the PDG with their neighbors. For simplicity, we use the so-called weak prisoner’s dilemma game [
24] as the baseline game model. That is to say, the payoff obtained by mutual cooperation between two players is
and the payoff obtained by mutual betrayal is
. If one defecting individual meets a cooperative component, the former will get the payoff to defect
T, while the latter will obtain the sucker’s payoff
. Thus, the only variable is
T in the game model and the payoff matrix can be written as Equation (
1):
Any focal player
x will interact with their four nearest neighbors (that is, von Neumann neighbors) and calculate the game payoff according to Equation (
1). The total income of the focal player
x is then given by the following Equation (
2):
The system evolves in terms of Monte Carlo simulations until the system arrives at an evolutionary stable state. A complete Monte Carlo step includes the following sub-steps: (i) a randomly selected individual
x, whose strategy is
, plays the weak PDG with their von Neumann neighbors and computes the total payoff
determined by Equation (
2); (ii) the focal individual
x will randomly select an individual
y with strategy
from their nearest neighbors as the imitating object to perform the strategy update. If these two players own the same strategy, player
x will keep the current strategy, otherwise, player
x will adopt player
y’s strategy with the following Fermi-like probability [
52],
where
and
represent the fitness of players
x and
y, respectively,
K denotes the extent of irrationality during the strategy update, which is a tunable parameter in the model, and
K is set to
without losing the generality. The Fermi-like function indicates that game agents are more willing to imitate the strategies of neighbors with higher fitness when updating their own strategies. After an individual completes the strategy update, they randomly select another individual to update their strategy again until all individuals complete the strategy update once.
As indicated in Equation (
3), during the strategy update, players
x and
y need to first calculate their fitness
and
. In order to obtain
and
, each agent will decide whether to spend a certain cost
(
n indicates the number of players that player
x has visited within the population, and
c is the cost that individual
x has to pay for each individual’s information) with the probability of
q to obtain the income information of other individuals in the population. When
, player
x will definitely refer to the average income of individuals with the same strategy as
y in the system when updating the strategy. When
, player
x only refers to the income of their neighbor
y to update their current strategy. At this time, the model is reduced to the original prisoner’s dilemma model. In the model, the focal player
x needs first to determine whether they will visit the strategies and payoffs of other
n random individuals in the whole system with the probability of
q. If the individual
x does this, they learn the strategy of
y with Equation (
3), and then
and
are computed according to the following equation
where
represents the average income of the individuals with the same strategy as
y among
n individuals acquired by
x,
is the game income of
x at this game round,
n indicates the number of players that player
x has visited within the population,
c is the cost that individual
x has to pay for each individual’s information, and
represents the total cost that individual
x has to pay. Obviously, player
x does not visit the information of other individuals with the probability of (
), and, in this case,
is the game income of player
x in the current round and
is the game income of player
y. Here, the maximum value of
q is set to
in order that a battle of the sexes is avoided.
Taking together, a full Monte Carlo step includes the following typical processes: (i) randomly selecting a focal individual and calculating their own payoff and those of their opponent, (ii) judging whether this individual obtains the information of other individuals, then (iii) calculating the fitness of the individual and their opponent through Equation (
4), and, finally, (iv) updating the individual’s strategies through Equation (
3). For the Monte Carlo simulation (MCS) mentioned in this paper, the total number of simulation steps is set to 10,000, the lattice size is set to
, and
denotes the fraction of cooperators at the stationary state, which is averaged over the final 2000 Monte Carlo steps after the system reaches the steady state. In order to reduce the error and the non-contingency of the experiment, all simulations are conducted using at least 10 independent runs and the final results are obtained by averaging over 10 independent runs.
3. Simulation Results
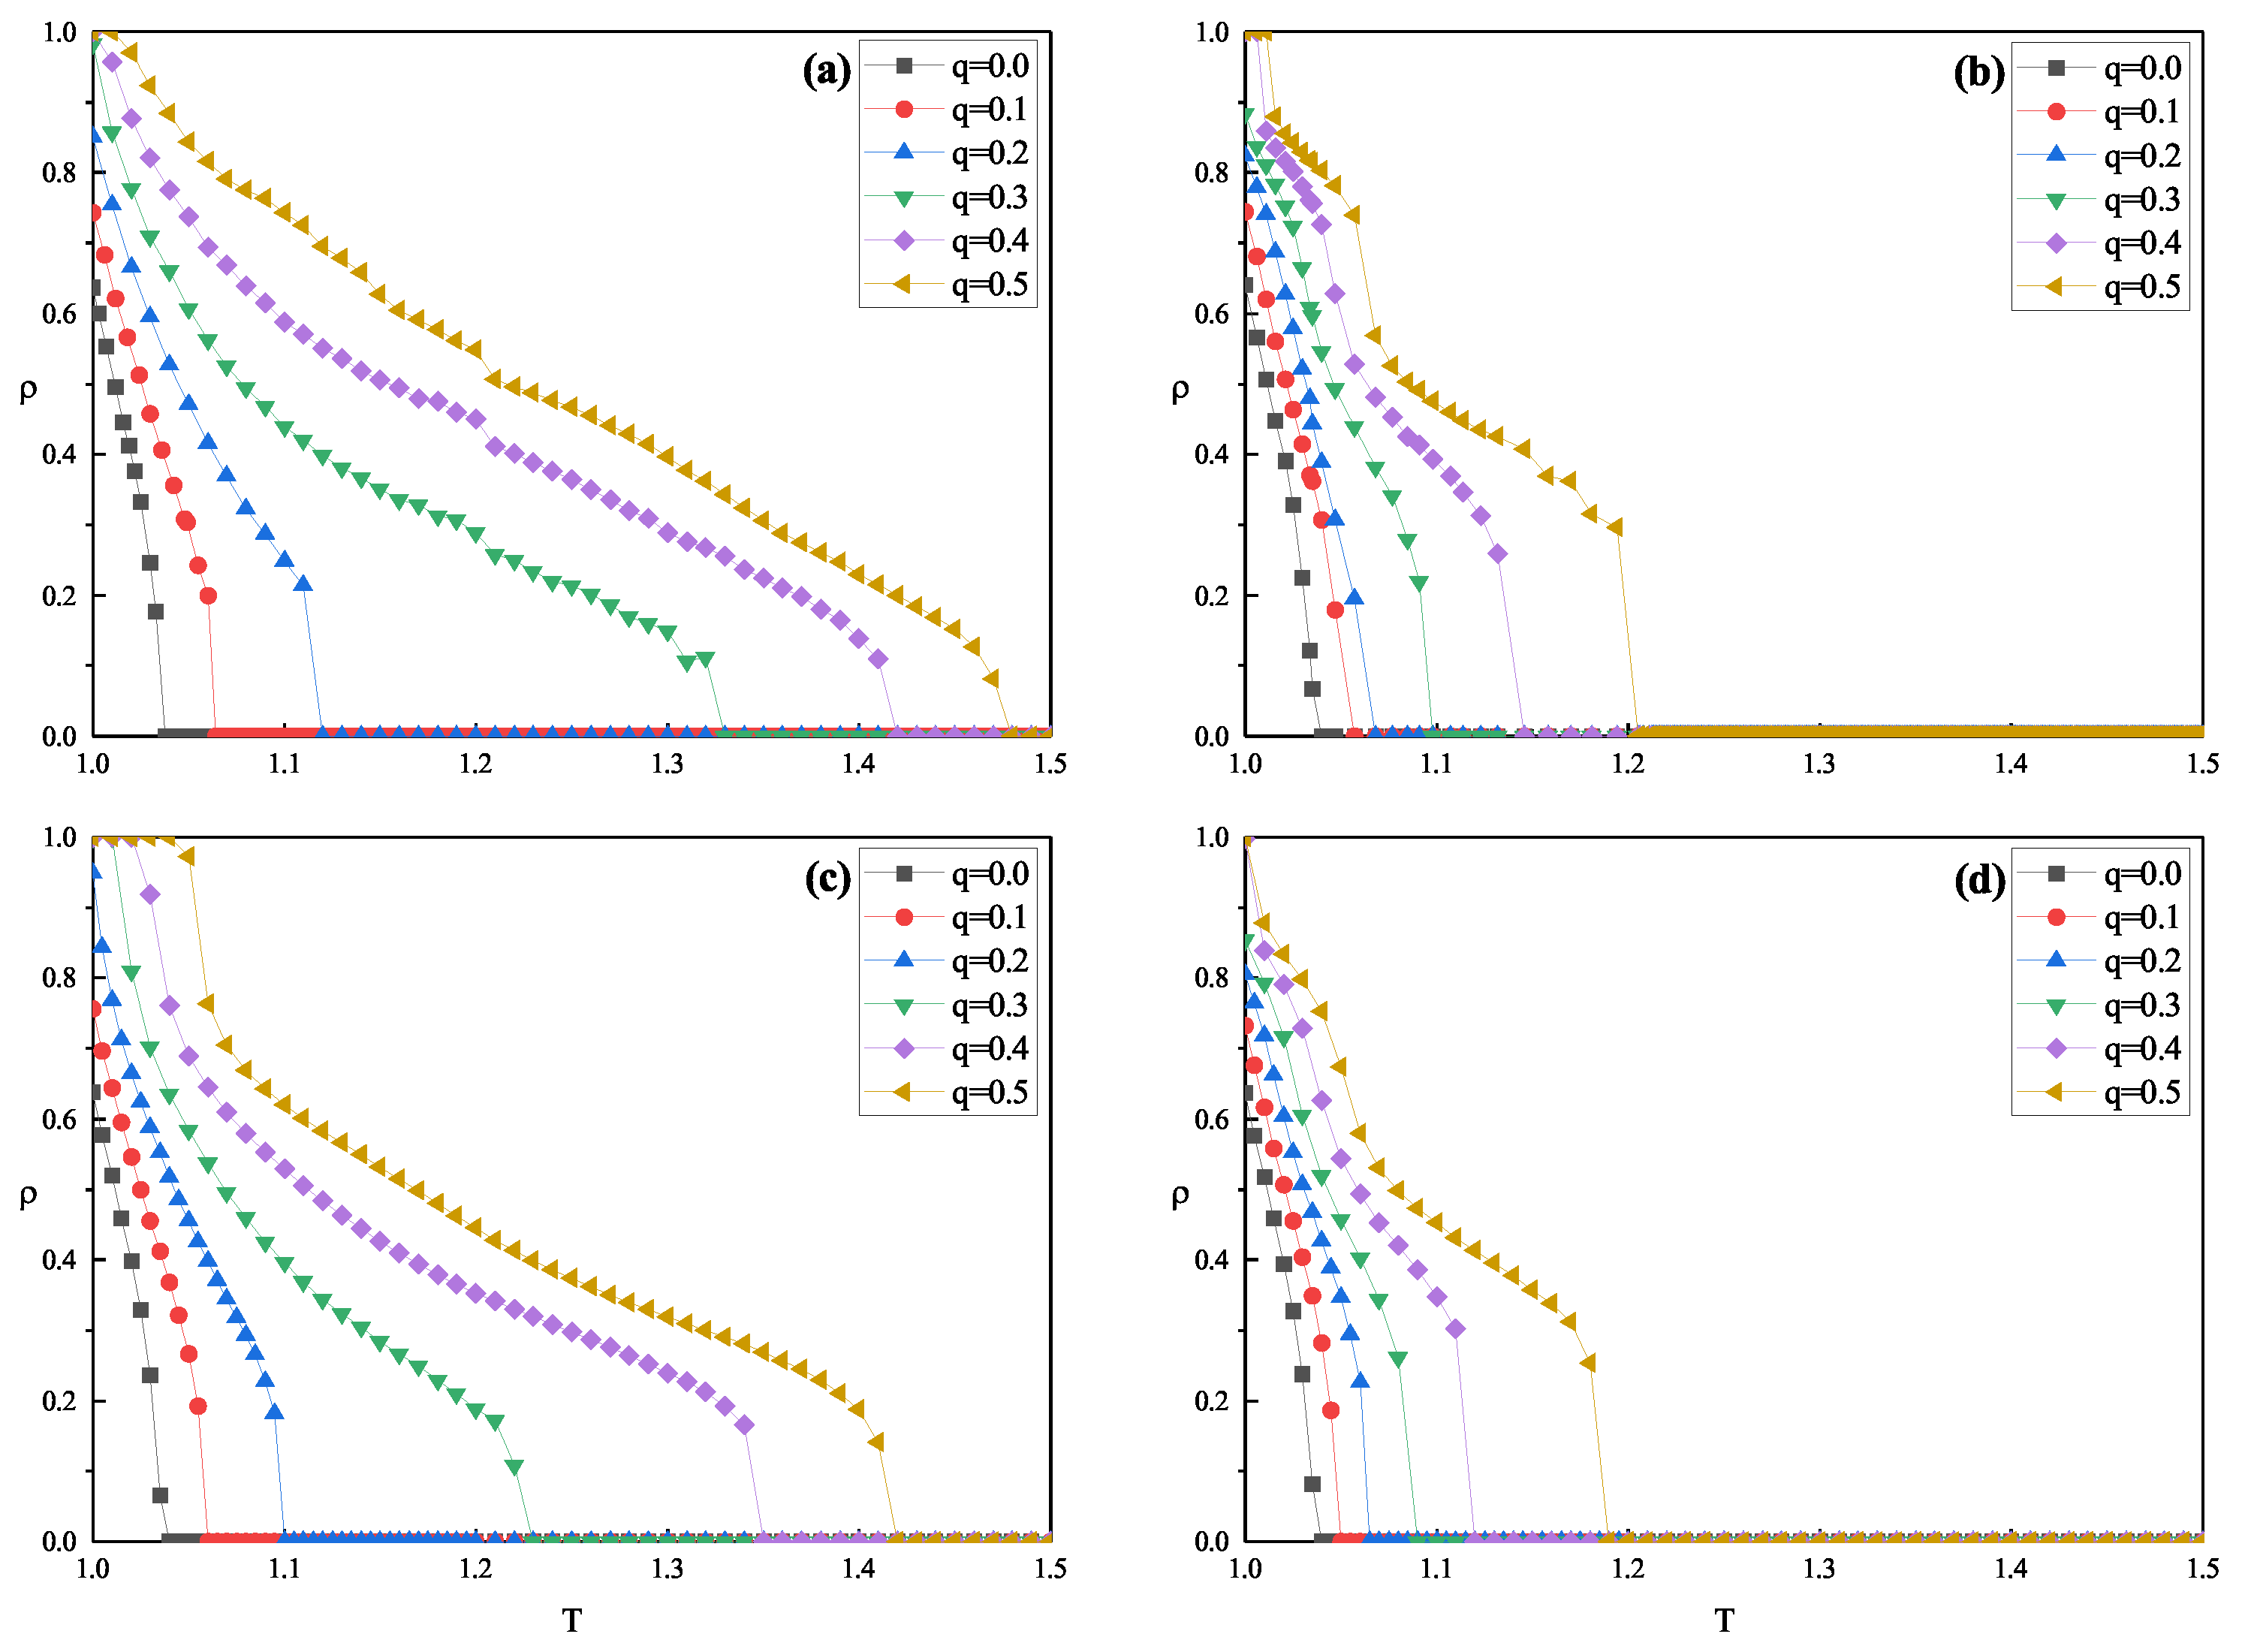
In order to explore the impact of paid acquisition of information on the evolution of cooperation, we first discuss the role of different information acquisition probabilities
q. As shown in
Figure 1, we draw the evolution of
as a function of the temptation to defect
T for different values of
q, in which the horizontal axis indicates the temptation to defect
T and the vertical axis denotes the level of cooperation
at the stationary state. It can be clearly seen from the four panels in
Figure 1 that, for specific values of
n and
c, the fraction of cooperators
will also increase as the value of
q increases. As shown in
Figure 1a, when
, this indicates that individuals update their strategies only according to their own and neighbors’ gains, and the system returns to the original prisoner’s dilemma model, where the critical temptation to defect is
for
. If
, when the player updates their strategy, they can obtain the information of other individuals in the population with the probability of
q; it can be observed that
will increase as the other parameters are kept constant and
q is continuously increased. As an example, in this case, the system will enter the fully defective status only when
; that is, the critical
is up to
. In addition, when
n and
q are fixed, the cost to acquire the payoff information becomes larger (e.g.,
), and the threshold leading to the full extinction of cooperation (
) becomes higher, which can be easily observed by comparing panels (a) and (b), or comparing panels (c) and (d). Nevertheless, introducing paid access to the payoff information for other players can greatly enhance the evolution of cooperation.
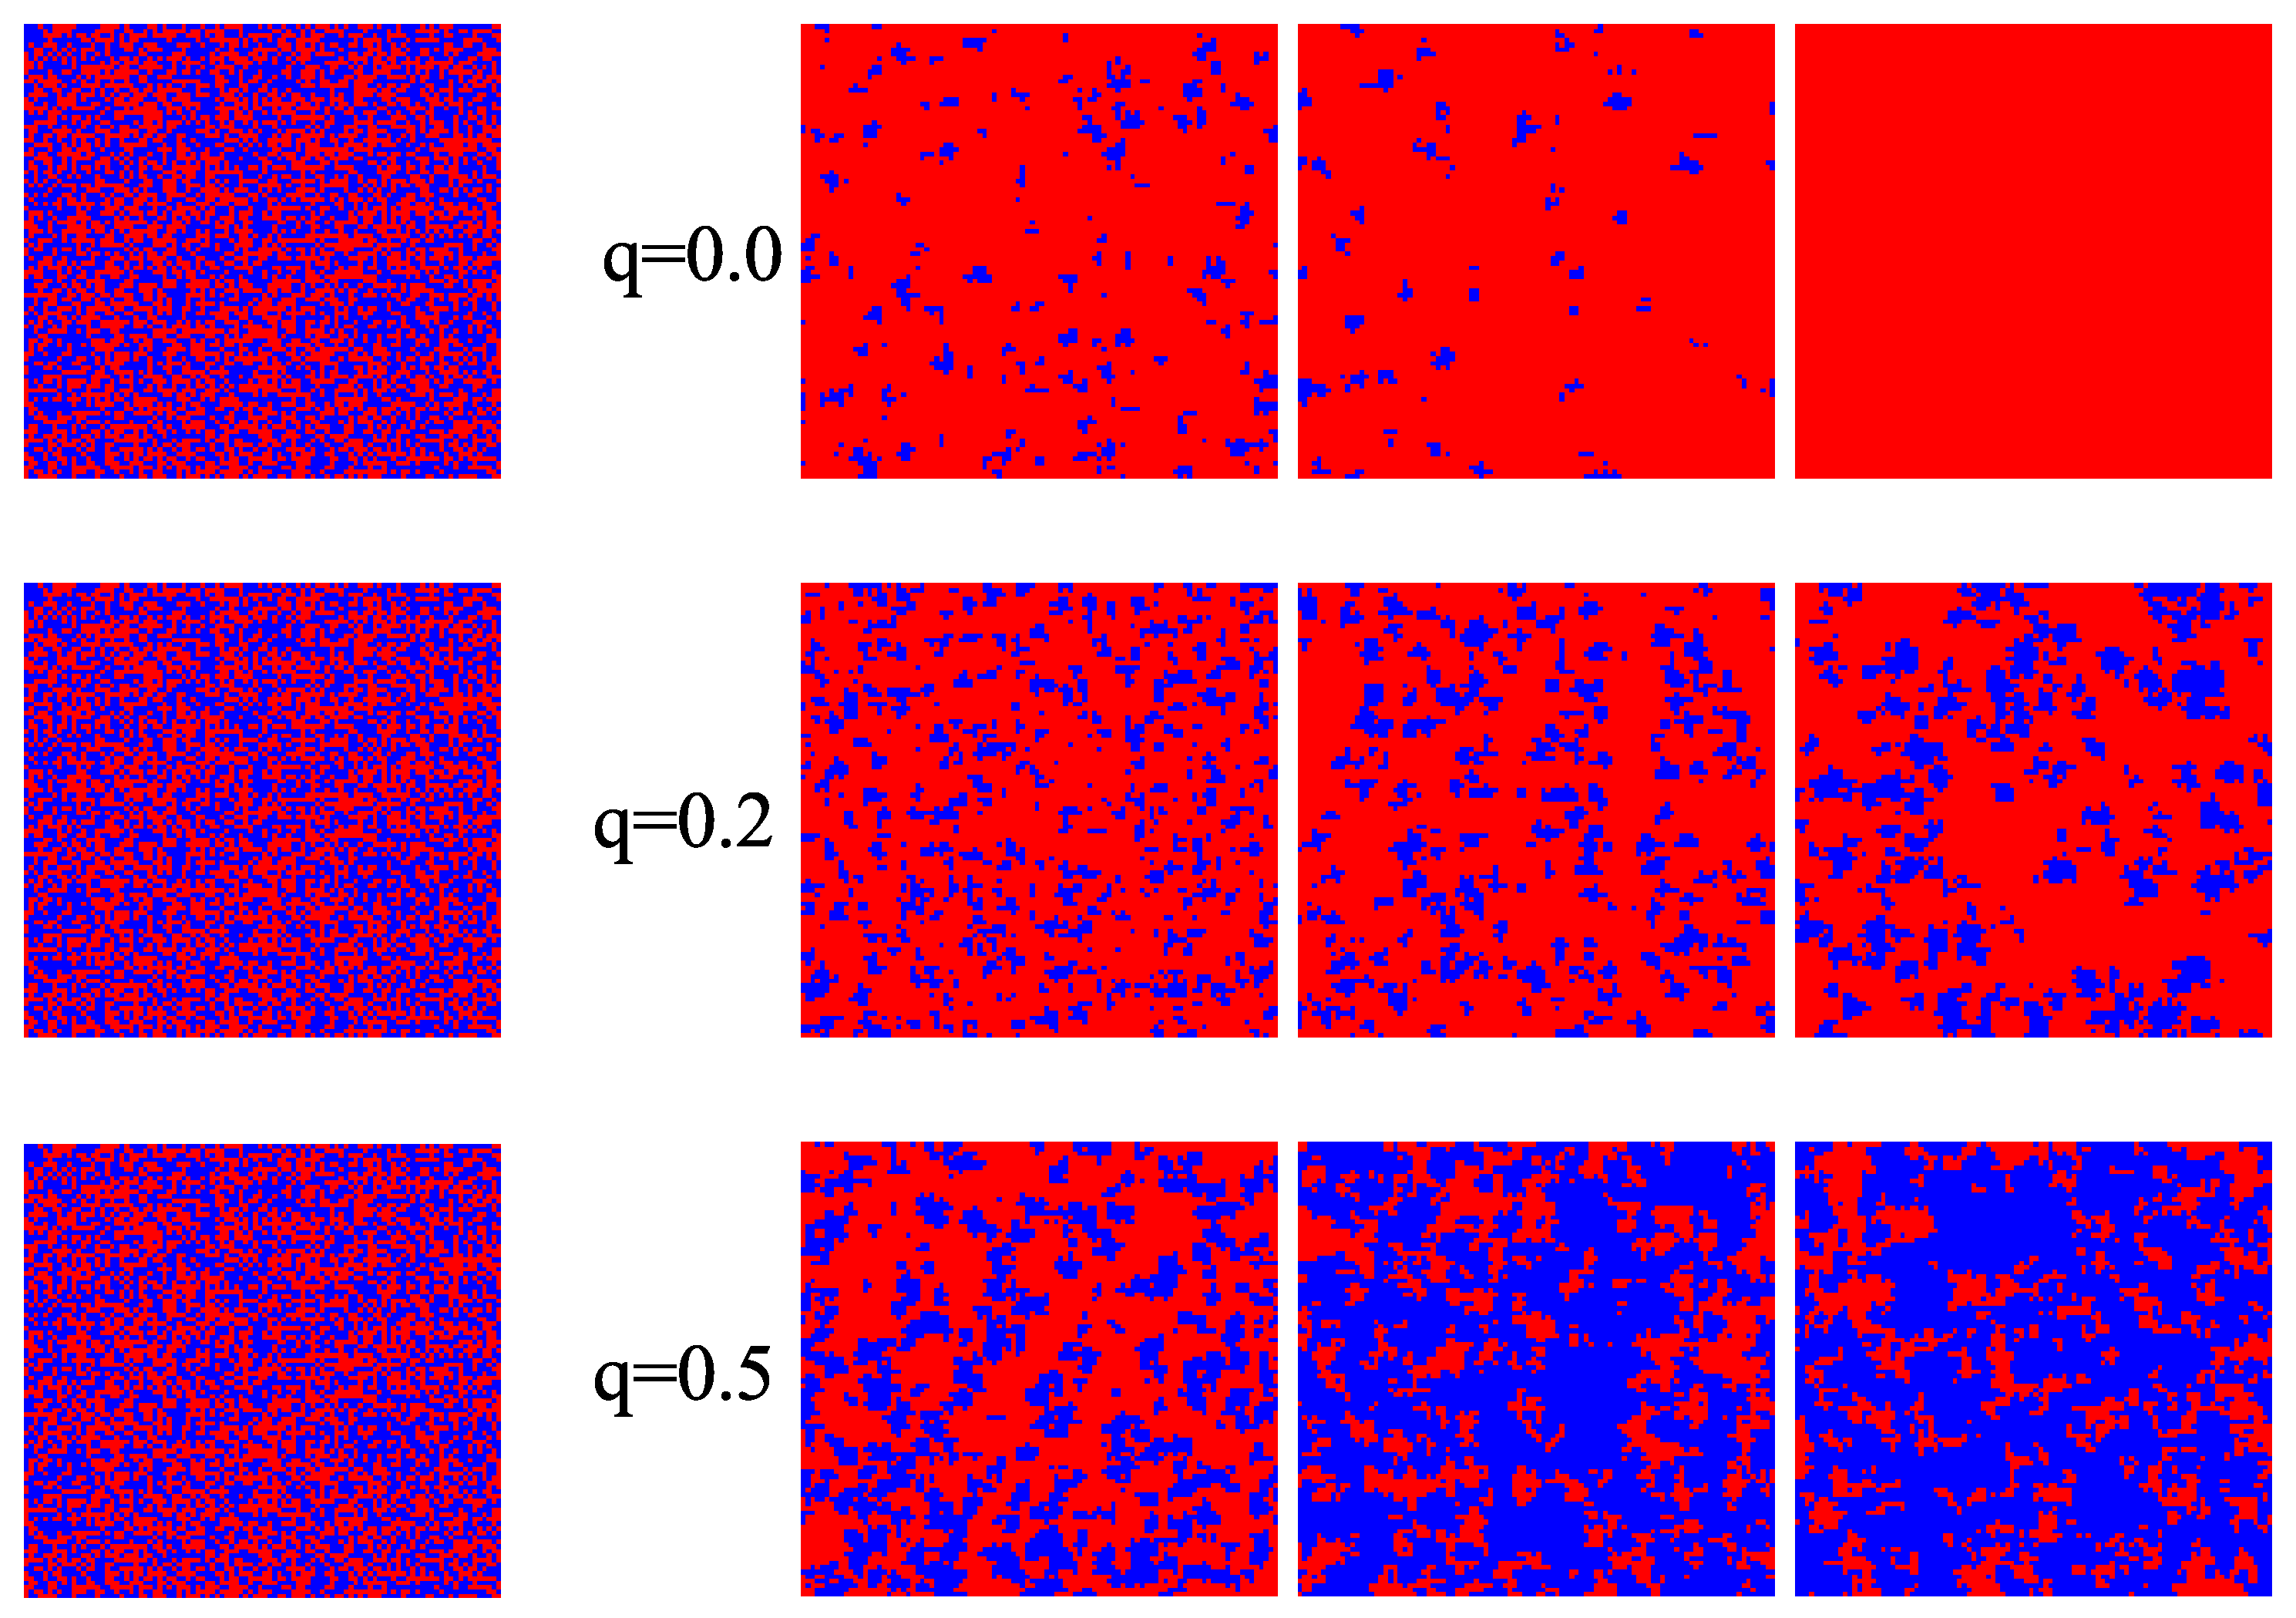
As a further step,
Figure 2 and
Figure 3 show characteristic snapshots of the strategy distribution for different values of
q at time-steps
, 10, 1000 and 10,000, respectively. Among them, cooperators and defectors are randomly placed onto the lattice intersection at the initial step
, as shown in the leftmost panel of
Figure 2. In the right region of
Figure 2, from top to bottom,
q is set to be 0,
and
, respectively. In each row of panels, the snapshot denotes the strategy distribution at
, 1000 and 10,000, respectively. By comparing the rightmost panels, it can be observed that the cooperators can gradually organize into compact clusters to resist the invasion of defectors as
q increases; thus, the fraction of cooperators
becomes higher and higher. The current results are also consistent with those in
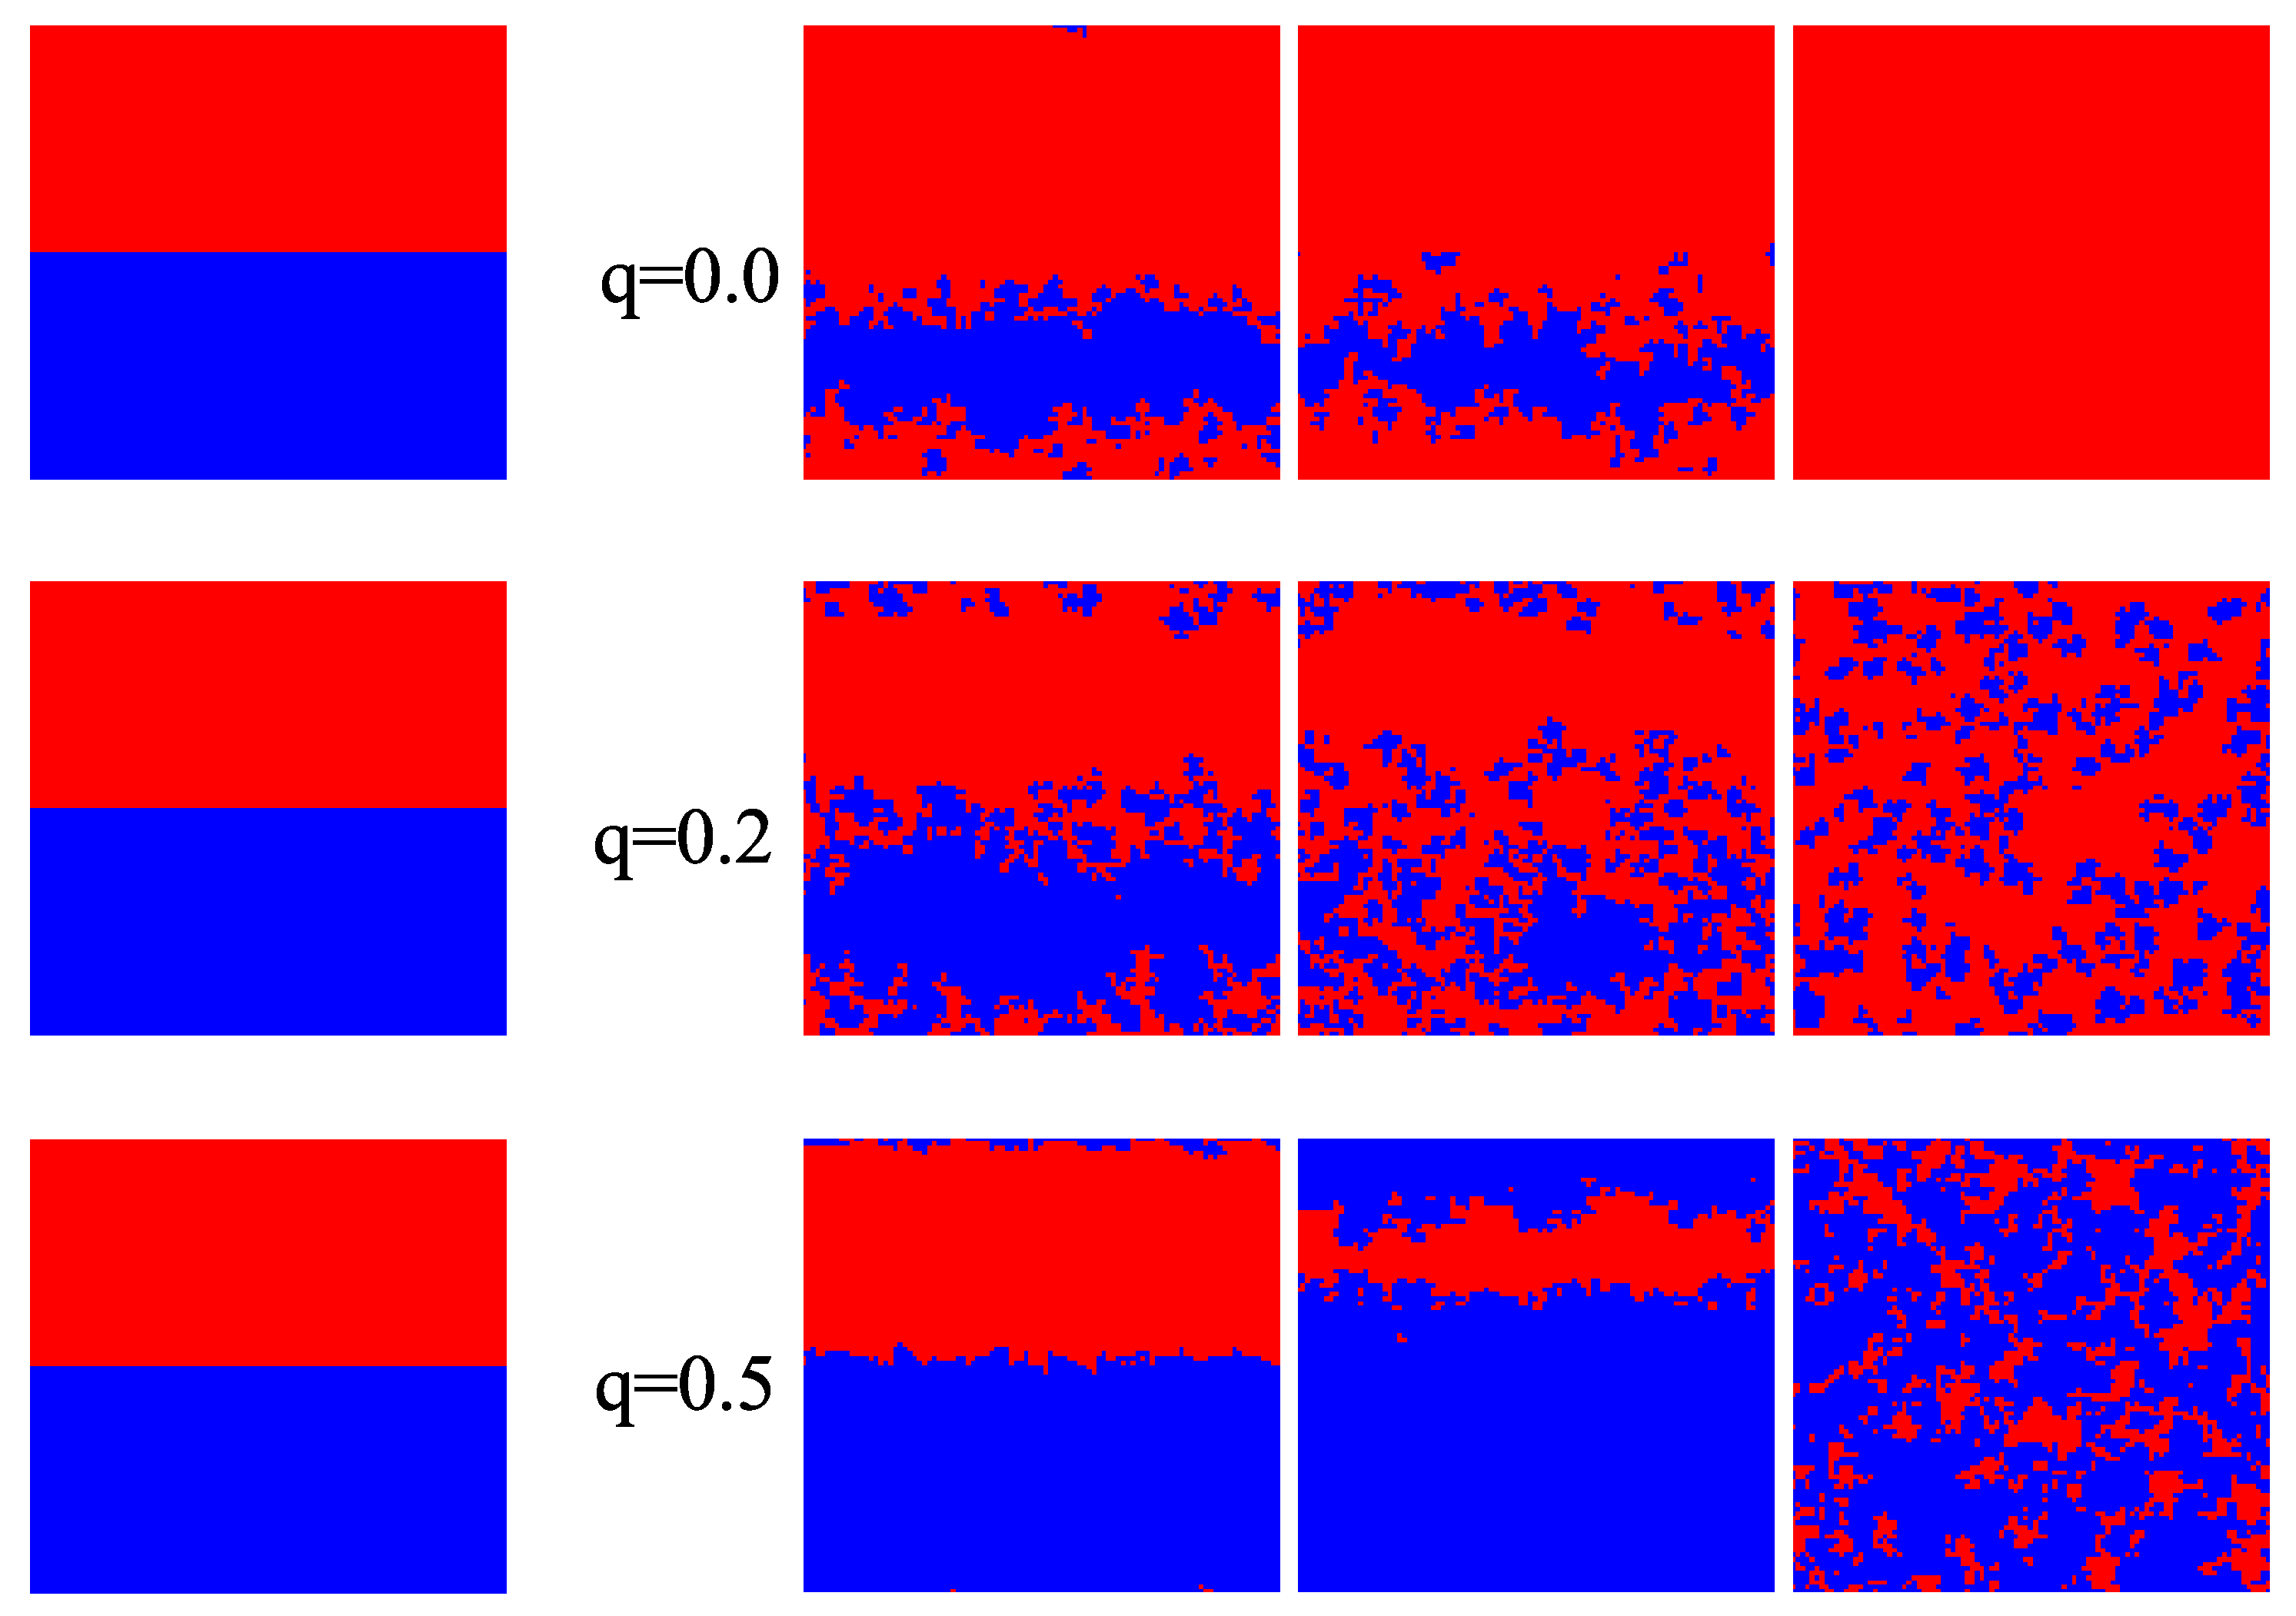
Figure 1. Meanwhile, in
Figure 3, we present the corresponding snapshots under the same parameter setup, where the only difference is the initial strategy distribution. As shown in the leftmost panel in
Figure 3, all defectors are arranged onto the upper panel, while all cooperators are distributed onto the lower panel; with respect to the evolution of the characteristic snapshots, the results are qualitatively similar to those in
Figure 2. According to
Figure 2 and
Figure 3, the difference in initial strategy distribution only delays the invasion of defection or the formation of cooperative clusters, but has no effect on the final distribution of defectors and defectors within the population.
In particular, we re-examine the evolution of cooperation to check the impact of
n and
c. By comparing panel (a) and (c) in
Figure 1, it is found that, for
, the cooperation rate
is obviously improved when compared to that obtained for
, and the critical threshold for cooperators to be fully extinct
is also increased. In order to further explore the influence of
n on the level of cooperation, we set the probability
q of information acquisition to be a fixed value of
, and the cost
c of acquiring a single piece of information to
. When
n is different, the fraction of cooperators at the stationary state
is pictured as a function of
T, as shown in
Figure 4. Here, for
, the model is equivalent to the traditional prisoner’s dilemma model. With increase in
T, the cooperation rate drops rapidly; the system reaches full defection status when
. It can be seen from
Figure 4 that, when
n increases from 0 to 4, the stationary level of cooperation obviously increases and that the critical threshold leading the extinction of cooperators (
) also increases from
to
. With further increase in
n, the cooperation rate also increases and, finally,
renders the optimal environments to foster the emergence of cooperation, where
is also increased up to
. In fact, if
, when individuals update their strategies, they need to first pay a certain cost
to obtain the information for other
n individuals within the population. Then they utilize the information they have obtained to make the decision about whether they will adopt the strategy of an imitated object. When compared to the traditional PDG model, the current method could be helpful for the spread of prosocial behaviors in the population. It is obvious that, with increase in
n, the more the information individuals obtain from the system, the stronger the ability of collaborators to resist invasion by traitors.
However, as a result of the cost to obtain the information, too large a value of
n leads to a higher cost to acquire related information to help the decision; then it is found, as shown in
Figure 4, that the cooperation rate decreases rapidly with increase in
b after
. Compared with that for
, the overall cooperation rate
becomes lower and lower under the same temptation to defect for
or
. Especially for
, the stationary ratio of cooperators
decreases much more rapidly and the cooperators tend to be extinct even if
T is just beyond
, where the value of
is even smaller than that for
. Furthermore, since it costs a certain amount to obtain information, as mentioned above, this means that the cost of obtaining information becomes higher and higher as
n increases for a fixed cost (e.g.,
). When the value of
n is too large and exceeds a certain threshold, this will lead to the fact that the individual’s game income is not enough to pay the cost to obtain the information for other individuals. Therefore, when the value of
n is too large, this mechanism for paid access to promote cooperation will weaken or even disappear.
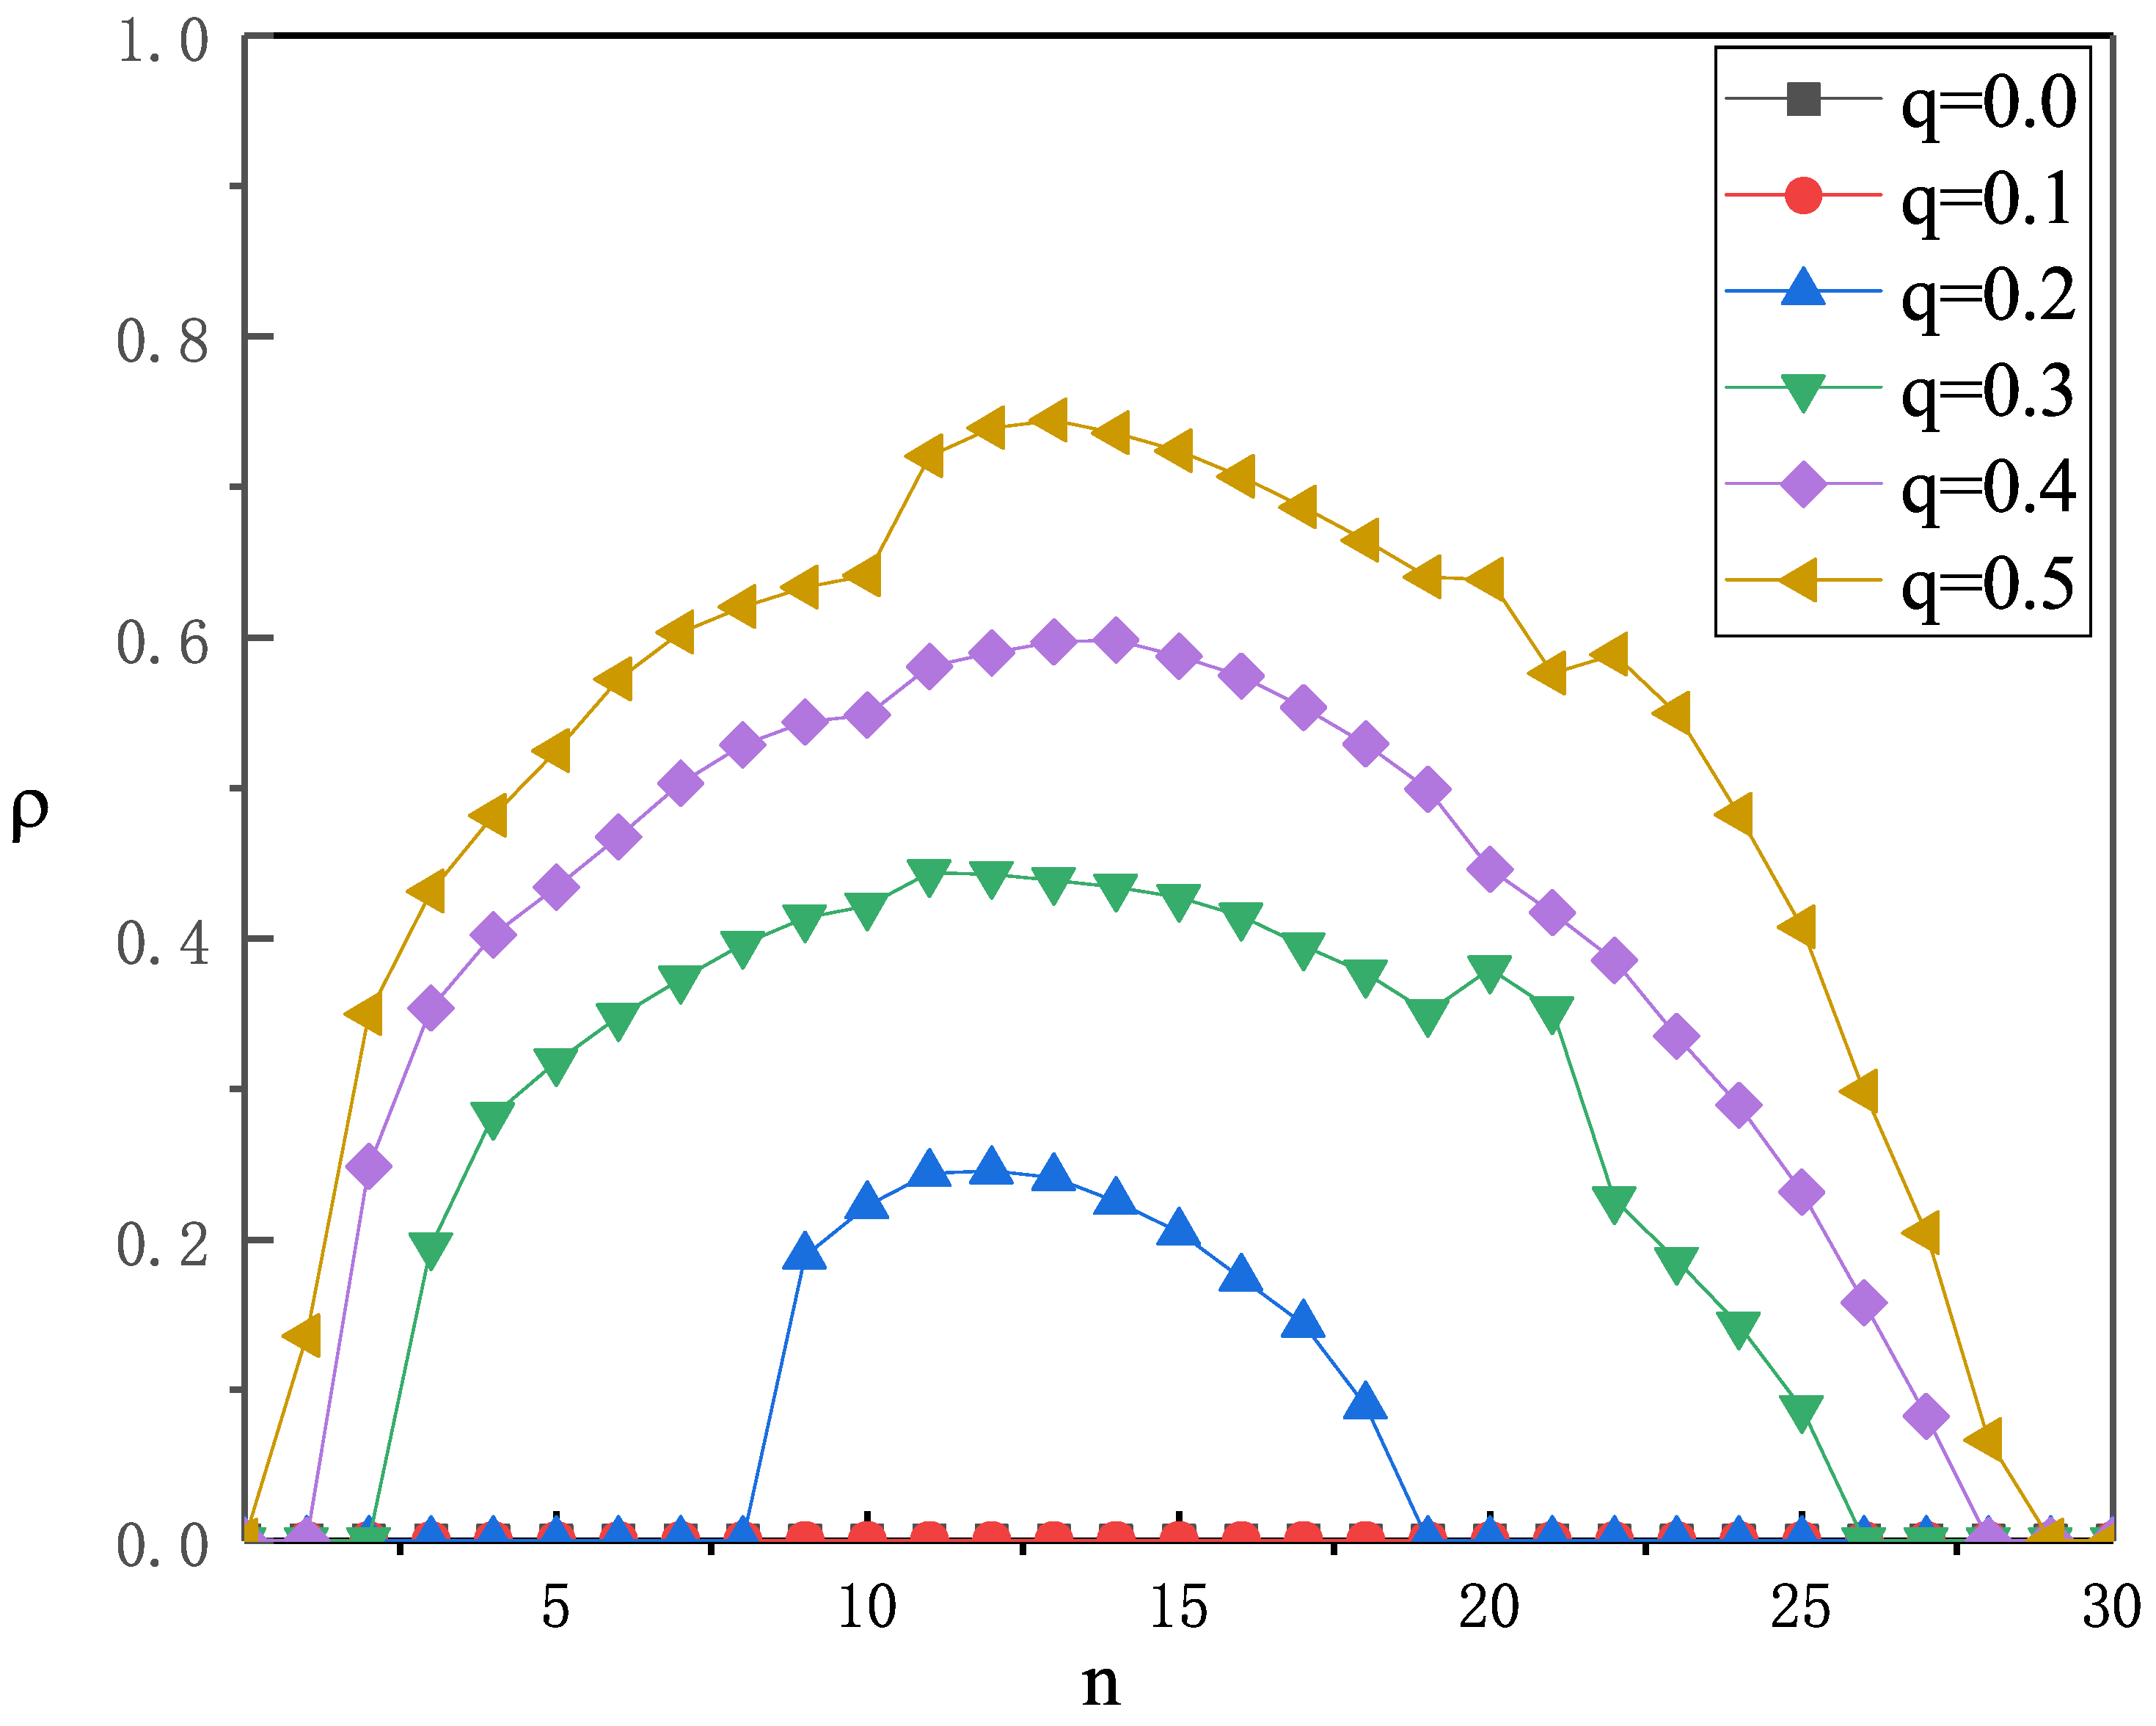
Next, so as to search for the optimal number of visited individuals for the decision of a focal player,
Figure 5 shows the stable fraction of cooperators as a function of the number of visited ones (
n) when the temptation to defect
and the information cost
are fixed. No matter what the acquisition probability
q is, with increase in the value of
n, the overall cooperation rate of the system presents almost a bell-shaped curve. However, in Attila and Matjaž’s [
51] work, the level of cooperation could be increased if individuals are able to collect information from a larger range and the stationary fraction of cooperators would saturate after a certain range is exceeded. At first, when the number of referenced individuals
n gradually increases from 0, when the strategy is updated, individuals can get more information from the population. The cost at this time is within the range that individuals can afford; thus, the overall level of cooperation is increasing and finally reaches the maximum value when
n is up to 12 or 13. After that, with continuous increase in
n, the focal player needs to bear more costs if they intend to obtain more information, which means that some individuals’ incomes are not enough to support the cost of obtaining the information, causing the total group cooperation level to decline. Eventually, after
n exceeds a certain range, all the individuals’ incomes are not enough to support the information cost, which leads, finally, to full defection within the population.
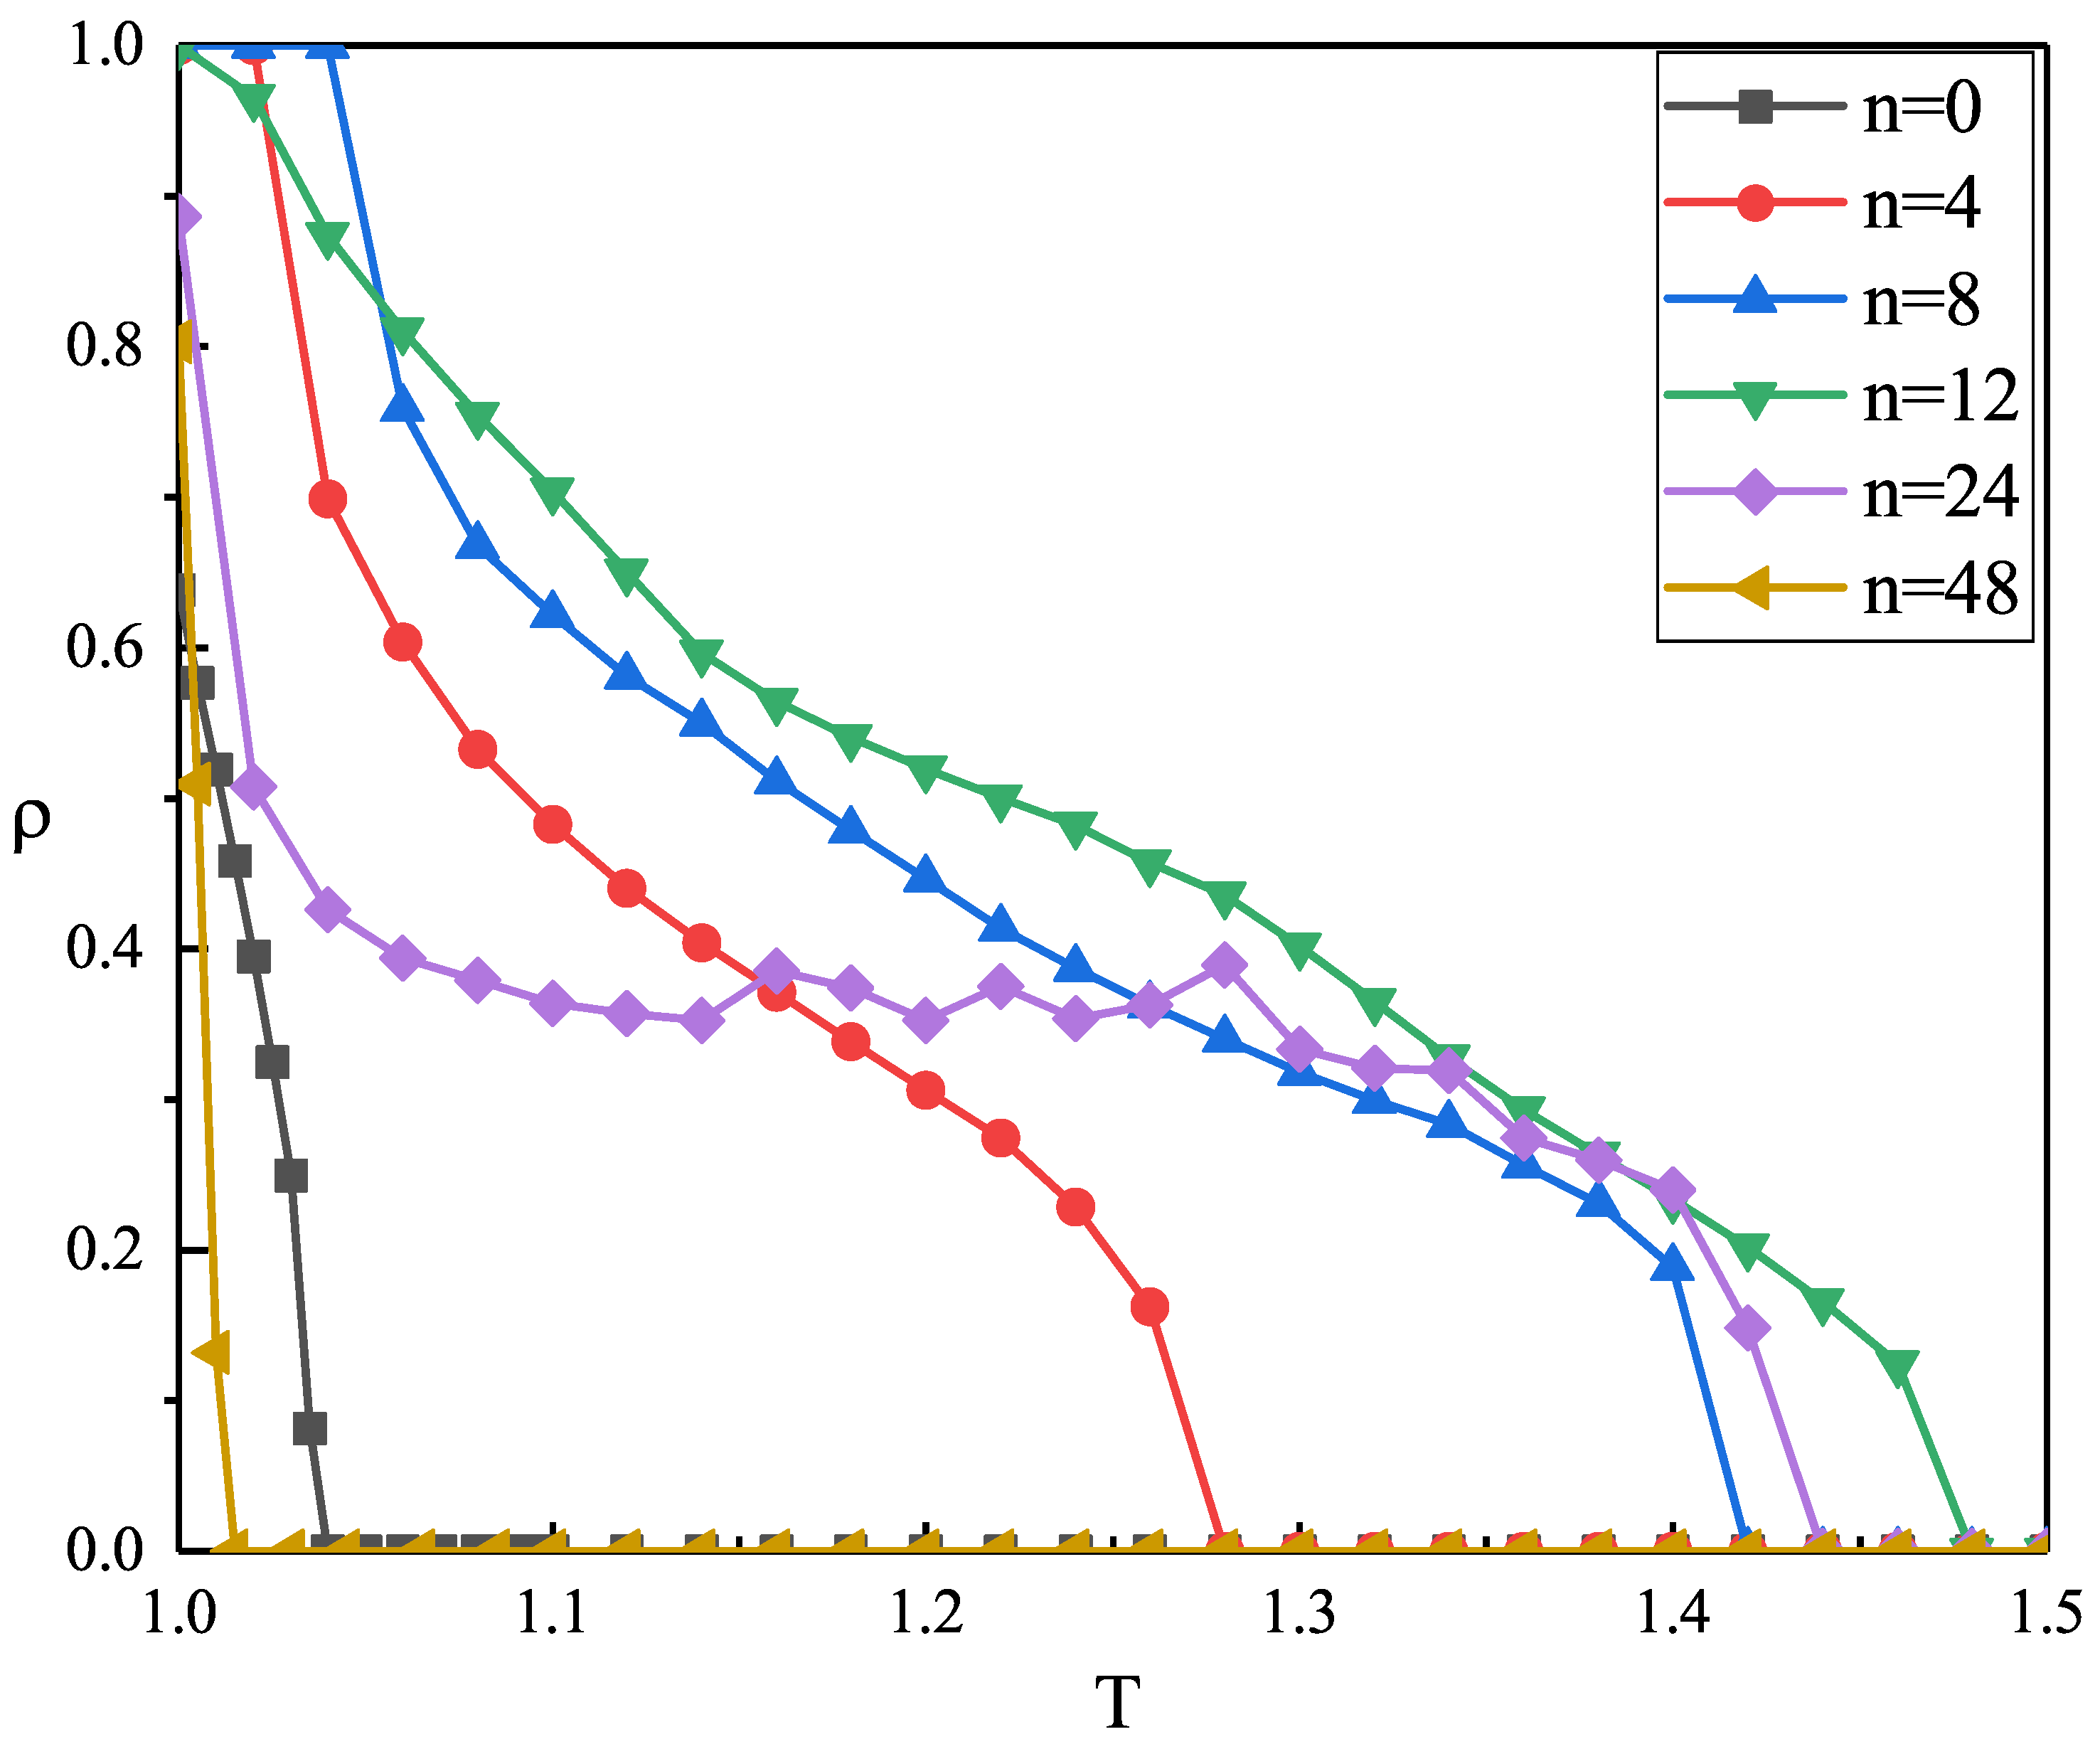
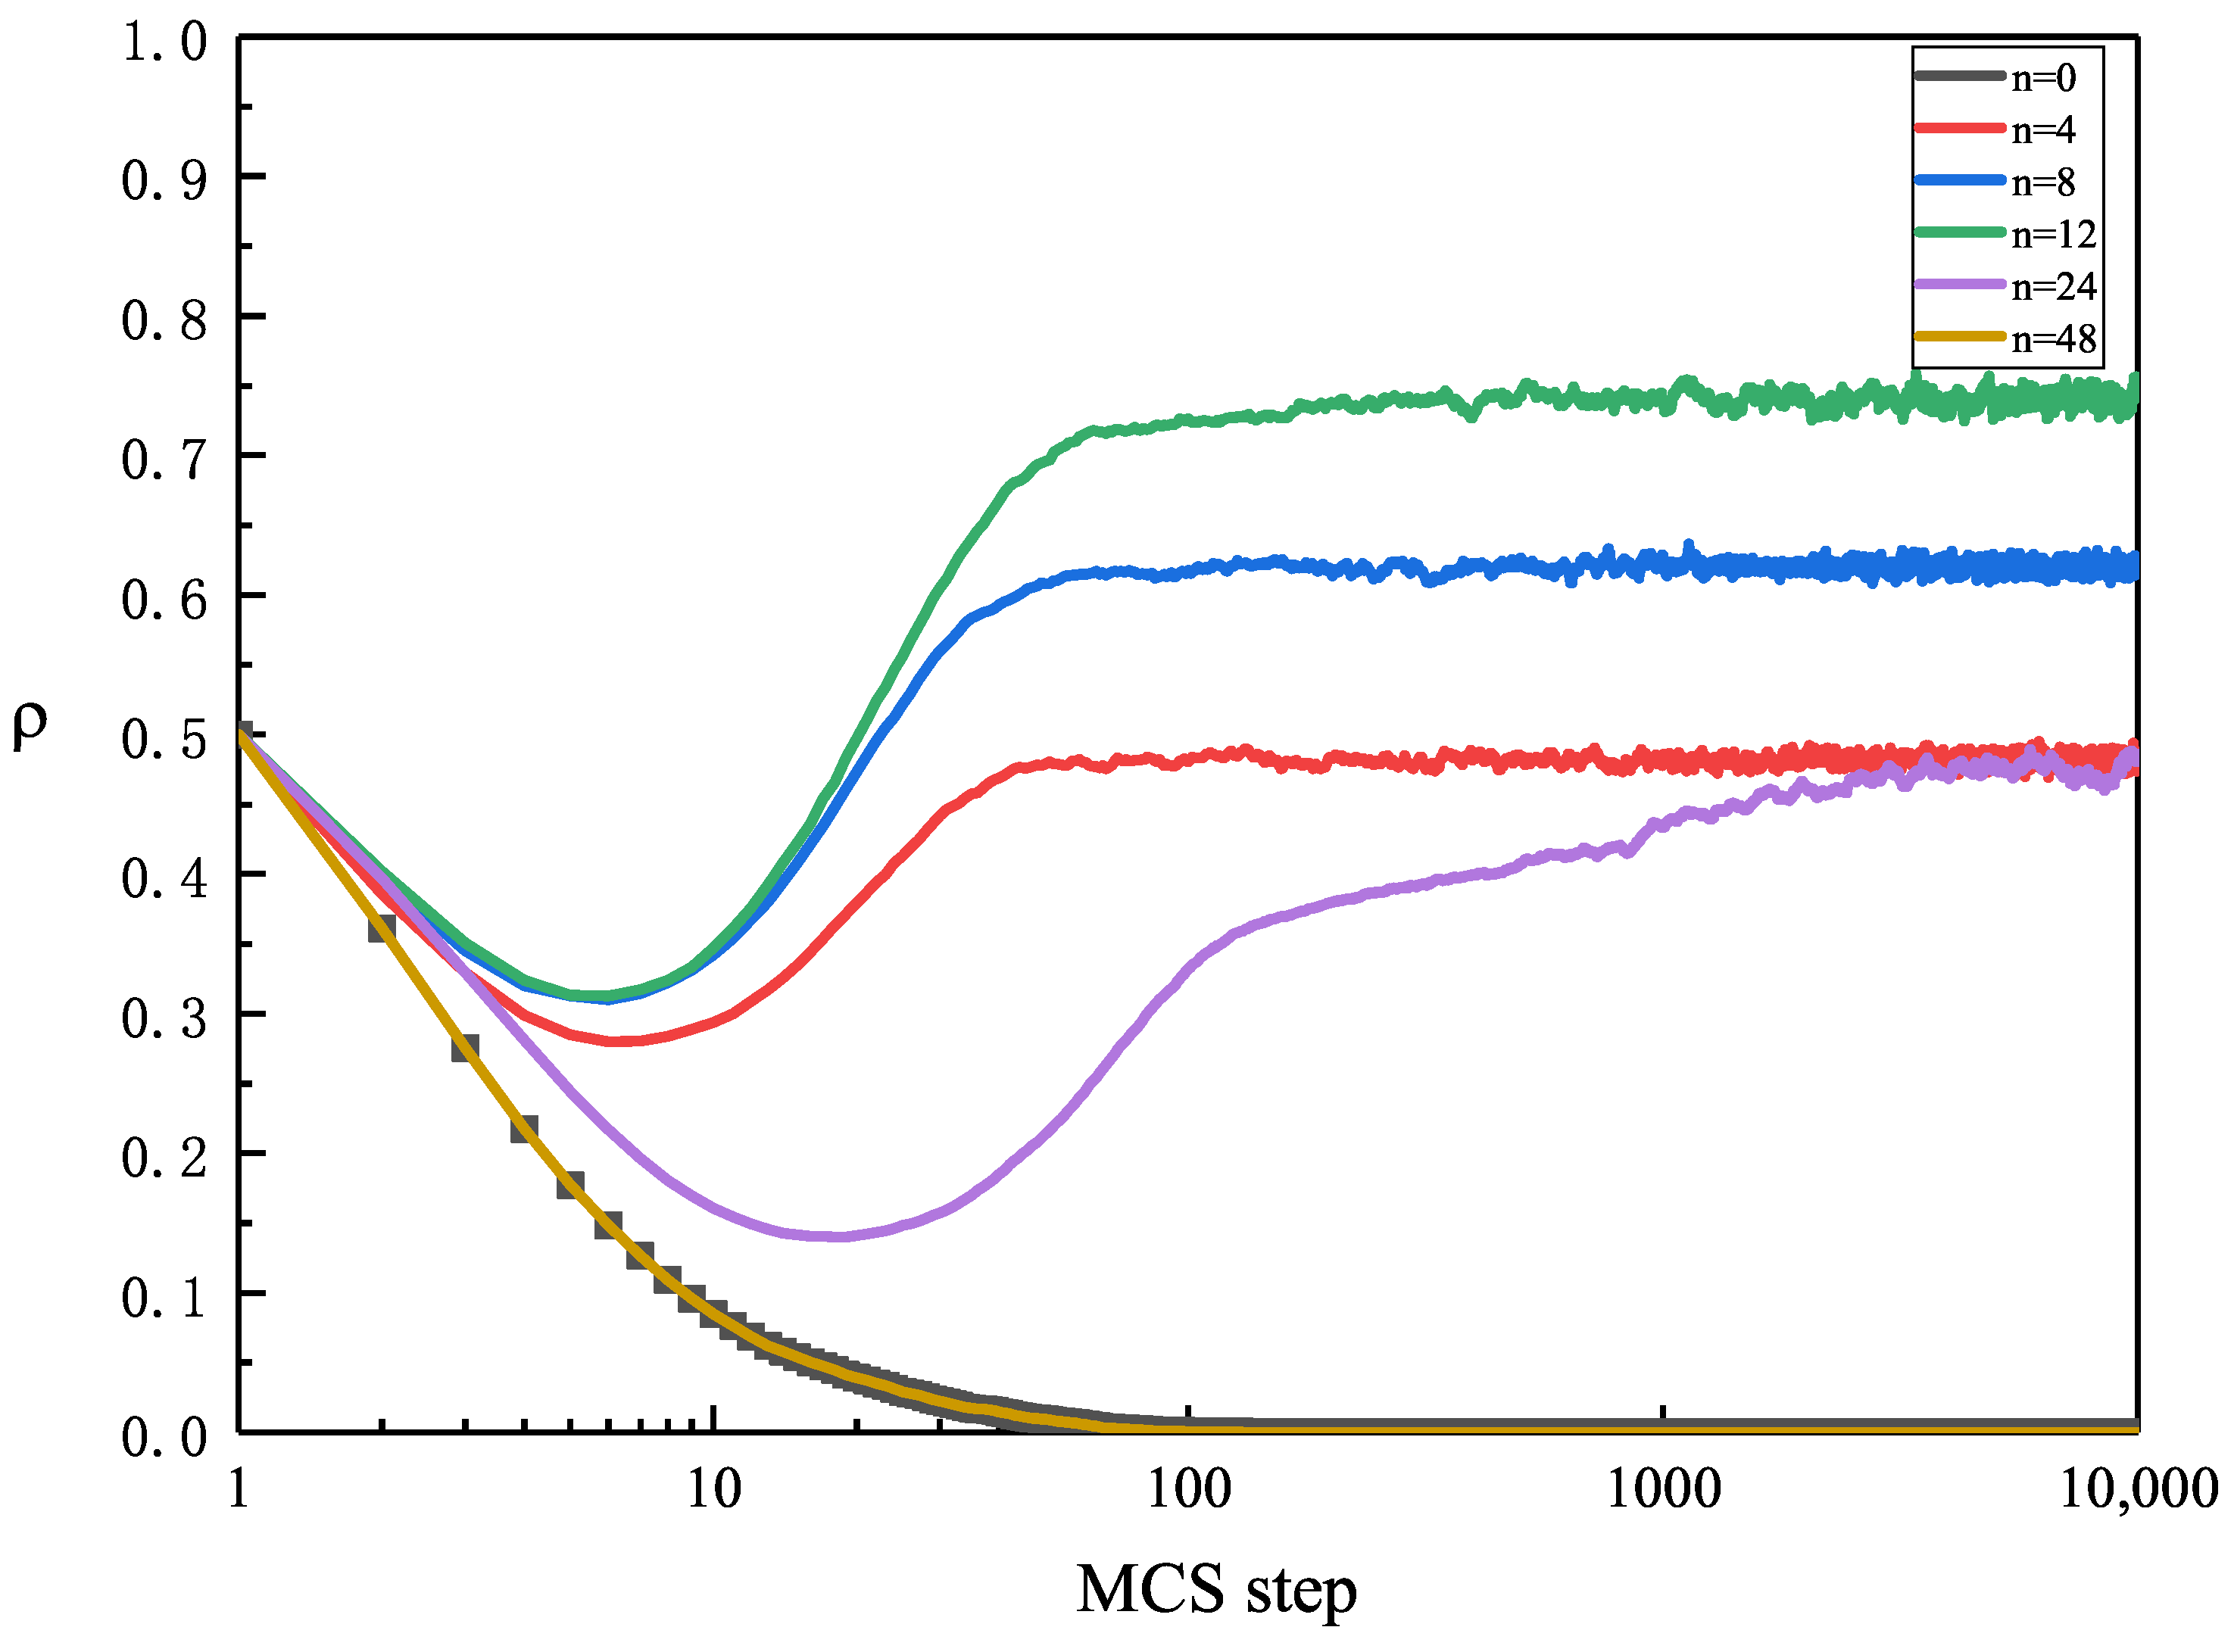
In order to understand in greater depth how the size of
n affects the evolution of cooperation within the whole population, in
Figure 6, we present the fraction of cooperators at each Monte Carlo step for different values of
n under the condition of the temptation to defect
. When
(i.e., the traditional PDG on the lattice), the temptation to defect causes the cooperation rate of the system to drop quickly and rapidly leads to the extinction of cooperators. When
, individuals can pay some costs to obtain the information of other
n individuals in the population when updating their strategies, which can help to collect more information to aid the strategy choice during the evolution of cooperation. The four curves, (colored red, blue, green and purple, respectively), in the graph, all show a first downward and then increasing trend [
53,
54]. At the beginning of the evolution, the defector strategy is an advantageous strategy compared with the cooperative strategy, so the proportion of cooperators must first decrease; as time continues, some defectors at the edge of the defective clusters change their strategy to a cooperative strategy by obtaining information from other cooperators. The cooperators form clusters of different sizes to jointly defend against the invasion of defectors, so the proportion of cooperators starts to increase with the help of spatial or network reciprocity, and eventually coexists with the defectors to arrive at a dynamic equilibrium. After the system is dynamically stable, cooperators and defectors alternately prevail in the population, which, to some extent, explains the fluctuations that occur in the tail region of each curve in
Figure 6. If the paid cost is not very high, this mechanism of paid access to information can effectively inhibit the spread of defection when strategies evolve. With increase in
n, this inhibition effect is constantly strengthened. As an example, for a specific system step, when
n is fixed to be 4, 8, 12 and 24, the fraction of cooperators within the population at the stationary state is finally stable at
,
,
and
, respectively. However, the value of
n continues to increase to 48; it can be found that this curve basically coincides with that obtained for
, which can be explained as follows: since the cost of acquiring information is too high and the game payoff may not be enough to pay the cost of acquiring information, the behavior of acquiring information becomes infrequent and reduces the model and system evolution into the traditional case of
.
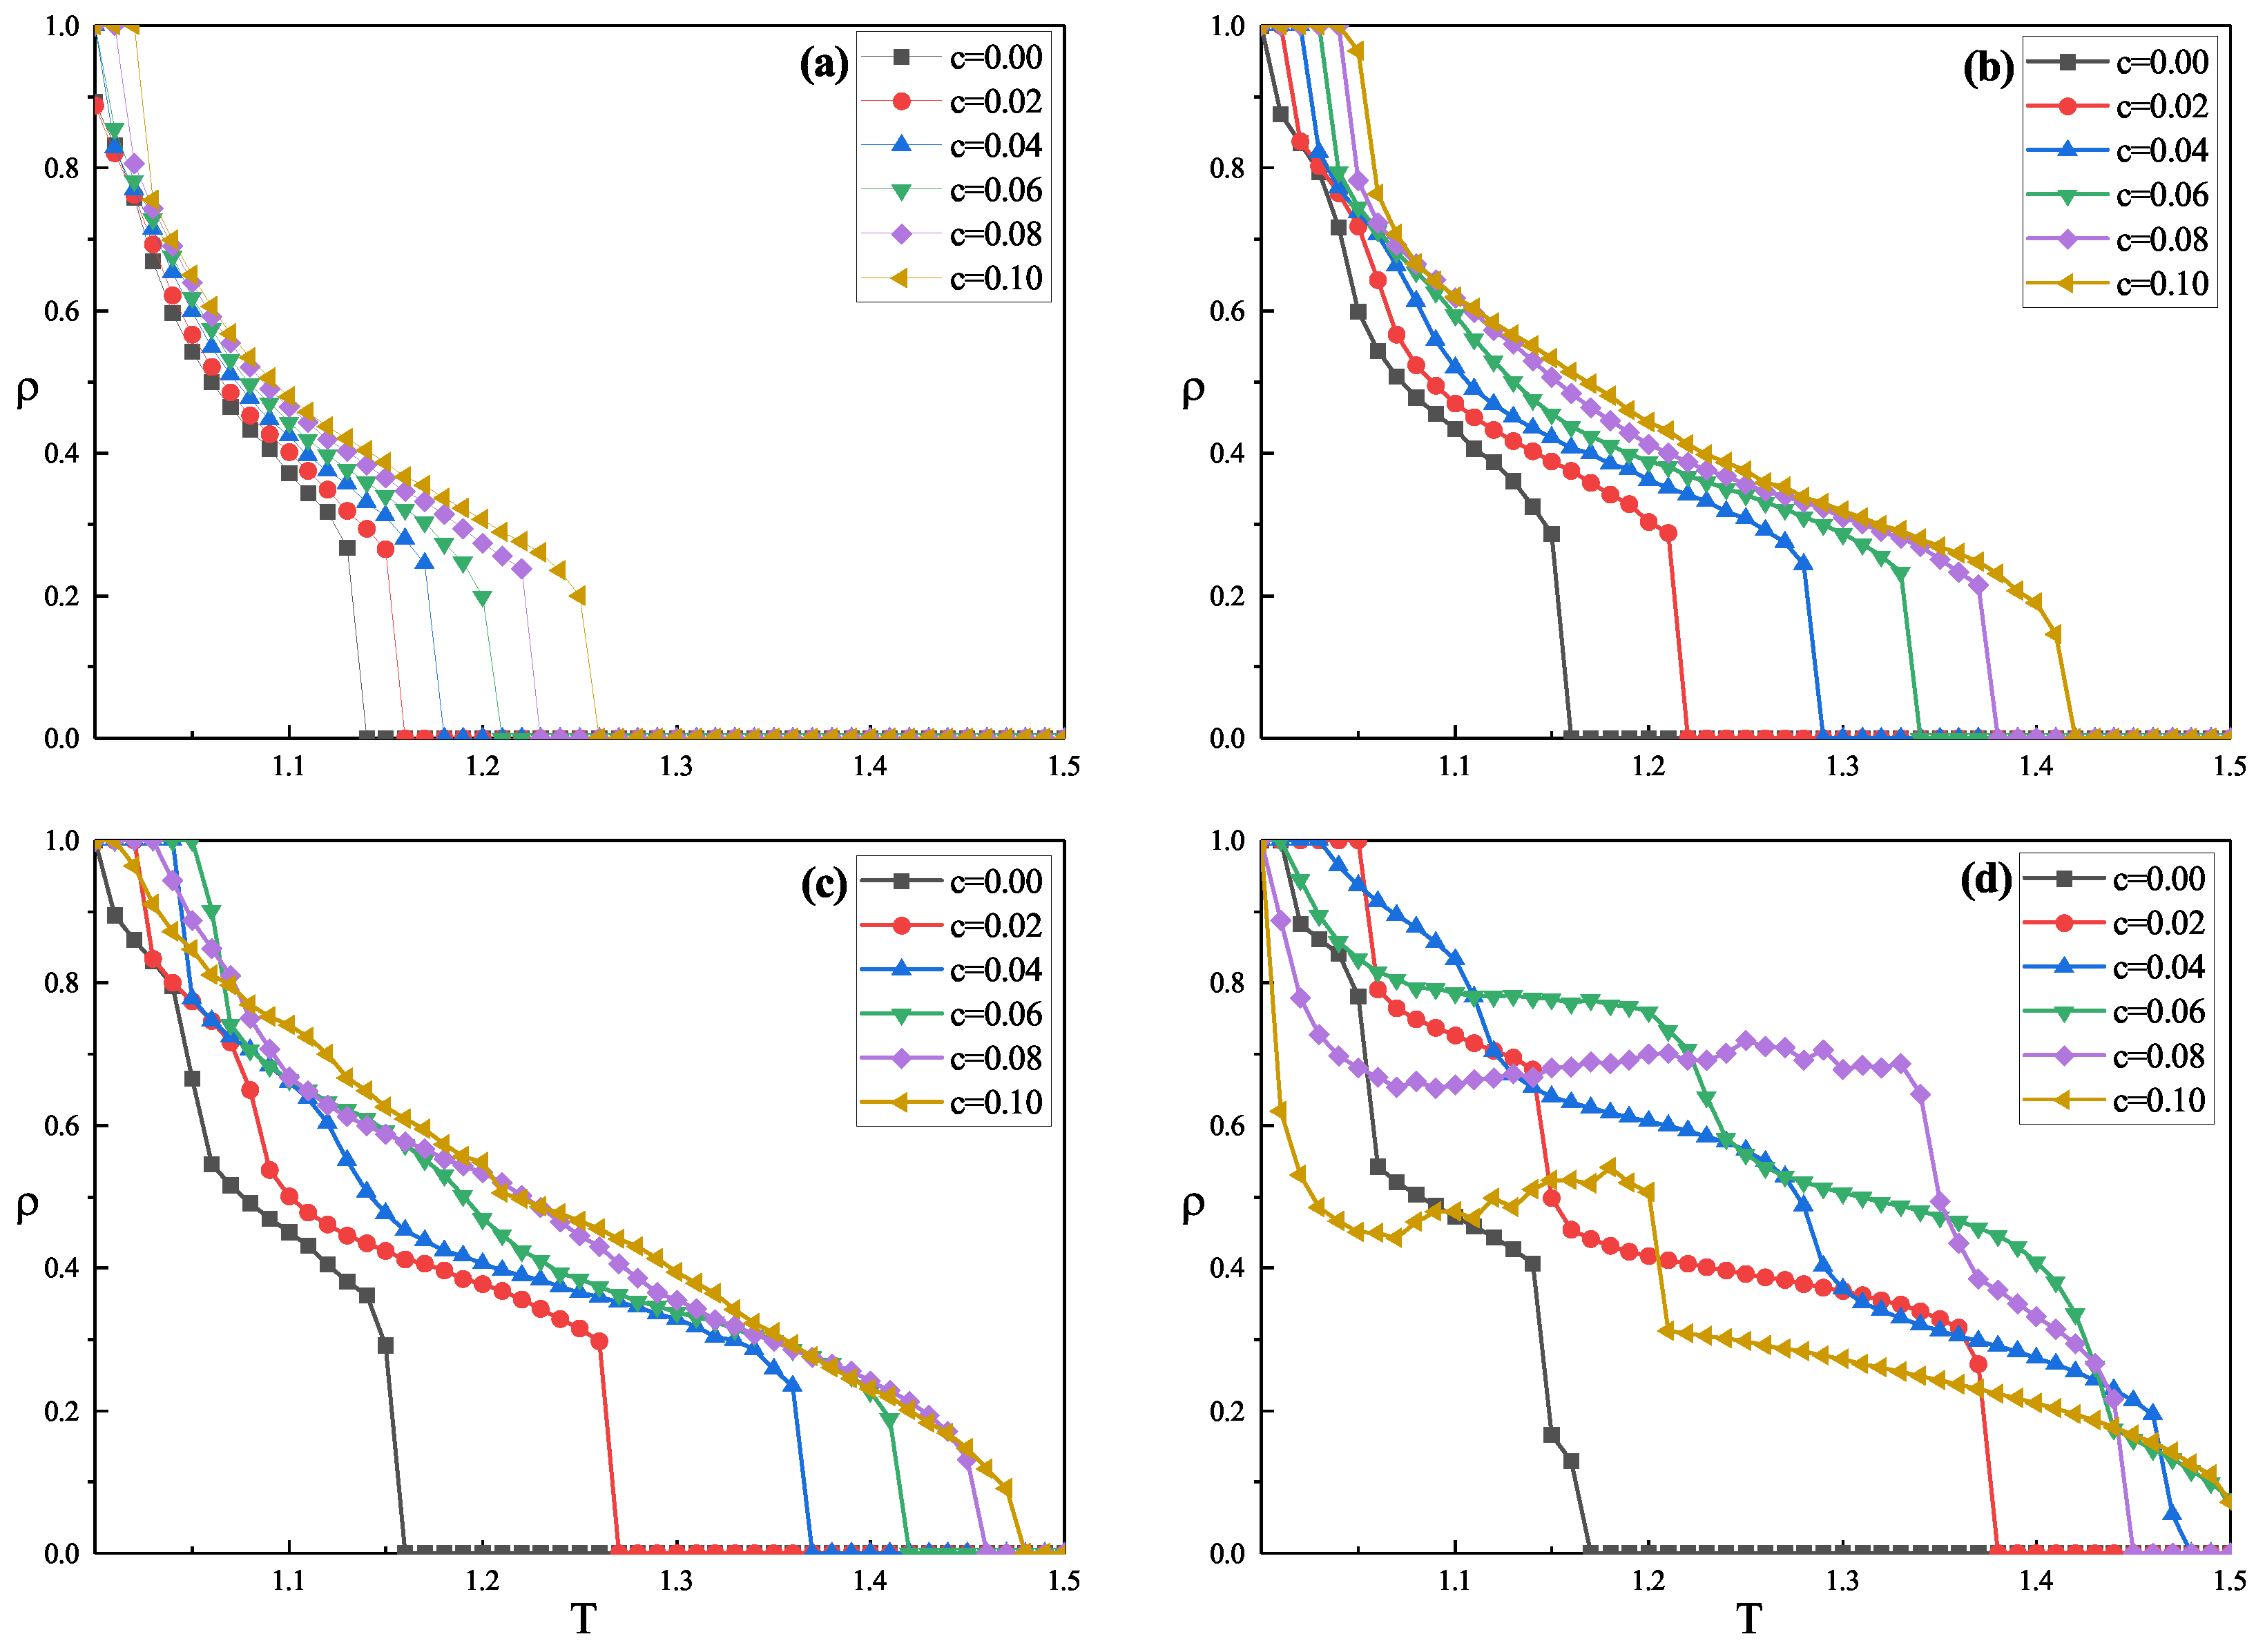
Next, we further consider the impact of the information acquiring cost
c on the stationary cooperation level
when
is a constant. As shown in
Figure 6,
is plotted as a function of
T in panels (a), (b), (c) and (d), which correspond to the results obtained for
, 8, 12 and 24, respectively. In panel (a) of
Figure 7, when
, players do not need to pay any cost to acquire the information of other individuals. With increase in
c, the level of cooperation improves, showing a monotonous trend, which indicates that players must pay a certain cost to acquire the information so as to improve cooperation. We emphasize that, although information acquisition can effectively improve the cooperation rate, the defectors in the population can also obtain information unconditionally, without spending the cost if the cost is too small or even 0. As is well known, if the collaborators can not form effective clusters in the PDG without any additional mechanism, the defector’s income is always greater than that of the cooperator, which is undoubtedly harmful to the persistence and improvement of cooperation within the population. Similar results can be observed in the other two panels (b) and (c) in
Figure 7, but, by comparing panels (a), (b) and (c), there is no doubt that the increase in the value of
n will enhance the evolution of cooperation, which is also consistent with the results in
Figure 4. However, the results in panel (d) of
Figure 7 seem to be different from those in the first three figures, where the focal player obtains the information of 24 individuals at one time; both curves of
c = 0.08 and
c = 0.10 present a phenomenon of first decreasing, then increasing, and finally decreasing to 0. When the value
T is small, the benefits of cooperation and defection are almost the same. However, for
n = 24,
or
, when players update their strategies through the mechanism of paid acquisition of information, the total cost is large and only a few players can afford to pay for the total cost of information acquisition, so this mechanism is almost ineffective. Thus, the cooperation drops sharply due to the influence of defection temptation, but, with increase in the value
T, the payoffs of defectors also increase, and more and more defectors can bear the cost of information acquisition, which, finally, leads to an avalanche of cooperation and, hence, the lower level of cooperation at the stationary state.
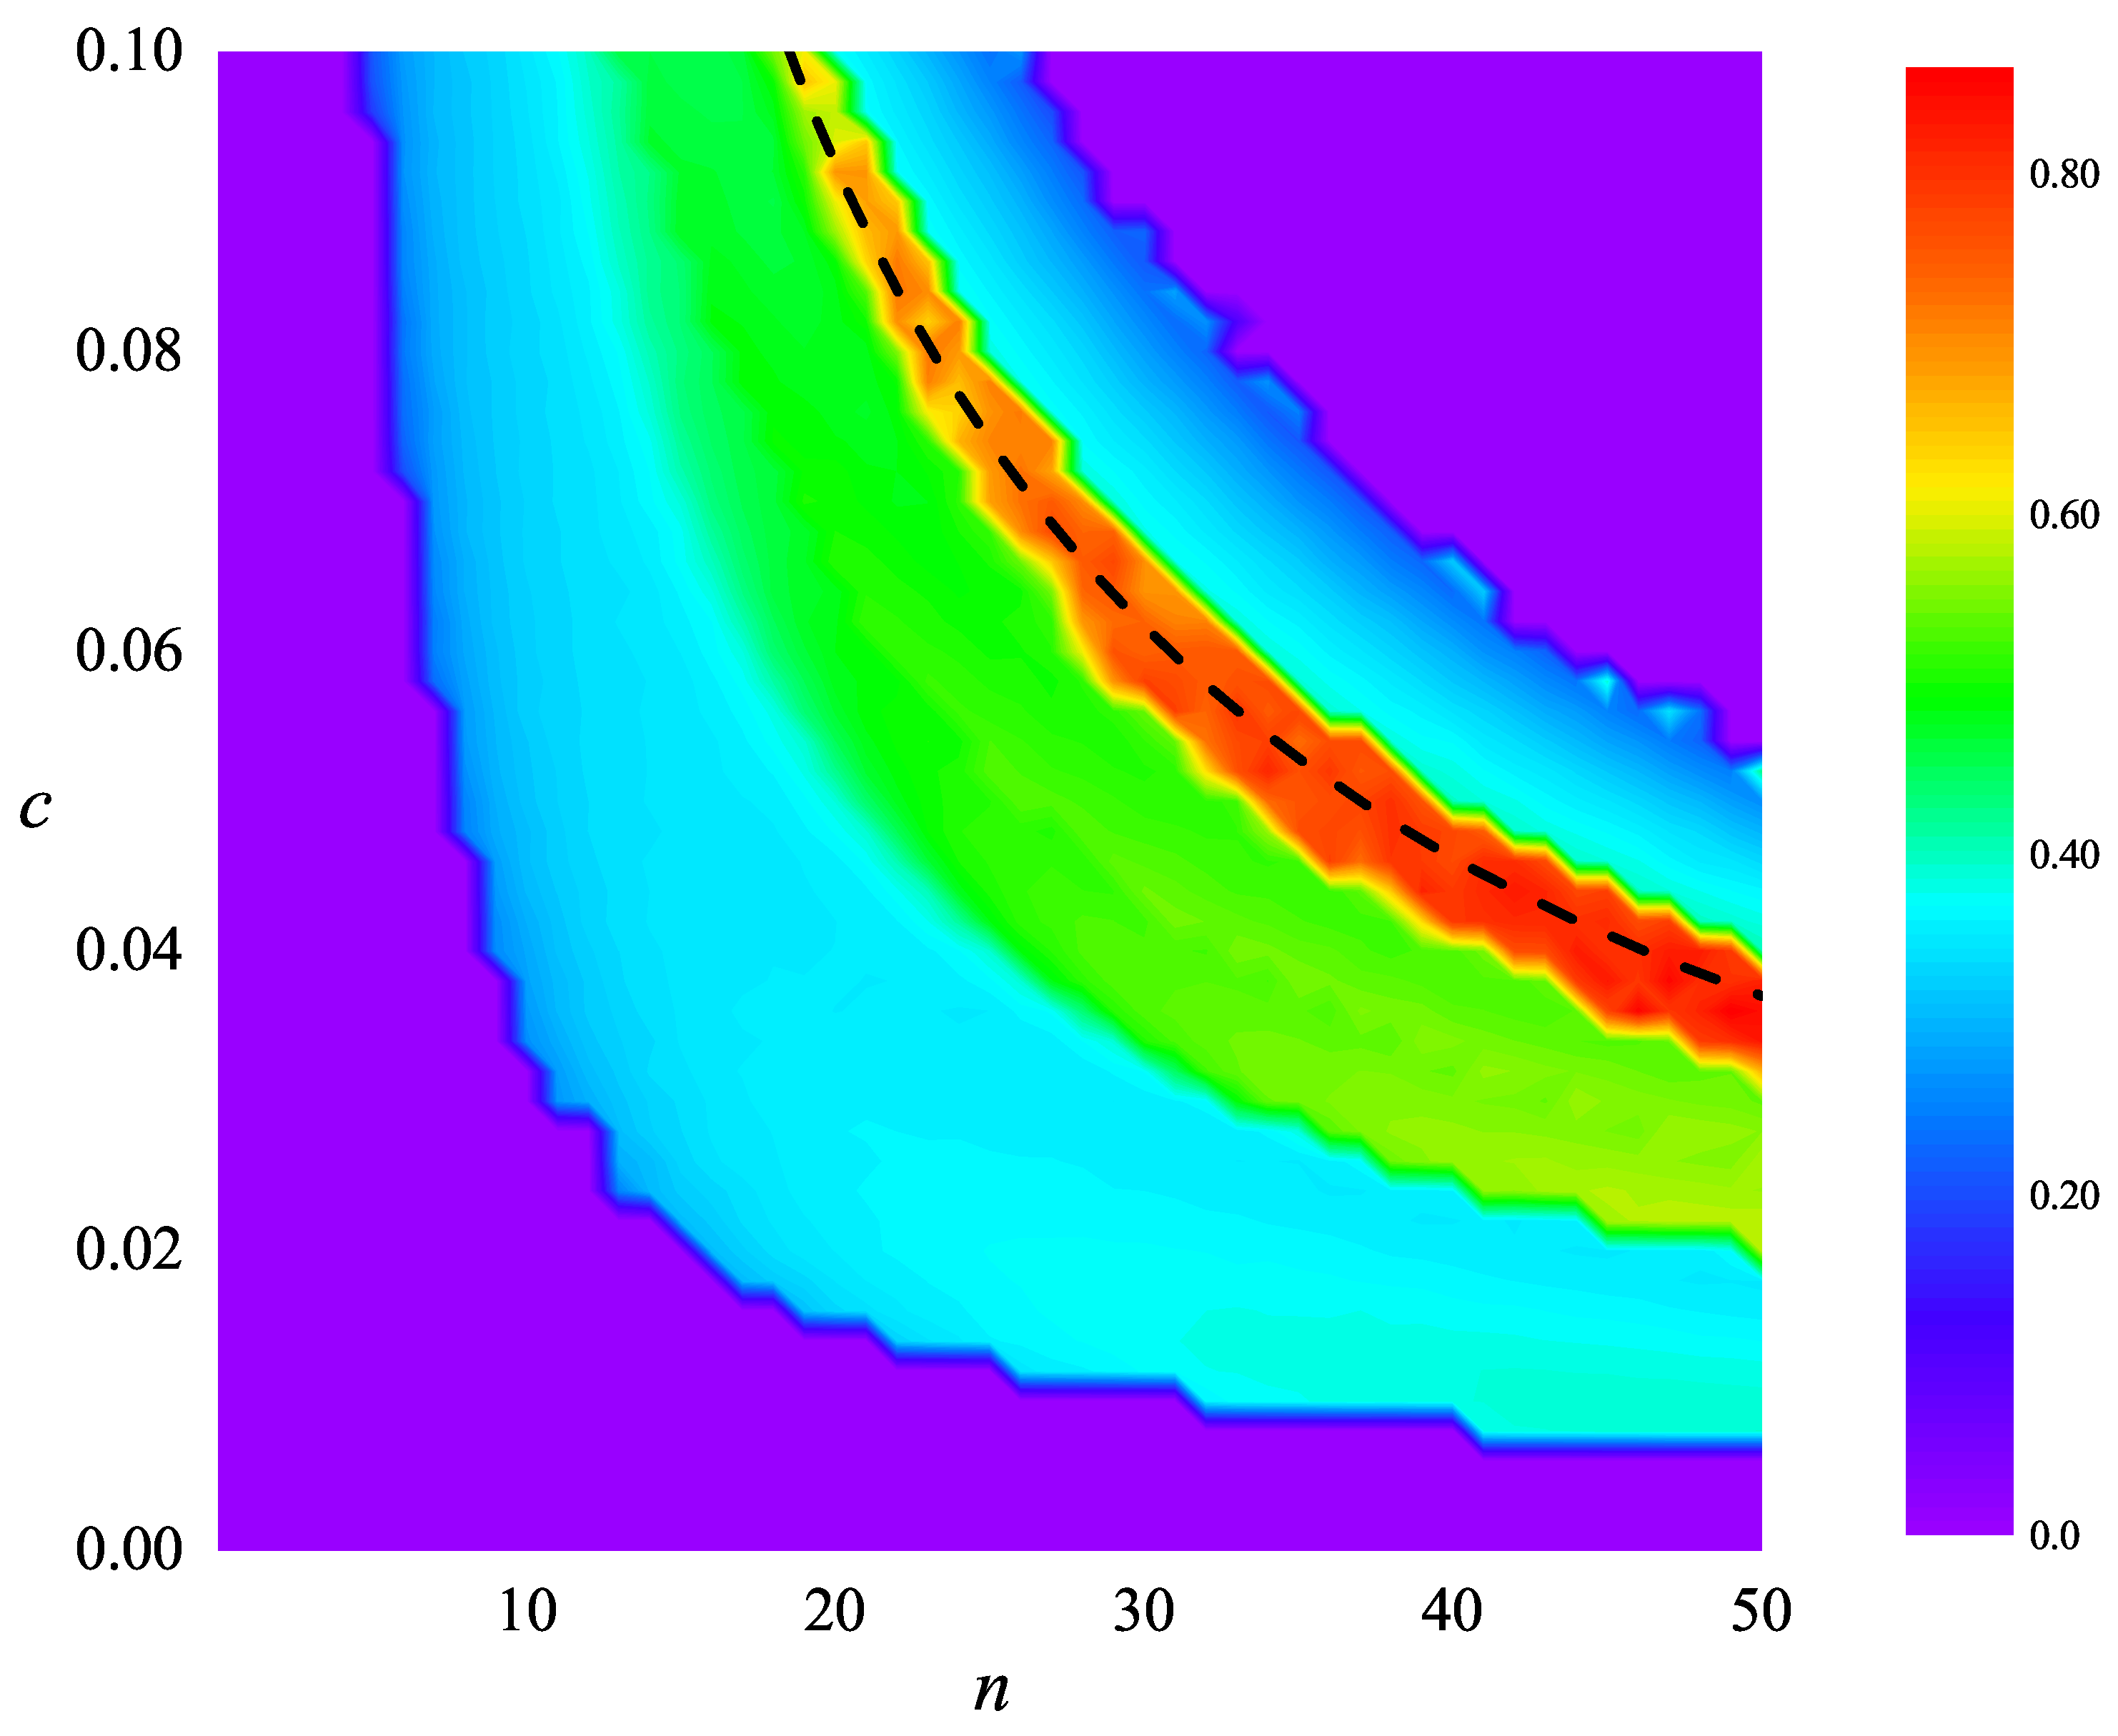
Finally, in order to further explore the influence of the information parameters
n and
c on the cooperative behaviors in the system,
Figure 8 shows the phase diagram with respect to
n (the horizontal axis) and
c (the vertical axis). Except for the blue areas on the lower-left and upper-right corners, the steady state
exhibits an obvious stratification phenomenon and the lines separating the different colored areas seem to satisfy the inverse proportional function. Therefore, it can be assumed that factors affecting the level of cooperators at the stationary state are closely related to the product of visiting information related parameters
n and
c for a fixed temptation to defect
T and probability of obtaining information
q. In the middle of
Figure 8, the promotion effect of cooperation is the most obvious, where the separating line can be approximated as the black dashed line and the corresponding expression is:
. Thus, it is obvious that a moderate information cost can foster the development of prosocial behavior, while the information-related cost should not be too large or too small.
4. Conclusions
In summary, we integrate paid access to individual information into the prisoner’s dilemma model on the regular lattice. Here, the focal player updates their strategy according to the Fermi-like function, where the individual fitness needs to be recalculated by comparing their own payoff with that of their opponent. During each strategy update, the focal player first decides whether they will pay an amount of cost to access the information of other agents with a certain probability q. If they pay the cost, their payoff minus the cost is considered as their fitness, and the average payoff of all other individuals is used as the fitness of their opponent; Otherwise, the focal player and their opponent only regard their own payoffs as their corresponding fitness.
Extensive numerical simulations show that the mechanism of information acquisition can effectively improve the level of cooperation at the stationary state if the number of players that a focal player accesses is not too large. As an example, if and other model parameters are kept constant, the stationary level of cooperation will be greatly increased as n increases. However, information acquisition is not free, but requires the player to pay a variable cost, which is positively related to the amount of information acquired by the focal agent. Thus, if the number of players that a player has accessed is too large (e.g., ), the acquired cost also becomes higher; then, the fitness of the focal agent will be greatly reduced, which means that most players are not willing to afford the cost to aid the individual strategy selection. In addition, if the number of players that a player has accessed is too small (e.g., ), most players are willing to afford the cost to aid the individual strategy selection, but the amount of information is limited, which limits the role of the mechanisms of information acquisition with the population. Therefore, the quantity of information acquired by the player is crucial to the evolution of cooperation within the population; there exists a moderate value of n, which enables most players to afford the cost of information acquisition. At this time, the mechanism of information acquisition motivates those defectors around the defective clusters to change their strategies to cooperators and enables those cooperators to form tight clusters. This promote the spread of pro-social behaviors and, finally, enables cooperators to form a stable cluster in the population. When deciding on your own strategy, it is vital to be careful in gathering information about successful strategies, as it is said, if you know your enemy, you will never lose a battle. However, when the act of gathering information is to be paid for, you need to consider your own situation and act within your means.
However, there are some limitations to our model. On the one hand, the paid cost linearly increases with the number of players that can be accessed, which could be non-linearly augmented under some cases; on the other hand, the underlying topology is the regular lattice, which is often unrealistic in real-world scenarios. In the future, beyond these limitations, we will consider the impact of the nonlinear accessing cost on the evolution of cooperation, and explore how cooperation behaviors emerge when we combine this kind of paid accessing information with the small-world, scale-free, interdependent, and even more complex, high-order networks.


