Article

Improved Feature Selection Based on Chaos Game Optimization for Social Internet of Things with a Novel Deep Learning Model

by
Abdelghani Dahou
1,
Samia Allaoua Chelloug
2,*,
Mai Alduailij
3,* and
Mohamed Abd Elaziz
4,5,6,7,*
1
Faculty of Computer Sciences and Mathematics, Ahmed Draia University, Adrar 01000, Algeria
2
Information Technology Department, College of Computer and Information Sciences, Princess Nourah bint Abdulrahman University, Riyadh 11671, Saudi Arabia
3
Department of Computer Science, College of Computer and Information Sciences, Princess Nourah bint Abdulrahman University, Riyadh 11671, Saudi Arabia
4
Department of Mathematics, Faculty of Science, Zagazig University, Zagazig 44519, Egypt
5
Department of Artificial Intelligence Science and Engineering, Galala University, Suze 435611, Egypt
6
Artificial Intelligence Research Center (AIRC), Ajman University, Ajman 346, United Arab Emirates
7
Department of Electrical and Computer Engineering, Lebanese American University, Byblos 13-5053, Lebanon
*
Authors to whom correspondence should be addressed.
Mathematics 2023, 11(4), 1032; https://doi.org/10.3390/math11041032
Submission received: 7 January 2023 / Revised: 26 January 2023 / Accepted: 31 January 2023 / Published: 17 February 2023
(This article belongs to the Section Mathematics and Computer Science)

Abstract

:
The Social Internet of Things (SIoT) ecosystem tends to process and analyze extensive data generated by users from both social networks and Internet of Things (IoT) systems and derives knowledge and diagnoses from all connected objects. To overcome many challenges in the SIoT system, such as big data management, analysis, and reporting, robust algorithms should be proposed and validated. Thus, in this work, we propose a framework to tackle the high dimensionality of transferred data over the SIoT system and improve the performance of several applications with different data types. The proposed framework comprises two parts: Transformer CNN (TransCNN), a deep learning model for feature extraction, and the Chaos Game Optimization (CGO) algorithm for feature selection. To validate the framework’s effectiveness, several datasets with different data types were selected, and various experiments were conducted compared to other methods. The results showed that the efficiency of the developed method is better than other models according to the performance metrics in the SIoT environment. In addition, the average of the developed method based on the accuracy, sensitivity, specificity, number of selected features, and fitness value is 88.30%, 87.20%, 92.94%, 44.375, and 0.1082, respectively. The mean rank obtained using the Friedman test is the best value overall for the competitive algorithms.

1. Introduction

The IoT concept was proposed by Kevin Ashton in 1999, and there are many sectors in developed and developing countries that have investigated IoT-based projects [1,2,3,4]. Thus, an IoT application relies on uniquely identifiable objects with sensing, connectivity, and interoperation capabilities [5]. It is worth mentioning that a certain number of IoT-based standards have been developed, while there are still some research challenges for designing IoT middleware and providing security [6]. Then, the SIoT was proposed as an extension of IoT technology. The idea of the SIoT consists of establishing social relationships between IoT devices. Moreover, the SIoT aims to provide decentralized intelligence by allowing IoT objects to become social and smart. Along with decentralizing the intelligence, an SIoT object can request support from its social IoT objects to complete a specific request. More importantly, the Quality of Experience (QoE) is high in the SIoT, which may also lead to creating a business model by monetizing information and connectivity sharing [7]. Upon receiving the client’s request, the SIoT object checks if it can handle the received request. Elsewhere, the request will be forwarded to its friends. Therefore, selecting social friends is a crucial step that impacts the reliability of the SIoT application [8]. As stated in [7,9], five important social relationships can be established between SIoT objects, as summarized in Table 1.
There needs to be standard architecture for the SIoT. Nevertheless, there are four available SIoT architectures: device, global connection, platform, and application layers [10]. As reported in [11], the SIoT has been successfully applied to a smart home for home safety and energy efficiency. One of the big challenges of the SIoT is related to identifying and communicating relevant data, given that the SIoT data may be structured/instructed [9]. Additionally, various types of SIoT data, including audio, video, and text, can be accessed and communicated in an SIoT network. In this regard, the authors of [12] developed a realistic SIoT dataset extracted from a smart city scenario. The considered dataset allows the incorporation of static and mobile devices. Besides, the data model allows the creation of a profile for each object to define the potential set of offered services and applications that can be deployed. More specifically, an analysis of the impact of each social relationship on network navigability was presented in [12]. The topic of the data analysis of the SIoT has been addressed in many recent papers [13,14].
Lakshmanaprabu et al. [15] introduced a framework for effectively classifying SIoT data. The developed framework was based on map-reduce and a supervised classifier model. In particular, the SIoT was investigated for analyzing the trajectories of many users. Therefore, a recommendation system was developed in [15,16] for service discovery using the knowledge–desire–intention (KDI) model. Another topic that has attracted researchers concerns sentiment analysis in the SIoT. Notably, three levels of sentiment analysis exist, and they embrace the document level, sentence level, and aspect level. The first level categorizes sentiments from the entire document, while the second predicts the sentiment popularities expressed in each sentence. The aspect level is more efficient than the first and the second levels, as it classifies sentiments expressed in opinions [17]. Despite the amount of SIoT data, the multimodality and accuracy of sentiment analysis are the main challenges.
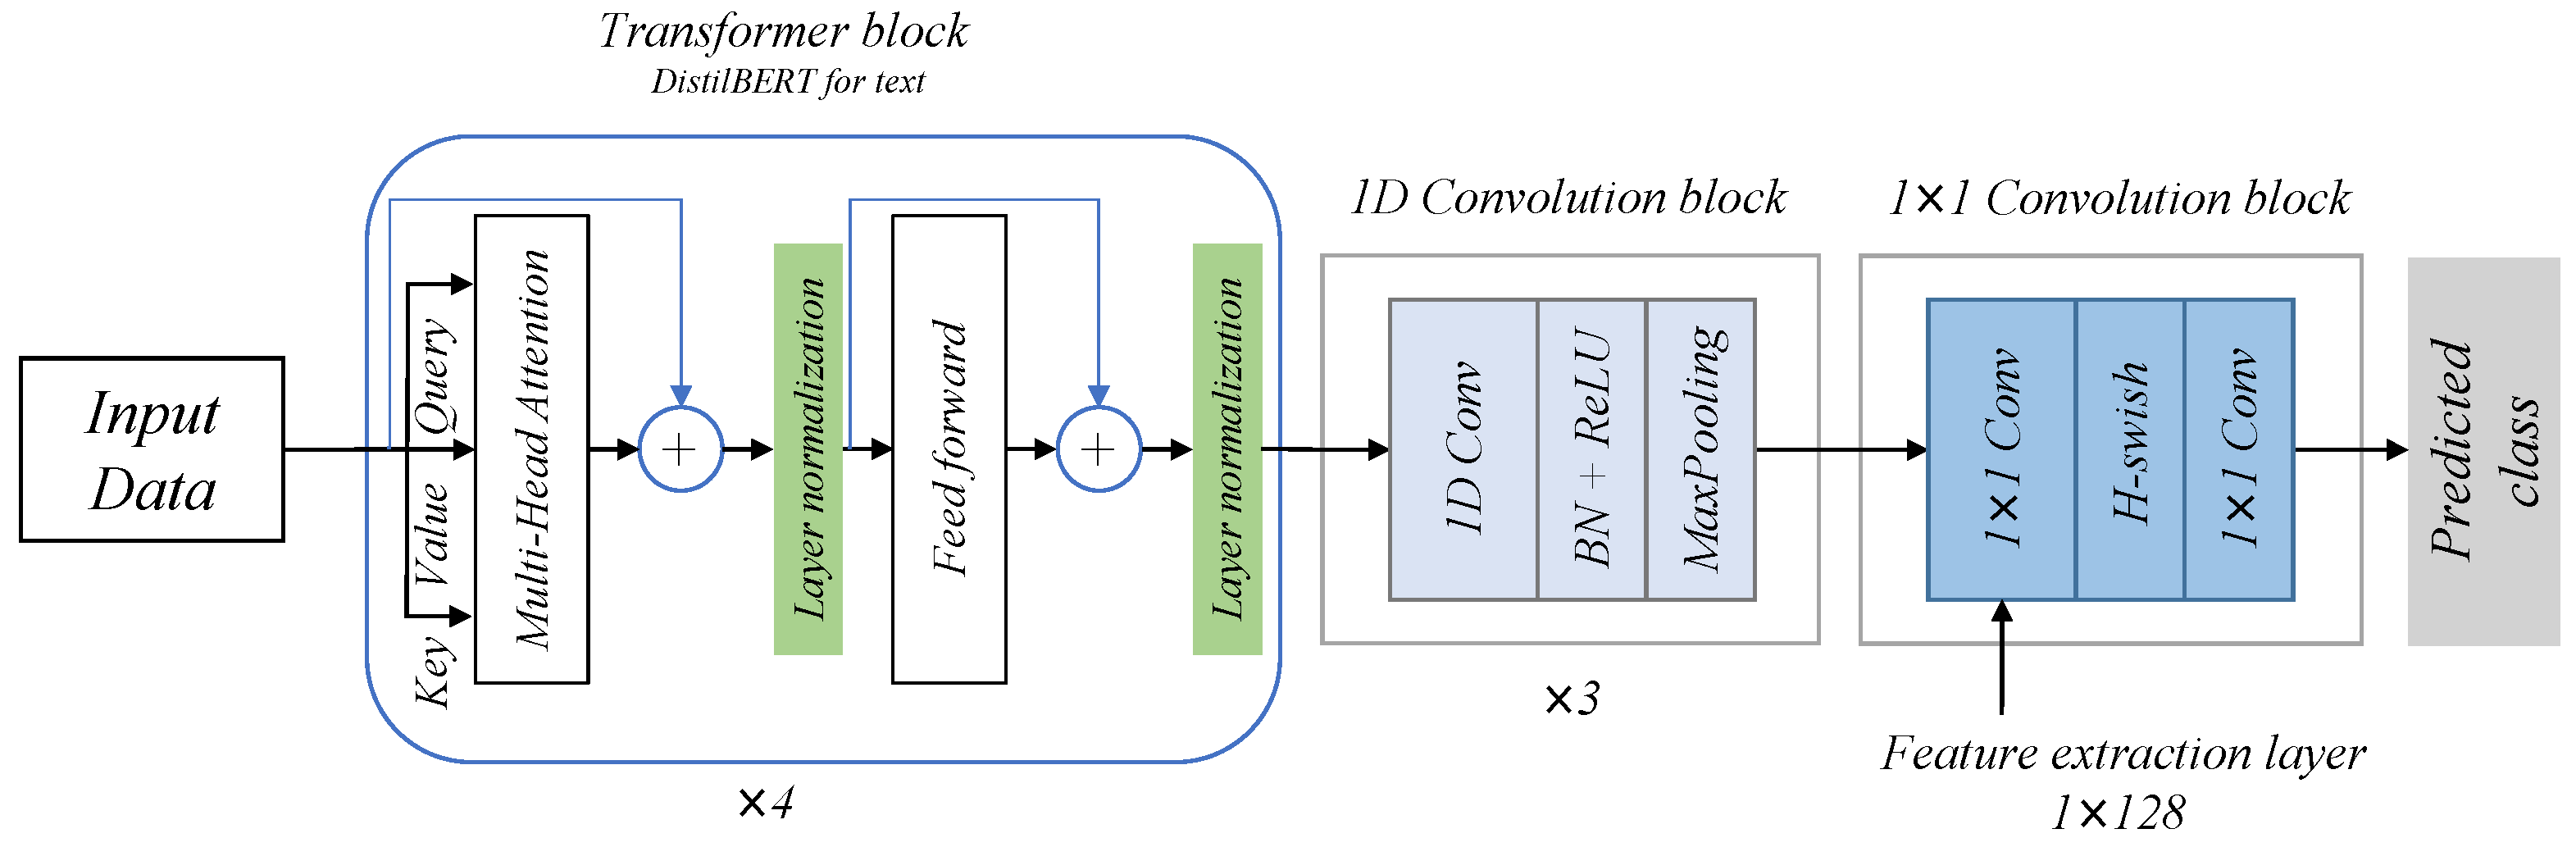
Therefore, this paper aimed to develop a novel multimodal deep learning model that can predict the user-generated data sentiment, activity, event, crisis-related event, or social-media-related event in the SIoT. This model depends on an architecture combining two model structures, including Transformers and Convolution Neural Networks (CNN) as feature extraction methods and using an alternative feature selection method. Actually, those features refer to the representations or patterns used to discriminate between the classes/groups of data; some of these features are redundant. Therefore, the combination of Transformer and the CNN can help with learning different levels of features and extracting meaningful representations such as contextual representations in textual data. The feature selection method is developed according to the behavior of Chaos Game Optimization (CGO) [18], which simulates the concepts of chaos theory [19]. Based on these concepts, CGO has been applied to solve different optimization techniques, including constrained engineering design problems [20], parameter extraction of the three-diode photovoltaic model [21], energy futures price forecasting [22], and proton exchange membrane fuel cells [
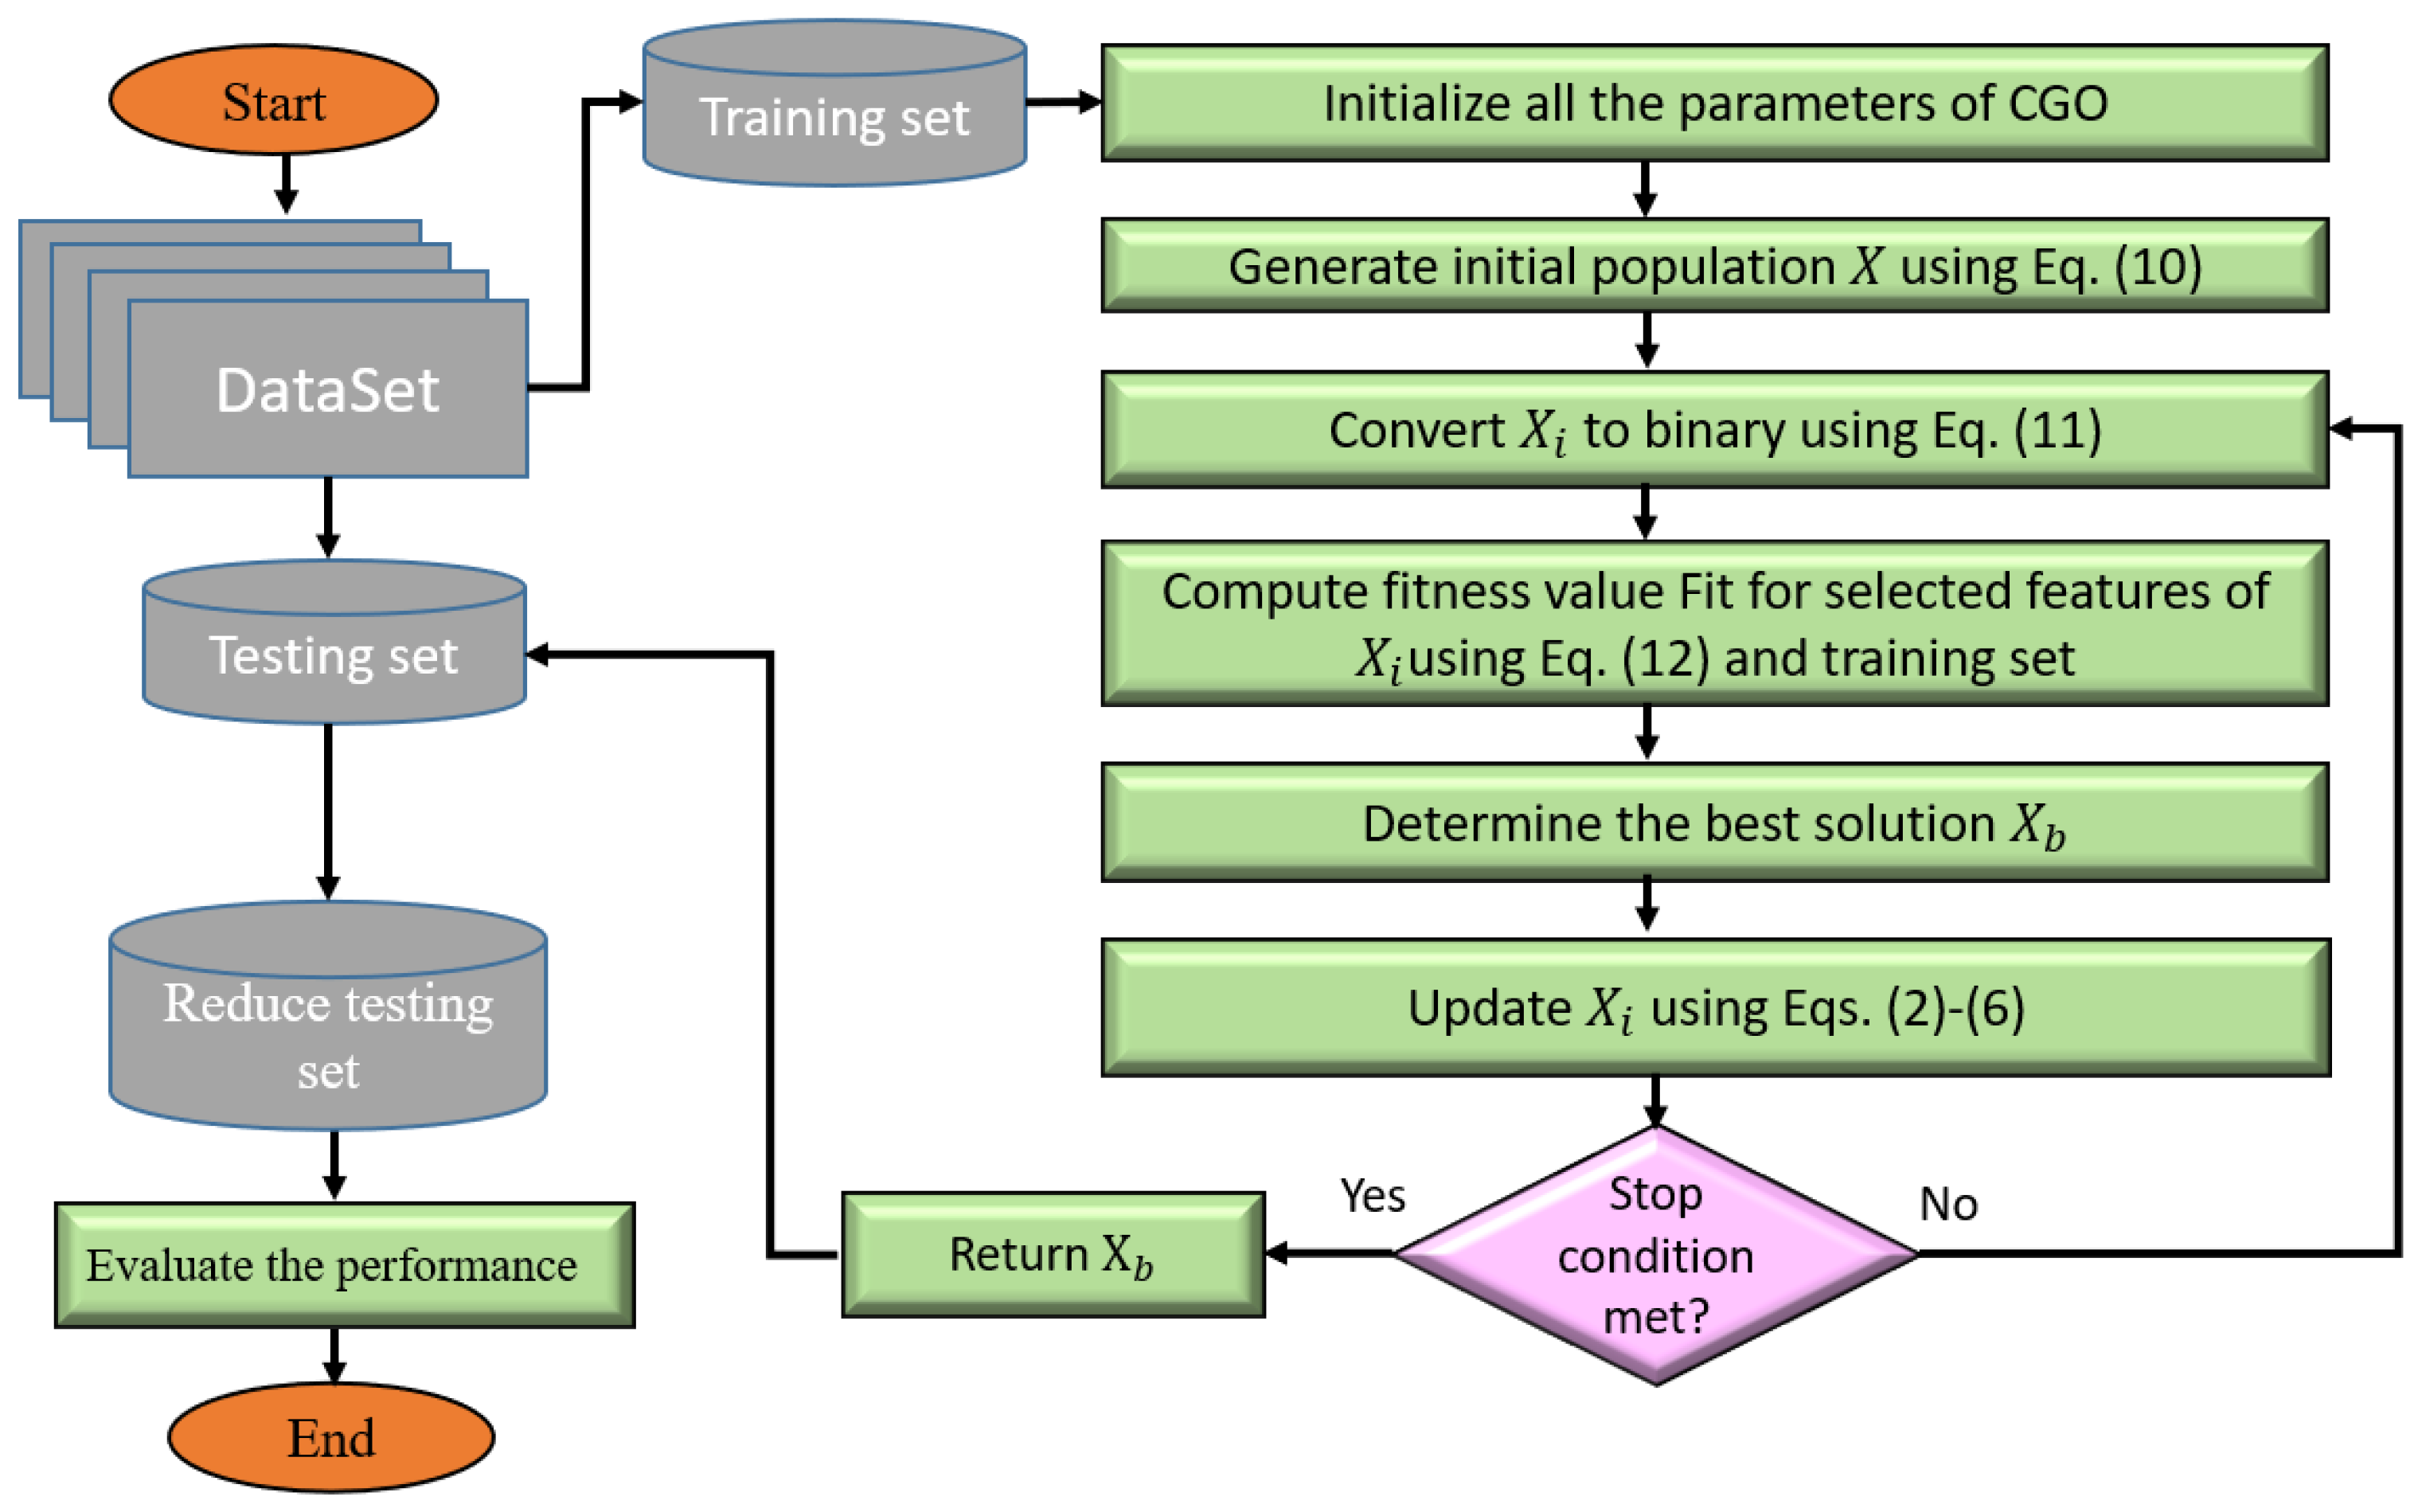
23]. The developed method starts by constructing the DL architecture, named the Transformer CNN (TransCNN), and uses it to extract the features from the tested datasets. This process is followed by dividing the dataset into training and testing, then using the binary version of CGO to find the relevant features of the training set from those extracted ones. After that, the best solution (relevant features) is used to reduce the size of the testing set by removing the irrelevant features and to evaluate the quality of those features using different performance metrics.
The main contributions can be summarized as follows:
  • We propose TransCNN as a new DL architecture as our main feature extractor with pluggable components that exploit textual and numerical data.
  • We present an alternative FS technique based on a binary version of Chaos Game Optimization (CGO).
  • We evaluated the efficiency of the developed method by comparing with other models and using different SIoT datasets.
The rest of this study is organized as follows: Section 2 presents the related works of the techniques applied to handle the SIoT dataset. Section 3 introduces the background of Transformer-based models and chaos game optimization. The proposed method is presented in Section 4. The results and their discussion are given in Section 5. The conclusion is presented in Section 6.

2. Related Works

The authors of [24] presented a framework for mining Twitter and analyzing users’ perceptions of the SIoT. The proposed framework allows us to obtain a Twitter feed. The data cleaning and pre-processing detects slang, applies lemmatization, and removes stop words. After that, extensive sentiment analysis was conducted based on an Improved Popularity Classifier (IPC), SentiWordNet (SWNC), Fragment Vector Model (FVM), and hybrid classifier that combines the IPC and SWNC. The experimental results discussed in [24] demonstrated that the FVM, which is a semi-supervised algorithm, achieved the best accuracy of 94.88%. The approach presented in [24] is simple to apply. However, it has yet to be compared to other benchmark techniques. Further, it is limited to unimodal text.
The work presented in [25] targeted the classification of sentiments in Twitter real-time data, where multiple-sentence tweets and multi-tweet threads were considered. Thus, Reference [25] explored a Hierarchical Attention Network (HAN) that was developed based on a Recurrent Neural Network (RNN) composed of GRU/LSTMs and attention mechanisms. In particular, the main motivation for the approach described in [25] consists of analyzing sentiments in real-time Twitter data, including multiple sentences, as well as multiple tweets. Moreover, the HAN allows one to read a full sentence, and then, the attention mechanism selects the most-significant words. Next, the HAN outputs a sentence that incorporates the semantic content of the input sentence. Additionally, the HAN includes a sentence hierarchy process for creating document embedding. Two English tweet datasets, including the Standard Twitter sentiment Gold standard (STC-Gold) and the SemEval-2017 datasets, were used for evaluating the proposed HAN, which achieved an accuracy of 71.7% and 94.6%, respectively. The evaluation of the results of the approach introduced in [25] is limited to two datasets. Additionally, the authors did not exploit multimodal text.
So far, the problem of multimodal sentiment analysis has been studied in many research papers. The model explained in [26] integrated interactive Transformer and Softmax mapping. The former can detect the current interactive information between modalities, while the latter projects each modality in a new space for further fusion. The Multimodal Opinion Sentiment and Emotion Intensity (CMU-Mosei) (http://multicomp.cs.cmu.edu/resources/cmu-mosei-dataset/, accessed on 2 January 2020) and Multimodal EmotionLines (Meld) (https://affective-meld.github.io/, accessed on 2 January 2020) datasets were selected for testing the proposed approach, which demonstrated good results compared to the benchmark techniques. In particular, the best accuracy achieved by the proposed approach was 82.47% for binary classification. We mention that the contribution introduced in [26] was limited to linguistic and acoustic modalities.
The contribution presented in [27] considered two levels of multimodal fusion for sentiment analysis. The first level combines text with audio and combines text with video features. The Softmax fusion was applied to combine the prediction results. The Multimodal Corpus of Sentiment Intensity (CMU-Mosi), CMU-Mosei, and Interactive Emotional Dyadic Motion Capture (Iemocap) (https://sail.usc.edu/iemocap/, accessed on 2 January 2020) datasets were evaluated, and the proposed approach outperformed the benchmark techniques for binary and multi-classification, where the best-achieved accuracy attained a value of 97.86%. The effectiveness of the approach presented in [27] is mainly related to fusion at the data and decision levels.
The framework published in [28] allows a dynamic fusion of various modalities for sentiment analysis. Besides, the authors of [28] suggested and validated a new loss function that supported finding the suitable target sub-space. Considering the CMU-Mosi and CMU-Mosei datasets, the approach described in [28] achieved the best accuracy among the benchmark techniques for the two evaluated datasets, and the best accuracy attained a value of 87.5%. Notably, the framework designed in [28] performs the fusion of audio, visual, and language data. Unfortunately, the validation of the results was limited to two datasets.
The idea presented in [29] focused on human multimodal language based on a network that extracts multimodal sequence features. Thus, the model proposed in [29] considers language, vision, and acoustics. More specifically, the Gated Recurrent Unit (GRU) network [30] was explored to generate internal modal information. Then, the Softmax function was used to calculate the correlation between two timestamps. Finally, the ReLU function and Sigmoid layer were used for sentiment analysis. The proposed method was validated using the CMU-Mosei dataset, where the proposed approach demonstrated the best F1-score for binary sentiment classification. It achieved good results for six label classifications for emotion classification. We mention that the best accuracy achieved by the method proposed in [30] was 93.1%. More specifically, the approach published in [31] enables analyzing multimodal sentiment while considering the constraint of time delay between multimodal signals.
The model’s objective presented in [31] is to handle the problem of the dynamic weights of multimodal data. To this end, a Bidirectional Encoder Representation Transformer (BERT) [32] and a Transformer encoder [33] were adopted. Hence, the CMU-Mosei and CMU-Mosi datasets were used, and the results discussed in [32] were evaluated in terms of the mean absolute error, Pearson correlation, and accuracy. It is worth mentioning that the approach proposed in [31] provided the best results for all performance metrics for the two datasets. It is worth mentioning that the framework presented in [31] is based on different encoding techniques for dealing with multimodal data. Hence, BERT was adopted to provide lexical embedding, while the Transformer’s encoder was proven to be effectivefor visual and acoustic data. Another advantage of the framework described in [31] is that it was tested for aligned and non-aligned data.
The authors of [34] proposed an Integrating Consistency and Difference Network (ICDN) that relies on mapping transfer between different modalities. The mapping transfer was also investigated to extract multimodal features. The CMU-Mosi and CMU-Mosei datasets were explored to validate the proposed approach for multi-classification and regression tasks. More specifically, the approach presented in [34] attained the best results regarding the accuracy, F1-score, mean absolute error, and correlation compared to the baseline techniques. The best-achieved accuracy for binary and multi-classification was 83.8% and 52.0%, respectively. The major advantage of the ICDN over related works concerns the reduction of interference between irrelevant modalities. The model presented in [35] can support inter- and intra-modality dynamics. Further, the asymmetric window is used to represent the asymmetric weights of context. The approach presented in [35] was tested on the CMU-Mosi dataset, and it achieved the best accuracy and the best F1-score of 80% and 79.9%, respectively. The model introduced in [35] is limited to analyzing sentiments in user-generated videos.
The authors of [36] recently developed a self-attention fusion framework that considers text, audio, and visual features. Hence, the proposed framework allows the detection of internal and external features’ correlation. It is built based on an attention network, which takes the three stated features and outputs the attention scores to indicate the importance of each feature. More specifically, the self-attention framework is hierarchical and based on a read–write mechanism to capture the correlation of different modalities. The experimental results shown in [36] were conducted using the CMU-Mosi dataset and showed the effectiveness of the self-attention mechanism for increasing the accuracy compared to the benchmark techniques.
With the high-quality results obtained using the previously discussed method, they still had some limitations with respect to their quality. For example, the ability to balance between global and local search still requires more improvements. Since this will influence the quality of the selected features that will reflect the classification accuracy, this motivated us to propose an alternative FS method based on the integration between the CGO and TransCNN as a DL model.

3. Background

In this section, the background of Chaos Game Optimization (CGO) is introduced (as in Algorithm 1). In general, CGO emulates the concepts of chaos theory [18,37]. The CGO is similar to other MH techniques, which generate a set of solutions (i.e., eligible seeds) X as defined in the following formula:
X i j = L B j + r a n d × ( U B j L B j ) , j = 1 , 2 , , D , i = 1 , 2 , , N
where D represents the dimension of the solution. r a n d is a random value belonging to [0, 1].
Thereafter, the fitness value of X i is computed, and the solution that has the best fitness is assigned as the best solution X b . The next process is to compute the mean values of the chosen solutions, named the Mean Group ( M G i ). Then, a temporary triangle is constructed according to X i , X b , and M G i . Then, each temporary triangle produces four new solutions (seeds) as defined in the following equations.
X N i 1 = X i + α i × ( β i × X b γ i × M G i ) , i = 1 , 2 , , n
X N i 2 = X b + α i × ( β i × X i γ i × M G i ) , i = 1 , 2 , , n
X N i 3 = M G i + α i × ( β i × X i γ i × X b ) , i = 1 , 2 , , n
X N i 4 = X i ( X i k = X i k + R ) , k = 1 , 2 , , d
where β i and γ i are random values generated from [0, 1]. α i refers to the factorial used to simulate the movement limitations of X. The value of α i can be updated using the following formula:
α i = R a n d 2 × R a n d ( δ × R a n d ) + 1 ( ϵ × R a n d ) + ( ϵ ) ,
where R a n d denotes a uniformly random value. ϵ and δ are the random integer values. Then, the fitness value of the four seeds is computed, then we replace the worst solutions with these new solutions. After that, the stop conditions are checked, and in case they are satisfied, the updating process is stopped and the best solution returned.
Algorithm 1 Algorithm of CGO.
1:
Input:
2:
D: the number of starting eligible seeds.
3:
Initialize the starting positions ( S k j ) with random values of eligible seeds ( S k ).
4:
Output:
5:
G: the global best eligible seed.
6:
Method:
7:
Compute the objective function for each eligible seed.
8:
repeat
9:
    for  k = 1 to D do
10:
        Create a mean group ( M k ).
11:
        Construct temporary triangles on three vertices of S k , G, and M k .
12:
        Create new seeds by Equations (2) to (5).
13:
        if boundaries are crossed by new seeds then
14:
           Position limitations can be adjusted for new seeds.
15:
        end if
16:
        Assess the fitness of new points.
17:
        if new seeds have a higher objective function than the last initial eligible seeds then
18:
           Substitute the last points by the new ones.
19:
        end if
20:
        if the best solution is achieved then
21:
           Amend G.
22:
        end if
23:
    end for
24:
until The iteration criterion has been met.
25:
Return G.

4. Proposed SIoT Method

4.1. Proposed DL Model for Feature Extraction

This section briefly describes the basics of the Transformer-based architecture for text feature representation learning and the vanilla Transformer encoder for numerical data representation. In addition, we describe the proposed discriminative DL model implemented for feature extraction, named the TransCNN.
The DistilBERT was produced using a distillation process (knowledge transfer) and the vanilla Bidirectional Encoder Representations from Transformers (BERT) model [32]. For instance, DistilBERT possesses 40% fewer parameters than BERT and uses only 6 Transformer encoders rather than 12, as in BERT. In addition, DistilBERT was trained on the same corpora as BERT, where Next-Sentence Prediction (NSP) and segment embedding learning were omitted when training the model.
DistilBERT receives a sequence of tokens X = x 1 , , x s representing a sentence X as a data sample where the objective is to learn the semantic representation S 3 of X via several Transformer encoders and output a feature vector. The sequence X is tokenized using the Wordpiece sub-word tokenizer [32] to generate the input embeddings ( S 1 ) representing a word, segment, and positional embeddings for each token. The Wordpiece tokenizer adds extra token embeddings to the input X, including [SEP] and [CLS] at the beginning and the end, respectively. A multi-layered Recurrent Neural Network (RNN) with an attention mechanism is used to sum up S 1 embeddings and generate a single contextual vector S 2 . Later, the S 3 feature vector is produced by concatenating all S 2 for the input sequence X and stored in the [CLS] token with a dimension of 768 vector.
For a vanilla Transformer encoder, the input data will pass through a multihead attention block composed of a Multi-Layer Feedforward Neural Network (MLFFNN) [38], and the generated output will add to the original input using a residual connection similar to the ResNets network structure. In addition, a layer normalization is applied to the output of the MLFFNN block. With the help of the attention mechanism, the Transformer block can dynamically decide which of the learned features is more important than the others using four components, including the Query (Q), Key (K), Value (V), and a scoring function such as a dot-product or a small MLP. A dot-product attention mechanism is defined in Equation (7).
A T T ( Q , K , V ) = S o f t m a x ( Q K t d ) V .
where Q K t represents the dot-product matrix for all possible pairs (Q,K). To obtain the attention weights, a Softmax function is used with a multiplication to the value vector. 1 d represents the scaling factor to control the attention values’ variance. The dot-product attention can be extended to a multihead attention with multiple (Q,K,V) triplets’ concatenation, which is defined as in Equation (8).
M u l t i h e a d A t t ( Q , K , V ) = C o n c a t ( h e a d 1 , , h e a d h ) W O h e a d i = A T T ( Q W i Q , K W i K , V W i V ) .
where W Q , W K , W V , and W O are learnable parameter matrices and h is the number of heads.
The proposed model, named the TransCNN, is composed of several core components, including Transformer-based encoders, 1D convolution, and 1 × 1 convolution blocks. Transformer-based encoders have been widely used in various applications such as time series forecasting [39], text classification [40,41], and image processing [42,43]. The TransCNN architecture is designed as shown in Figure 1, where a specific trainable layer is used to extract the input data features. The extracted feature vector for each data sample will be the input of the feature selection algorithm used to boost the performance of a specific task and reduce the number of redundant features by preserving only the most relevant.
To design a robust DL architecture, selecting components is very challenging when using the DL model on a different task where the input type is not the same (text or numerical data). For this reason, the TransCNN is built with pluggable Transformer-based encoder blocks, where in the case of textual data, the TransCNN used a pre-trained Transformer-based model named DistilBERT [44]. In contrast, the TransCNN uses four vanilla Transformer encoders if the input data are numerical. Mainly, the TransCNN data flow is as follows: i n p u t T r a n s f o r m e r 1 D c o n v o l u t i o n ( 1 × 1 ) c o n v o l u t i o n . In the following paragraphs, we detail the components of each building block of the TransCNN.

4.1.1. Transformer Block

The objective for textual data input is to learn and obtain better representations using DistilBERT as the main Transformer block. We fine-tuned only the top encoder layer of the pretrained DistilBERT (distilbert-base-uncased) for several epochs during the training of the TransCNN to speed up the learning process and minimize the overall model size. The [CLS] vector extracted using DistilBERT with a size of 768 representing the sequence X will be fed to the 1D convolution block for feature representation refinement.
In terms of numerical data input, the objective is to learn and extract attention-based representations of the raw data by maximizing the model performance on a specific task using a vanilla Transformer encoder with a multihead attention mechanism similar to the BERT architecture. In our model, we used a Transformer block with four encoder blocks and a variant number of heads ranging from one to nine based on the data sample attributes with a feedforward layer of dimension 512. At this stage, we trained the Transformer on the data samples from scratch rather than using a pre-trained Transformer block.

4.1.2. Convolution and Classification Blocks

At this stage, the output from the Transformer block is fed to a convolution block consisting of three sequential convolution layers with an output channel equal to 16, 32, and 64, respectively. Each convolution layer uses the Rectified Linear Unit (ReLU) activation function and a 1D convolution with a kernel size of 1 × 3 . In addition, each convolutional layer is followed by a batch normalization layer and a max-pooling layer with size 2. Later, the output from the convolution above blocks is fed to two 1 × 1 pointwise convolutions with a kernel size of 1 × 1 . The 1 × 1 pointwise convolution replaces the MLP layer in our model, where the first 1 × 1 convolution layer is used as our feature extractor during inference and the second 1 × 1 convolution layer is used as our classification layer during training. The feature extraction layer generates different sizes of feature representations from the input raw data features, which will be to the feature selection algorithm a new representation of the input data sample. The objective is to learn better feature representations rather than relying on raw features. The 1 × 1 convolution layer uses the H-swish activation function, which replaces the Sigmoid activation function introduced in the paper [45], defined as in Equation (9).
h s w i s h ( x ) = x · σ ( x ) , σ ( x ) = R e L U 6 ( x + 3 ) 6 .
where σ ( x ) represent the piecewise linear hard analog function.
The model was fine-tuned for 100 epochs for numerical datasets and 5 epochs when using text datasets (due to the large amount of data and the significant parameters in the pre-trained DistilBERT) with a batch of size 64. Meanwhile, to update the model’s weight and bias parameters, we used the AdamW optimizer with a learning rate of 5 × 10 3 . To overcome the model’s overfitting, we used a dropout layer with a probability of 0.38 and an early-stopping mechanism for the validation loss. We used the cross entropy loss function to compute the loss between the output logits of the model and the target classes.

4.2. Proposed MH Model for Feature Selection

The training dataset was used to train the model to recognize the key features, and the test dataset was used to compare the feature extraction methods. The stages of the binary CGO optimization technique are shown in Figure 2. First, the CGO is tasked with creating a collection of N agents X that represent the optimal FS solution. Then, a task is completed using the following formula:
X i = r a n d × ( U L ) + L , i = 1 , 2 , , N , j = 1 , 2 , , D i m
In Equation (11), the dimension of the particular problem is indicated by the symbol D i m (i.e., the number of features). In contrast, U and L define the search space. The Boolean addition of each X i must then be obtained. This is performed by using the following equations:
B X i j = 1 i f X i j > 0.5 0 o t h e r w i s e
By utilizing an optimization strategy, which is dependent on the binary B X i and classification errors, the goal value from each X i is computed.
F i t i = λ × γ i + ( 1 λ ) × | B X i | D i m ,
where the ratio of the defined feature sets is represented by ( | B X i | D i m ) . The KNN classification error is indicated by the symbol γ i . KNN is frequently used since it has fewer parameters and is significantly more stable than other classification approaches. In contrast, the measurement λ always requires adjusting for the proportion of the chosen characteristics and the categorization error.
The best option is then brought back after looking at the stopping criteria to see if they have been met, or the automatic updating procedures are repeated.

5. Experiments and Results

Within this section, we discuss the results of the developed SIoT model based on the CGO algorithm as the FS technique and the TransCNN as the feature extraction approach. The performance of a modified CGO is compared with a set of ten algorithms including the Honey Badger Algorithm (HBA) [46], Grey Wolf Optimizer (GWO) [47], Dwarf Mongoose Optimization (DMOA) [48], Chameleon (Chame) [49], Electric Fish Optimization (EFO) [50], Arithmetic Optimization Algorithm (AOA) [51], Aquila Optimizer (AO) [52], Reptile Search Algorithm (RSA) [53], LSHADE [54], and Self-adaptive Differential Evolution algorithm (SaDE) [55]. In this experiment, we used the original values of the parameters of each of these algorithms. In addition, for a fair comparison, we set the number of iterations and the number of solutions to 30 and 20, respectively. Those algorithms were conducted using Matlab 2014b installed on a computer with Windows 10 64 bit with 8 GB RAM Intel Core i5 processor.

5.1. Dataset Description

During our experiments, we used several datasets covering a variety of data types, tasks, and attributes related to SIoT applications. Table 2 lists the attributes and tasks we used in our experiments. For instance, Human Activity Recognition (HAR), healthcare, event detection, and sentiment analysis were the tasks. The data types included numerical and text. The total datasets used to validate the proposed framework was eight. For the numerical datasets, we used the following datasets from the UCI repository: GPS trajectories dataset, GAS sensors dataset, Hepatitis dataset, MovementAAL (Indoor User Movement Prediction from RSS) dataset, and UCI HAR dataset. For the text datasets, we used the following datasets: STS-Gold [56], SemEval2017 Task4 dataset [57] and C6 dataset [58]. In addition, 77% and 33% split ratios for the training and testing set were used, respectively. In addition, the new version of the extracted features using the proposed DL model is given in Table 3.

5.2. Evaluation Metrics

In our experiments, several evaluation indicators were used to validate the proposed framework and present a clear insight into the performance of the developed optimization method. In addition, we combined the common evaluation metrics to perform a fair comparison against state-of-the-art methods, including accuracy, fitness value, sensitivity, and specificity. The used evaluation metrics are defined as follows [59]:
A V A c c = 1 N r k = 1 N r A c c B e s t k ,
A c c B e s t = T P + T N T P + F N + F P + T N
where A V A c c represents the average accuracy and A c c B e s t represents the highest obtained accuracy value. N r is the number of iterations or runs. TP, TN, FP, and FN represent the True Positive, True Negative, False Positive, and False Negative rates from the confusion matrix representing the classification report [59].
A V S e n s is calculated as:
A V S e n s = 1 N r k = 1 N r S e n s B e s t k ,
S e n s B e s t = T P T P + F N
where A V S e n s represents the average sensitivity based on S e n s B e s t , which is also known as the true positive rate, representing the rate of predicting positive classes.

5.3. Results and Discussion

The comparison results between the developed CGO and others are given in Table 4, Table 5, Table 6, Table 7 and Table 8. In 
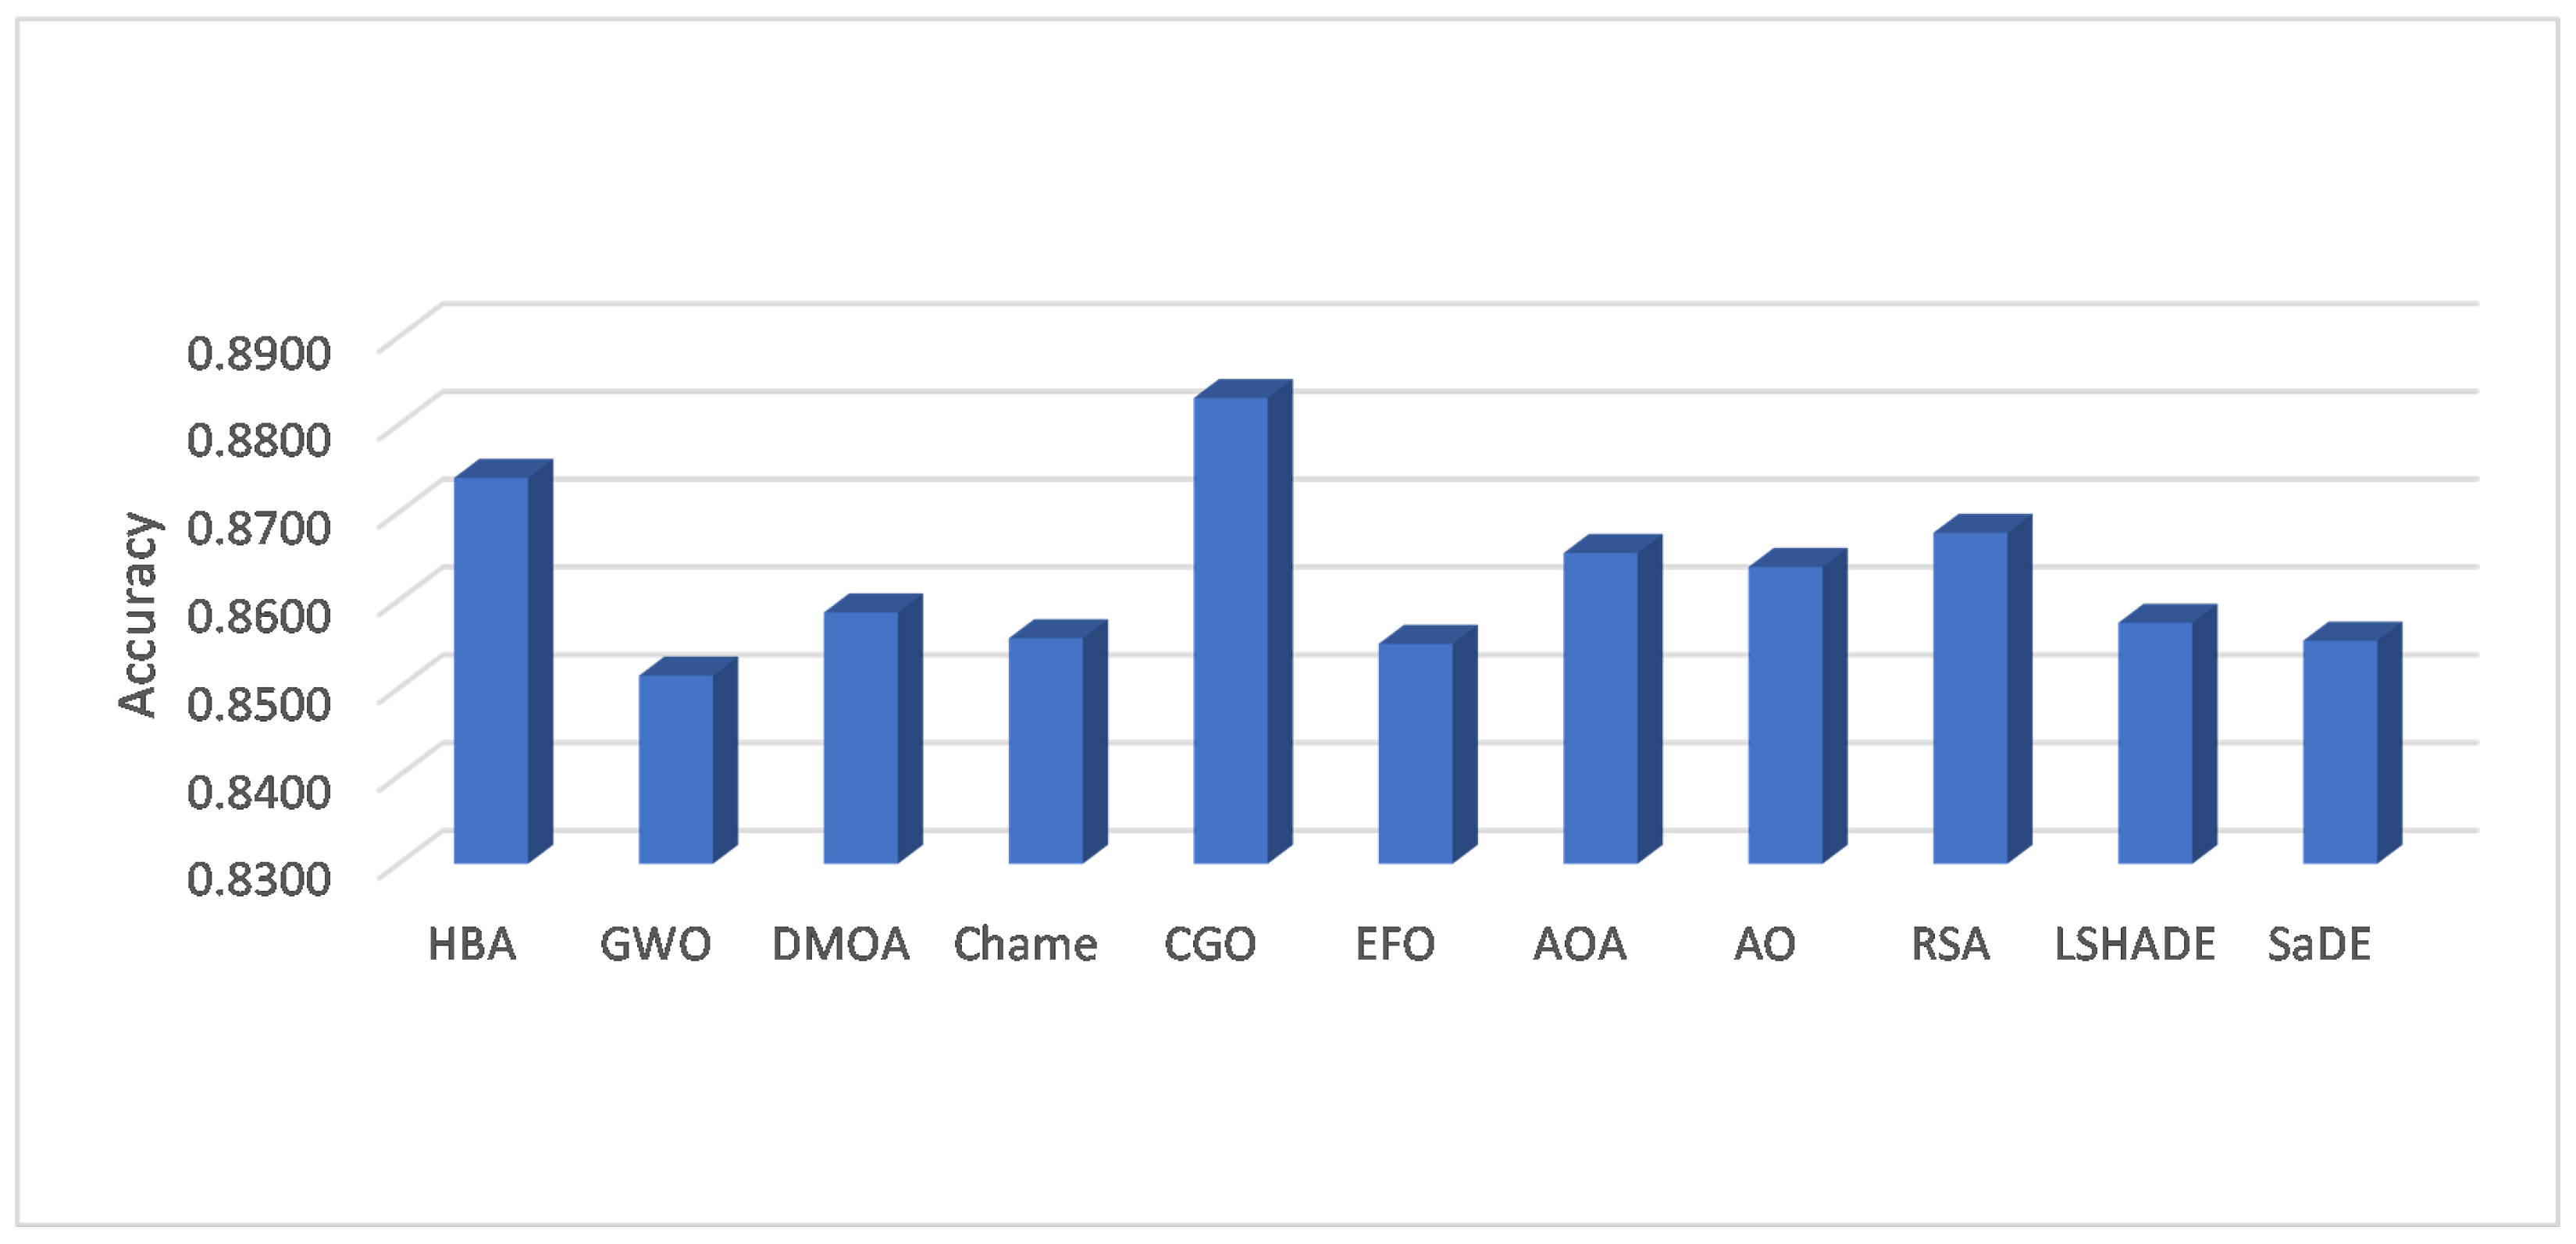
Table 4, the average classification accuracy is shown, and it can be seen that the developed CGO performs better on seven datasets. This nearly represents 88% of the total number of datasets. This is followed by the HBA, which has the best accuracy for one dataset: Hepatitis. CGO and the HBA obtained the same accuracy, equal to 94.10%, on the STSGold dataset in terms of textual datasets. In addition, Figure 3 depicts the average accuracy among the eight datasets, and we can observe that CGO has a higher value. In terms of average accuracy, CGO outperformed the HBA by more than 1%. This indicates the efficiency of CGO over all other methods, whereas the HBA is ranked second and the RSA third.
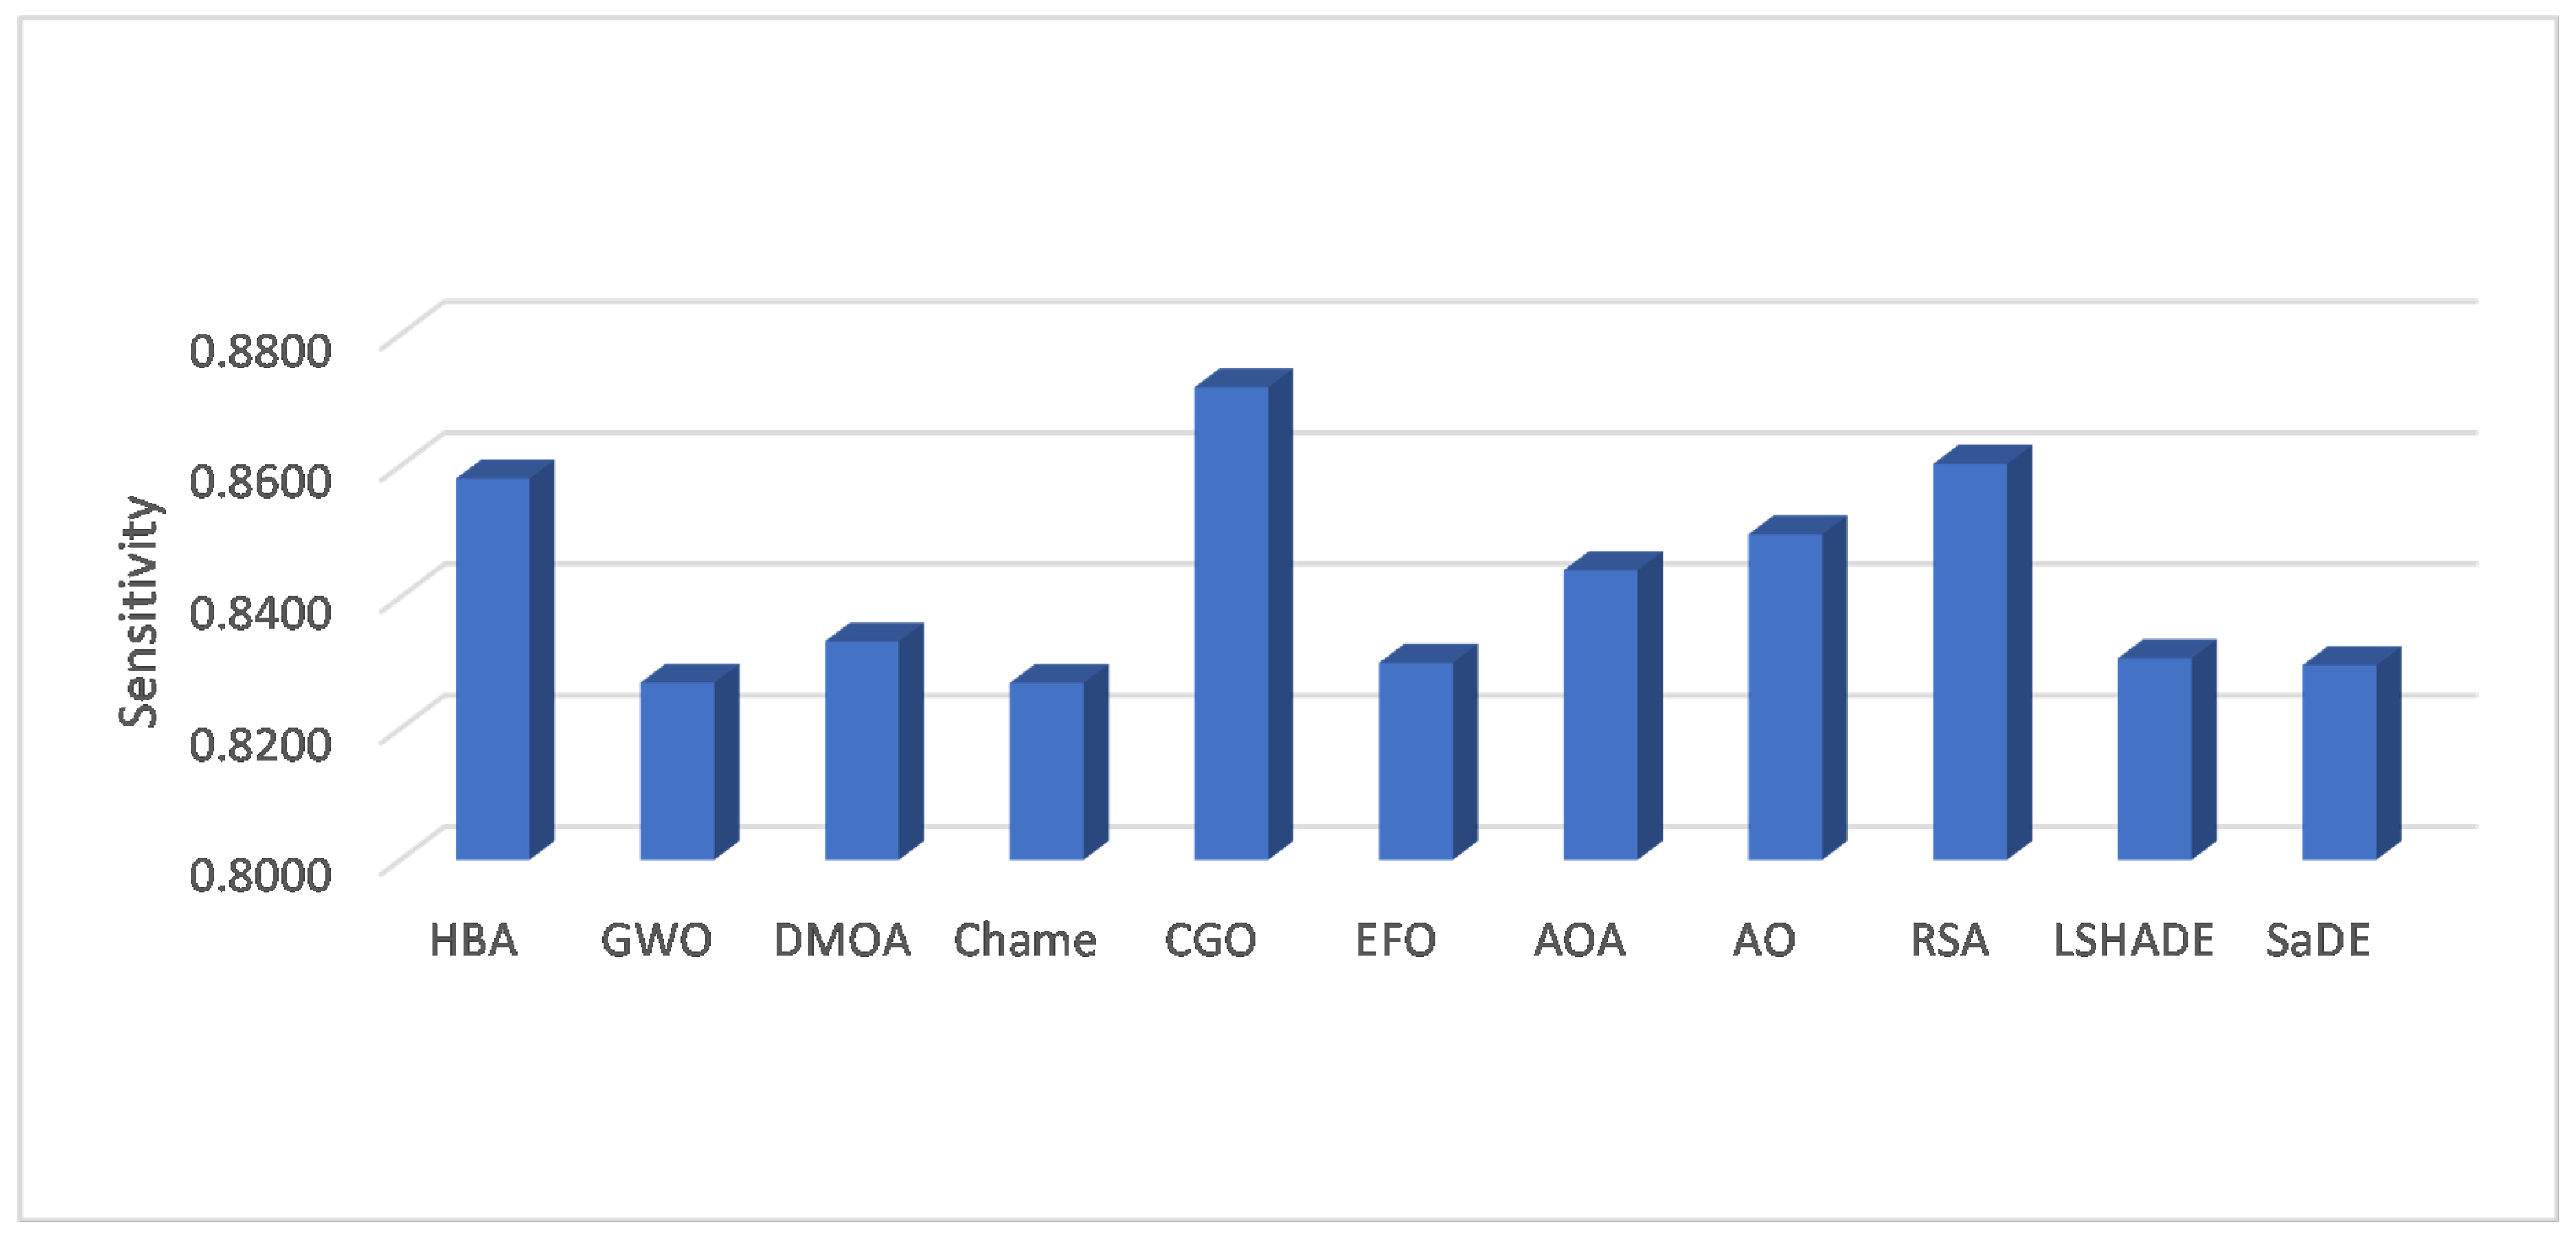
According to the sensitivity values given in Table 5, it can be noticed that CGO and the HBA have the best sensitivity values for three and two datasets, respectively. They are followed by the RSA, EFO, and GWO, which have the highest sensitivity for one dataset. In addition, the average sensitivity among the eight datasets, as in Figure 4, shows that CGO is the best algorithm. The RSA follows CGO, which provided a sensitivity better than the other methods, and the HBA is in the third position according to the sensitivity measure.
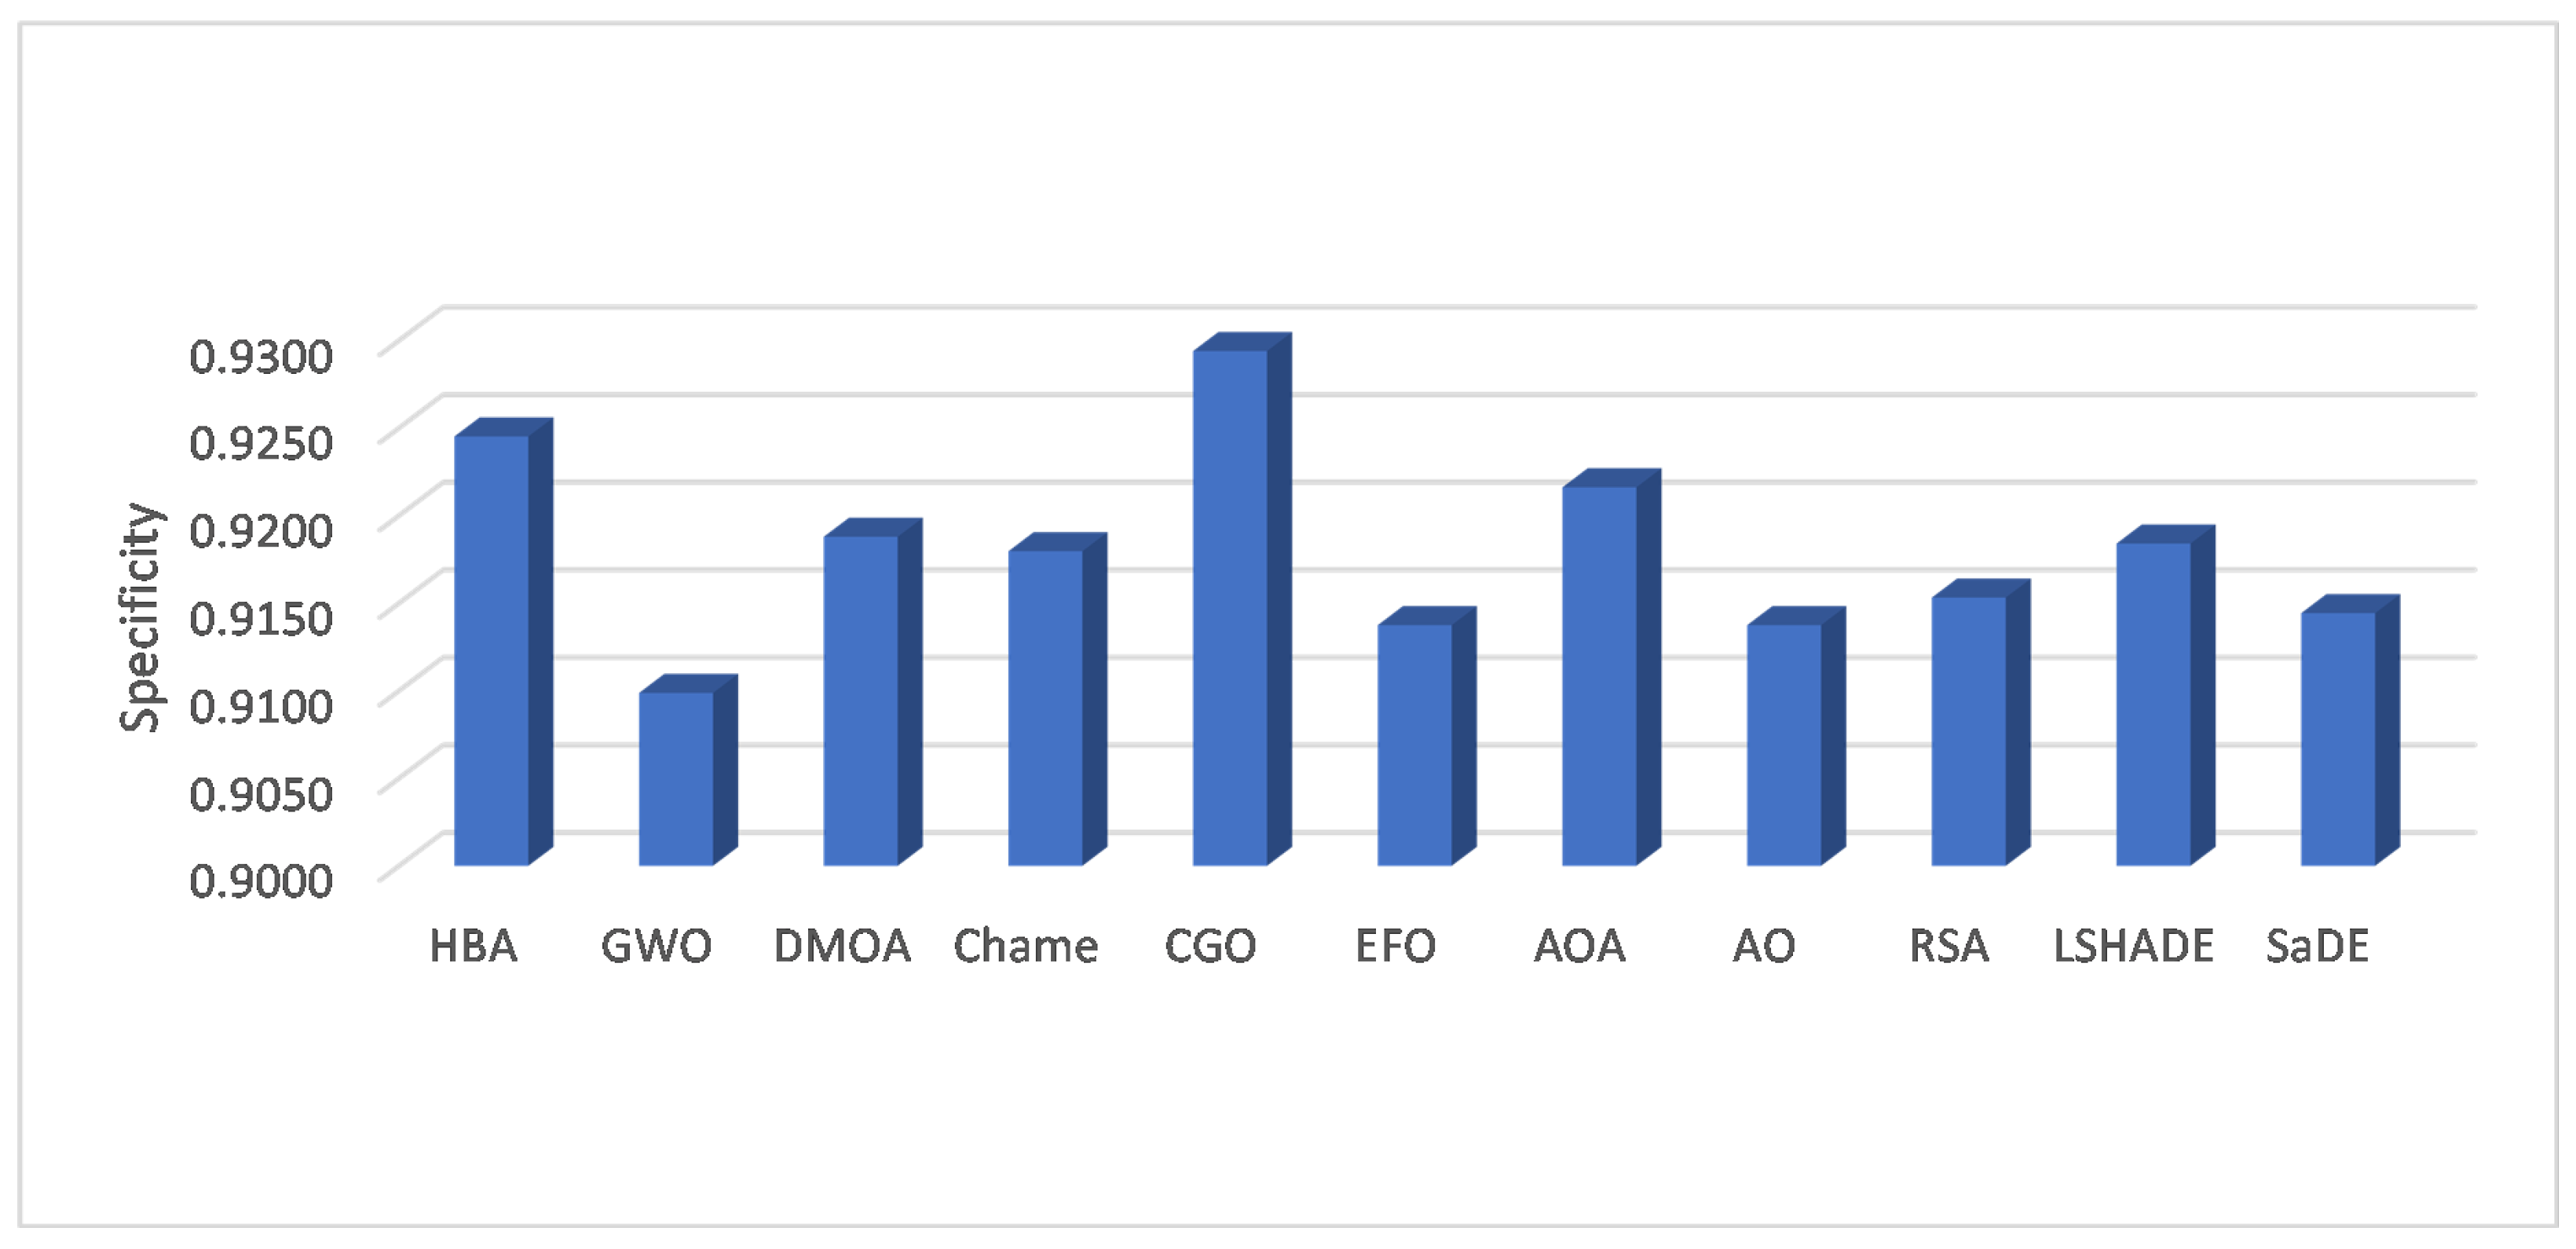
Table 6 illustrates the specificity value obtained using CGO and the other methods. These values show that the HAB and CGO have nearly the same performance since both have the best value for the four datasets. In addition, they have the same value for the two datasets named Trajectory and Sensors. At the same time, the RSA provides results better than the other methods in terms of specificity. The same observation can be noticed in Figure 5, which depicts the average specificity among the eight datasets.
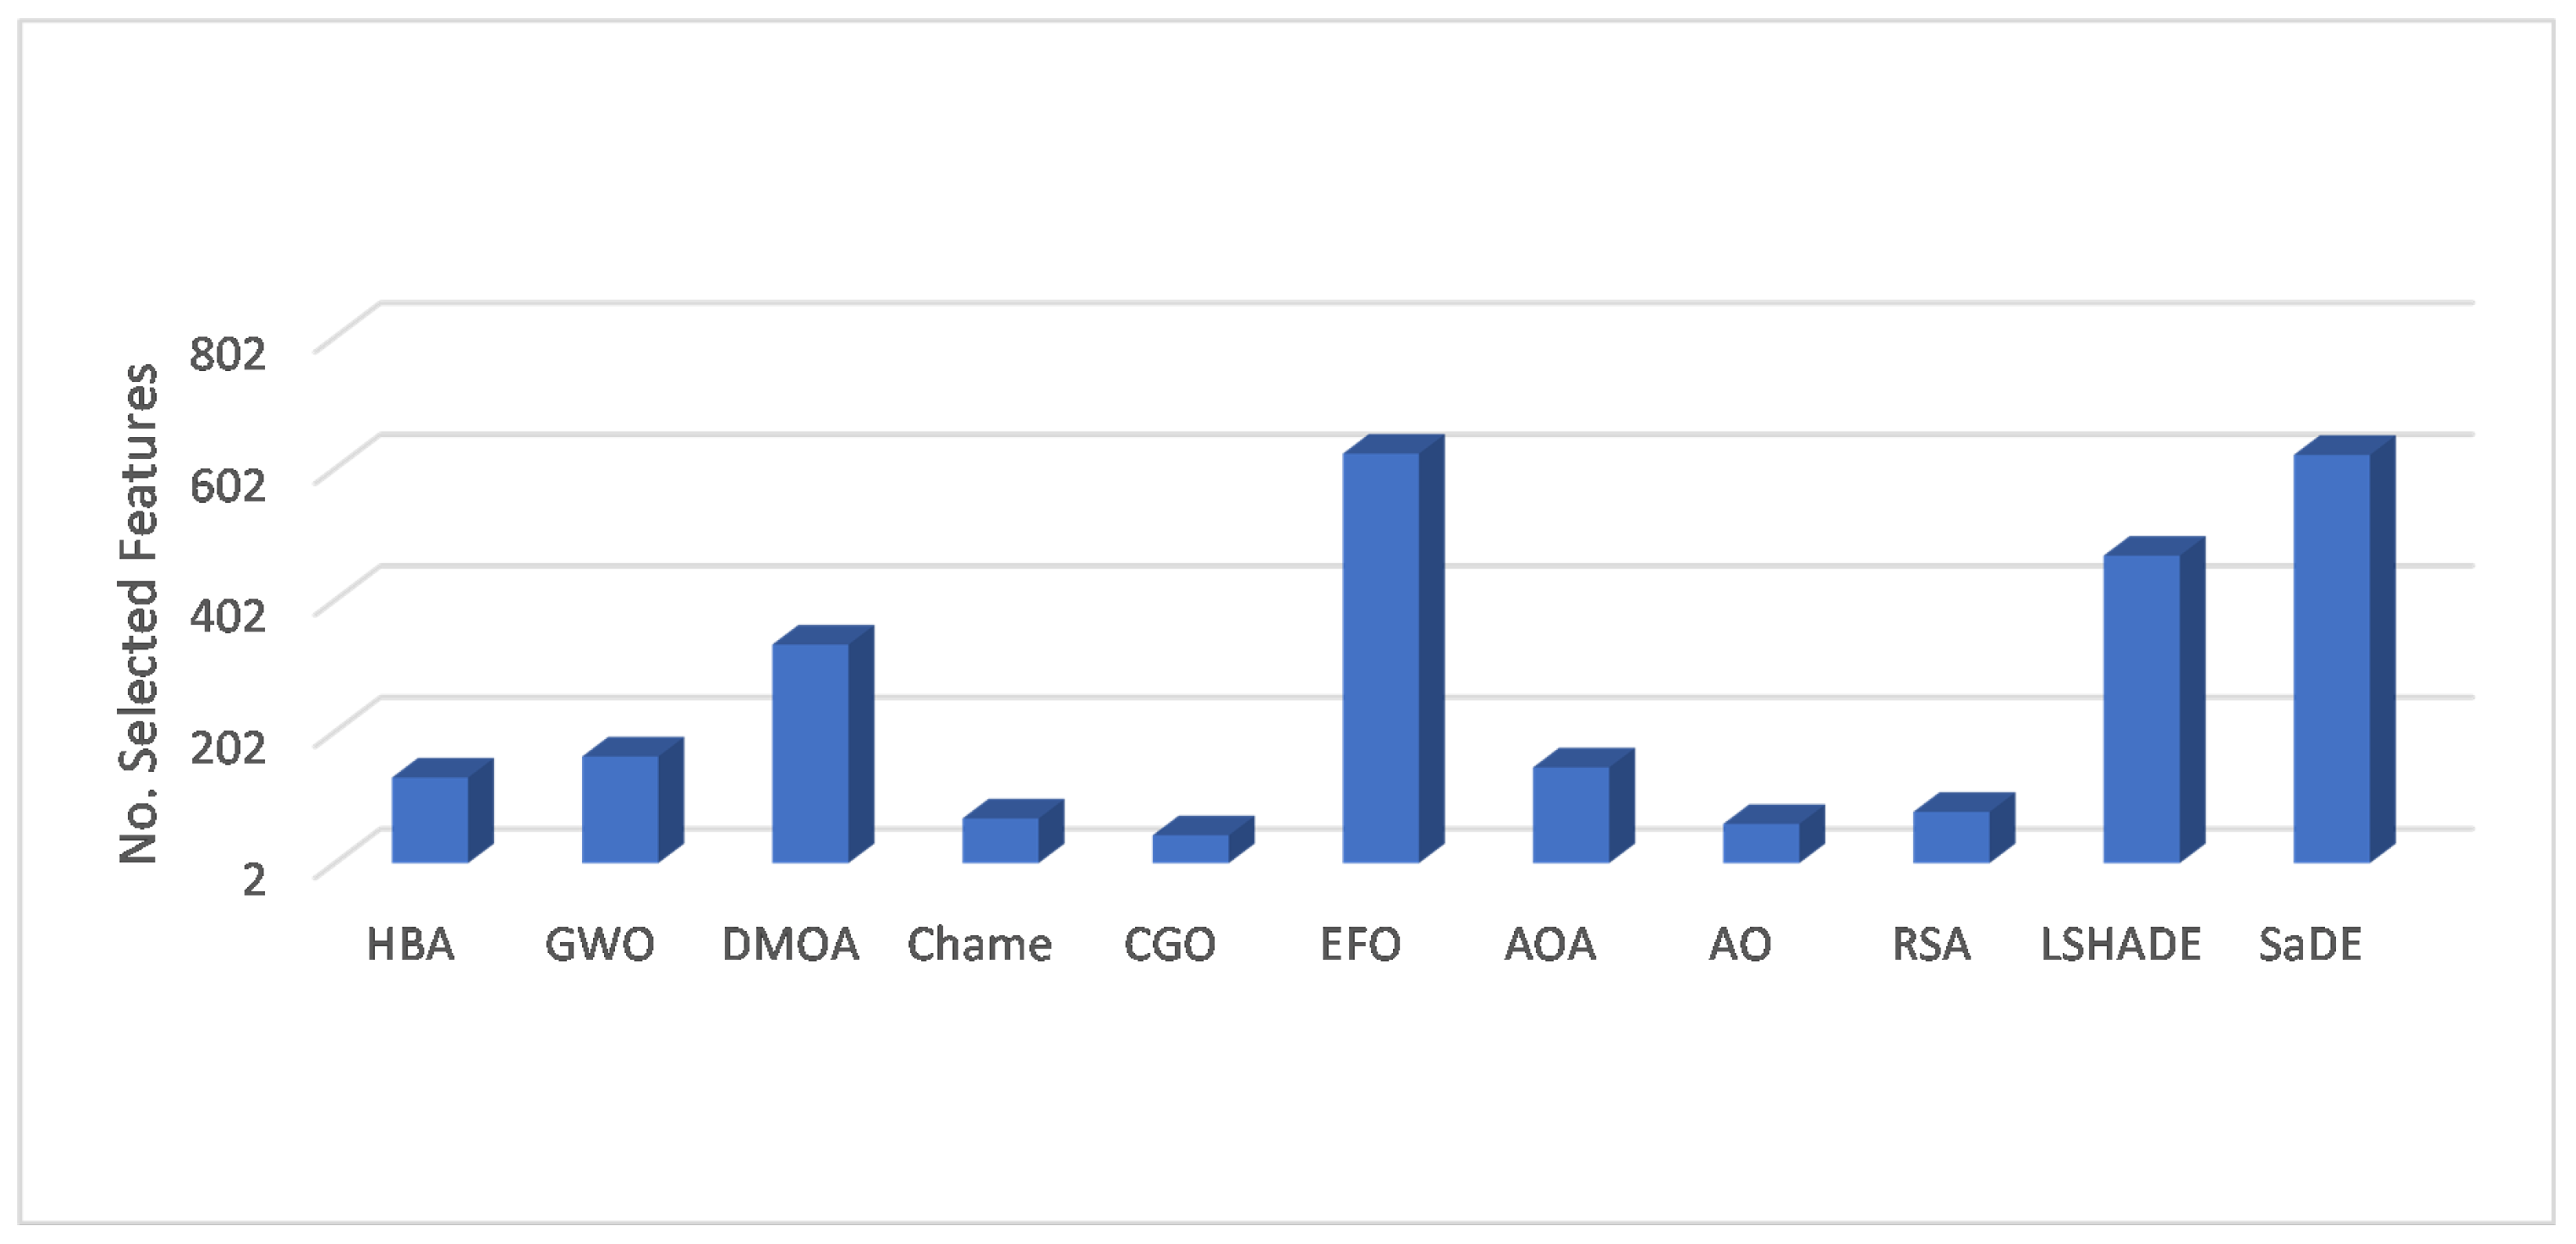
Table 7 depicts the average of the selected features obtained using CGO and the other methods. From those results, we can notice that the smallest number of selected features is obtained using CGO for the five datasets. The HBA, AO, and RSA have the smallest number of selected features in one dataset. Moreover, it can be seen from Figure 6 that CGO has a loweraverage of the selected features among the tested datasets, followed by AO, and the RSA, which are the second and third, respectively, best algorithms according to the selected features.
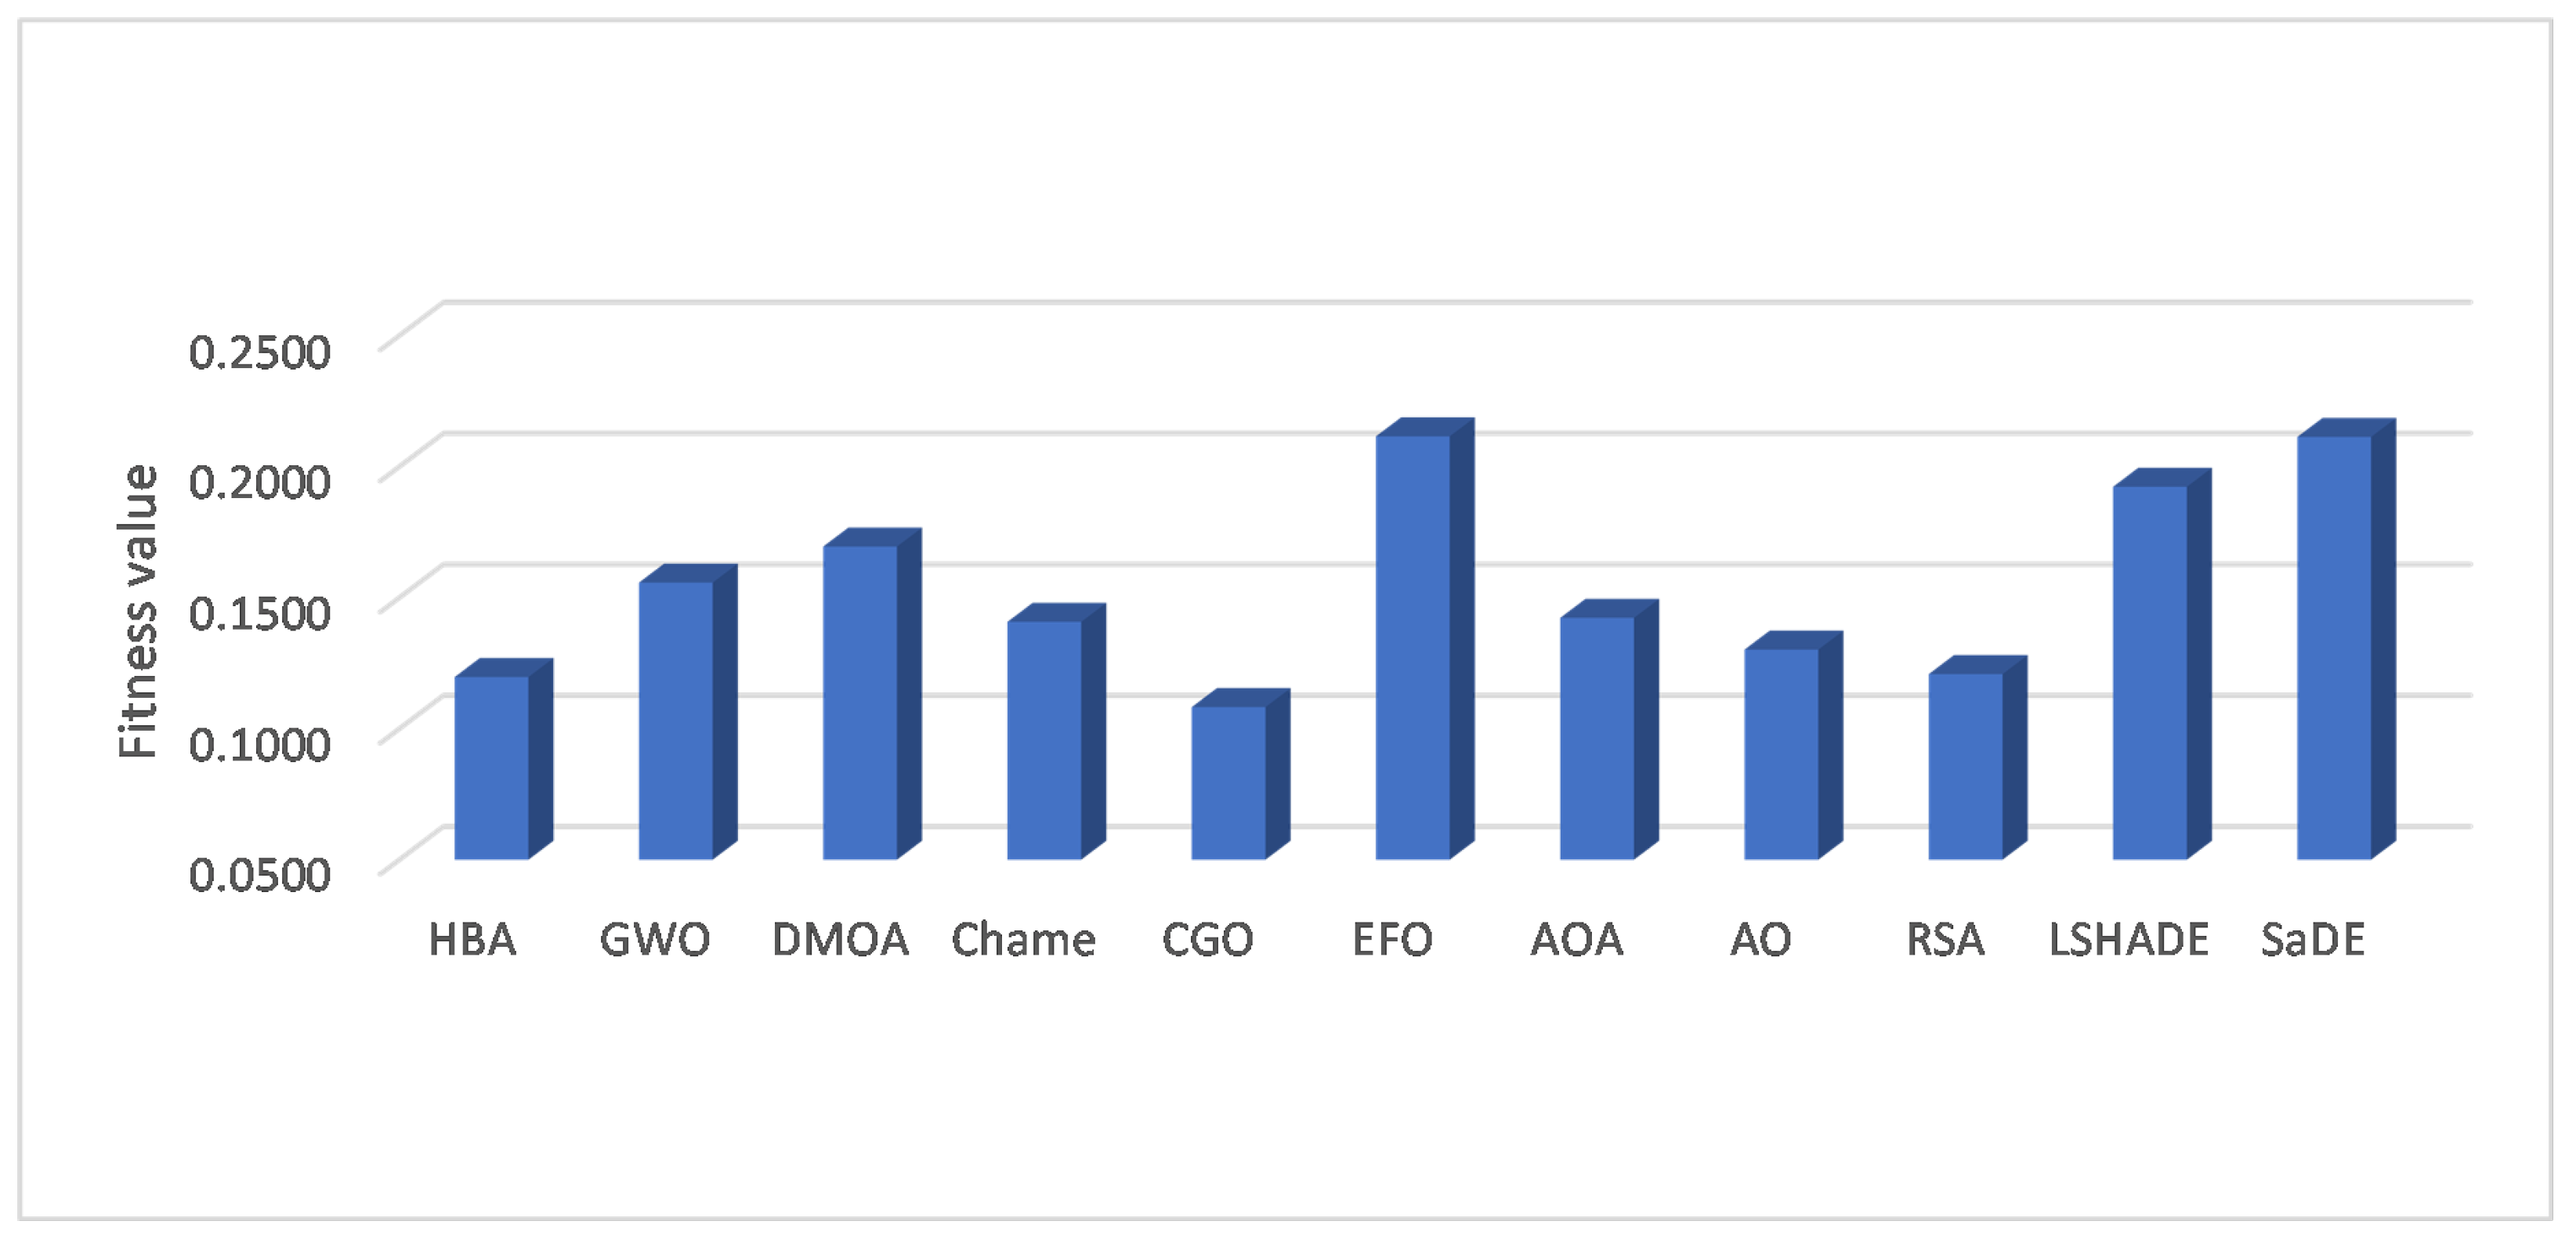
Finally, Table 8 shows the average fitness value obtained using the competitive algorithms to handle the SIoT datasets. From these results, one can see that CGO has the smallest fitness value for five datasets, followed by the HBA, which has the smallest value for two datasets. The average fitness value overall for the eight datasets is depicted in Figure 7, and we can observe from this figure that the CGO has nearly a 0.10 fitness value, which is the smallest value. At the same time, the HBA can obtain a fitness value smaller than other methods.
For further analysis, the results obtained using CGO and the other methods are given in Table 9. These results represent the mean rank obtained using the Friedman test. This test aims to determine whether there is a significant difference between the developed method and other methods. From those results, we can notice that the developed CGO has the best mean rank based on the accuracy, sensitivity, specificity, number of features, and fitness value. The HBA follows this in terms of the accuracy, sensitivity, specificity, and fitness value. However, according to the performance of the algorithms based on the value of several features, AO is ranked second.
From the previous discussion, it can been noticed that the CGO algorithm has a high ability to increase the prediction performance with a minimum number of features. This was achieved because CGO can balance the exploration and exploitation phases during the search process.

5.4. Future Work

The developed framework can be extended to future work to other applications, including medical, agriculture, and others. In addition, it can be modified using fractional calculus and another hybrid mechanism. Meanwhile, searching for the optimal hyper-parameters of the proposed DL models using MH algorithms can be beneficial to improve the framework’s overall performance.

6. Conclusions and Future Work

This paper developed an alternative Social Internet of Things (SIoT) technique based on integrating the advantages of the Deep Learning (DL) model and meta-heuristic approach. The DL, the TransCNN, was applied to extract the features from the tested dataset. At the same time, Chaos Game Optimization (CGO) is an MH technique used to determine the relevant features. To evaluate the performance of the developed SIoT model, we compared it with ten other well-known methods, including the HBA, GWO, DMOA, Chame, EFO, AOA, AO, RSA, LSHADE, and SaDE. These methods were applied as FS methods and have demonstrated their efficiency. According to the obtained results, the developed SIoT provided better performance than the other models based on the accuracy, specificity, sensitivity, and fitness value.

Author Contributions

Conceptualization, M.A.E., A.D., S.A.C. and M.A.; methodology, M.A.E., A.D., S.A.C. and M.A.; software, M.A.E., A.D., S.A.C. and M.A.; validation, M.A.E., A.D., S.A.C. and M.A.; formal analysis, M.A.E., A.D., S.A.C. and M.A.; investigation, M.A.E., A.D., S.A.C. and M.A.; writing—review and editing, M.A.E., A.D., S.A.C. and M.A.; visualization, M.A.E., S.A.C. and M.A.; supervision, M.A.E. and A.D. All authors have read and agreed to the published version of the manuscript.

Funding

This research project was funded by the Deanship of Scientific Research, Princess Nourah bint Abdulrahman University, through the Program of Research Project Funding After Publication, grant No (43- PRFA-P-17).

Institutional Review Board Statement

Not applicable.

Informed Consent Statement

Not applicable.

Data Availability Statement

The data are available from the authors upon request.

Acknowledgments

This research project was funded by the Deanship of Scientific Research, Princess Nourah bint Abdulrahman University, through the Program of Research Project Funding After Publication, Grant No. (43- PRFA-P-24).

Conflicts of Interest

The authors declare that there are no conflict of interest regarding the publication of this paper.

References

  1. Elsisi, M.; Tran, M.Q. Development of an IoT architecture based on a deep neural network against cyber attacks for automated guided vehicles. Sensors 2021, 21, 8467. [Google Scholar] [CrossRef]
  2. Tran, M.Q.; Amer, M.; Abdelaziz, A.Y.; Dai, H.J.; Liu, M.K.; Elsisi, M. Robust Fault Recognition and Correction Scheme for Induction Motors Using an Effective IoT with Deep Learning Approach. Measurement 2023, 207, 112398. [Google Scholar] [CrossRef]
  3. Cheng, W.S.; Chen, G.Y.; Shih, X.Y.; Elsisi, M.; Tsai, M.H.; Dai, H.J. Vickers hardness value test via multi-task learning convolutional neural networks and image augmentation. Appl. Sci. 2022, 12, 10820. [Google Scholar] [CrossRef]
  4. Sakkarvarthi, G.; Sathianesan, G.W.; Murugan, V.S.; Reddy, A.J.; Jayagopal, P.; Elsisi, M. Detection and Classification of Tomato Crop Disease Using Convolutional Neural Network. Electronics 2022, 11, 3618. [Google Scholar] [CrossRef]
  5. Atzori, L.; Iera, A.; Morabito, G. The internet of things: A survey. Comput. Netw. 2010, 54, 2787–2805. [Google Scholar] [CrossRef]
  6. Chelloug, S.A.; El-Zawawy, M.A. Middleware for internet of things: Survey and challenges. Intell. Autom. Soft Comput. 2018, 24, 309–318. [Google Scholar] [CrossRef]
  7. Mala, D.J. Integrating the Internet of Things into Software Engineering Practices; IGI Global: Hershey, PA, USA, 2019. [Google Scholar]
  8. Zannou, A.; Boulaalam, A.; Nfaoui, E.H. SIoT: A new strategy to improve the network lifetime with an efficient search process. Future Internet 2020, 13, 4. [Google Scholar] [CrossRef]
  9. SD, M.; Prakash, S.S.; Krinkin, K. Service Oriented R-ANN Knowledge Model for Social Internet of Things. Big Data Cogn. Comput. 2022, 6, 32. [Google Scholar]
  10. Rad, M.M.; Rahmani, A.M.; Sahafi, A.; Qader, N.N. Social Internet of Things: Vision, challenges, and trends. Hum.-Centric Comput. Inf. Sci. 2020, 10, 1–40. [Google Scholar]
  11. Thangavel, G.; Memedi, M.; Hedström, K. A systematic review of Social Internet of Things: Concepts and application areas. In Proceedings of the 2019 Americas Conference on Information Systems, Cancún, Mexico, 15–17 August 2019. [Google Scholar]
  12. Marche, C.; Atzori, L.; Nitti, M. A dataset for performance analysis of the social internet of things. In Proceedings of the 2018 IEEE 29th Annual International Symposium on Personal, Indoor and Mobile Radio Communications (PIMRC), Bologna, Italy, 9–12 September 2018; pp. 1–5. [Google Scholar]
  13. Fang, Q.; Wang, G.; Du, J.; Liu, Y.; Zhou, M. Prediction of tunnelling induced ground movement in clay using principle of minimum total potential energy. Tunn. Undergr. Space Technol. 2023, 131, 104854. [Google Scholar] [CrossRef]
  14. Huang, Z.; Zhang, D.; Pitilakis, K.; Tsinidis, G.; Huang, H.; Zhang, D.; Argyroudis, S. Resilience assessment of tunnels: Framework and application for tunnels in alluvial deposits exposed to seismic hazard. Soil Dyn. Earthq. Eng. 2022, 162, 107456. [Google Scholar] [CrossRef]
  15. Lakshmanaprabu, S.; Shankar, K.; Khanna, A.; Gupta, D.; Rodrigues, J.J.; Pinheiro, P.R.; De Albuquerque, V.H.C. Effective features to classify big data using social internet of things. IEEE Access 2018, 6, 24196–24204. [Google Scholar] [CrossRef]
  16. Lye, G.X.; Cheng, W.K.; Tan, T.B.; Hung, C.W.; Chen, Y.L. Creating personalized recommendations in a smart community by performing user trajectory analysis through social internet of things deployment. Sensors 2020, 20, 2098. [Google Scholar] [CrossRef] [Green Version]
  17. Ali, W.; Yang, Y.; Qiu, X.; Ke, Y.; Wang, Y. Aspect-level sentiment analysis based on bidirectional-GRU in SIoT. IEEE Access 2021, 9, 69938–69950. [Google Scholar] [CrossRef]
  18. Talatahari, S.; Azizi, M. Chaos Game Optimization: A novel metaheuristic algorithm. Artif. Intell. Rev. 2021, 54, 917–1004. [Google Scholar] [CrossRef]
  19. Zhao, Y.; Li, R.; Wang, H.; Liang, H. Distributional chaos in a sequence and topologically weak mixing for nonautonomous discrete dynamical systems. J. Math. Comput. SCI-JM 2020, 20, 14–20. [Google Scholar] [CrossRef]
  20. Talatahari, S.; Azizi, M. Optimization of constrained mathematical and engineering design problems using chaos game optimization. Comput. Ind. Eng. 2020, 145, 106560. [Google Scholar] [CrossRef]
  21. Ramadan, A.; Kamel, S.; Hussein, M.M.; Hassan, M.H. A new application of chaos game optimization algorithm for parameters extraction of three diode photovoltaic model. IEEE Access 2021, 9, 51582–51594. [Google Scholar] [CrossRef]
  22. Jiang, P.; Liu, Z.; Wang, J.; Zhang, L. Decomposition-selection-ensemble forecasting system for energy futures price forecasting based on multi-objective version of chaos game optimization algorithm. Resour. Policy 2021, 73, 102234. [Google Scholar] [CrossRef]
  23. Alsaidan, I.; Shaheen, M.A.; Hasanien, H.M.; Alaraj, M.; Alnafisah, A.S. Proton exchange membrane fuel cells modeling using chaos game optimization technique. Sustainability 2021, 13, 7911. [Google Scholar] [CrossRef]
  24. Meena Kowshalya, A.; Valarmathi, M. Evaluating twitter data to discover user’s perception about social Internet of Things. Wirel. Pers. Commun. 2018, 101, 649–659. [Google Scholar] [CrossRef]
  25. Kumar, A. Contextual semantics using hierarchical attention network for sentiment classification in social internet-of-things. Multimed. Tools Appl. 2022, 81, 36967–36982. [Google Scholar] [CrossRef]
  26. Li, Z.; Guo, Q.; Feng, C.; Deng, L.; Zhang, Q.; Zhang, J.; Wang, F.; Sun, Q. Multimodal Sentiment Analysis Based on Interactive Transformer and Soft Mapping. Wirel. Commun. Mob. Comput. 2022, 2022. [Google Scholar] [CrossRef]
  27. Sun, J.; Yin, H.; Tian, Y.; Wu, J.; Shen, L.; Chen, L. Two-Level Multimodal Fusion for Sentiment Analysis in Public Security. Secur. Commun. Netw. 2021, 2021, 1–10. [Google Scholar] [CrossRef]
  28. He, J.; Yanga, H.; Zhang, C.; Chen, H.; Xua, Y. Dynamic Invariant-Specific Representation Fusion Network for Multimodal Sentiment Analysis. Comput. Intell. Neurosci. 2022, 2022. [Google Scholar] [CrossRef]
  29. Qi, Q.; Lin, L.; Zhang, R. Feature extraction network with attention mechanism for data enhancement and recombination fusion for multimodal sentiment analysis. Information 2021, 12, 342. [Google Scholar] [CrossRef]
  30. Li, X.; Ma, X.; Xiao, F.; Wang, F.; Zhang, S. Application of gated recurrent unit (GRU) neural network for smart batch production prediction. Energies 2020, 13, 6121. [Google Scholar] [CrossRef]
  31. Qi, Q.; Lin, L.; Zhang, R.; Xue, C. MEDT: Using Multimodal Encoding-Decoding Network as in Transformer for Multimodal Sentiment Analysis. IEEE Access 2022, 10, 28750–28759. [Google Scholar] [CrossRef]
  32. Devlin, J.; Chang, M.W.; Lee, K.; Toutanova, K. Bert: Pre-training of deep bidirectional Transformers for language understanding. arXiv 2018, arXiv:1810.04805. [Google Scholar]
  33. Zeyer, A.; Bahar, P.; Irie, K.; Schlüter, R.; Ney, H. A comparison of Transformer and lstm encoder decoder models for asr. In Proceedings of the 2019 IEEE Automatic Speech Recognition and Understanding Workshop (ASRU), Sentosa, Singapore, 14–18 December 2019; pp. 8–15. [Google Scholar]
  34. Zhang, Q.; Shi, L.; Liu, P.; Zhu, Z.; Xu, L. ICDN: Integrating consistency and difference networks by Transformer for multimodal sentiment analysis. Appl. Intell. 2022, 1–14. [Google Scholar] [CrossRef]
  35. Lai, H.; Yan, X. Multimodal sentiment analysis with asymmetric window multi-attentions. Multimed. Tools Appl. 2022, 81, 19415–19428. [Google Scholar] [CrossRef]
  36. Xiao, G.; Tu, G.; Zheng, L.; Zhou, T.; Li, X.; Ahmed, S.H.; Jiang, D. Multimodality sentiment analysis in social Internet of things based on hierarchical attentions and CSAT-TCN with MBM network. IEEE Internet Things J. 2020, 8, 12748–12757. [Google Scholar] [CrossRef]
  37. Hekmatmanesh, A.; Wu, H.; Handroos, H. Largest Lyapunov Exponent Optimization for Control of a Bionic-Hand: A Brain Computer Interface Study. Front. Rehabil. Sci. 2022, 2, 802070. [Google Scholar] [CrossRef]
  38. Vaswani, A.; Shazeer, N.; Parmar, N.; Uszkoreit, J.; Jones, L.; Gomez, A.N.; Kaiser, Ł.; Polosukhin, I. Attention is all you need. In Advances in Neural Information Processing Systems; The MIT Press: Cambridge, MA, USA, 2017; Volume 30. [Google Scholar]
  39. Zhou, H.; Zhang, S.; Peng, J.; Zhang, S.; Li, J.; Xiong, H.; Zhang, W. Informer: Beyond efficient Transformer for long sequence time-series forecasting. In Proceedings of the AAAI Conference on Artificial Intelligence, Virtually, 2–9 February 2021; Volume 35, pp. 11106–11115. [Google Scholar]
  40. Adel, H.; Dahou, A.; Mabrouk, A.; Abd Elaziz, M.; Kayed, M.; El-Henawy, I.M.; Alshathri, S.; Amin Ali, A. Improving crisis events detection using distilbert with hunger games search algorithm. Mathematics 2022, 10, 447. [Google Scholar] [CrossRef]
  41. Aldjanabi, W.; Dahou, A.; Al-qaness, M.A.; Elaziz, M.A.; Helmi, A.M.; Damaševičius, R. Arabic Offensive and Hate Speech Detection Using a Cross-Corpora Multi-Task Learning Model. Proc. Inform. 2021, 8, 69. [Google Scholar] [CrossRef]
  42. Arnab, A.; Dehghani, M.; Heigold, G.; Sun, C.; Lučić, M.; Schmid, C. Vivit: A video vision Transformer. In Proceedings of the IEEE/CVF International Conference on Computer Vision, Montreal, BC, Canada, 11–17 October 2021; pp. 6836–6846. [Google Scholar]
  43. Mabrouk, A.; Díaz Redondo, R.P.; Dahou, A.; Abd Elaziz, M.; Kayed, M. Pneumonia Detection on Chest X-ray Images Using Ensemble of Deep Convolutional Neural Networks. Appl. Sci. 2022, 12, 6448. [Google Scholar] [CrossRef]
  44. Sanh, V.; Debut, L.; Chaumond, J.; Wolf, T. DistilBERT, a distilled version of BERT: Smaller, faster, cheaper and lighter. arXiv 2019, arXiv:1910.01108. [Google Scholar]
  45. Howard, A.; Sandler, M.; Chu, G.; Chen, L.C.; Chen, B.; Tan, M.; Wang, W.; Zhu, Y.; Pang, R.; Vasudevan, V.; et al. Searching for mobilenetv3. In Proceedings of the IEEE International Conference on Computer Vision, Seoul, Republic of Korea, 27 October–2 November 2019; pp. 1314–1324. [Google Scholar]
  46. Abd Elaziz, M.; Mabrouk, A.; Dahou, A.; Chelloug, S.A. Medical Image Classification Utilizing Ensemble Learning and Levy Flight-Based Honey Badger Algorithm on 6G-Enabled Internet of Things. Comput. Intell. Neurosci. 2022, 2022. [Google Scholar] [CrossRef]
  47. Ibrahim, R.A.; Abd Elaziz, M.; Lu, S. Chaotic opposition-based grey-wolf optimization algorithm based on differential evolution and disruption operator for global optimization. Expert Syst. Appl. 2018, 108, 1–27. [Google Scholar] [CrossRef]
  48. Sadoun, A.M.; Najjar, I.R.; Alsoruji, G.S.; Wagih, A.; Abd Elaziz, M. Utilizing a Long Short-Term Memory Algorithm Modified by Dwarf Mongoose Optimization to Predict Thermal Expansion of Cu-Al2O3 Nanocomposites. Mathematics 2022, 10, 1050. [Google Scholar] [CrossRef]
  49. Braik, M.S. Chameleon Swarm Algorithm: A bio-inspired optimizer for solving engineering design problems. Expert Syst. Appl. 2021, 174, 114685. [Google Scholar] [CrossRef]
  50. Yilmaz, S.; Sen, S. Electric fish optimization: A new heuristic algorithm inspired by electrolocation. Neural Comput. Appl. 2020, 32, 11543–11578. [Google Scholar] [CrossRef]
  51. Abualigah, L.; Diabat, A.; Mirjalili, S.; Abd Elaziz, M.; Gandomi, A.H. The arithmetic optimization algorithm. Comput. Methods Appl. Mech. Eng. 2021, 376, 113609. [Google Scholar] [CrossRef]
  52. Abualigah, L.; Yousri, D.; Abd Elaziz, M.; Ewees, A.A.; Al-Qaness, M.A.; Gandomi, A.H. Aquila optimizer: A novel meta-heuristic optimization algorithm. Comput. Ind. Eng. 2021, 157, 107250. [Google Scholar] [CrossRef]
  53. Abualigah, L.; Abd Elaziz, M.; Sumari, P.; Geem, Z.W.; Gandomi, A.H. Reptile Search Algorithm (RSA): A nature-inspired meta-heuristic optimizer. Expert Syst. Appl. 2022, 191, 116158. [Google Scholar] [CrossRef]
  54. Tanabe, R.; Fukunaga, A.S. Improving the search performance of SHADE using linear population size reduction. In Proceedings of the 2014 IEEE congress on Evolutionary Computation (CEC), Beijing, China, 6–11 July 2014; pp. 1658–1665. [Google Scholar]
  55. Qin, A.K.; Suganthan, P.N. Self-adaptive differential evolution algorithm for numerical optimization. In Proceedings of the 2005 IEEE Congress on Evolutionary Computation, Scotland, UK, 2–5 September 2005; Volume 2, pp. 1785–1791. [Google Scholar]
  56. Ahuja, R.; Sharma, S. Sentiment Analysis on Different Domains Using Machine Learning Algorithms. In Advances in Data and Information Sciences; Springer: Berlin/Heidelberg, Germany, 2022; pp. 143–153. [Google Scholar]
  57. Rosenthal, S.; Farra, N.; Nakov, P. SemEval-2017 task 4: Sentiment analysis in Twitter. arXiv 2019, arXiv:1912.00741. [Google Scholar]
  58. Liu, J.; Singhal, T.; Blessing, L.T.; Wood, K.L.; Lim, K.H. Crisisbert: A robust Transformer for crisis classification and contextual crisis embedding. In Proceedings of the 32nd ACM Conference on Hypertext and Social Media, Virtual Event, Ireland, 30 August–2 September 2021; pp. 133–141. [Google Scholar]
  59. Mitchell, T.M.; Mitchell, T.M. Machine Learning; McGraw-Hill: New York, NY, USA, 1997; Volume 1. [Google Scholar]
Figure 1. TransCNN model architecture.
Mathematics 11 01032 g001
Figure 2. The steps of CGO as the FS method.
Mathematics 11 01032 g002
Figure 3. Average accuracy for the eight SIoT datasets.
Mathematics 11 01032 g003
Figure 4. Average sensitivity for the eight SIoT datasets.
Mathematics 11 01032 g004
Figure 5. Average specificity for the eight SIoT datasets.
Mathematics 11 01032 g005
Figure 6. Average selected features for the eight SIoT datasets.
Mathematics 11 01032 g006
Figure 7. Average fitness value for the eight SIoT datasets.
Mathematics 11 01032 g007
Table 1. SIoT relationships.
SIoT RelationshipExplanation
ParentThis relationship can be set between objects that belong to the same manufacturer.
OwnerThis relationship can be set between objects that belong to the same owner.
SocialThis relationship can be set randomly or periodically.
Co-locationThis relationship can be set between objects that exist in the same location.
Co-workThis relationship can be set between objects that share a common objective.
Table 2. The new version of the obtained features using the DL model.
DatasetData Type#Features#Instances#ClassesTask
GPS trajectoriesNumerical1637692Predict vehicle type
Car or Bus
UCI HARNumerical1153102996HAR
HepatitisNumerical24332322Healthcare
STS-GoldEnglish Text19320342Sentiment analysis
SemEval2017
Task4
English Text289618543Sentiment analysis
GAS sensorsNumerical12925773HAR
MovementAALNumerical5133142HAR
C6English Text57732626Crisis event detection
Table 3. (Original) The datasets descriptions and their corresponding samples and attributes.
DatasetData Type#Features#Instances#ClassesTask
GPS trajectoriesNumerical61632Predict vehicle type
Car or Bus
UCI HARNumerical9102996HAR
HepatitisNumerical191552Healthcare
STS-GoldEnglish text19220342Sentiment analysis
SemEval2017
Task4
English text192618543Sentiment analysis
GAS sensorsNumerical119194383HAR
MovementAALNumerical4131972HAR
C6English text192324626Crisis event detection
Table 4. Accuracy of CGO and other approaches (bold is the best value).
HBAGWODMOAChameCGOEFOAOAAORSALSHADESaDE
SemEval20170.59130.58640.59700.59310.60490.58730.60110.59000.57580.59330.5887
STSGold0.94100.90910.93370.92140.94100.93370.93610.92380.91890.93860.9337
GPS Trajectories0.87040.79630.79630.79630.88890.79630.79630.85190.87040.79630.7963
GAS Sensors0.98350.98120.98240.98350.98710.98240.98470.98470.98120.98240.9835
Hepatitis0.93510.89610.89610.89610.92210.89610.90910.90910.92210.89610.8961
MovementAAL0.79810.77880.79810.78850.84620.77880.82690.78850.80770.78850.7788
UCI-HAR0.90090.89510.89680.89790.90130.89480.89720.89310.89720.89380.8955
C60.97140.96840.96870.96870.97300.97100.97170.96940.96840.97070.9707
Table 5. Sensitivity of CGO and other approaches.
HBAGWODMOAChameCGOEFOAOAAORSALSHADESaDE
SemEval20170.57200.53250.55990.55160.59520.53170.56340.55440.55340.54860.5340
STSGold0.96090.95020.96090.94660.96440.97150.96090.95370.93950.96800.9680
GPS Trajectories0.86210.75860.75860.75860.89660.75860.75860.86210.93100.75860.7586
GAS Sensors0.99190.98390.98390.98390.99600.98790.99190.99190.99190.98390.9879
Hepatitis0.94740.86840.86840.86840.92110.86840.89470.89470.89470.86840.8684
MovementAAL0.68000.66000.68000.66000.74000.66000.72000.68000.72000.66000.6600
UCI-HAR0.87500.89920.89520.88510.88910.89720.89520.89520.88710.89520.8972
C60.97540.96300.95950.96130.97360.96480.96830.96480.96480.96300.9630
Table 6. Specificity of CGO and other approaches (bold is the best value).
HBAGWODMOAChameCGOEFOAOAAORSALSHADESaDE
SemEval20170.81750.84810.84410.84220.82700.84560.83530.83480.84180.84180.8436
STSGold0.89680.81750.87300.86510.88890.84920.88100.85710.87300.87300.8571
GPS Trajectories0.88000.84000.84000.84000.88000.84000.84000.84000.80000.84000.8400
GAS Sensors0.99830.99670.99670.99670.99830.99670.99830.99830.99830.99670.9967
Hepatitis0.92310.92310.92310.92310.92310.92310.92310.92310.94870.92310.9231
MovementAAL0.90740.88890.90740.90740.94440.88890.92590.88890.88890.90740.8889
UCI-HAR0.98330.97670.97840.98160.98410.97840.98000.97880.98200.97670.9776
C60.98970.98810.98770.98770.98930.98810.98930.98890.98970.98850.9885
Table 7. Number of selected features obtained using CGO and other methods (bold is the best value).
HBAGWODMOAChameCGOEFOAOAAORSALSHADESaDE
SemEval201728611313912232731522172233
STSGold3545882316160445320151160
GPS Trajectories501493195720630153105462621
GAS Sensors9122341640931814307396
Hepatitis46050411021844020383745910014732037
MovementAAL120167249132141415206181345383418
UCI-HAR151253531332895820310030693948
C612311322276584731106188351471
Table 8. Fitness value obtained using CGO and other approaches (bold is the best value).
HBAGWODMOAChameCGOEFOAOAAORSALSHADESaDE
SemEval20170.37760.39340.40820.37970.36330.45200.38440.37310.38420.42580.4511
STSGold0.07130.10530.10550.08270.06140.14300.08040.09620.07820.13390.1430
GPS Trajectories0.11680.20270.22490.19080.10030.26540.20330.13400.11680.24350.2642
GAS Sensors0.01710.03410.04240.01950.01400.08850.02230.01690.01850.07290.0898
Hepatitis0.05870.11420.13880.10110.07020.17730.09720.08420.07020.15410.1773
MovementAAL0.19830.23170.23040.21620.13960.28010.19600.19390.17390.26520.2807
UCI-HAR0.09050.11630.13890.09480.09130.17780.11020.10490.09510.15570.1764
C60.02730.04810.06670.04140.02580.10820.04460.03820.02990.08730.1081
Table 9. Friedman test for CGO and the other methods.
HBAGWODMOAChameCGOEFOAOAAORSALSHADESaDE
Accuracy8.812.445.445.2510.754.198.315.635.195.254.75
Sensitivity7.884.134.813.009.385.567.567.066.754.635.25
Specificity8.134.315.505.448.444.697.315.317.005.194.69
No. features5.005.757.633.382.2510.565.503.133.508.8810.44
Fitness value2.447.007.884.881.3110.635.503.753.259.0010.38
Disclaimer/Publisher’s Note: The statements, opinions and data contained in all publications are solely those of the individual author(s) and contributor(s) and not of MDPI and/or the editor(s). MDPI and/or the editor(s) disclaim responsibility for any injury to people or property resulting from any ideas, methods, instructions or products referred to in the content.

