Article

Multi-Layer Decomposition and Synthesis of HDR Images to Improve High-Saturation Boundaries

School of Electronic and Electrical Engineering, Kyungpook National University, Daegu 702-701, Republic of Korea
*
Author to whom correspondence should be addressed.
Mathematics 2023, 11(3), 785; https://doi.org/10.3390/math11030785
Submission received: 23 November 2022 / Revised: 27 January 2023 / Accepted: 2 February 2023 / Published: 3 February 2023

Abstract

:
Recently, high dynamic range (HDR) imaging has been used in many fields such as display, computer graphics, and digital cameras. Various tone mapping operators (TMOs) are used for effective HDR imaging. TMOs aim to express HDR images without loss of information and natural images on existing display equipment. In this paper, to improve the color distortion that occurs during tone mapping, multi-layer decomposition-based color compensation and global color enhancement of the boundary region are proposed. Multi-layer decomposition is used to preserve the color information of the input image and to find the area where color distortion occurs. Color compensation and enhancement are especially used to improve the color saturation of the border area, which is degraded due to color distortion and tone processing. Color compensation and enhancement are processed in IPT color space with excellent hue linearity to improve effective performance by reducing interference between luminance and chrominance components. The performance of the proposed method was compared to the existing methods using naturalness, distortion, and tone-mapped image quality metrics. The results show that the proposed method is superior to the existing methods.

1. Introduction

Nature scenes have a very wide dynamic range. However, because the existing display equipment has a narrow dynamic range, it cannot express all the information, such as the brightness and color, of a natural scene. To reduce the loss of information, it is necessary to increase the dynamic range of the camera sensor and display equipment or to compress the information in a wide dynamic range without loss. However, since increasing the dynamic range of a physical sensor is expensive, HDR imaging has been developed to reduce information loss by synthesizing several narrow dynamic images.
An HDR image can be created using multiple low dynamic range (LDR) images with different exposure values [1]. The exposure value of the camera is expressed as the amount of light incident on the sensor. An image with a low exposure value is dark, but details in a bright area can be obtained. An image with a high exposure value is brightly saturated, but the detail in the dark area increases. HDR imaging is a method of acquiring all the details from dark areas to bright areas by synthesizing multiple images with different exposure values. However, since the HDR image has a wider dynamic range than the existing LDR display device, all information included in the HDR image cannot be displayed on the LDR display device. To solve this problem, tone mapping operators (TMOs) are used. TMOs are a method of mapping the dynamic range of the HDR image to a range that can be expressed on a display device. The goal of TMOs is to reproduce accurate HDR scenes by reducing information loss during mapping.
Existing TMOs can be divided into global and local methods [2]. Global TMO is a method of mapping all pixels using the same function. Global TMO has the advantages of simple structure and fast processing speed but has the disadvantage of the low contrast of the rendered image. Local TMO is a mapping method with reference to information of the adjacent pixels during mapping. The mapping value of the local TMO is changed according to surrounding information even if the value of the target pixel is the same. Therefore, the rendered images of local TMO have high contrast, but the processing speed is slower than global TMO, and halo artifacts appear.
Reinhard et al. [3] proposed global TMO based on a zone system for LDR display devices or photo printing for HDR images, and local TMO using dodging-and-burning to reduce the detail loss that occurs in very high dynamic range images. Mantiuk et al. [4] proposed a method to reduce the visible contrast distortion that occurs depending on the range of the output device. The method consists of a contrast distortion weight based on the human visual system and constraints to reduce distortion according to the display device. Banterle et al. [5] proposed a TMO based on differential zone mapping. The method consists of image decomposition using zone mapping, optimal TMO application for each zone, and Laplacian pyramid fusion. Zone mapping applies the optimal TMO selected through physical experiments to each zone. Laplacian pyramid fusion was used to combine tone-mapped zones into one image without discontinuity and seams in the edge region. Kwon et al. [6] proposed a luminance adaptation transform (LAT) based on human visual function and retinex. The LAT is composed of a local TMO and chrominance scaling part to improve the local contrast and prevent saturation from occurring in the highlighted area. The local TMO part uses the luminance threshold and visual gamma to map the image to the optimal tone according to the local adaptation luminance level. The chrominance scaling part is used to compensate for the chrominance channel after tone mapping. Then, a multi-scale method was applied to balance local and global contrast.
Some studies apply the image appearance model as a local TMO. The color appearance model is a model that can predict color appearance attributes such as lightness, brightness, colorfulness, chroma, and hue in given stimulus and viewing conditions [7,8]. The image appearance model is an extended model of the color appearance model and was developed to predict the perceptual attributes of spatially and temporally complex stimuli such as images. Fairchild and Johnson developed an image color appearance model (iCAM) to predict the appearance of an image with spatially complex color stimuli by extending the traditional color appearance model and rendering the prediction result as an image [9]. Kaung et al. [10] proposed an iCAM06 to deal with HDR images by extending the iCAM. The iCAM06 adopts two-scale decomposition to reduce halo artifacts. The iCAM06 uses cone and rod photoreceptor response functions to process a wide dynamic range from scotopic to photopic and applies various visual modeling functions to express visual attributes according to the surrounding changes. Chae et al. [11] proposed a compensating method to reduce the white point shift that appears during tone compression in the iCAM06. Kwon et al. [12] proposed global chromatic adaptation to improve the saturation degradation caused by incorrect lighting prediction during HDR rendering. The global chromatic adaptation consists of illuminant estimation and an adaptive degree function that can adjust the adaptation level. The illumination estimation is calculated as the average value of pixels distributed near the black body locus in the xy color space. The adaptive degree function was modeled to control the degree of chromatic adaptation according to the intensity of illumination and color temperature. Kwon et al. [13] proposed decoupled processing and image appearance mapping to preserve color components and reduce color distortion. The decoupled processing is used to reduce interference between chrominance and luminance channels by processing the chromatic adaptation and tone compression in parallel. The image appearance mapping is used to preserve visual attributes such as lightness, chroma, and hue when recombining detail and base images.
In this study, we proposed color compensation and enhancement methods based on a multi-layer decomposition to reduce the color distortion in the boundary region and improve the decrease in saturation in the low-luminance region after tone compression. The multi-layer decomposition consists of a base layer (BL) and a detail layer (DL) separated with bilateral filtering, and an original layer (OL) without bilateral filtering. BL and DL are used for tone compression, and OL is used to acquire information to reduce the color distortion that occurs during tone compression. The color compensation and enhancement are processed in the IPT color space, and only the chrominance components are used. The IPT color space has better hue linearity than other color spaces. In IPT color space, I is the luminance channel, and PT are the chrominance channels. The color compensation includes a color difference map and a color scaling degree. The color difference map is used to detect a color distortion region that occurs in a strong boundary region. The color scaling degree is used to compensate for the chrominance distortion that occurs between the chromatic adaptation and tone compression. The color enhancement consists of an enhancement stop mask, an enhancement gain, and a color difference vector. The enhancement stop mask is used to prevent white point shift or hue shift at monotone or low saturation boundaries. The enhancement gain is used to compensate for the chrominance components according to the luminance level conversion between chromatic adaptation and tone compression. The color difference vector is used to improve the saturation degradation that occurs in the color boundary area. Finally, the chrominance components processed by the proposed method are combined with the luminance component of the existing tone-mapped image. The main contributions of the study are as follows:
  • The goal of the proposed method is compensating the color distortion around the color edge region and enhancing the desaturation in the low luminance and chroma areas after the color compensation.
  • The multi-layer decomposition is used to divide the image into base, detail, and original layers. The base layer is used for the chromatic adaptation and tone compression. The detail layer is used to enhance the detail information. The original layer is used to obtain the color distortion region and the necessary information for the color compensation and enhancement.
  • The color compensation is used to find the color edge region and reduce the color distortion around the color edge region. The color enhancement is used to reduce the desaturation of the low luminance and low saturation area after the color compensation.
  • The color compensation and color enhancement are processed in the IPT color space to preserve the luminance and chrominance.

2. Related Works

2.1. iCAM06

The iCAM06 is a representative image appearance model. The iCAM06 was designed for HDR image processing based on the CIECAM02 [10]. The iCAM06 consists of three steps. The first step is a chromatic adaptation. The chromatic adaptation is used to convert the color of the input image into a color corresponding to the predicted lighting environment. The iCAM06 adopts the chromatic adaptation of CIECAM02 and uses a Gaussian low-pass adaptation image of the input image to predict a lighting environment. The second step is a tone compression. The tone compression is used to apply the human vision photoreceptor response according to the change in the luminance of the image. The iCAM06 extends the luminance range from scotopic to photopic levels, and the tone compression is a combination of photoreceptor rod and cone responses. The third step is image attribute adjustments. The image attribute adjustments consist of detail, colorfulness, and surrounding. The adjustment in detail is used to predict the Stevens effect, which indicates the change of perceptual contrast according to the change of brightness [14]. The colorfulness and surrounding adjustments are used to compensate for the color and luminance components according to the brightness changes.
The iCAM06 uses a two-scale decomposition method to reduce halo artifacts that occur during tone compression and preserve image detail. The two-scale decomposition is a method of applying contrast compression only to the BL after separating the input image into BL and DL. The iCAM06 uses a fast bilateral filter to obtain the BL. The bilateral filter can smooth the brightness change of an image while preserving the edges, and is used for noise removal and contrast reduction. The fast bilateral filter is a method that applies subsampling and piecewise-linear bilateral filtering in the frequency domain to improve the processing speed of the bilateral filter [15]. In the iCAM06, the BL is used for chromatic adaptation and tone compression, and the DL is used for detail adjustment. The two layers are merged into a single image, and color and surrounding adjustments are applied to the combined image. Finally, an inverse transformation model is applied to the rendered image to be displayed on an output device. Figure 1 shows the flowchart of the iCAM06.

2.2. IPT Color Space

The IPT is a uniform opponent color space and provides an improved perceived hue linearity [16]. In the IPT color space, I, P, and T coordinates represent the lightness, red-green, and yellow-blue channels, respectively. Image attributes such as lightness, hue, and chroma for image quality prediction can be derived from the IPT color space. The IPT color space is a simple transformation from the CIEXYZ and consists of two 3 × 3 matrix transformations and one nonlinear power function. The following equations represent the forward transform from the CIEXYZ to the IPT color space.
L M S = 0.4002 0.7075 0.0807 0.228 1.1500 0.0612 0.0 0.0 0.9184
L = L 0.43 ,   L 0 L = L 0.43 ,   L < 0 M = M 0.43 ,   M 0 M = M 0.43 ,   M < 0 S = S 0.43 ,   S 0 S = S 0.43 , S < 0
I P T = 0.4000 0.4000 0.2000 4.4550 4.8510 0.3960 0.8056 0.3572 1.1628 L M S

3. Proposed Methods

To reduce the halo effect, the iCAM06 uses a bilateral filter to separate the image into base and detail layers. It preserves the detail layer with local contrast components sensitive to human vision while compressing the dynamic range of the base layer with global contrast components. The base layer sequentially performs chromatic adaptation and tone compression. The tone compression is performed on each CIEXYZ channel, which distorts the color balance of each channel. The tone-compressed image and the detail layer are merged, thereby amplifying the color distortion in the boundary area.
In this study, we propose multi-layer decomposition-based color compensation and enhancement algorithms to improve the color distortion and global saturation degradation in the boundary region after tone compression. Figure 2 shows the flow chart of the proposed algorithm. The multi-layer decomposition block consists of a BL and a DL to which the bilateral filter is applied to obtain the color components necessary for color compensation and enhancement, and an OL to which the bilateral filter is not applied. The color compensation block deals with the detection of a color distortion area and a method for compensating for the distorted color. The color enhancement block deals with a method for improving the saturation degradation of the low luminance area that occurs in the tone compression image. The color compensation and enhancement algorithms are processed in IPT color space, which has superior hue linearity to other color spaces.

3.1. Color Compensation

The proposed color compensation is used to compensate the color boundary region using the color difference map and color scaling degree. The color difference map is used to find the color distortion area that occurs after tone compression and compensate for the color distortion area. BL and OL images are used to find color distortion regions. The BL image represents the image generated from the bilateral filter, and the OL image represents the input image. The color distortion region that occurs after tone compression can be found by using the difference between the chrominance channels of the BL and OL images. The process is as follows:
  • Apply chromatic adaptation and tone compression sequentially to the BL and OL images.
  • Convert two tone-compressed images from XYZ color space to IPT color space.
  • Calculate the difference between the chrominance channels (P and T) of the BL and OL images as L2-norm.
Figure 3 shows the tone compression result of the test image. Figure 3a is the input image. Unlike this pattern image, a general image has detailed information. Therefore, tone compression is applied only to the separated base image for preserving the detail information. The test image in Figure 3 shows the problem of reproduction of the boundary of tone processing for the separated base image. Figure 3b,c show the tone-compressed BL and OL images, respectively. A halo effect due to color distortion appears around the four square patterns in Figure 3b. In particular, the red halo effect is displayed at the border of the blue rectangle. On the other hand, in the image of Figure 3c, the halo effect does not appear around the square pattern. Figure 3d is the color difference map and shows the area where the color distortion appears in Figure 3b. The color distortion occurs around the edge of the rectangle. The larger the color distortion, the larger the color difference value and the brighter the pixel value in the corresponding area. The color difference map ranges from 0 to 1. The large color distortion areas have values close to 1. The equations of the color difference map are as follows:
P d i , j = P t c _ B L   i , j P t c _ O L i , j
T d i , j = T t c _ B L i , j T t c _ O L i , j
P T d i , j = P d i , j 2 + T d i , j 2
M d i , j = P T d i , j P T d _ m a x
where i, j represent the coordinates of the image. Pd and Td represent the color difference between P and T channels. Subscripts tc_BL and tc_OL represent the tone-compressed BL and OL images, respectively. PTd is the L2-norm of Pd and Td, and PTd_max is the maximum value of PTd. Md represents the color difference map, and the maximum value is 1.
The color scaling degree function is a weight that represents the color distortion ratio of chromatic adaptation and tone compression images. The chrominance component of the image is affected by the luminance component. During tone compression, a difference in the chrominance component of the chromatic adaptation image and the tone compression image occurs according to a change in the dynamic range. The color scaling degree is used to measure the degree of change in the chrominance component of the chromatic-adapted and tone-compressed images that occurs after tone compression. It is calculated using the scalar ratio of the PT-axis chromatic response of the chromatic-adapted and tone-compressed images. The OL image is used to calculate the color scaling degree. The chromatic response can be calculated as the L2-norm of the P and T channels. The following equation shows the proposed color scaling degree:
C s i , j = P t c _ O L i , j 2 + T t c _ O L i , j 2 P c a _ O L i , j 2 + T c a _ O L i , j 2
where subscript tc_OL and ca_OL represent the tone-compressed and chromatic-adapted OL images, respectively. Cs represents the color scaling degree.
The boundary color compensation uses a color difference map, color scaling degree, chromatic-adapted image, and tone-compressed images to reduce color boundary error. A value of the color difference map close to 0 indicates a small color boundary error area, while a value of the color difference map close to 1 indicates a larger color boundary error area. The ratio of the tone-compressed OL image is increased in the area with a small boundary error, and the ratio of the chromatic-adapted OL image is increased in the area with a large boundary error. The color scaling degree is used to compensate for the ratio of the chromatic-adapted OL image to the tone-compressed OL image when compensating for the boundary region. The proposed color compensation algorithm formula is as follows, and Ps and Ts represent standard color channels.
P s i , j = P t c _ O L 1 M d i , j + P c a _ O L i , j M d i , j C s i , j
T s i , j = T t c _ O L 1 M d i , j + T c a _ O L i , j M d i , j C s i , j

3.2. Color Enhancement

In general, since tone compression reduces the dynamic range to a locally different level, irregular saturation degradation occurs. The decrease in saturation is conspicuously displayed at the low-luminance monotone or low-saturation boundary. Color enhancement was proposed to reduce the saturation degradation occurring in the low luminance and low chroma areas. Color enhancement consists of an enhancement stop mask, an enhancement gain, and a color difference vector.
An enhancement stop mask is used to prevent white point shift or hue shift at monotone or low saturation boundaries. In the IPT color space, saturation can be calculated using the L2-norm of the chrominance channels. The formula for the enhancement stop mask is as follows:
P T t c _ O L i , j = P t c _ O L i , j 2 + T t c _ O L i , j 2
M e i , j = 1 ,   for   P T t c _ O L i , j c P T t c _ O L i , j ,   otherwise
where PTtc_OL is the L2-norm of Ptc_OL and Ttc_OL, and Me represents the enhancement stop mask. The constant c was set to 1 as a threshold value defining the low-saturation region. Figure 4 shows the enhancement stop mask. In the input image, flowers, fruits, and cookie boxes with high saturation values have bright values in the high-saturation region of the color check.
The enhancement gain is used to compensate for the chrominance component according to the brightness change after the tone-compressed image. As the change in brightness affects the chroma component, it is necessary to compensate for the saturation corresponding to the change in brightness. The change in brightness can be calculated using the ratio of the luminance channels before and after tone compression. The compensation of saturation corresponding to brightness change is described by Bae et al. [17], who modeled the chroma change rate corresponding to the luminance change of the image by changing the exposure value of the input image, and the formula is as follows:
α i , j = 1 ,   for   1.009 × I t c _ O L i , j I c a _ O L i , j + 0.001 0.705 < 1 1.009 × I t c _ O L i , j I c a _ O L i , j + 0.001 0.705 ,   otherwise
where Itc_OL and Ica_OL represent the tone-compressed luminance channel and the chromatic-adapted luminance channel of each OL image. If the enhancement gain is less than 1, the minimum value of the enhancement gain is set to 1 because the saturation is further reduced.
Color difference vectors (Vp and Vt) are used to improve the saturation of the color boundary area. The color difference vector divided the color difference channels Pd and Td by PTd_max to indicate the direction of change of the P and T channels.
V p i , j = P d i , j / P T d _ m a x
V t i , j = T d i , j / P T d _ m a x
Color enhancement uses standard color channels (Ps and Ts), enhancement gain α, enhancement stop mask Me, and color difference vectors (Vp and Vt). Pe and Te represent color-enhanced PT channels.
P e i , j = α i , j P s i , j + V p i , j M e i , j
T e i , j = α i , j T s i , j + V t i , j M e i , j
Finally, the Pe and Te channels and luminance channel (I’) of the detail-combined image (IPT’) are synthesized. The detail-combined image is an image that combines the result of a tone-compressed BL image and detail adjustment.
Figure 5 shows the proposed color compensation and color enhancement. Distorted colors (Ptc_BL, Ttc_BL) are transformed into standard colors (Ps, Ts) using the proposed color compensation. The hue of the distorted color shifts from θd to θs. In the IPT color space, the angle on the PT-axis represents the hue. The saturation of the color boundary area is improved by using a color difference vector for the standard color. The enhancement stop mask is used to adjust the size of the color difference vector to prevent white point shift or hue shift in the low-saturation boundary area.

4. Simulation and Results

4.1. Simulation System and Datasets

The system used in the experiment was an Intel Core i7-11700KF, 128G RAM, and an NVIDIA GeForce 3090 GPU. MATLAB-R2021a and Python 3.8.8 were used for TMOs and image quality assessment (IQA) metrics. The test patterns used in the experiment were 8-bit files, and gamma correction (gamma = 2.2) was applied. The HDR images used in the experiment were data sets of the HDR Photographic Survey [18], and the resolution of the images was resized to about 1500 × 1000. The number of HDR images used in the test was 50, and the test scenes included indoor and outdoor scenes.

4.2. Simulation for Test Patterns

We used test patterns to compare the performance of the proposed method and iCAM06. The test pattern in Figure 6 consisted of bars of red, green, blue, magenta, cyan, and yellow. The figure in the first row of Figure 6a–c shows the input image and the resulting images of iCAM06 and the proposed method, respectively. The graphs in the second row show the distribution of RGB pixels in the area indicated by the red arrow in Figure 6a. In the iCAM06 image in Figure 6b, a halo artifact appeared between each color bar and the background, and a purple halo artifact appeared particularly strongly at the blue bar boundary. In the graph of Figure 6b, the distribution of RGB pixels was not uniform in the boundary area of each color bar, and the intensity level changed rapidly. On the other hand, in the image using the proposed method in Figure 6c, the distribution of RGB pixels was uniform, and the halo phenomenon did not appear.
Figure 7 shows the input image, the resulting image for each method, and the pixel distribution graph. The input images consisted of gray, red, green, and blue patterns and three backgrounds. The intensity levels of the gray background were 100, 150, and 200 from the first row. The red arrow in Figure 7a indicates the distribution of RGB pixels for each image. A strong intensity boundary was created between the gray background marked with an arrow and the blue pattern. Figure 7b shows the results of iCAM06. In the first row, the distribution of green increased in the intensity boundary area. As a result, a green halo appeared in the blue pattern area of the iCAM06 image. In the results of the second row, the distribution of red as well as green increased, and in the third row, the distribution of red increased rapidly, so the red halo was conspicuous in the boundary area. Figure 7c shows the results of the proposed method. In the image for the proposed method, the distribution of brightness in the intensity boundary area was more uniform than that in the iCAM06 image, and halos did not appear.

4.3. Simulation for HDR Scenes

To compare the performance of the proposed method, the latest seven methods were used. The methods used for comparison were Banterle [5], Bruce [19], Reinhard [20], Liang [21], Li [22], Shibata [23], and iCAM06 [10]. The Banterle, Bruce, and Reinhard TMOs used HDR Toolbox for MATLAB [24], and other operators were obtained from the authors’ web pages. The maximum luminance level of the proposed method and iCAM06 was set to 300 for indoor and night scenes and 20,000 for day scenes, and the input parameters of other TMOs were set as default values.
Figure 8, Figure 9, Figure 10 and Figure 11 show the resulting images for each method. Each figure (a) is an image to which Gamma TMO was applied to visualize the input HDR image. Each image consists of a result image and cropped images, and the green rectangle represents the cropped region.
In Figure 8, in the results for Banterle and Li, saturation was observed in the color checker region. The Bruce results showed color distortion with strong halo effects between the vase and the cookie sheet. In the results for Reinhard and Liang, image contrast was low, and flower detail was low. In the Shibata result, there was a halo artifact and noise increase due to excessive detail enhancement. In the iCAM06 result, the sunflower petals were less saturated, and noise due to color distortion appeared on the border around the inner disk of the flower and the towel located under the vase. On the other hand, in the proposed method, the color saturation of the petals was high, and noise due to color distortion did not appear.
In Figure 9, for the Banterle result, the brightness of the window frame was saturated and the image was unnatural. The Bruce result image was blotchy throughout the image. The Reinhard result showed a high-intensity level and low contrast, and the Liang result showed both a low-intensity level and contrast. In the Shibata results, a halo appeared in the color checker area. In the iCAM06 result, in the second stained glass image, the blue color area was distorted with magenta color, and the blue color boundary was distorted at the edge of the third color checker area. In the proposed method, color distortion and boundary distortion did not appear in the stained glass region, and the contrast was high.
In Figure 10a–g, the conventional methods showed reddish images due to extremely high chroma. In the Banterle result, saturation appeared in the bright areas of the building, and in the Bruce result, the detail in the leaves of the trees disappeared. In the Shibata result, a lot of noise appeared due to an excessive increase in detail. In the iCAM06 result, there was cyan color noise in the “Flamingo” sign and the red color was distorted at the tip of the tree leaf. In the proposed result, the noise of the “Flamingo” sign was removed, and the color distortion in the tree leaf area was improved.
In Figure 11, the Banterle result showed saturation in the signage and indoor areas of the building. The Bruce result had brightness and color distortion appearing throughout the image. The Reinhard, Liang, and Li results had low contrast, and the Shibata result had a halo effect in indoor images. The polar chart at the bottom left shows the distribution of hue and saturation for the car door area. The angle in the polar chart represents the hue, and the distance away from the center of the chart represents the saturation. The degree of saturation is achromatic at the center of the chart and pure color at the edges. In the input image, the color distribution of the car door was composed of purple and red. In the iCAM06 result, the proportions of purple and blue were further increased, and blue color noise appeared in the cropped image. However, the proposed method reduced color noise and color distortion.

4.4. Objective Assessment

To compare the quality of rendered HDR images, we used the blind/referenceless image spatial quality evaluator (BRISQUE) [25], tone mapping quality index (TMQI) [26], and feature similarity index for tone-mapped images (FSITM) [27] and FSITM_TMQI [27]. BRISQUE is a no-reference IQA metric that measures quality using only the result images of each method. TMQI, FSITM, and FSITM_TMQI are full reference IQA metrics that compare the reference HDR image and the target tone-mapped LDR image.
BRISQUE is a model proposed to measure image quality based on a natural scene statistics framework. BRISQUE measures the naturalness and distortion of an image using the statistics of pair-wise products of neighboring luminance values. TMQI and FSITM were developed to objectively evaluate the performance of tone-mapped images generated from TMOs. TMQI consists of the multi-scale structural fidelity measure and statistical naturalness measure. The multiscale structural fidelity measure evaluates structural information between HDR and tone-mapped LDR images. The statistical naturalness measure evaluates the brightness and contrast of a tone-mapped image. The TMQI score is calculated as the weighted sum of the two measures. FSITM is an object index based on the local phase similarity of the original HDR and target tone-mapped LDR images. FSITM uses the locally weighted mean phase angle map that is robust and noise-independent to measure the local similarity. FSITM_TMQI is a combined index of FSITM and TMQI and has been proposed as a more accurate evaluation than the other two existing methods [27]. The BRISQUE score ranges from 0 to 100, and a lower score indicates better perceptual quality. In TMQI, FSITM, and FSITM_TMQI, the score ranges from 0 to 1, and a higher score indicates better image quality. Table 1 and Figure 12 show the scores of the IQA metrics for each method. The number of images used in the test was 50. Each score in the metrics represented the average and 95% confidence interval. The results showed that the image quality of the proposed method was superior to that of other methods. The reason the scores of the proposed method and iCAM06 were similar was that the proposed method was based on iCAM06. It improved the color distortion problem of iCAM06, but the resultant image tones of the two methods will be similar.

5. Conclusions

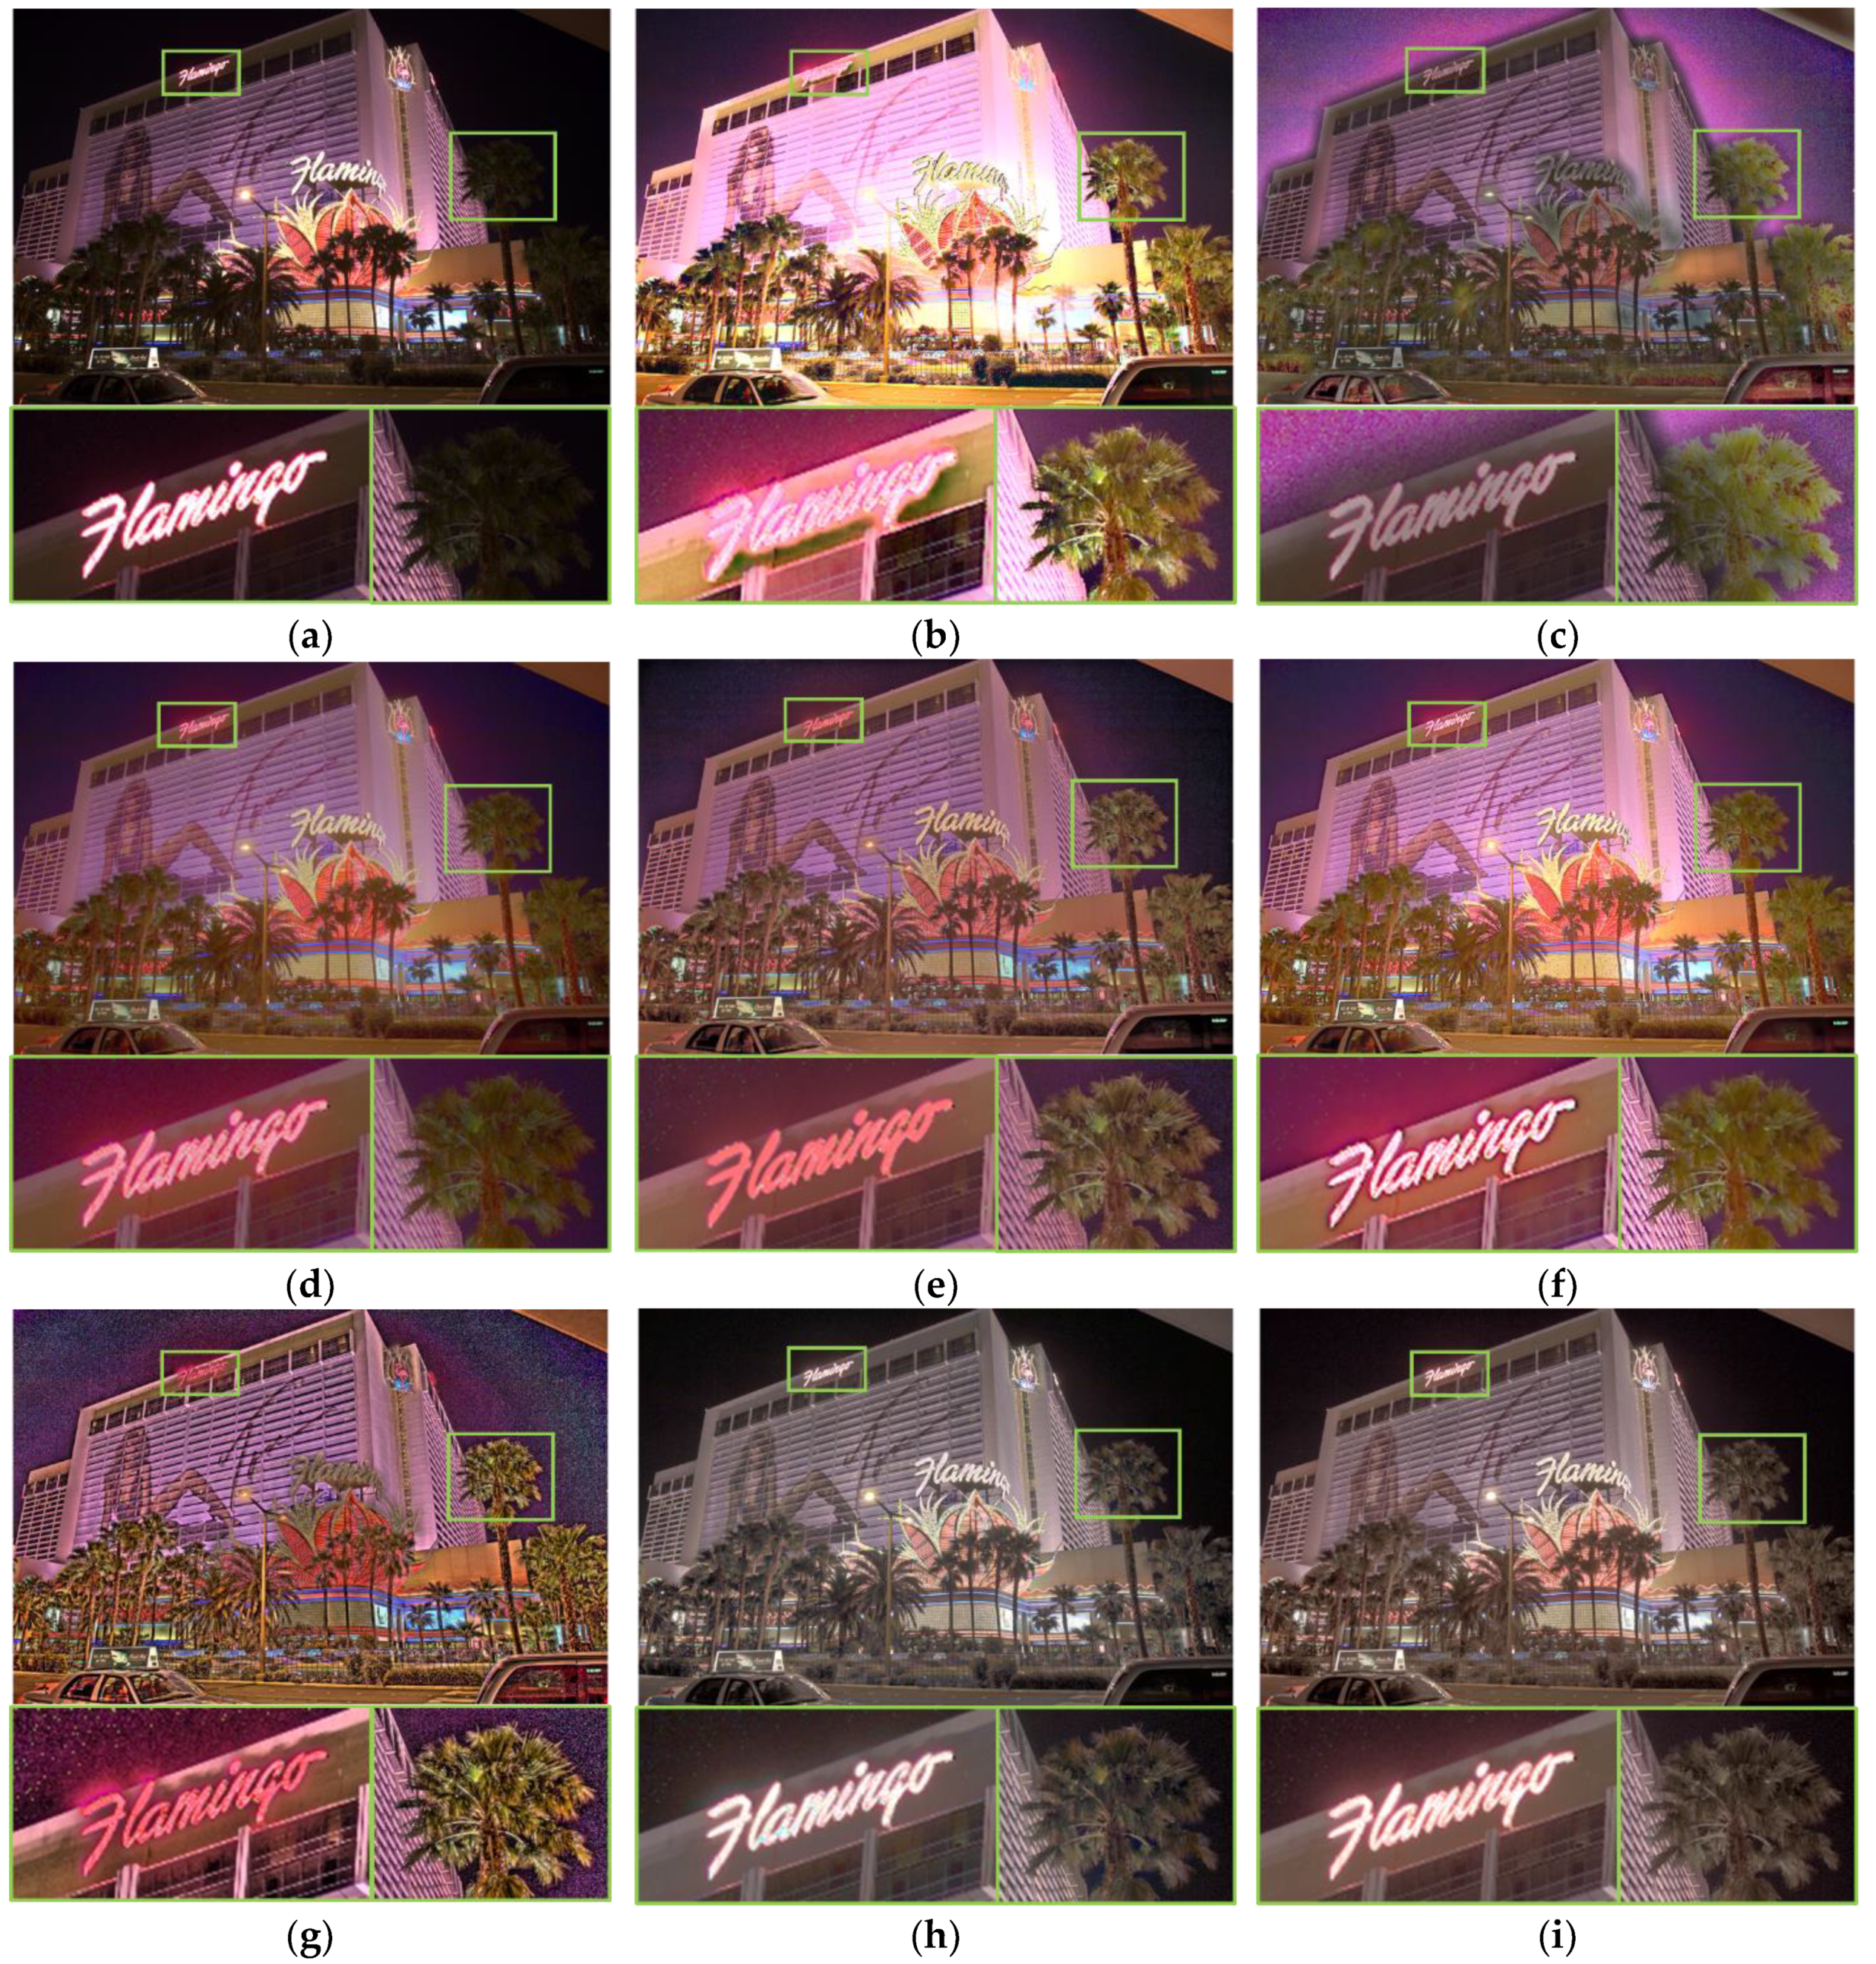
In this paper, multi-layer decomposition, color compensation, and color enhancement were proposed to improve color distortion and saturation degradation after tone compression. Multi-layer decomposition was processed separately into BL, DL, and OL to extract and compensate for the color distortion region that occurs during tone compression. The color distortion region was extracted using BL and OL images, and color information for the original image was obtained from the OL image. Color compensation and enhancements were processed in IPT color space with excellent hue linearity to reduce interference between luminance and chrominance components. The proposed color compensation used the color difference map to find the region where color distortion occurs and effectively compensated for the difference in chroma between tone compression and chromatic adaptation using the color scaling value. For color enhancement, it was possible to prevent white point shift or hue shift occurring in a low-saturation region by using an enhancement stop mask and to improve saturation by using an enhancement gain and a color difference vector. To confirm the performance of the proposed method, test patterns and various HDR scenes were compared with existing methods. IQA metrics such as BRSIQUE, TMQI, FSITM, and FSTIM_TMQI were used to compare the naturalness, distortion, and tone-mapped image quality of the image. The results showed that the proposed method has better performance in terms of naturalness, distortion, and tone-mapped image quality than the existing methods.

Author Contributions

Conceptualization, S.-H.L.; data curation, H.-J.K.; formal analysis, H.-J.K. and S.-H.L.; funding acquisition, S.-H.L.; investigation, H.-J.K. and S.-H.L.; methodology, S.-H.L.; project administration, S.-H.L.; resources, H.-J.K.; software, H.-J.K.; supervision, S.-H.L.; validation, H.-J.K. and S.-H.L.; visualization, H.-J.K.; writing—original draft, H.-J.K.; writing—review and editing, S.-H.L. All authors have read and agreed to the published version of the manuscript.

Funding

This research was supported by the Basic Science Research Program through the National Research Foundation of Korea (NRF), and the BK21 FOUR project funded by the Ministry of Education, Korea (NRF-2021R1I1A3049604, 4199990113966).

Data Availability Statement

Not applicable.

Conflicts of Interest

The authors declare no conflict of interest.

References

  1. Debevec, P.E.; Malik, J. Recovering high dynamic range radiance maps from photographs. In Proceedings of the ACM SIGGRAPH 2008 Classes on—SIGGRAPH ’08; ACM Press: New York, NY, USA, 2008; p. 1. [Google Scholar]
  2. Cerda-Company, X.; Parraga, C.A.; Otazu, X. Which tone-mapping operator is the best? A comparative study of perceptual quality. J. Opt. Soc. Am. A 2018, 35, 626. [Google Scholar] [CrossRef]
  3. Reinhard, E.; Stark, M.; Shirley, P.; Ferwerda, J. Photographic tone reproduction for digital images. ACM Trans. Graph. 2002, 21, 267–276. [Google Scholar] [CrossRef]
  4. Mantiuk, R.; Daly, S.; Kerofsky, L. Display adaptive tone mapping. ACM Trans. Graph. 2008, 27, 1–10. [Google Scholar] [CrossRef]
  5. Banterle, F.; Artusi, A.; Sikudova, E.; Bashford-Rogers, T.; Ledda, P.; Bloj, M.; Chalmers, A. Dynamic range compression by differential zone mapping based on psychophysical experiments. In Proceedings of the ACM Symposium on Applied Perception—SAP’ 12; ACM Press: New York, NY, USA, 2012; Volume 4, p. 39. [Google Scholar]
  6. Kwon, H.-J.; Lee, S.-H.; Lee, G.-Y.; Sohng, K.-I. Luminance adaptation transform based on brightness functions for LDR image reproduction. Digit. Signal Process. 2014, 30, 74–85. [Google Scholar] [CrossRef]
  7. Fairchild, M.D. Color Appearance Models, 3rd ed.; Wiley-IS&T: Chichester, UK, 2013. [Google Scholar]
  8. Moroney, N.; Fairchild, M.D.; Hunt, R.W.G.; Li, C.; Luo, M.R.; Newman, T. The CIECAM02 color appearance model. In Proceedings of the IS and T/SID Color Imaging Conference, Scottsdale, AZ, USA, 12–15 November 2002; pp. 23–27. [Google Scholar]
  9. Fairchild, M.D.; Johnson, M. The iCAM framework for image appearance, image differences, and image quality. J. Electron. Imaging 2004, 13, 126–138. [Google Scholar] [CrossRef]
  10. Kuang, J.; Johnson, G.M.; Fairchild, M.D. iCAM06: A refined image appearance model for HDR image rendering. J. Vis. Commun. Image Represent. 2007, 18, 406–414. [Google Scholar] [CrossRef]
  11. Chae, S.-M.; Lee, S.-H.; Kwon, H.-J.; Sohng, K.-I. A Tone Compression Model for the Compensation of White Point Shift Generated from HDR Rendering. IEICE Trans. Fundam. Electron. Commun. Comput. Sci. 2012, 95, 1297–1301. [Google Scholar] [CrossRef]
  12. Kwon, H.-J.; Lee, S.-H.; Bae, T.-W.; Chae, S.-M.; Park, M.-H.; Sohng, K.-I. Compensation of de-saturation effect in HDR images based on real scene adaptation analysis. In Proceedings of the International Conference on Image Processing, Computer Vision, and Pattern Recognition, IPCV 2011, Las Vegas, NV, USA, 18–21 July 2011; Volume 2, pp. 786–790. [Google Scholar]
  13. Kwon, H.-J.; Lee, S.-H. CAM-based HDR image reproduction using CA–TC decoupled JCh decomposition. Signal Process. Image Commun. 2019, 70, 1–13. [Google Scholar] [CrossRef]
  14. Stevens, J.C.; Stevens, S.S. Brightness Function: Effects of Adaptation*. J. Opt. Soc. Am. 1963, 53, 375. [Google Scholar] [CrossRef] [PubMed]
  15. Durand, F.; Dorsey, J. Fast bilateral filtering for the display of high-dynamic-range images. ACM Trans. Graph. 2002, 21, 257–266. [Google Scholar] [CrossRef] [Green Version]
  16. Ebner, F.; Fairchild, M.D. Development and testing of a color space (IPT) with improved hue uniformity. In Proceedings of the Final Program and Proceedings—IS and T/SID Color Imaging Conference; Society for Imaging Science and Technology: Springfield, VA, USA, 1998; pp. 9–13. [Google Scholar]
  17. Bae, H.-W.; Lee, S.-H. Multi-Scale Random Sprays Retinex Based on Edge-Adaptive Surround Integration TT—Multi-Scale Random Sprays Retinex Based on Edge-Adaptive Surround Integration. J. Korean Inst. Inf. Technol. 2020, 18, 93–105. [Google Scholar] [CrossRef]
  18. Fairchild, M.D. The HDR Photographic Survey. Available online: http://markfairchild.org/HDR.html (accessed on 1 January 2022).
  19. Bruce, N.D.B. ExpoBlend: Information preserving exposure blending based on normalized log-domain entropy. Comput. Graph. 2014, 39, 12–23. [Google Scholar] [CrossRef]
  20. Reinhard, E.; Devlin, K. Dynamic Range Reduction Inspired by Photoreceptor Physiology. IEEE Trans. Vis. Comput. Graph. 2005, 11, 13–24. [Google Scholar] [CrossRef] [PubMed]
  21. Liang, Z.; Xu, J.; Zhang, D.; Cao, Z.; Zhang, L. A Hybrid l1-l0 Layer Decomposition Model for Tone Mapping. In Proceedings of the 2018 IEEE/CVF Conference on Computer Vision and Pattern Recognition, Salt Lake City, UT, USA, 18–22 June 2018; pp. 4758–4766. [Google Scholar]
  22. Li, M.; Liu, J.; Yang, W.; Sun, X.; Guo, Z. Structure-Revealing Low-Light Image Enhancement Via Robust Retinex Model. IEEE Trans. Image Process. 2018, 27, 2828–2841. [Google Scholar] [CrossRef] [PubMed]
  23. Shibata, T.; Tanaka, M.; Okutomi, M. Gradient-Domain Image Reconstruction Framework with Intensity-Range and Base-Structure Constraints. In Proceedings of the 2016 IEEE Conference on Computer Vision and Pattern Recognition (CVPR), Las Vegas, NV, USA, 27–30 June 2016; pp. 2745–2753. [Google Scholar]
  24. Banterle, F.; Artusi, A.; Debattista, K.; Chalmers, A. Advanced High Dynamic Range Imaging, 2nd ed.; AK Peters (CRC Press): Natick, MA, USA, 2017; ISBN 9781498706940. [Google Scholar]
  25. Mittal, A.; Moorthy, A.K.; Bovik, A.C. No-Reference Image Quality Assessment in the Spatial Domain. IEEE Trans. Image Process. 2012, 21, 4695–4708. [Google Scholar] [CrossRef] [PubMed]
  26. Yeganeh, H.; Wang, Z. Objective Quality Assessment of Tone-Mapped Images. IEEE Trans. Image Process. 2013, 22, 657–667. [Google Scholar] [CrossRef] [PubMed]
  27. Ziaei Nafchi, H.; Shahkolaei, A.; Farrahi Moghaddam, R.; Cheriet, M. FSITM: A Feature Similarity Index for Tone-Mapped Images. IEEE Signal Process. Lett. 2015, 22, 1026–1029. [Google Scholar] [CrossRef] [Green Version]
Figure 1. Flowchart of iCAM06.
Mathematics 11 00785 g001
Figure 2. Flow chart of the proposed method.
Mathematics 11 00785 g002
Figure 3. Color difference map; (a) input image; (b) tone-compressed base layer image; (c) tone-compressed original layer image; (d) color difference map.
Mathematics 11 00785 g003
Figure 4. Input image and color enhancement map; (a) input image with Gamma tone mapping for visualization; (b) enhancement stop mask.
Mathematics 11 00785 g004
Figure 5. Proposed color compensation and enhancement.
Mathematics 11 00785 g005
Figure 6. Rendering result of each method for test pattern #1; (a) input image; (b) iCAM06; (c) proposed method. Red arrow in (a) indicates the pixel scanline for each method. In the second row, the graph represents distribution of RGB pixels corresponding to the red arrow for each method.
Mathematics 11 00785 g006
Figure 7. Rendering result of each method for test pattern #2; (a) input images; (b) iCAM06; (c) proposed method. The intensity level of gray surround is 100, 150, and 200 from the first row. Red arrows in (a) indicate the scan line for the RGB pixel distribution graph on the right side.
Mathematics 11 00785 g007
Figure 8. Rendering results of each method for HDR scene #1; (a) input image with Gamma tone mapping for visualization; (b) Banterle; (c) Bruce; (d) Reinhard; (e) Liang; (f) Li; (g) Shibata; (h) iCAM06; (i) proposed method.
Mathematics 11 00785 g008
Figure 9. Rendering results of each method for HDR scene #2; (a) input image with Gamma tone mapping for visualization; (b) Banterle; (c) Bruce; (d) Reinhard; (e) Liang; (f) Li; (g) Shibata; (h) iCAM06; (i) proposed method.
Mathematics 11 00785 g009
Figure 10. Rendering results of each method for HDR scene #3; (a) input image with Gamma tone mapping for visualization; (b) Banterle; (c) Bruce; (d) Reinhard; (e) Liang; (f) Li; (g) Shibata; (h) iCAM06; (i) proposed method.
Mathematics 11 00785 g010
Figure 11. Rendering results of each method for HDR scene #4; (a) input image with Gamma tone mapping for visualization; (b) Banterle; (c) Bruce; (d) Reinhard; (e) Liang; (f) Li; (g) Shibata; (h) iCAM06; (i) proposed method.
Mathematics 11 00785 g011
Figure 12. Image quality assessment scores for each method. Better image quality is represented by a lower BRISQUE score or higher TMQI, FSITM, and FSITM_TMQI scores.
Mathematics 11 00785 g012
Table 1. Comparison of image quality assessment metrics.
BRISQUETMQIFSITMFSITM_TMQI
Banterle25.142 ± 2.4090.830 ± 0.0200.819 ± 0.0160.824 ± 0.013
Brue22.018 ± 2.6520.805 ± 0.0220.822 ± 0.0240.814 ± 0.021
Reinhard21.024 ± 2.3820.798 ± 0.0150.823 ± 0.0140.810 ± 0.010
Liang23.155 ± 2.0360.888 ± 0.0150.843 ± 0.0140.865 ± 0.011
Li30.593 ± 2.6330.758 ± 0.0200.784 ± 0.0120.771 ± 0.012
Shibata19.101 ± 2.4320.855 ± 0.0150.807 ± 0.0140.831 ± 0.012
iCAM0618.429 ± 2.3010.891 ± 0.0200.854 ± 0.0140.872 ± 0.014
Proposed18.390 ± 2.3050.892 ± 0.0200.855 ± 0.0140.873 ± 0.014
Disclaimer/Publisher’s Note: The statements, opinions and data contained in all publications are solely those of the individual author(s) and contributor(s) and not of MDPI and/or the editor(s). MDPI and/or the editor(s) disclaim responsibility for any injury to people or property resulting from any ideas, methods, instructions or products referred to in the content.

