Article

An Improved DEA Prospect Cross-Efficiency Evaluation Method and Its Application in Fund Performance Analysis

School of Mathematics, Physics and Statistics, Shanghai University of Engineering Science, Shanghai 201620, China
*
Author to whom correspondence should be addressed.
Mathematics 2023, 11(3), 585; https://doi.org/10.3390/math11030585
Submission received: 17 December 2022 / Revised: 9 January 2023 / Accepted: 17 January 2023 / Published: 22 January 2023
(This article belongs to the Section Computational and Applied Mathematics)

Abstract

:
It is well known that a traditional data envelopment analysis (DEA) cross-efficiency evaluation model assumes that the decision-makers are completely rational, which causes the evaluation results to be inconsistent with the actual situation. To remedy this, in this paper, we propose an improved DEA prospect cross-efficiency evaluation method called EPCE model. The EPCE model captures the risk attitude of decision-makers and retains the decision information in the evaluation process. In particular, this new approach generates a more practical, realistic weighting scheme to measure the cross-efficiency and provides a reliable technique for ordering the decision-making units (DMUs) from the perspective of multi-criteria decision analysis. Finally, to demonstrate the validity and reliability of the proposed approach, we show an empirical analysis of mutual fund investment selection from Chinese fund market.

1. Introduction

In the past four decades, data envelopment analysis (DEA), proposed by Charnes et al. [1], has played a crucial role in the field of performance evaluation. The use of DEA has been prevalent in many areas, such as agriculture, transportation, banking, and so on; see, e.g., [2,3,4]. A system of DEA models is one important branch of the efficiency ranking method of decision-making units (DMUs). In the classic Charnes–Cooper–Rhodes (CCR) model, each DMU uses the weight that is the most favorable to itself to evaluate its efficiency. Hence, the CCR efficiency is also referred to as self-appraisal efficiency. However, in the CCR model, the relative effectiveness of the DMUs evaluated as DEA efficiency cannot be further distinguished. In addition, the inputs and the outputs that are the most favorable for evaluating a particular DMU may not be optimal for evaluating other DMUs. Therefore, the weights established through self-appraisal may sometimes be unrealistic. To improve the discriminant ability of DEA and make its weight more objective and practical, the DEA cross-efficiency evaluation model was proposed in [5] as an alternative to self-appraisal and an extension to DEA. As the DEA cross-efficiency evaluation model ensures the unique ordering of the DMUs [6], it is applied in many scenarios such as the sequence of the DMUs’ evaluation, assessing information sharing in supply chain management [7], portfolio selection [8], and supplier selection in public procurement [9].
Within the study of the DEA cross-efficiency evaluation model, the cross-efficiency aggregation method (arithmetic averaging) is a hot topic. However, Wu et al. [10] observed that it does not lead to a Pareto optimal solution and it loses the connection between weights. Thus, they proposed an aggregated model based on the cross-efficiency method and Shannon entropy (referred as Wu’s method in the subsequent text). Inspired by the evidential reasoning approach, Yang et al. [11] transformed the cross-efficiency matrix into pieces of evidence first, and then they aggregated the obtained cross-efficiency. To allow the optimism of the decision-maker (DM) towards the optimal relative efficiency and take it into account in the final overall efficiency evaluation, Wang and Chin [12] proposed the use of the ordered weighted averaging operator weight cross-efficiency aggregation. Moreover, Song and Liu [13] observed that Wu’s method [10] assigns the largest weight to the least important DMU, which could be unreasonable, so they proposed a variance coefficient method to overcome this drawback.
The DEA cross-efficiency evaluation model, based on the framework of expected utility theory (EUT), assumes that the DMs are completely rational even if in a risky situation; it does not take the DMs’ subjective attitude into consideration. However, as the decision-making process is conducted by people, the results obtained from the DEA cross-efficiency evaluation model based on EUT assumptions may not be consistent with the realistic situation. To remedy this, Liu et al. [14] proposed a new cross-efficiency model called prospect cross-efficiency (PCE) by calculating the prospect value of the DMU. At the same time, Deng and Fang [15] integrated the DEA prospect cross-efficiency evaluation model into fuzzy portfolio asset allocation under the framework of mean-variance-maverick. To avoid the choice dilemma between the aggressive and benevolent cross-efficiency model and to provide a reliable decision-making technique considering non-rational psychological factors for the ranking of the DMUs, Fang and Yang [16] proposed a comprehensive method using DEA cross-efficiency interval evaluation and cumulative prospect theory. Based on the Dempster–Shafer evidence theory, Fan et al. [17] obtained the DMU’s weights by considering the cross-efficiency scores as evidence to prove the DMU’s credibility. In order to establish a target efficiency identification model, Shao and Wang [18] developed several two-stage cross-efficiency evaluation models based on prospect theory so that dynamic reference points are determined by introducing the optimism coefficient. In addition, Yu et al. [19] developed a common weight DEA model by considering the psychological behaviors of the DMs. Moreover, Mei and Wang [20] proposed a cross-efficiency aggregation method based on the entropy weight method and prospect theory.
Although the PCE model [14] considers the risk attitude of the DMs in the cross-efficiency evaluation model, it uses the same fixed point as the reference point. This leads to deviation from the actual DMs’ reference points so that it cannot objectively and reliably reflect the expected gains and losses of the DMs. In addition, the traditional arithmetic average weighting method assigns the same weight to each decision making unit and does not take into account the relative importance of each decision making unit, so it is easy to miss a lot of decision information [10].
Inspired by existing research results, this paper investigates two aspects. One is to improve the objectivity and fairness of evaluation results. The other is to introduce psychological factors into the model so that they have an influence on decision-making behavior. Moreover, we study the aggregation method of the cross-efficiency and optimize the evaluation results of the model by introducing the risk attitude of the DMs and the entropy contained in the efficiency value.
The research in this paper is mainly based on the work of [13,14]. The main contributions of this study are as follows:
  • Compared to the classic CCR model, the proposed approach completely sorts the DMUs. In addition, psychological factors of the DMs are introduced so that the results are more realistic.
  • Taking the risk attitudes of the DMs into consideration, the endogenous and exogenous reference points are determined, and the convex combination of free parameters is constructed to calculate the final prospect value.
  • By combining the Shannon entropy with the DEA cross-efficiency evaluation model, the proposed approach avoids the weight deviation of the traditional model and retains the decision information in the evaluation process.
The rest of this paper is organized as follows. Section 2 introduces the DEA cross-efficiency evaluation model, prospect theory, and Shannon entropy. Section 3 discusses the proposed approach. Section 4 demonstrates the proposed approach through a numerical example and an empirical case applied to the Chinese mutual fund market. Section 5 gives the conclusions.

2. Preliminaries

2.1. Cross-Efficiency Evaluation

Suppose that there are n DMUs, then the inputs matrix and the outputs matrix are X = ( x i k ) m × n and Y = ( y r k ) s × n , respectively. Let x i k ( i = 1 , , m ) and y r k ( r = 1 , , s ) be the the ith and the rth evaluation indicator of DMU k , respectively. The efficiency value of the rated DMU k can be obtained by the classic CCR model [1]:
max r = 1 s u r k y r k i = 1 m v i k x i k s . t . r = 1 s u r k y r d i = 1 m v i k x i d 0 , d , k = 1 , 2 , , n , u r k , v i k 0 ,
where v i k and u r k are the weights assigned to the ith input and the rth output when evaluating DMU k .
It is well known that the classic CCR model given by (1) is a fractional programming model, its equivalent linear form can be obtained after the Charnes–Cooper transformation [1,21], and the original fractional programming can be formulated as linear programming, i.e.,
max E k = r = 1 s u r k y r k s . t . r = 1 s u r k y r d i = 1 m v i k x i d 0 , i = 1 m v i k x i k = 1 , d , k = 1 , 2 , , n , u r k , v i k 0 .
The optimal input and output weights u r k * and v i k * can be obtained by solving model (2). Each DMU k chooses its own favorable weights u r k * and v i k * so that its CCR efficiency E k * could be maximized. From the perspective of DMU k , the final cross-efficiency value of DMU k is given by
E ¯ k = 1 n d = 1 n E d k ,
where
E d k = r = 1 s u r k * y r d i = 1 m v i k * x i d ,
is DMU d ’s peer-appraisal efficiency value [5].
It is well known that E ¯ k [ 0 , 1 ] . When E ¯ k = 1 , DMU k is regarded as the DEA efficiency, that is, the output is high under the condition of limited input. When E ¯ k < 1 , DMU k is considered as the DEA non-efficiency. For further details, we refer to [5].

2.2. Prospect Theory

Prospect theory, proposed by Kahneman and Tversky [22], describes the behavioral decision theory of the DMs under the conditions of risk and uncertainty. According to prospect theory, the DMs may have different choices for the same problem, and generally reflect the subjective feelings of the DMs through the prospect value of gains and losses.
The prospect value function can be expressed as:
P ( Δ z ) = ( Δ z ) α , Δ z 0 , λ ( Δ z ) β , Δ z < 0 ,
where Δ z = z z 0 measures the deviation from the z value to the reference point z 0 ; it means gains or losses corresponding to the possible outcome. If Δ z 0 , the outcome would be seen as a gain. Otherwise, it would be seen as a loss. The parameters α and β can be estimated, representing the concavity and convexity of the value function, respectively, and satisfy the constraints α , β ( 0 , 1 ] . The expression α represents the sensitivity of the DM to earnings; the larger α , the more sensitive the DM is to earnings. Similarly, β represents the sensitivity of the DM to losses; the larger β , the more sensitive the DM is to losses. Finally, λ is the loss-aversion coefficient, which can be regarded as the ratio of sensitivity of the DM to gains and losses. Generally speaking, the DMs are more sensitive to losses than to gains, which implies that λ satisfies λ 1 .

2.3. Shannon Entropy

Information entropy, proposed by Shannon [23], is an important concept in information theory, which can measure the disorder degree of a system. For a specific system, if the system is very random and chaotic, the information entropy of the system is very large. In contrast, if a system is deterministic and subject to certain rules and order, the information entropy of the system is small. The greater the entropy value, the variation degree of the index, the information, and the role in decision-making process, the higher the weight. In contrast, the less information of indicators, the lower the weight in the decision-making process.
Wu et al. [10] proposed the concept of the entropy value of the cross-efficiency score, and applied it to generate relative weights for the cross-efficiency aggregation. The definition of the entropy value of the cross-efficiency score is given below.
Definition 1. 
For each DMU k , the entropy value of the cross-efficiency score h d k is defined as
h d k = e d k ln e d k ,
where
e d k = E d k k = 1 n E d k .
Here, h d k measures the turbulence among the evaluation results, which can be regarded as a measurement of the unwillingness degree towards cooperation among the DMUs. The smaller h d k , the better the evaluation results.

3. Proposed Approach

As noted in Section 2.2, the selection of reference points significantly impacts the computation of prospect value. Hence, we first introduce some special reference points and show how they derive the prospect value, and then explain the process for our selection of reference points.
Usually, reference points are selected at (1) the zero point, (2) the positive ideal point, (3) the negative ideal point, (4) the mean value, and (5) the median [14]. For example, in [24], the best DMU is defined as the positive ideal point. Now, we define the positive ideal point as the best DMU and the negative ideal point as the worst DMU. For a positive ideal point, it represents the least input and the most output, so the DMU can gain benefits through the least input and the most output. For a negative ideal point, it represents more input and less output, which is a loss for the DM. Thus, we choose the best and the worst value as the exogenous reference points to reflect external competitive advantages, and the mean value is regarded as the endogenous reference points to reflect the DMUs’ own characteristics in our proposed approach.
Let x i · = ( x i 1 , x i 2 , , x i n ) T ( i = 1 , , m ) and y r · = ( y r 1 , y r 2 , , y r n ) T ( r = 1 , , s ) be the ith input and the rth output of the DMUs, respectively. For the endogenous reference point, we consider using the average of the DMU’s inputs and outputs, defined as
P i n ( x i k ) = ( x i k x ¯ i · ) α , x i k x ¯ i · , λ ( x ¯ i · x i k ) β , x i k < x ¯ i · ,
and
P i n ( y r k ) = ( y r k y ¯ r · ) α , y r k y ¯ r · , λ ( y ¯ r · y r k ) β , y r k < y ¯ r · ,
respectively. The average value is simple and representative; it is more in line with the thinking habits of the DMs using the average as a reference point.
The parameters α and β represent the concavity and convexity of the value function, respectively, and satisfy the constraints α , β ( 0 , 1 ] ; λ is the loss-aversion coefficient. Ref. [25] suggested that α = β = 0.88 , λ = 2.25 .
For the exogenous reference point, we choose the worst and the best DMUs. Let the worst DMU be the reference point of the DM. Then the overall exogenous prospect gain values of DMU k is given by
P e x + ( x i k ) = ( max { x i · } x i k ) α
and
P e x + ( y r k ) = ( y r k min { y r · } ) α ,
respectively. Here, max { x i · } and min { y r · } are the worst bounds for the inputs and the outputs of DMU k , respectively.
Let the best DMU be the reference point of the DM. Then the overall exogenous prospect loss values of DMU k are given by
P e x ( x i k ) = λ ( x i k min { x i · } ) β
and
P e x ( y r k ) = λ ( max { y r · } y r k ) β ,
respectively. Here, min { x i · } and max { y r · } are the best bounds for the inputs and the outputs of DMU k , respectively.
In what follows, we present an entropy-based prospect cross-efficiency evaluation (EPCE) model as   
max E d k = δ P i n ( x i k , y r k ) + ( 1 δ ) θ P e x + ( x i k , y r k ) + ( 1 θ ) P e x ( x i k , y r k ) s . t . r = 1 s u r k y r d i = 1 m v i k x i d 0 , r = 1 s u r k y r k = E k * , i = 1 m v i k x i k = 1 , d , k = 1 , 2 , , n , u r k , v i k 0 , δ , θ [ 0 , 1 ] ,
where
P i n ( x i k , y r k ) = i = 1 m v i k P i n ( x i k ) + r = 1 s u r k P i n ( y r k ) ,
P e x + ( x i k , y r k ) = i = 1 m v i k P e x + ( x i k ) + r = 1 s u r k P e x + ( y r k ) ,
P e x ( x i k , y r k ) = i = 1 m v i k P e x ( x i k ) + r = 1 s u r k P e x ( y r k ) ,
and E k * represents the self-appraisal efficiencies, i.e., the CCR efficiency.
It follows from [13] that the variation coefficient ϵ d can be calculated by
ϵ d = 1 n k = 1 n h d k h ¯ d 2 h ¯ d ,
where h d k can be obtained by Equation (6), and
h ¯ d = 1 n k = 1 n h d k .
Thus, the aggregating weights ω = ( ω 1 , ω 2 , , ω n ) T can be determined by
ω d = ϵ d d = 1 n ϵ d .
In the aforementioned remarks, δ and θ are the free parameters that can be adjusted according to the subjective wishes of the DM, where 0 δ , θ 1 . Here, δ represents the degree of the DM’s preference for the internal versus external reference point of the evaluation question. A larger δ indicates that the DM considers the internal reference point (i.e., the mean value) to be more meaningful; θ represents the DM’s risk appetite, and a larger θ reflects a more optimistic DM. The parameter λ is the loss-aversion coefficient, which can be regarded as the ratio of sensitivity of the DM to gains and losses. As θ and δ 
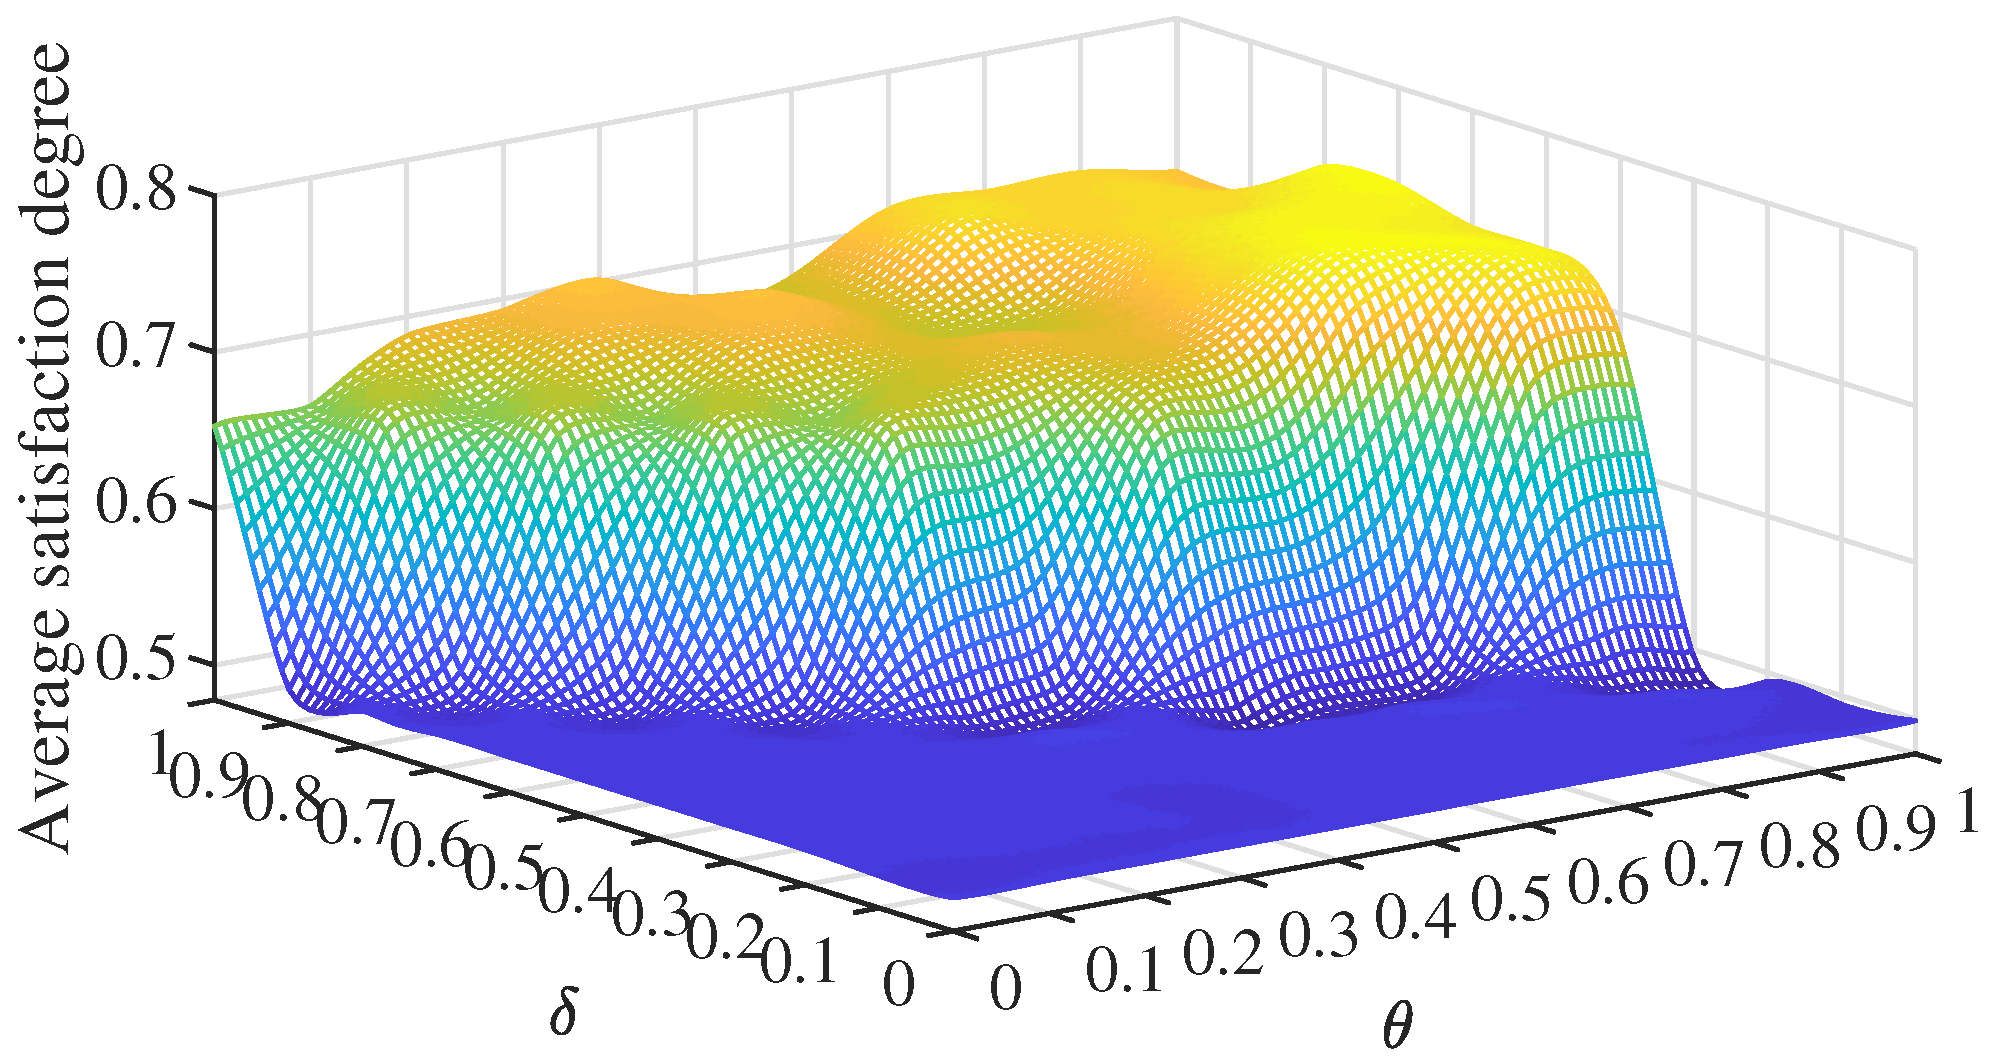
are adjustable parameters, their optimal range needs to be determined before conducting the final efficiency evaluation. For this purpose, we refer to the concept of satisfaction proposed by Wu et al. [26].
Definition 2. 
For each DMU k , the satisfaction degree ψ k can be defined as
ψ k = r = 1 s u r y r k i = 1 m v i x i k E k min E k max E k min ,
where E k max (upper bound) and E k min (lower bound) are defined as
E k max = r = 1 s u r k * y r k ,
and
E k min = min k = 1 , 2 , , n min ( u r k * , v i k * ) r = 1 s u r k * y r d i = 1 m v i k * x i d ,   d k ,
respectively.
Finally, the aggregated efficiency values calculated by our proposed EPCE model can be expressed as
E k c r o s s = d = 1 n E d k * ω d ,
where E d k * is the optimal objective values of the above model (14).
Thus, we establish the framework of the problem and derive the original cross-efficiency matrix. By solving model (2), the self-appraisal efficiencies E k * can be obtained. For DMU k , we calculate their peer-appraisal efficiencies E d k ( d = 1 , , n ) and the initial cross-efficiencies E ¯ k via Equations (3) and (4).
By calculating its satisfaction degree with the EPCE evaluation results for each DMU, we can obtain the evaluation result with the smallest satisfaction degree variance as the final result of the proposed approach. The minimum variance means that all DMUs have the highest recognition consistency for the evaluation result; θ * and δ * in the evaluation result are the optimal parameter values corresponding to the final result.
Considering the limitations and egoism of each DMU assessment, the amount of information contained in the results may vary. Now we introduce Shannon entropy into model (14) so that the final aggregated cross-efficiency E k c r o s s for each DMU k ( k = 1 , 2 , , n ) can be easily solved by Equations (18)–(24).
To summarize the foregoing analysis, the proposed integrated approach using prospect theory and Shannon entropy can be described as Algorithm 1.
Algorithm 1: Entropy-based prospect cross-efficiency evaluation method.
Input: 
input matrix X and output matrix Y
  1:
Calculate E k from (2)
  2:
Calculate prospect value P i n ( x i k ) , P i n ( y r k ) , P e x + ( x i k ) , P e x + ( y r k ) , P e x ( x i k ) , and P e x ( y r k ) from Equations (8)–(13)
  3:
Calculate prospect cross-efficiency weights from model (14)
  4:
Calculate efficiency values from Equations (18)–(20)
  5:
Calculate corresponding satisfaction degree ψ k for all possible values of θ and δ from Equation (21), and choose the optimal parameters’ combination which has the highest average satisfaction degree
  6:
Calculate the final aggregated EPCE efficiency values E k c r o s s from Equation (24)
Output: 
E k c r o s s

4. Empirical Examples

4.1. A Case of University Departments

4.1.1. Benchmark Case

To show the effectiveness of validity of our proposed model, we use the data cited in [27] for demonstration. In this case, we analyze the performance of seven university departments. The input as well as the output data of each DMU are shown in Table 1. According to [22], when α = β = 0.88 and λ = 2.25 , it is most conforming to human decision-making psychology under the assumption of bounded rationality. Therefore, we use the above parameter values in subsequent calculations. There are three inputs x 1 ,   x 2 , and x 3 , representing number of academic staff, salaries of academic staff (in units of GBP in a thousand), and salaries of support staff (in units of GBP in a thousand), respectively. In addition, there are three outputs y 1 ,   y 2 , and y 3 , representing output data corresponding to the number of undergraduate students, postgraduate students, and research papers, respectively.
The self-appraisal efficiency value is calculated by (2), and the weights obtained from the CCR model are shown in Table 2. It is obvious that the self-appraisal efficiency values of other DMUs are all 1 except for DMU 4 , and their relative effectiveness cannot be further distinguished.
Utilizing the proposed model, we first obtain a more reasonable gain and loss matrix by determining the exogenous and endogenous reference points, and then calculate its prospect value. Table 3 shows that a new set of weights is calculated by taking into account the subjective preferences of the DMs. The optimal weights for the final cross-efficiency aggregation we obtained are:
ω = ( 0.2063 , 0.0656 , 0.2179 , 0.0694 , 0.1417 , 0.0867 , 0.2124 ) T .
For the purpose of determining the best θ * and δ * , we traverse the values of these two parameters in steps of 0.1 over the range [ 0 , 1 ] and calculate the corresponding EPCE efficiency values and average satisfaction degree. In this example, it can be concluded that the average satisfaction degree of the evaluated DMUs is highest when θ = 0.9 and δ = 0.6 (as shown in Figure 1) and the variance of each satisfaction degree is as small as possible. We use these two parameters for the final efficiency calculation.
The final efficiency results are reported in Table 4. It is clear that our approach greatly enhances discrimination among the DMUs. The DMU with the lowest efficiency value, DMU 4 , in the CCR model also ranks last in the EPCE model, which shows that the model proposed in this paper has a certain reliability. In the CCR model, there are six DMUs regarded to be DEA efficient, whereas in our EPCE model, these DMUs differentiated well.

4.1.2. Sensitivity Analysis

The cross-efficiencies are aggregated in the assumption when α = β = 0.88 and λ = 2.25 . However, these parameters reflect the different attitudes of the DMs towards risk in prospect theory. In this section, we discuss the impact of parameter changes on efficiency aggregation results.
To know the change of the efficiency result caused by the change of α , we keep the values of β and λ unchanged and let the value of α gradually increase in the interval of 0 to 1, Similarly, we performed the corresponding sensitivity analysis for β and λ . The results are shown in Figure 2.
The parameters α , β [ 0 , 1 ] are the degrees of decreasing sensitivity when measuring away from the reference point; the larger the parameter, the less sensitive the DM. In the first subplot in Figure 2, the results are largely unchanged when α is varied within a range of α [ 0.4 , 0.7 ] ; when α < 0.4 , the efficiency scores of the DMUs perform relatively well, which means that the DM is sensitive to value changes; when α > 0.7 , the efficiency values of the DMUs with higher cross-efficiency values start to increase, whereas the efficiency values of the DMUs with lower efficiency values start to decrease. Similarly, for parameter β , the evaluation results fluctuate in a small range when β 0.8 ; when β > 0.8 , the efficiency values of some DMUs begin to fall significantly, and the efficiency values of other parts of the DMUs begin to rise.

4.1.3. Methods Comparison

To further illustrate the proposed approach’s effectiveness, the classic DEA cross-efficiency model is selected in this section to solve the case’s cross-efficiency value. We compare the evaluation results with those of our proposed model. The models compared in this paper include the CCR model [1], the traditional arithmetic mean aggregation model [5], the aggressive (Agg.)/benevolent (Ben.) cross-efficiency model [6], and the PCE model [14].
Using the EPCE model, we can obtain the cross-efficiency matrix of prospect theory based on the multiple reference points set in this paper. Through the improved entropy weight method, the weights used for efficiency aggregation can be obtained. The final EPCE results are shown in the last column of Table 5.
Table 5 and Figure 3 report the results derived from different models. Most of these methods provide complete ranking of the DMUs, except for the CCR model. Compared with the aggressive and benevolent model, a comprehensive consideration of the subjective attitudes of the DMs is incorporated into the EPCE model, which allows the DM to change his/her risk appetite by adjusting the value of λ , instead of choosing between the two extreme situations. Figure 3 shows the DMU rankings obtained by using five models for the data of this example, among which the results of some models are significantly different. Compared to the aggressive and the benevolent models, the results of the EPCE model are basically in between the two aforementioned models.

4.2. A Case of the Chinese Mutual Fund Market

Through empirical analysis, the applicability of the EPCE model for fund performance evaluation will be illustrated. We screen the sample funds through Morningstar and obtain relevant data through CSMAR. The sample period is from 1 April 2019 to 31 March 2022. In DEA theory, the DMUs of evaluation need to be homogeneous. Therefore, we only randomly select sample funds from open-end mixed funds, and the fund style is limited to “active allocation-market growth”. Tuzcu and Ertugay [28] state that the results of fund performance evaluation are affected by the size of the fund. Therefore, when we select the target fund to be evaluated, we limit the fund’s capital size to between CNY 5 and 10 billion. Through these screening processes, 56 funds with complete data are randomly selected as the target funds for empirical analysis in this section.
The evaluation of fund performance usually requires comprehensive consideration of all aspects of the fund performance indicators, including the fund’s level of risk and return, relevant indicators such as the fund’s expenses and return distribution characteristics, and the fund’s investment style and trading strategy. Regarding the indicators selected by other scholars and their accessibility, we choose the Sharpe ratio and average return as output indicators. For the input indicators, we choose the standard deviation of return and β coefficient as risk indicators and the expense ratio as a cost indicator. In this paper, the expense ratio is defined as
Expense ratio = Management fee + Custodian cost Total operating cost .
The selected indicators and their definitions are listed below, and the specific indicator values are shown in Table 6.
Inputs:
x 1 : Standard deviation of return rate (%)
x 2 : Systematic risk coefficient (β)
x 3 : Expense ratio (%)
Outputs:
y 1 : Average rate of return (%)
y 2 : Sharpe ratio
Similarly, based on the steps described in Section 3, the corresponding optimal parameters are θ = 0.9 and δ = 0.8 . To verify the validity of the EPCE model, we compare the results of the EPCE model, the CCR model, and the MorningStar ratings (see Table 7). Among them, the MorningStar rating, a widely used tool in China’s securities investment fund market, is used as the benchmark for comparison of model results in this paper.
As can be seen in Table 7, the closer the color of the cells are to green, the better the evaluation result and the higher the fund ranking; the closer the color of the cells are to red, the worse the evaluation result and the lower the fund ranking. Moreover, across all funds, the results of this model do not differ significantly from the MorningStar ratings. This shows that the model methodology is generally usable. Specifically, the evaluation results of the EPCE model allow a full ranking of all funds evaluated to compare with the CCR model. For example, among the nine funds with a MorningStar rating of five stars, three of them (000547, 001667, and 673060) are ranked first in the CCR model, which means that both methods consider these five funds to be the best performers, although it is difficult to distinguish between the merits and demerits. However, in the EPCE model, 000547 is considered to have the highest efficiency value, i.e., the best performance of these three funds. This is also consistent with the MorningStar rating and the classic CCR model. For the other two funds, the EPCE model gives its efficiency values and rankings: 673060 is ranked second and 016667 is ranked third. Therefore, not only does the EPCE model gives similar results to existing rating methods in the fund market as a whole, but it also allows further analysis of the performance of funds with the same rating on that evaluation result to obtain a complete and comprehensive ranking of fund performance. Moreover, this paper selects the optimal values of θ and δ by calculating the average satisfaction degree. In practice, θ and δ are also of practical importance. In order to obtain an evaluation result that is more in line with the psychological expectations of the DMs, the DMs can choose these parameters based on their attitude towards the decision.
In addition, although most of funds evaluation results are in line with MorningStar ratings, there are three funds’ EPCE evaluation results (004374, 005311, and 160311) that are not consistent. One possible reason is that the method of calculation is different. Whereas the proposed EPCE model considers the systematic risk, MorningStar looks at the volatility of each fund’s monthly returns over the calculation period, especially the downward variation. Thus, in this situation, the fund’s return is adjusted in a way that “penalizes risk”: the greater the volatility, the greater the penalty.
Overall, the evaluation results obtained from the EPCE model are are consistent with those in the CCR model and MorningStar ratings. This shows that the EPCE model performs well. In particular, unlike mainstream models, the EPCE model is able to distinguish the DMUs in terms of their relative effectiveness when it combines with the subjective preferences of the DMs.

5. Conclusions

In this paper, we proposed an improved cross-efficiency evaluation model called EPCE model based on prospect theory and Shannon entropy. We first introduced prospect theory to take into account the DMs’ subjective inclinations toward risks and losses, and then we combined the endogenous and exogenous reference points to eliminate uncertainty in the decision-making process by using two adjustable parameters. Moreover, we applied the improved entropy weight method to assign objective weights to each cross-efficiency value in terms of the efficiency aggregation. Finally, we provided an empirical example from the Chinese mutual fund market to show that the EPCE model posseses a powerful discrimination ability and has good application value in actual fund investment selection.
In addition, as this paper studies a situation where inputs and outputs are both positive, investigating the case of negative inputs/outputs can be as part of future work.

Author Contributions

Conceptualization, Y.N.; fund acquisition, G.W.; methodology, Y.N. and G.W.; supervision, G.W.; writing—original draft preparation, Y.N.; writing—review and editing, Y.N., Y.Z. and G.W. All authors have read and agreed to the published version of the manuscript.

Funding

This research was funded by the National Natural Science Foundation of China (Nos. 11971302 and 12171307) and National Statistical Science Research Project of China (No. 2020LY067).

Data Availability Statement

The data of this paper came from the China Stock Market & Accounting Research (CSMAR) Database accessed on 1 June 2022: https://cn.gtadata.com.

Acknowledgments

The authors would like to thank Jiyuan Tao for the helpful suggestions to revise the present paper.

Conflicts of Interest

The authors declare no conflict of interest.

References

  1. Charnes, A.; Cooper, W.W.; Rhodes, E. Measuring the efficiency of decision making units. Eur. J. Oper. Res. 1978, 2, 429–444. [Google Scholar] [CrossRef]
  2. Emrouznejad, A.; Yang, G.L. A survey and analysis of the first 40 years of scholarly literature in DEA: 1978–2016. Socio-Econ. Plan. Sci. 2018, 61, 4–8. [Google Scholar] [CrossRef]
  3. Peykani, P.; Mohammadi, E.; Saen, R.F.; Sadjadi, S.J.; Rostamy-Malkhalifeh, M. Data envelopment analysis and robust optimization: A review. Expert Syst. 2020, 37, e12534. [Google Scholar] [CrossRef]
  4. Wei, Q. Data envelopment analysis. Chin. Sci. Bull. 2001, 46, 1321–1332. (In Chinese) [Google Scholar] [CrossRef]
  5. Sexton, T.R.; Silkman, R.H.; Hogan, A.J. Data envelopment analysis: Critique and extensions. New Dir. Program Eval. 1986, 1986, 73–105. [Google Scholar] [CrossRef]
  6. Doyle, J.R.; Green, R.H. Cross-evaluation in DEA: Improving discrimination among DMUs. Inf. Syst. Oper. 1995, 33, 205–222. [Google Scholar] [CrossRef]
  7. Yu, M.M.; Ting, S.C.; Chen, M.C. Evaluating the cross-efficiency of information sharing in supply chains. Expert Syst. Appl. 2010, 37, 2891–2897. [Google Scholar] [CrossRef]
  8. Lim, S.; Oh, K.W.; Zhu, J. Use of DEA cross-efficiency evaluation in portfolio selection: An application to Korean stock market. Eur. J. Oper. Res. 2014, 236, 361–368. [Google Scholar] [CrossRef]
  9. Falagario, M.; Sciancalepore, F.; Costantino, N.; Pietroforte, R. Using a DEA-cross efficiency approach in public procurement tenders. Eur. J. Oper. Res. 2012, 218, 523–529. [Google Scholar] [CrossRef]
  10. Wu, J.; Sun, J.S.; Liang, L. DEA cross-efficiency aggregation method based upon Shannon entropy. Int. J. Prod. Res. 2012, 50, 6726–6736. [Google Scholar] [CrossRef]
  11. Yang, G.L.; Yang, J.B.; Liu, W.B.; Li, X.X. Cross-efficiency aggregation in DEA models using the evidential-reasoning approach. Eur. J. Oper. Res. 2013, 231, 393–404. [Google Scholar] [CrossRef]
  12. Wang, Y.M.; Chin, K.S. The use of OWA operator weights for cross-efficiency aggregation. Omega 2011, 39, 493–503. [Google Scholar] [CrossRef]
  13. Song, L.L.; Liu, F. An improvement in DEA cross-efficiency aggregation based on the Shannon entropy. Int. Trans. Oper. Res. 2018, 25, 705–714. [Google Scholar] [CrossRef]
  14. Liu, H.H.; Song, Y.Y.; Yang, G.L. Cross-efficiency evaluation in data envelopment analysis based on prospect theory. Eur. J. Oper. Res. 2019, 273, 364–375. [Google Scholar] [CrossRef]
  15. Deng, X.; Fang, W. A novel mean-variance-maverick DEA prospect cross-efficiency approach for fuzzy portfolio selection. J. Intell. Fuzzy Syst. 2019, 37, 8113–8130. [Google Scholar] [CrossRef]
  16. Fang, L.; Yang, J.W. An integrated ranking approach using cross-efficiency intervals and the cumulative prospect theory. Comput. Ind. Eng. 2019, 136, 556–574. [Google Scholar] [CrossRef]
  17. Fan, J.; Liu, J.; Wu, M. Improvement of cross-efficiency based on prospect theory. J. Intell. Fuzzy Syst. 2019, 37, 4391–4404. [Google Scholar] [CrossRef]
  18. Shao, X.; Wang, M.Q. Two-stage cross-efficiency evaluation based on prospect theory. J. Oper. Res. Soc. 2021, 73, 1–13. [Google Scholar] [CrossRef]
  19. Yu, Y.; Zhu, W.W.; Shi, Q.F.; Zhuang, S.W. Common set of weights in data envelopment analysis under prospect theory. Expert Syst. 2021, 38, e12602. [Google Scholar] [CrossRef]
  20. Mei, X.N.; Wang, Y.M. Cross-efficiency aggregation method based on prospect theory and entropy weight method. Oper. Res. Manag. Sci. 2022, 31, 35–41. (In Chinese) [Google Scholar]
  21. Charnes, A.; Cooper, W.W. Programming with linear fractional functionals. Nav. Res. Logist. Q. 1962, 9, 181–186. [Google Scholar] [CrossRef]
  22. Kahneman, D.; Tversky, A. Prospect theory: An analysis of decision under risk. Econometrica 1979, 47, 363–391. [Google Scholar] [CrossRef] [Green Version]
  23. Shannon, C.E. A mathematical theory of communication. Bell Syst. Tech. J. 1948, 27, 379–423. [Google Scholar] [CrossRef] [Green Version]
  24. Chen, L.; Xie, Y. DEA cross efficiency evaluation method based on the solution strategy of double reference points with prospect theory. J. Univ. Electron. Sci. Technol. China (Soc. Sci. Ed.) 2021, 23, 76–81. (In Chinese) [Google Scholar]
  25. Tversky, A.; Kahneman, D. Advances in prospect theory: Cumulative representation of uncertainty. J. Risk Uncertain. 1992, 5, 297–323. [Google Scholar] [CrossRef]
  26. Wu, J.; Chu, J.; Zhu, Q.; Li, Y.; Liang, L. Determining common weights in data envelopment analysis based on the satisfaction degree. J. Oper. Res. Soc. 2016, 67, 1446–1458. [Google Scholar] [CrossRef]
  27. Wong, Y.H.; Beasley, J.E. Restricting weight flexibility in data envelopment analysis. J. Oper. Res. Soc. 1990, 41, 829–835. [Google Scholar] [CrossRef]
  28. Tuzcu, S.E.; Ertugay, E. Is size an input in the mutual fund performance evaluation with DEA? Eurasian Econ. Rev. 2020, 10, 635–659. [Google Scholar] [CrossRef]
Figure 1. Average DMU satisfaction degree for different values of θ and δ .
Mathematics 11 00585 g001
Figure 2. Sensitivity analysis of parameters in prospect theory ((1) α , (2) β , and (3) λ ).
Mathematics 11 00585 g002
Figure 3. The ranking orders of the models.
Mathematics 11 00585 g003
Table 1. Data drawn from [27].
DMUsInputsOutputs
x1x2x3y1y2y3
DMU 1 1240020603517
DMU 2 19750701394140
DMU 3 421500702256875
DMU 4 15600100901217
DMU 5 452000250253145130
DMU 6 19730501324545
DMU 7 41235060030515997
Table 2. Weights obtained from the CCR model.
Weights of InputsWeights of Outputs
DMUs x 1 x 2 x 3 y 1 y 2 y 3
DMU 1 7.96 E 02 0.00 E + 00 2.24 E 03 0.00 E + 00 2.86 E 02 0.00 E + 00
DMU 2 0.00 E + 00 1.33 E 03 0.00 E + 00 7.19 E 03 0.00 E + 00 0.00 E + 00
DMU 3 0.00 E + 00 0.00 E + 00 1.43 E 02 0.00 E + 00 0.00 E + 00 1.33 E 02
DMU 4 6.42 E 02 6.29 E 05 0.00 E + 00 9.11 E 03 0.00 E + 00 0.00 E + 00
DMU 5 0.00 E + 00 5.00 E 04 0.00 E + 00 0.00 E + 00 0.00 E + 00 7.69 E 03
DMU 6 4.86 E 02 0.00 E + 00 1.53 E 03 3.84 E 03 1.09 E 02 0.00 E + 00
DMU 7 1.67 E 02 0.00 E + 00 5.27 E 04 1.29 E 03 3.77 E 03 6.41 E 05
Table 3. Weights obtained from the EPCE model.
Weights of InputsWeights of Outputs
DMUs x 1 x 2 x 3 y 1 y 2 y 3
DMU 1 0.00 E + 00 2.50 E 03 0.00 E + 00 0.00 E + 00 2.86 E 02 0.00 E + 00
DMU 2 0.00 E + 00 1.33 E 03 0.00 E + 00 7.19 E 03 0.00 E + 00 0.00 E + 00
DMU 3 0.00 E + 00 3.74 E 04 6.28 E 03 4.44 E 03 0.00 E + 00 0.00 E + 00
DMU 4 6.42 E 02 6.29 E 05 0.00 E + 00 9.11 E 03 0.00 E + 00 0.00 E + 00
DMU 5 0.00 E + 00 4.43 E 04 4.57 E 04 0.00 E + 00 0.00 E + 00 7.69 E 03
DMU 6 0.00 E + 00 1.28 E 03 1.38 E 03 7.58 E 03 0.00 E + 00 0.00 E + 00
DMU 7 9.94 E 03 2.52 E 04 0.00 E + 00 0.00 E + 00 6.29 E 03 0.00 E + 00
Table 4. Results of the CCR model and the EPCE model.
DMUsCCREPCE
EfficiencyRankingEfficiencyRanking
DMU 1 1.000010.90351
DMU 2 1.000010.80233
DMU 3 1.000010.73405
DMU 4 0.819770.43787
DMU 5 1.000010.77724
DMU 6 1.000010.88282
DMU 7 1.000010.68376
Table 5. The efficiency scores of the models.
CCRAgg.Ben.PCEEPCE
DMU 1 1.00000.83760.93980.85890.9035
DMU 2 1.00000.71830.95440.76030.8023
DMU 3 1.00000.76690.79520.78090.7340
DMU 4 0.81970.38720.61400.42840.4378
DMU 5 1.00000.65740.87850.65040.7772
DMU 6 1.00000.84240.99290.86360.8828
DMU 7 1.00000.52960.89880.54610.6837
Table 6. Input and output data for fund performance evaluation.
Fund Symbolx1x2x3y1y2Fund Symbolx1x2x3y1y2
0003902.27993.49790.70640.60780.16561000601.97813.40160.47880.50140.1390
0005471.52922.69570.52330.64110.22721100051.48252.97710.70100.43280.1358
0014451.90292.82820.45690.57510.19321609161.53902.42250.77450.26670.0983
0014802.62984.48550.63660.71010.15191634111.98563.20410.62900.43350.1264
0016671.71232.32810.74360.59980.24542130062.03363.56820.65400.44590.1170
0053111.93434.07970.57820.31900.07122400091.75942.73440.63050.44020.1505
5191811.99053.35540.76530.57700.16342700072.03483.50830.76220.48240.1294
6730601.72593.18010.37510.68640.20692700501.49203.51940.67970.48660.1301
7500011.81742.54440.49050.55790.20803103582.10403.30530.63110.51130.1460
0004041.89173.65160.72740.57410.14943980212.11524.04860.59120.49430.1150
0006012.25143.73970.69250.63650.16265196981.99113.11880.58130.40510.1207
0006982.03464.01030.69670.60830.14465500081.89362.79260.70290.39930.1327
0018322.09173.27950.74320.58800.17060700061.84462.87900.89850.27830.0867
0019512.11864.42890.56530.70720.15320700991.78413.43230.91570.35390.0948
0026201.74052.83930.52580.54490.18180900041.62962.40380.84740.21370.0770
1603112.15473.13020.72060.16280.04291000561.33792.09540.74800.15730.0614
2020271.92093.41440.59070.58870.16401800101.71852.55730.69010.28850.1016
4500041.87922.65120.70520.60790.21852000082.04663.48060.72860.30970.0808
4810101.97453.90310.51850.65790.16122020031.80822.85300.81730.27140.0851
5197731.88533.18020.65030.53680.15982020071.71142.70480.78760.25660.0843
5900032.11833.58590.57620.58920.15633200051.98023.02490.80970.26650.0787
0012221.87803.27090.81950.47180.13553400071.90853.24780.75850.30330.0846
0014871.74383.03800.68850.62110.19504000031.68002.63310.77930.21000.0689
0018521.96873.44310.69530.45540.12405190181.97242.90400.70340.32450.1019
0050011.74632.53990.69690.37610.13685900021.88132.79330.71080.24310.0768
0050042.02683.19820.66770.44640.13060012252.10334.35750.60910.30810.0642
0051361.82093.09480.53090.61140.18830043741.98963.70590.26970.65830.1699
0057391.84902.52810.60920.53410.20000700101.75293.08660.72390.23190.0659
Table 7. The evaluation results of different models.
FundSymbolCCREPCEMSRatingFundSymbolCCREPCEMSRating
0003900.72690.678851000600.66270.62183
0005471.00000.996651100050.69640.61043
0014450.89810.824051609160.44780.41583
0014800.71070.652651634110.56810.54143
0016671.00000.941652130060.53250.51253
0053110.40050.344752400090.66090.63253
5191810.71390.681652700070.57460.54993
6730601.00000.953352700500.77790.61813
7500010.97390.863653103580.65300.61523
0004040.72390.656343980210.57220.52253
0006010.72350.684545196980.55130.51963
0006980.71310.643545500080.57910.54473
0018320.73800.697740700060.39220.36012
0019510.82170.707840700990.47320.41402
0026200.81580.785740900040.35440.32312
1603110.21360.196041000560.31430.27942
2020270.74400.718341800100.45160.42872
4500040.92020.861442000080.37040.35542
4810100.82170.738442020030.38720.36062
5197730.70490.682042020070.38640.36032
5900030.72010.677743200050.35510.33262
0012220.60440.570433400070.38880.36952
0014870.85680.826534000030.32400.30142
0018520.55490.537035190180.45530.42572
0050010.59110.559335900020.35180.33022
0050040.58120.550630012250.35710.30891
0051360.85410.820130043741.00000.80641
0057390.86150.801530700100.31580.30061
To make the results more intuitive, we use color to distinguish the evaluation results. The closer the color of the cells are to green, the better the evaluation result and the higher the fund ranking; the closer the color to red, the worse the evaluation result and the lower the fund ranking.
Disclaimer/Publisher’s Note: The statements, opinions and data contained in all publications are solely those of the individual author(s) and contributor(s) and not of MDPI and/or the editor(s). MDPI and/or the editor(s) disclaim responsibility for any injury to people or property resulting from any ideas, methods, instructions or products referred to in the content.

