Article

Emotional Health and Climate-Change-Related Stressor Extraction from Social Media: A Case Study Using Hurricane Harvey

1
Department of Electrical Engineering and Computer Science, University of Arkansas, Fayetteville, AR 72701, USA
2
School of Applied Computational Sciences, Meharry Medical College, Nashville, TN 37203, USA
3
Department of Computer Science, Missouri University of Science and Technology, Rolla, MO 65409, USA
4
Center for Health Policy, Department of Public Health Practice, Meharry Medical College, Nashville, TN 37208, USA
5
APSU GIS Center, Austin Peay State University, Clarksville, TN 37040, USA
*
Author to whom correspondence should be addressed.
These authors contributed equally to this work.
Mathematics 2023, 11(24), 4910; https://doi.org/10.3390/math11244910
Submission received: 31 October 2023 / Revised: 28 November 2023 / Accepted: 4 December 2023 / Published: 9 December 2023
(This article belongs to the Special Issue Data Analysis and Information Retrieval for Healthcare)

Abstract

:
Climate change has led to a variety of disasters that have caused damage to infrastructure and the economy with societal impacts to human living. Understanding people’s emotions and stressors during disaster times will enable preparation strategies for mitigating further consequences. In this paper, we mine emotions and stressors encountered by people and shared on Twitter during Hurricane Harvey in 2017 as a showcase. In this work, we acquired a dataset of tweets from Twitter on Hurricane Harvey from 20 August 2017 to 30 August 2017. The dataset consists of around 400,000 tweets and is available on Kaggle. Next, a BERT-based model is employed to predict emotions associated with tweets posted by users. Then, natural language processing (NLP) techniques are utilized on negative-emotion tweets to explore the trends and prevalence of the topics discussed during the disaster event. Using Latent Dirichlet Allocation (LDA) topic modeling, we identified themes, enabling us to manually extract stressors termed as climate-change-related stressors. Results show that 20 climate-change-related stressors were extracted and that emotions peaked during the deadliest phase of the disaster. This indicates that tracking emotions may be a useful approach for studying environmentally determined well-being outcomes in light of understanding climate change impacts.

1. Introduction

Climate change has led to catastrophic disasters worldwide, including but not limited to strong hurricanes, severe droughts, increased ambient temperatures, and blizzards. These turbulent events caused damage to infrastructure and the economy, which has societal impacts. Among the most cataclysmic manifestations of these environmental shifts are hurricanes—intense meteorological phenomena that have grown more frequent and severe in recent decades. For example, after Hurricane Harvey made landfall in 2017, it dumped trillions of gallons of rain on regions of Texas and Louisiana and caused unprecedented flooding. It led to USD 125 billion in damage according to the National Hurricane Center; 738,000 people registered for assistance with the Federal Emergency Management Agency, and at least 3900 homes were without power [1]. Massive numbers of calls to 911 for help overwhelmed the service, and people turned to social media to express their problems and concerns and to seek help.
According to a study by Cooper et al., who conducted a focus group study and collected interview data, there is a close relationship between environmental conditions and emotional well-being. The study demonstrated how current water insecurity leads to extreme worry and fatigue among the studied population [2]. Other studies also agreed that negative emotions are directly linked to immediate environmental conditions like the lack of water security [3,4], lack of food security [5], or environmental changes [6]. A study by Hickman et. al also reveals the anxiety among the majority of young people (aged 16–25 years) in different countries [7] towards climate change. Many of them expressed negative emotions toward their government’s inaction toward climate change issues. In the study, the researchers conducted experiments by using questionnaires on a large population or by designing of group study with a controlled method to reduce bias as much as possible. While the yielded results are noticeable and show the significant impact of climate change on daily lives, there are some profound drawbacks. First of all, in this type of research, it is costly and time-consuming to gather information for analysis. There are several processes that need to be completed before information can be gathered, such as collecting a number of members for the research, setting a session where data can be collected accurately, or compensating participants for group studies. Another issue with this research is a limitation on the amount of data that can be collected.
In an era of unprecedented technological advancement and heightened environmental concerns, the utilization of social media platforms has emerged as a transformative tool for examining and understanding the multifaceted impacts of climate change. This research endeavors to harness the vast trove of real-time data available on social media platforms during hurricanes with the aim to illuminate the intricate interplay between these climatic disturbances and the public discourse on climate change. By delving into the digital footprints left behind during Hurricane Harvey, this study seeks to uncover valuable insights into societal perceptions, responses, and knowledge dissemination regarding climate change in the context of hurricanes. Given the engaging nature of social media as a dynamic forum for public engagement, the outcomes of this research hold the potential to enrich our understanding of climate change communication strategies and advance the global dialogue on climate change resilience.
Particularly, we use data from social media during Hurricane Harvey as a showcase to conduct emotional health analysis and stressor extraction during this disaster event by leveraging natural language processing (NLP) and transfer learning techniques. The tweets that are collected go through data cleaning and stopword removal. Besides regular English stopwords, we include an additional stopword list to filter out common tokens related to general disaster info and locations as well as terms that lacked significant meaning for our analysis. Then, the tweets are tokenized and vectorized using term frequency–inverse document frequency (TF-IDF) before passing through the developed emotion prediction model [8]. From the identified emotions in each tweet, we identify negative-emotion tweets and create a negative-emotion corpus for a stressor extraction process. The emotion prediction algorithm employs an EmoRoBERTa-based model [9] to analyze the emotion behind each tweet, while the stressor extraction mechanism leverages Latent Dirichlet Allocation (LDA) topic modeling for identification of topics, thus enabling climate-change-related stressor extraction through the identified topics and the important terms represented in each topic.
One contribution of this paper is the successful utilization of a state-of-the-art transformer architecture, e.g., EmoRoBERTa, to predict the emotions of a large-scale online population represented by tweets. In addition, we conduct emotional health analysis and showcase the evolution of emotions throughout the disaster event. This result indicates that emotions may be a useful approach for studying disaster-determined health outcomes and further understanding climate change impacts. Further, another contribution of this paper is the finding of 20 climate-change-related stressors that lead to anxiety in the population. We hope that this will also raise the attention of policymakers to invest more resources to not only fixing infrastructure damage but also resolving other vulnerable sectors influencing normal daily life by a thorough and comprehensive strategy as part of a disaster management program.

2. Related Work

In this section, we survey recent related studies on battling climate change and on health. These studies fall into two broad scientific areas: topic modeling for public health and social media for disaster relief.

2.1. Topic Modeling for Public Health

Topic modeling creates a way to see patterns and create useful structures from an otherwise unstructured collection of documents [10]. The utilization of this technique can create a pathway for an interdisciplinary medium between the social and computational sciences. Topic models are probabilistic techniques to uncover the underlying semantic structures of a corpus based on hierarchical Bayesian analysis of the texts. Analysis of the texts can span the range from emails to scientific abstracts to newspaper archives. For example [11], used a non-negative matrix factorization (NMF) topic modeling strategy to extract the main themes found in newspaper articles to identify the topics used for propaganda. The authors of [12] used BERTopic to developed document embedding with pre-trained transformer-based language models, clustered embeddings, and generated topic representations with the class-based TF-IDF procedure for building neural networks. The authors of [13] implemented the Top2Vec model with doc2vec as the embedding model as their final model to extract topics from a subreddit of CF (“r/CysticFibrosis”). Many studies utilize LDA due to its popularity and simplicity. Using the Latent Dirichlet Allocation (LDA) model, [14] adapted an HPV transmission model to data on sexual behavior, HPV prevalence data, and cervical cancer incidence data. They projected the effects of HPV vaccination on HPV and cancer incidence and the lifetime risk of cervical cancer for 100 years after the introduction of vaccination or in the first 50 vaccinated birth cohorts. A study was replicated to examine the factor structure, using reliability for internal consistency, and convergent and discriminant validity of the COVID-19 Stress Scales [15]. The results suggest that topic modeling exposes how people, during times of pandemic, exhibit fear and anxiety-related distress responses. Mental illness, in particular, is a kind of health concern for which the value of emotional and pragmatic support, as well as self-disclosure, has been recognized over the years. The authors of [16] sought to determine what kind of language attributes, content characterization, driving factors, and kinds of online disinhibition are observed in social media with a focus on mental health.

2.2. Social Media for Disaster Relief

Social media is defined by Kaplan as a group of Internet-based applications that build on the ideological and technological foundations of Web 2.0 and allow the creation and exchange of user-generated content [17]. The term “social media” refers to Internet-based applications, such as Reddit, Twitter, Flickr, Facebook, and YouTube, that enable people to communicate and share resources and information. These new communication platforms can be used for disaster relief. A study by Gao et al. suggests that social media could have been used to build a crowdsourcing platform to provide emergency services in the 2010 Haiti earthquake [18]. Additionally, social media platforms can be integrated with crisis maps to help organizations identify the location where supplies are most required. In research conducted in 2011, the American National Government explored the use of social media for disaster recovery efforts, discussing uses, future options, and policy considerations [19]. Twitter, one of the most frequently used social media platforms, is a social network and a microblogging service that allows users to write small pieces of text or messages known as tweets, through which users can interact with each other and express their ideas. Du and their group [20] proposed a social-media-based framework to analyze people’s concerns, assess their importance, and track the dynamic changes of these concerns. In their paper, they compared how people’s concerns flowed between Twitter and the news during the California mountain fires. Further, other studies also utilized social media to engage the community for water resource management [21], schedule volunteers to rescue victims [22], and predict people’s needs for better extreme weather planning [23,24]. Other research visualized social media sentiment in extreme weather scenarios. Researchers explored the underlying trends in positive and negative sentiment concerning extreme weather and geographically related sentiment using Twitter data. Social media can also be used to assess extreme weather damage rapidly. For instance, by using the spatiotemporal distribution of disaster-related messages extracted from social media, Kryvasheyeu et al. developed multiscale analysis of Twitter activity before, during, and after Hurricane Sandy to monitor and assess the disaster itself [25]. Our work focuses on utilizing social media to diagnose emotions and extract climate-change-related stressors to enable policymakers to develop more comprehensive strategic plans for disaster management and mitigation programs.

3. Methods

3.1. Study Design

To obtain well-indicated stressors related to climate change topic, collected tweet data undergo a refinement process during which Twitter’s emoji, hexadecimal images, special characters, hyperlinks, and unwanted words are removed. We also deploy an emotion classification model to extract tweets with negative emotions to emphasize the stressors’ factors. Then, we apply a lemmatization process to avoid redundancy due to words with the same meaning represented as different forms (e.g.,: go, going, and went are the same verb with a different form due to grammar). Next, we remove English words that are commonly used but contribute little to no meaning to the context, such as “a”, “an”, “the”, and so on. This set of words is known as stopwords, and our process continuously updates this set of words by passing our text data several times under an unrefined Latent Dirichlet Allocation model until our topics are well-refined. Afterward, we calculate the term frequency–inverse document frequency (TF-IDF) score for each token before running a fine-tuned LDA model to find underlying topics in the tweets. We construct an LDA model with 20 topic components to filter out tokens that are exceedingly common in each topic, such as disaster information (e.g., “harvey”, “storm”, and “wind”), locations (e.g., “texas”, “houston”, and “antonio”), and unwanted tokens that the filtering process fails to catch. This process is iterated several times until words with minimal occurrences among topics start to emerge. The initial model acts as a filtering layer and does not require refinement. However, we aim to avoid a low number of topics as it leads to more overlap between them. Finally, we refine the LDA model to form explicit topics by fine-tuning the model’s hyperparameters so that we can manually extract stressors on climate change topics precisely. The described procedure is illustrated as Figure 1.

3.2. Data Pre-Processing and Feature Engineering

The Hurricane Harvey dataset compiles tweets collected from as early as 20 August 2017 until 30 August 2017 and is publicly available on Kaggle [26]. Originally, the dataset contains nearly 400,000 tweets about Hurricane Harvey; there are around 98,000 tweets with negative emotions after the initial filtering process. Afterward, extracted tweets undergo text preprocessing to remove some redundancy as well as unwanted keywords for the topic modeling process. Afterward, we remove Twitter’s specific character from a set range of Unicode characters we define, and we remove URLs and hyperlinks from the tweets by removing tokens including “http”. This process is to standardize data before we can start emotion classification by removing icons from tweets, such as emojis and hex-images. Finally, we exclude all the single-character tokens from the tweets.
To expose the stressor factors from Twitter data, we extract tweets with negative emotions associated with them. For this task, a state-of-the-art pre-built model with a Bidirectional Encoder Representations from Transformers (BERT) structure, namely EmoRoBERTa [27], is utilized to detect emotions in each tweet. There are 28 tags; each of them represents a distinct emotion for each tweet. For a better demonstration of our task, we remove positive emotions (approval, desire, admiration, love, and more) as well as neutral ones. This refinement process is to emphasize the stress factors during a disaster so that we can extract better stressors in our results.

3.3. Emotion Prediction and Stressor Extraction

3.3.1. Text Vectorization

TF-IDF is employed in order to process data quickly. Short for Term Frequency–Inverse Document Frequency, TF-IDF is a common text-vectorization algorithm used to generate the word frequency vector. Term frequency, inverse document frequency, and the product between these two variables are calculated as below:
t f ( t , d ) = f t , d t d f t , d
i d f ( t , D ) = log N 1 + | d D : t d |
t f i d f ( t , d , D ) = t f ( t , d ) . i d f ( t , D )
where f(t, d) represents the number of appearances of word t in document d, and D stands for all documents. In this paper, one document is a tweet. D is a corpus with size N. The number one is added to the divisor in Formula (2) to avoid division by zero when t does not exist in d.

3.3.2. Emotion Prediction Model

Introduced by Devlin et al. in 2019, BERT has gained widespread acceptance and usage across various Natural Language Processing domains, particularly in text classification tasks. Several studies demonstrate BERT’s effectiveness compared to that of its predecessors for text embedding, notably for detecting hate speech on social media platforms [28,29,30], sentiment analysis [31,32], and as a chat bot [33]. Furthermore, BERT is finding application in diverse scientific fields like education [34], healthcare [35,36], and cybersecurity [37]. These applications underscore BERT’s boundless potential and its capacity to advance our understanding in an era inundated with information.
We employed an EmoRoBERTa model to analyze the emotion behind each tweet. EmoRoBERTa is constructed from the framework of a RoBERTa (Robustly optimized BERT approach [38]) model on the GoEmotions dataset [39]. This dataset consists of 58,000 Reddit comments with 28 different emotions. The RoBERTa framework was developed based on the proposed BERT model, which was originally introduced by Devlin et al. at Google as a state-of-the-art NLP model designed to capture the contextual meanings behind English words [40]. However, RoBERTa has been trained on a larger dataset and has improved efficiency, resulting in more competitive performance when compared to traditional BERT. By leveraging transfer learning, EmoRoBERTa inherits pre-trained word vectors from RoBERTa and modifies these vectors to align with their emotion classification tasks. We utilize the implementation by the HuggingFace Transformer package using a GPU to speed up the process and with a batch size of 8. EmoRoBERTa assigns each tweet with a vector with a score for all targeted emotions, with the score being the likelihood of each emotion being associated with the given tweet. Afterward, we obtain the maximum values from the predicted vectors and the corresponding emotions for each tweet from the Hurricane Harvey dataset. The detailed parameters of the model that we deployed are provided in Table 1.
In order to conform to the input requirements of the EmoRoBERTa model, each sentence was formatted to a fixed length of 50 tokens. This allowed the model to process sequences of uniform length. Specifically, if a document exceeded 50 tokens, it was truncated. Conversely, the padding method was applied to sentences with fewer than 50 tokens. The EmoRoBERTa model encompasses a total of 124,667,164 trainable parameters. To establish correspondence between the tokens in tweets and pre-trained words, we employed the RobertaTokenizerFast. For the RoBERTa layer, we opted for the TFRobertMainLayer, which resulted in 768 output dimensions. These outputs were subsequently passed through a fully connected layer with a Gaussian Error Linear Unit (GELU) activation function. We conducted experiments with different activation functions, and GELU outperformed Sigmoid, particularly in its performance with the GoEmotion dataset. Regarding the evaluation of the model, we chose to use the macro F1 score. This decision was motivated by the uneven distribution of data across emotion tags. There is considerable disparity in the number of documents within the higher end of the emotion spectrum (specifically admiration, approval, and annoyance) compared to the lower end (including relief, pride, and grief).

3.3.3. LDA Topic-Modeling-Based Stressor Extraction

Latent Semantic Indexing (LSI) is one of the indexing and retrieval methods for understanding what a document is about [41]. It is employed to find the relationship between words and documents. Another improved method called ‘probabilistic LSI (pLSI)’ uses the likelihood method (e.g., Bayes method) [42]; pLSI is employed to find the models of each word in a document, where each word is associated with one topic. Both LSI and pLSI neglect the order of words in a document. Moreover, the time complexity of pLSI is high, and pLSI may lead to overfitting. Latent Dirichlet Allocation (LDA) addresses these issues [43].
In LDA, we have a bag of words called a ‘document’ (d) and a small number of topics (i.e., 10 topics); each topic (z) has several important key words (w). That is, each word may be associated with multiple topics with different probabilities. The number of topics is one of the parameters passed to the LDA algorithm. The goal of LDA is to find the topics (Z) of documents and the important words of a topic by estimating the hidden variables ( α , β , θ ) through calculating their distribution across the documents.
Specifically, for each word w n , the topic z n of the word is chosen from multinomial distribution θ and a word w n from p ( w n | z n , β ) , which is defined as:
p ( w | α , β ) = p ( θ | α ) ( n = 1 N z n p ( z n | θ ) p ( w n | z n , β ) ) d θ ,
where N is the number of words in a document d. The variables α and β are the Dirichlet prior parameters at corpus-level parameters. The variable θ is selected from Dirichlet ( α ). The probability of a corpus (that LDA finds the marginal distribution of a document) is:
p ( D | α , β ) = d = 1 M p ( θ d | α ) ( n = 1 N d z d n p ( z d n | θ d ) p ( w d n | z d n , β ) ) d θ d

Optimal Number of Topics Identified

We use the UMass coherence score as the measure to identify the optimal number of topics for our LDA model [44]. This score measures how frequently two words, denoted as w i and w j , appear together and is formulated as follows:
C U M a s s = i = 2 N j = 1 i 1 log P ( w i , w j ) + 1 P ( w j )
in Equation (6), P ( w i , w j ) represents the frequency of co-occurrence of both w i and w j within the same document, while P ( w j ) is the number of documents that include the word w j . We include a value of 1 in the denominator to prevent the fractional value from becoming zero. The UMass coherence value is the summation of the top N selected terms, which are pre-determined. In practice, the term P ( w i , w j ) + 1 is likely to be much smaller than the term P ( w j ) , resulting in a negative UMass score. The number of topics improves the LDA model as the UMass score approaches zero. However, the score increases as we add more topics to the LDA model, potentially leading to topics with extremely few documents. To address this issue, we also apply the elbow method [45], which involves selecting the number of topics when the rate of change in the UMass coherence score starts to decrease after adding a new topic. Once the topics are defined, we manually identify the stressors from representative terms of the topics.

Stressor Extraction from the Identified Topics

After determining the appropriate number of topics for the LDA model, we utilize an LDA visualization package in Python to depict each topic and understand the predominant terms influencing it. Creating an LDA chart allows us to interpret the topics based on the collection of raw terms, as each topic retains a distinct set of keywords. We manually derive stressor themes from the most common terms for each topic. To finalize stressor labels, two researchers unanimously agree on descriptions for the resulting stressors. Finally, we focus on stressors related to climate change by selecting those prominent within the identified topics, with the aim of delving deeper into their specifics.

4. Results

4.1. Emotion Prediction Results

We executed the EmoRoBERTa model on a system equipped with an Intel i7-11700 processor, 32 GB of memory, and an NVIDIA RTX 2060 Super to assign emotion tags to each tweet. We then selected the emotion tag with the highest score for each tweet. This process consumed more than 14 h to process and annotate each tweet with its corresponding emotion. Among the results, there were over 250,000 tweets categorized as “neutral”. This outcome is understandable, as the majority of these tweets likely pertained to updates on the progress of Hurricane Harvey or warnings about potential dangers. Given that some emotions like “grief” or “embarrassment” had relatively low frequencies compared to “neutral”, we adjusted the distribution count axis to magnify their visibility. The distribution of emotions related to the tweeter data is visualized in Figure 2.
To gain a deeper understanding of stressors related to climate change, we filtered out tweets expressing positive emotions such as “approval”, “desire”, “admiration”, “love”, “gratitude”, “excitement”, “optimism”, “joy”, and “amusement”, as well as those labeled as “neutral”. Out of the 400,000 tweets related to Hurricane Harvey, we were able to retain approximately 94,000 tweets with negative emotions. This also raises some suspicion that the data classified as neutral may contain valuable information hidden within shared URL links, leading to possible misclassification. While a significant number of documents were removed from our dataset, the remaining data are substantial enough to support our experimental tasks.

4.2. Tweet Shoutout

As shown in Figure 3, for all tweets, we observe some of the trending words, include “american”, “thought”, “victim”, “prayer”, “track”, “sustained”, “snapchat”, “mile”, “newshurricane”, “early”, “imagine”,“bbc”, “administration”, “government”, “130 mph”, “beware”, “ban”, “listen”, “port”, “travel”, “southern”, “prayersfortexas”, “beware”, “southern”, “alligator”, “neighbor”, “station”, “strength”, “build”, “fly”, “poor”, “toll”, “drown”, “assist”, “vote”, “potential”, “probably”, “rescue”, “nature”, and “staysafe”. From this information, we see that news on the hurricane is very important and that news stations such as the “BBC” were reporting on the event and its impact and communicating information on the victims and tolls. “Snapchat” seemed to be a popular social media tool for users as well. The location of the landfall in Texas and Louisiana explains why “American” and “Southern” trended, while the use of “potential” and “probably” suggest there was heavy anticipation for this weather event, meaning residents were bracing for the event to occur and come towards their location. Perhaps the general public’s commentary on where the hurricane was heading made the landfall-related words trend further. There was concern due to the risk of “alligators”, “drown” potential, “travel”, “fly”, “ban” statuses, and “rescue” efforts. We may glean that there was concern about the strength and movement of the hurricane with speed of “130 mph” and descriptions of the force with words like “massive”, “horrible”, “terrible” being reported. Emphasis was placed on the importance and problematic nature of this event, obtaining services, and government assistance. “Nature”, “prayer”, and “voting” were also in focus. It is not uncommon for citizens to reassess their positions of elected officials during disasters. It is also evident that prominent faith- or goodwill-focused hashtags were used during this Southern American weather event: #prayersfortexas. The trending words in the overview of all tweets were much more optimistic than what was found for the stressor target.
In contrast, the prominent negative or stressor trending words in Figure 3b included “threaten”, “hit”, “resident”, “photo”, “horrific”, “evacuation”, “heavy”, “trend”, “drench”, “building”, “massive”, “destructive”, “history,“ “fly”, “force”, “downgrade”, and “havoc”. From this, we can surmise that there was general concern among Twitter users due to the threat of the hurricane hitting residential areas, how massive the force was, and the resulting destruction of property and buildings. We see that people were likely taking photos or asking for photos of the damage or of other important information that could lead to safety. Additionally, we gather that there was consensus around this hurricane being massive and that the heavy precipitation that followed negatively impacted neighborhoods and individuals. We see people were concerned about their jobs, money, and whether the situation would intensify. People reference the “coast”, the “port”, “emergency”, “warning”, “safety”, and even “ID”. Being able to identify survivors and evacuated residents as well as those who succumbed to the storm is very important, and while we see the concern for rescue and evacuation, we also see the concern about service, and this is where accountability is placed by Americans on those service agencies, such as FEMA and the local government administrative groups. One word that was striking was “old”, and this could refer to buildings or older citizens; and in any situation where there is a natural disaster, the most vulnerable citizens amongst us are usually children and the elderly, so having this shown for tweets with stressor emotions does show the humanity of the users regardless of whether their reference is for the protection of older landmarks or older citizens. Finally, “history” being represented in the wordcloud is an indicator that the response efforts for Hurricane Harvey were being closely followed and compared with the largely criticized response for Hurricane Katrina.

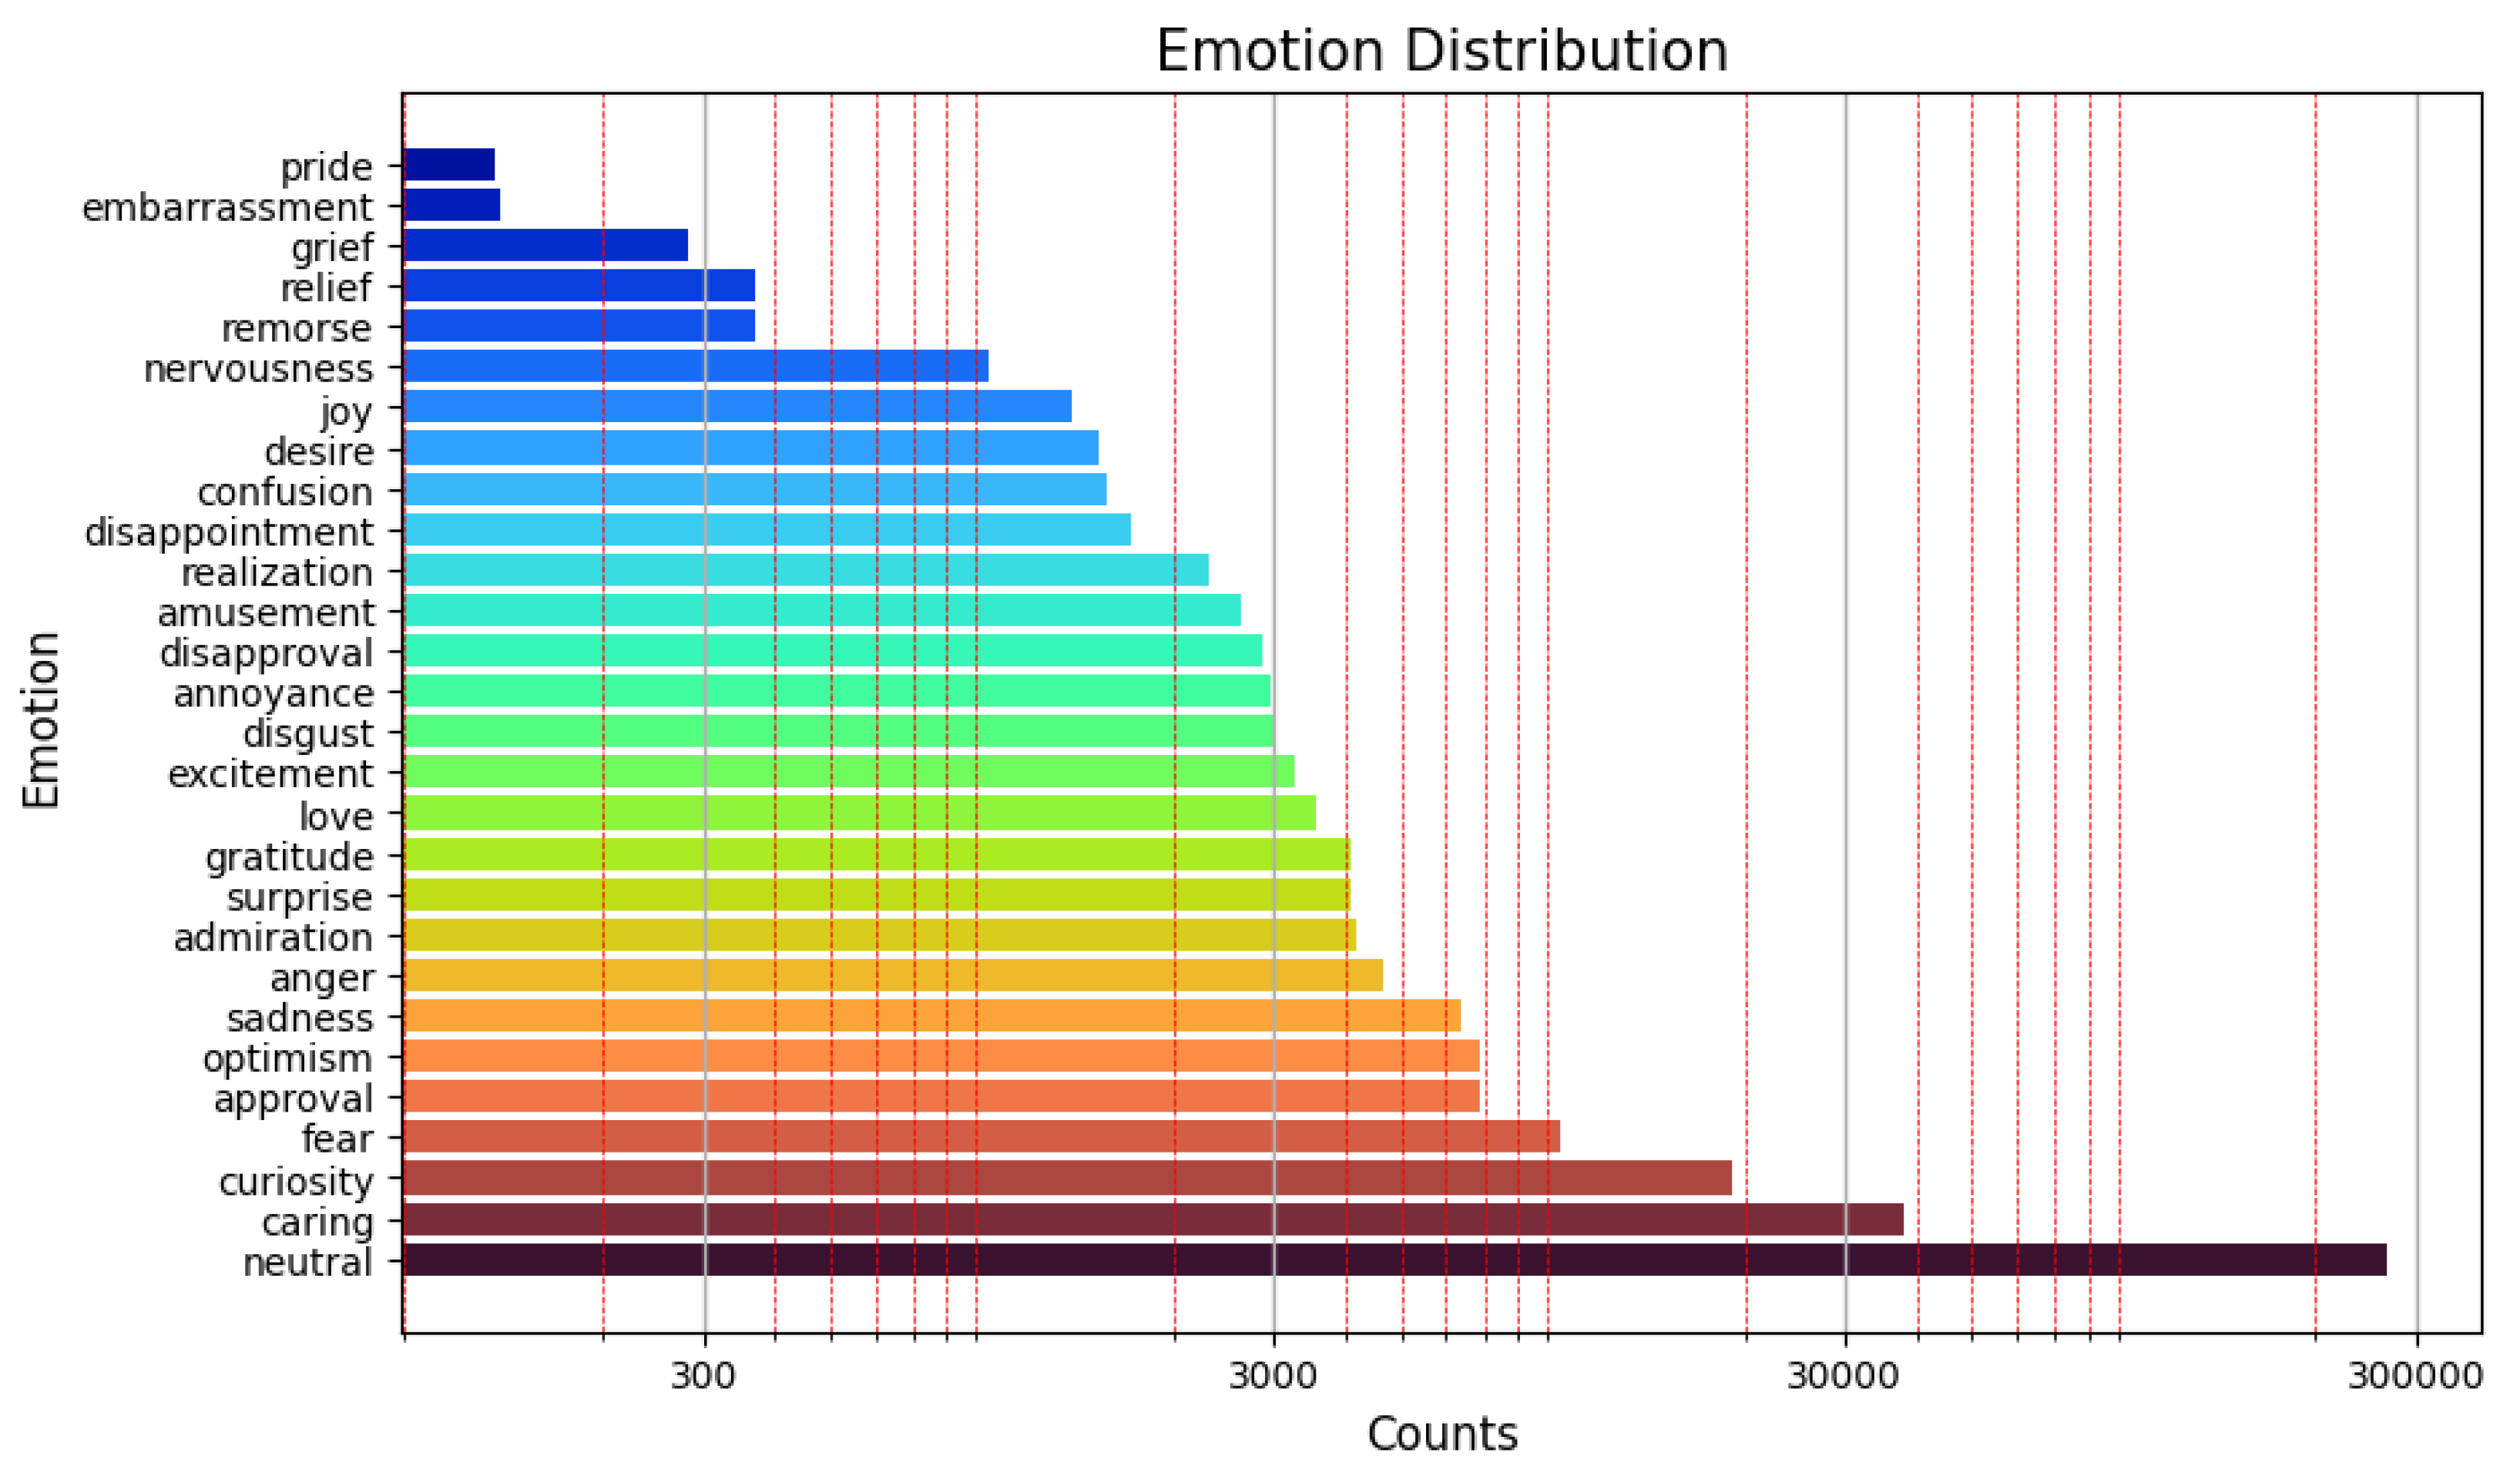
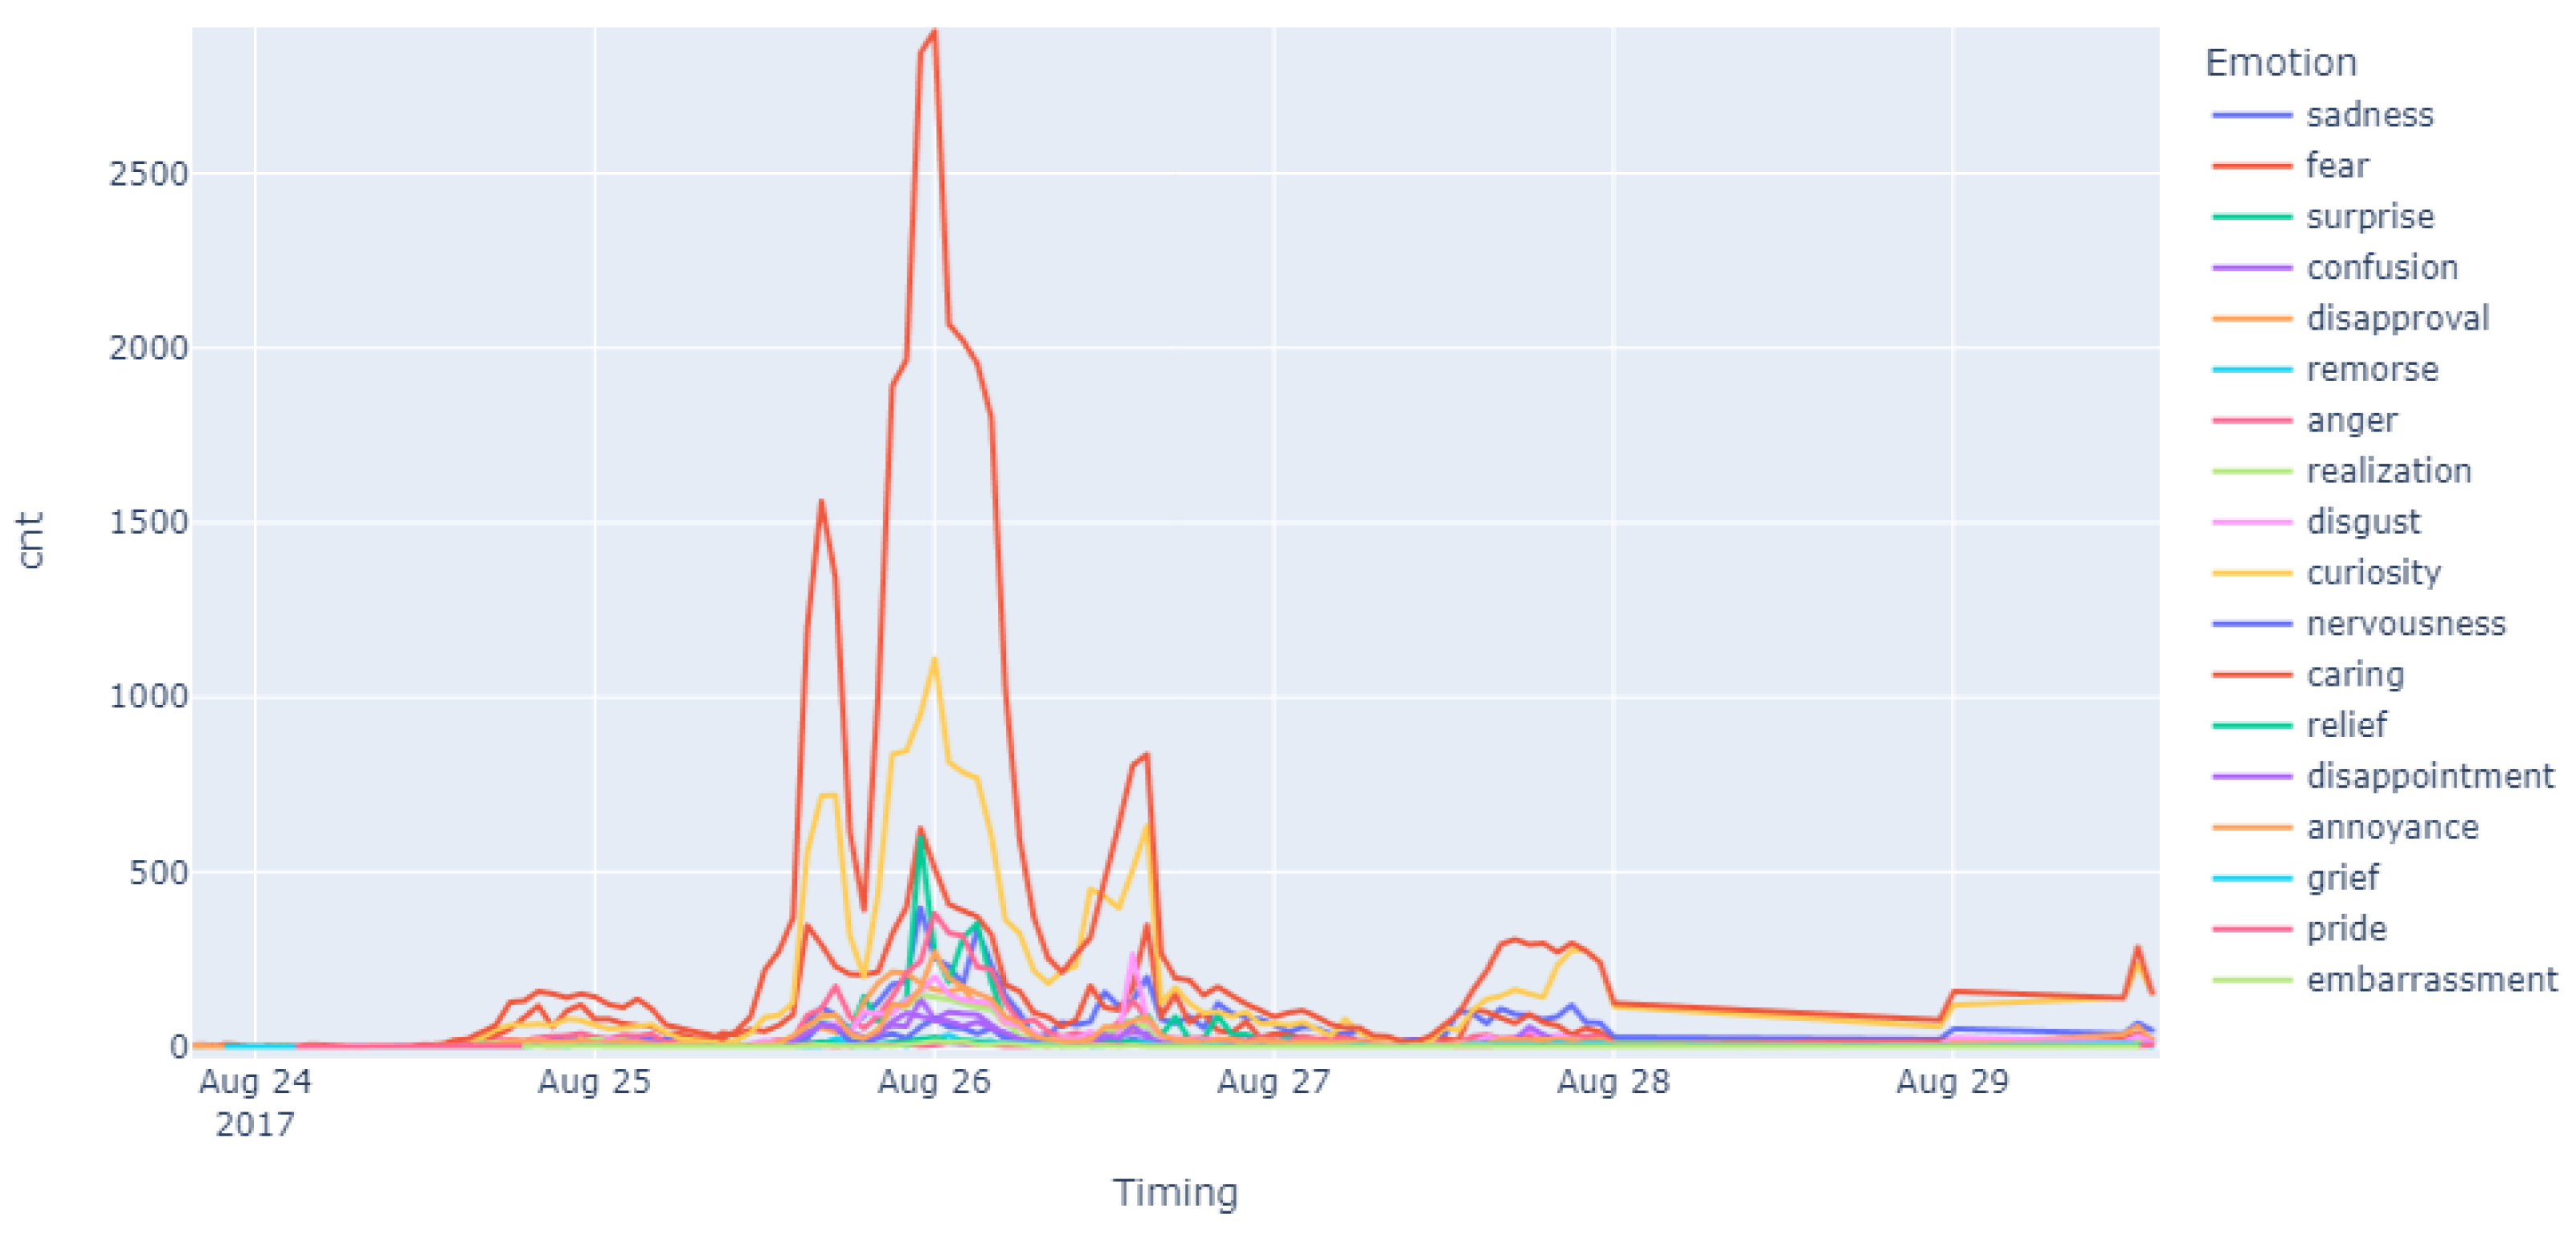
4.3. Emotion Distribution and Evolution

Table 2 and Figure 4 present the counts of tweets per emotion tag and their trends, respectively. In Figure 4, we see that ‘caring’ was the most common emotion for the tweets related to this natural disaster throughout the majority of the time. We see that ‘caring’ built up between 24 August and was closely trailed by ‘curiosity’ and ‘fear’. By the time we get to noon on 25 August, ‘curiosity’ overtakes ‘fear’ as the second most common emotion and maintains that position fairly steadily. On 26 August, it appears that many Twitter users expressed ’surprise’, which closely trailed ‘fear’, the third most-common emotion. However, there are a range of emotions that the data support for this day, and most notably, ‘anger’, ‘disgust’, ‘annoyance’, ‘disappointment’, and ‘disapproval’ shed light that many users may have expressed frustration with how the disaster preparedness and response was handled by local, state, and federal agencies or even how their own neighbors and fellow residents were handling evacuation and other measures taken for disaster safety. There are four phases of emergency management that are addressed by FEMA and other agencies, and these are mitigation, preparedness, response, and recovery. Therefore, understanding the sentiments and emotions of the general public leading up to, during, and after a disaster is a helpful tool for understanding the performance of these emergency agencies at all levels of government and for nonprofit efforts.
We can surmise from this line plot that users were generally caring, fearful, and curious in the lead up to the disaster, and that while an overwhelming majority remained caring, there is a sentiment of general curiosity related to the path of the hurricane and the status on loss of life and property that we generally would be concerned with for a hurricane. Additionally, we have a population of people surprised and expressing negative sentiment during and after the hurricane making landfall; therefore, it would be reasonable to conclude that many users were not happy with the disaster response effort efficiency, effectiveness, timeliness, and/or overall performance. As the public comes to the realization of what happened as news reports and information continues to be shared online, we see that the sentiment to be ‘caring’ and to express ‘curiosity’, ’sadness’, or ‘fear’ are the prevailing sentiments during the early recovery phase of this disaster, with ‘disgust’ and ‘disappointment’ still substantial but remaining secondary to the aforementioned emotions that tend to align with civil mobilization to recover after a disaster.

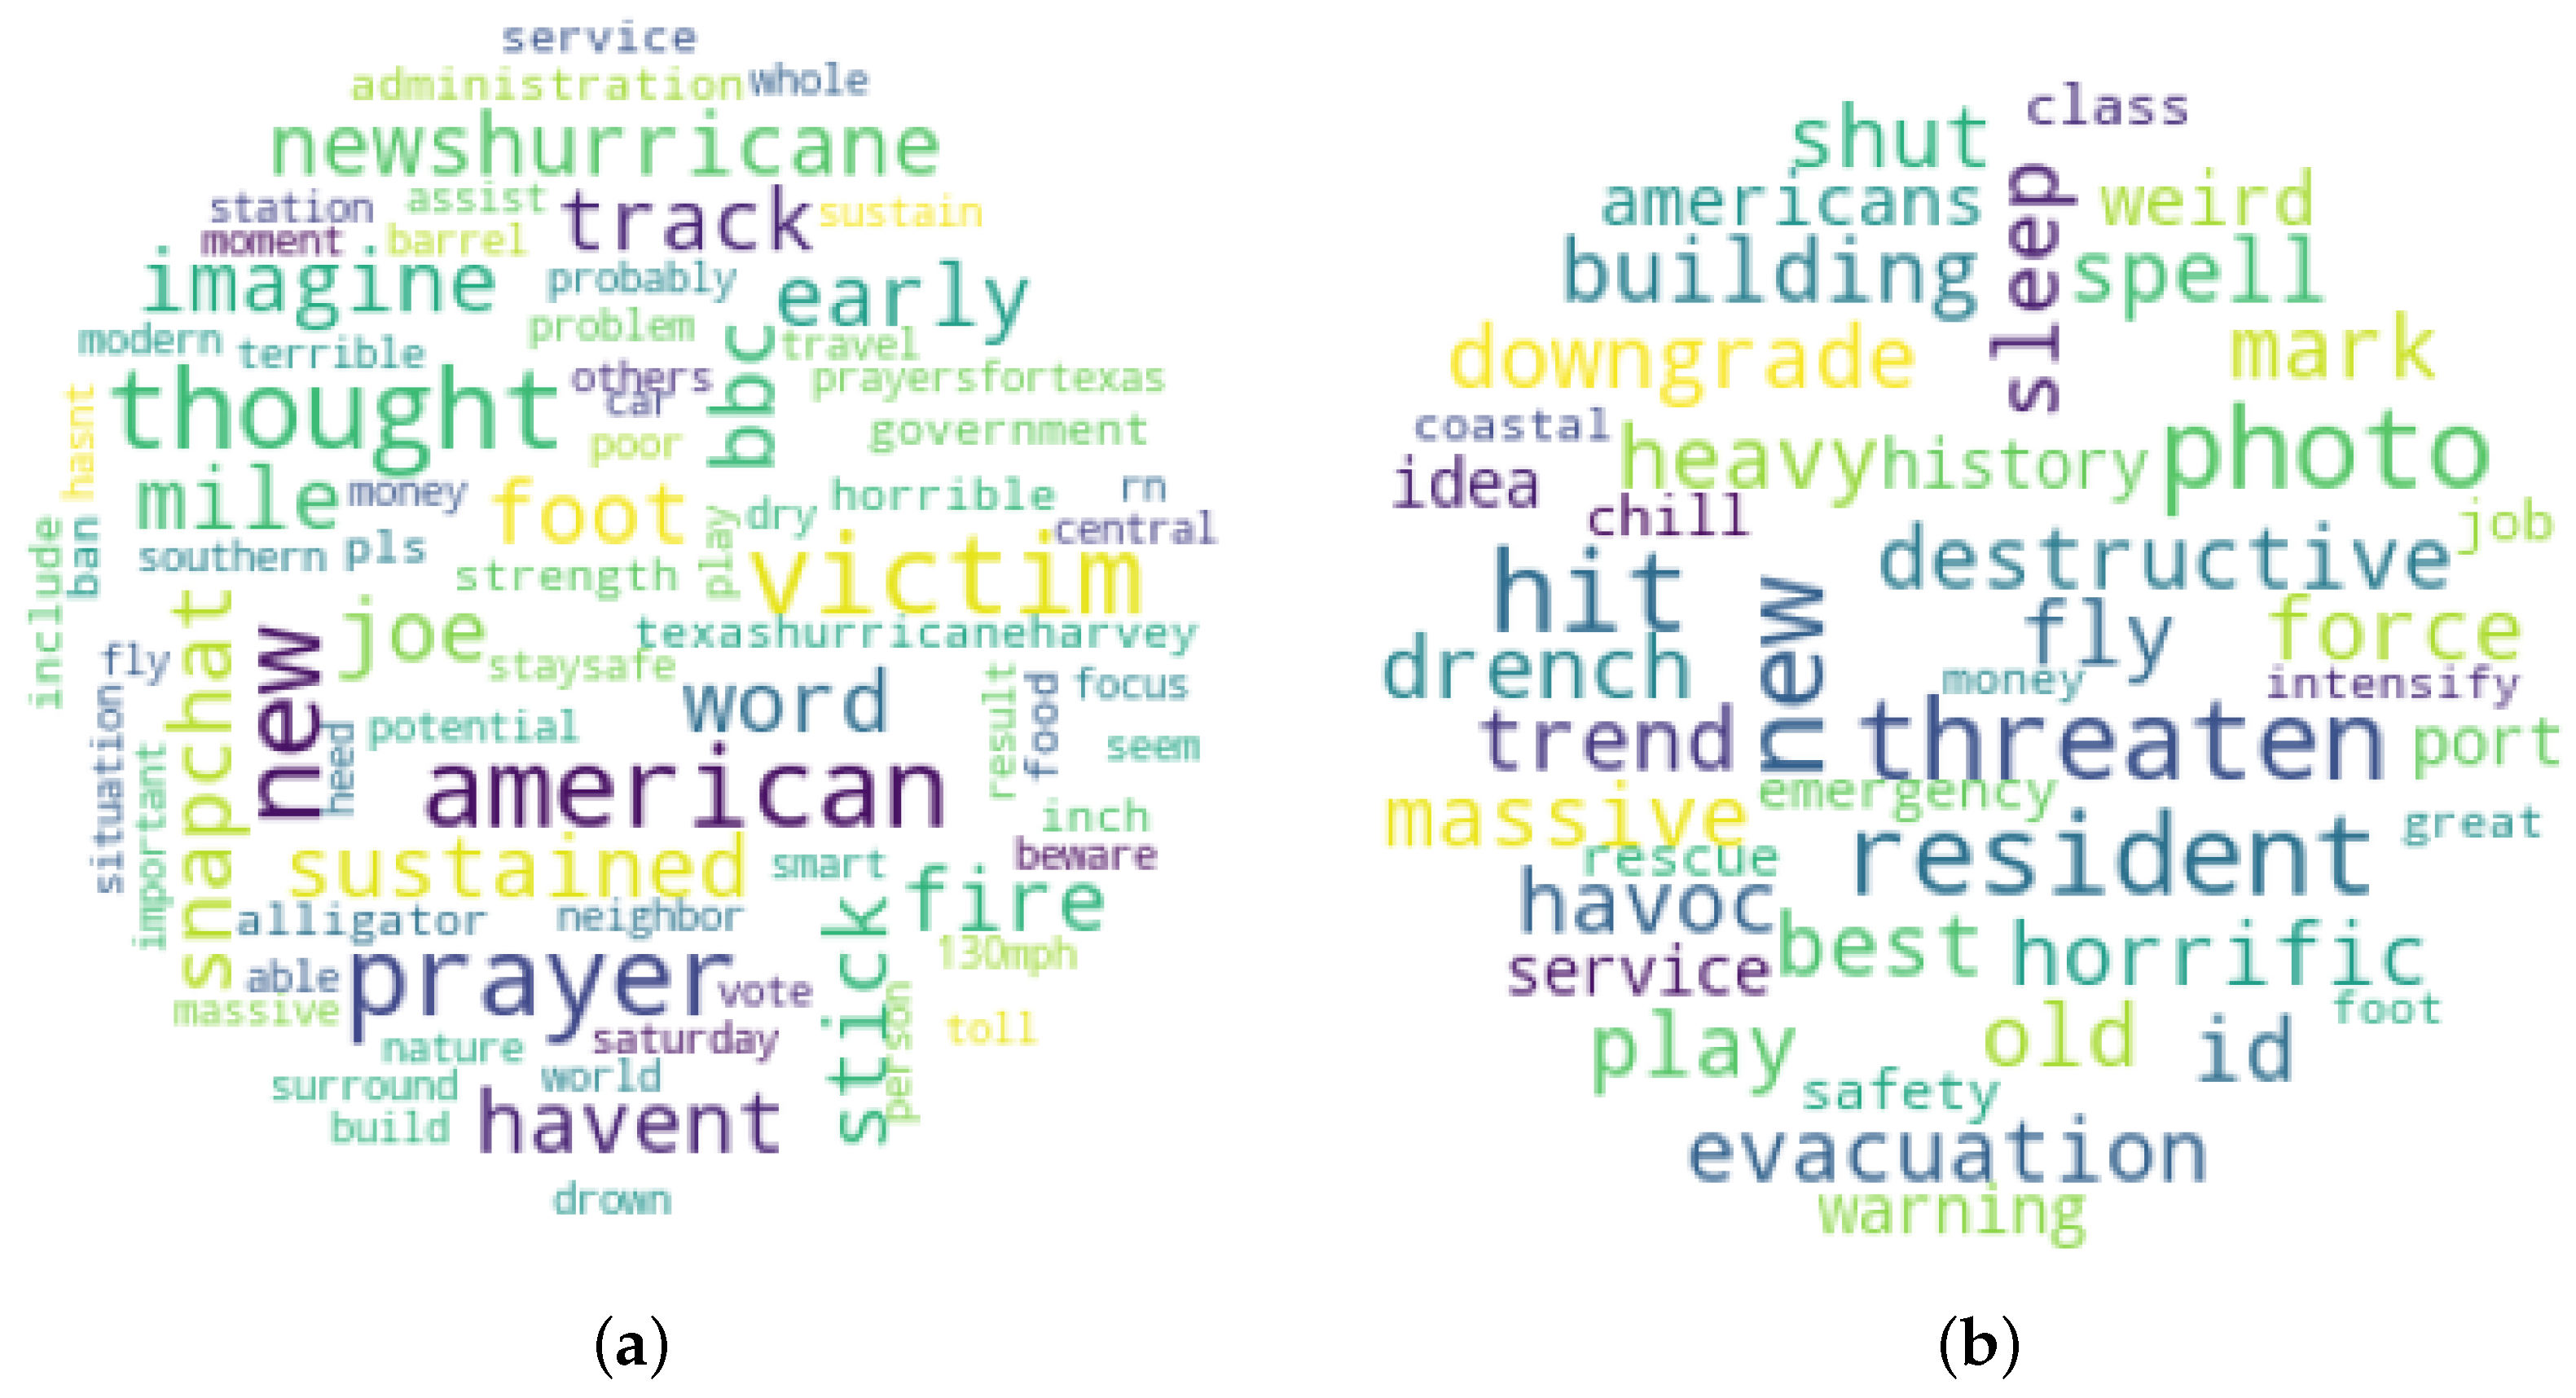
4.4. Stressor Extraction Results

We conducted a search for the optimal number of topics for the LDA model using the scikit-learn library with a learning rate of 0.7 [46]. To determine the most suitable number of topics for our model, we constructed multiple LDA models by varying the number of topics from 20 to 70 in increments of 5. Subsequently, we computed the UMass coherence score [44] for the top 30 terms in each model and plotted the results in Figure 5. Particularly, at 55 topics, we observed a significant decrease in the rate of improvement in terms of the UMass score for our LDA model. Consequently, we decided to select 55 topics as the optimal number to use for constructing our LDA model. Since the number of topics is not so big, we can conduct manual extraction of stressors from these topics and their representative terms. The extraction process involves defining the stressor name represented for each topic and choosing representative terms from the most frequent terms that appeared for that topic. Two researchers conduct the extraction. The extraction step can only move forward if the two agrees on both the stressor’s name and the representative terms. Otherwise, new definitions are proposed.

Stressor Insight Analysis

The extracted stressors and their associated terms are listed in Table 3. In this table, we see that we were left with lexicon that defined our 20 stressors as both psychosocial and event-focused stressors. Our psychosocial stressors included ‘Care of Family & Friend’, which is one’s circle of friends and that forms the rudimentary basis of society; ‘Closures’ impact daily life and routines for students, parents, families, and the professionals that run the institutions facing closure; ‘Power’ is maintained from a governmental institution or representative; and ‘Climate change policy update’ because it goes beyond just the hurricane event into regulatory institutional changes. The remaining stressors were specifically event-focused, meaning they were derived with a focus on the preparation, response, and recovery from Hurricane Harvey’s landfall and destruction.
For example, the stress of ‘Landfall danger’ is defined by a set of terms that make it clear that there is concern of landfall, the hurricane’s path through Rockport, and its terrifying nature. Similarly, ‘Landfall preparedness’ is a stressor supported by the idea of bracing and preparing for landfall and paying attention to the calls for safety. ‘Safety update’ is another stressor that signifies the importance of getting the latest information and updates regarding the hurricane to everyone. The stressor for ‘lack of resources’ indicates that there was need for items like water, as reflected by a supported key term ‘water’. The ‘destruction’ stressor is supported by key terms that involve checking for damage and understanding the catastrophic destruction that had taken place with rainfall and flooding. The stressor for ‘fake news’ is based on terms for reporting major news, threats, the strengthening and powerful nature of the threats, as well as indications that there was fake news being conveyed. The ‘evacuation plan’ stressor is supported by the nature of fleeing, running, or evacuating to get to a camp, as well as being on watch and finding safety. The ‘flood’ stressor’s key terms characterize the flooding as catastrophic destruction and indicate that there was concern to watch local areas and to rescue people. The stressor for ‘concern for animals’ is supported by the idea that animals were also terrified and there was a need to reach the animals and a concern regarding where to keep them. We see that ‘heavy rain’ was a major stressor as residents were presented with the problem of having 10 inches of heavy rainfall hit. We recognize an increase in ‘shelter needs and death toll’ in the cities for humans and pets due to the flooding and storm with parallels being drawn to Hurricane Sandy. As a result of Hurricane Harvey, reports of ‘oil & gas prices rise’ were common, and there was a high impact on food resources, which could prompt FEMA to offer critical needs assistance to affected civilians. ‘Finances’ itself is a stressor for the concern about financial business and inventory losses, costly building and land damage, and, of course, civilian needs to access, use, and make money. The ‘Response’ stressor involves watching, predicting, saving, and tracking information. It also involves saving lives by calling and telling people about the path of destruction and where to go for safety and resources. Lastly, the ‘alligator’ stressor was a real natural threat that was reported as the hurricane made landfall and followed its path, creating disturbance in the ecosystem that led to alligator sightings near civilians. These natural and other event-driven stressors coupled with the psychosocial stressors made Hurricane Harvey a traumatic event for civilian in the region and nationwide for those who followed the news. It is important to monitor stressors for disasters so that organizations like FEMA and state agencies can improve their state of preparedness, their response, their recovery efforts, as well as their mitigation strategy over time.

5. Limitations

We acknowledge certain limitations of our study. First, the data are self-reported by Twitter’s users, which may introduce social desirability biases. Second, the focus solely on Twitter’s data may not represent the emotional health of individuals across all web platforms or in real life, limiting the generalizability of our findings. Thus, this study is a showcase of our capability to extract information within a limited amount of data. In the future, we will expand our work with more comprehensive datasets for climate change stressors. Third, the extraction of stressors manually through main themes discussed on social media may have human bias and dependencies on the identified themes and may neglect stressors in “low volume” discussions. This can be addressed via a more comprehensive disaster dataset and objective approaches for stressor extraction techniques. Additionally, validation approaches like interviews or surveys will help to validate our findings.
Another limitation is that our model stems from the absence of context information for each tweet with “neutral” emotion. Unlike other social media platforms, tweets can only contain up to 280 characters, and a substantial amount of context is concealed within URL links shared within each message. This can potentially lead to the misclassification of tweets that contain minimal context as neutral, thereby limiting our capacity to identify more profound stressors. The implementation of an efficient information scraper to append this textual data to their respective tweets would significantly enhance our ability to extract more insightful stressors that influence public opinion on the topics of climate change. Nevertheless, for other tweets with emotion tags that are not “neutral”, the result is trustworthy enough, as the data and model have been well developed based on a dataset annotated by Google.
Finally, further research is needed to better understand the advantages and disadvantages of using social media for emotional health assessment and climate-change-related stressor extraction in disaster events. Specifically, young people may use Twitter more compared with senior people. Additionally, the data are related to hurricanes only. Therefore, bias may exist. Our findings may be different across population age groups or types of disasters, such as earthquakes and heatwaves. A more comprehensive disaster dataset is required for mitigating the issue.

6. Conclusions

In this paper, we present a case study about predicting public emotions and climate-change-related stressor extraction for emotional health diagnosis during disaster events using a dataset that contains tweets that were written during Hurricane Harvey. EmoRoBERTa is employed for emotion prediction, and LDA topic modeling is utilized for stressor extraction. Compared to the existing research, which utilized NLP techniques on social media data to study the mental health impacts of climate change, our study focuses on emotions and climate-change-related stressors instead of the mental health status. Results show that a number of stressors pressed people who expressed a variety of emotions while combating the hurricane event. This study has demonstrated the potential of using NLP techniques and easily available open social media data to explore emotional health and extract climate-change-related stressors. We hope the findings in this study can provide insights for healthcare providers and policy makers to handle the needs of climate-change-related emotional health support and more through a comprehensive strategy for successful disaster management program.
For future work, we will extend the algorithm to different types of disasters and build a comprehensive lexicon for automatic extraction of climate-change-related stressors. This process will overcome the limitation of manual extraction and will enable automatic monitoring of climate change impacts on human emotional well being.

Author Contributions

T.B.: Methodology, formal analysis, software, writing—original draft. A.H.: Methodology, software, writing and editing. R.N.: Writing— review, editing, and supervision. S.M.: Funding acquisition, review, supervision, and project administration. E.L.: writing—review and editing. M.W.: writing—review and editing. L.N.: Conceptualization, writing—review, editing, supervision, funding acquisition, and project administration. All authors have read and agreed to the published version of the manuscript.

Funding

This work was partially supported by NSF—USA CNS-2219614, CNS-2219615, and CNS-2302274.

Data Availability Statement

Source code and data are available at https://github.com/litpuvn/climate-change-stressors (accessed date: 26 October 2023).

Conflicts of Interest

The authors declare no conflict of interest.

References

  1. Amadeo, K. Hurricane Harvey Facts, Damage and Costs. Balance. 2018. Available online: https://www.lamar.edu/_files/documents/resilience-recovery/grant/recovery-and-resiliency/hurric2.pdf (accessed on 27 November 2023).
  2. Cooper, S.; Hutchings, P.; Butterworth, J.; Joseph, S.; Kebede, A.; Parker, A.; Terefe, B.; Van Koppen, B. Environmental associated emotional distress and the dangers of climate change for pastoralist mental health. Glob. Environ. Chang. 2019, 59, 101994. [Google Scholar] [CrossRef]
  3. Aihara, Y.; Shrestha, S.; Sharma, J. Household water insecurity, depression and quality of life among postnatal women living in urban Nepal. J. Water Health 2016, 14, 317–324. [Google Scholar] [CrossRef] [PubMed]
  4. Stevenson, E.G.; Greene, L.E.; Maes, K.C.; Ambelu, A.; Tesfaye, Y.A.; Rheingans, R.; Hadley, C. Water insecurity in 3 dimensions: An anthropological perspective on water and women’s psychosocial distress in Ethiopia. Soc. Sci. Med. 2012, 75, 392–400. [Google Scholar] [PubMed]
  5. Ojala, M. Young people and global climate change: Emotions, coping, and engagement in everyday life. Geogr. Glob. Issues Chang. Threat 2016, 8, 1–19. [Google Scholar]
  6. Friedrich, E.; Wüstenhagen, R. Leading organizations through the stages of grief: The development of negative emotions over environmental change. Bus. Soc. 2017, 56, 186–213. [Google Scholar] [CrossRef]
  7. Hickman, C.; Marks, E.; Pihkala, P.; Clayton, S.; Lewandowski, R.E.; Mayall, E.E.; Wray, B.; Mellor, C.; van Susteren, L. Climate anxiety in children and young people and their beliefs about government responses to climate change: A global survey. Lancet Planet. Health 2021, 5, e863–e873. [Google Scholar] [CrossRef]
  8. Ramos, J. Using tf-idf to determine word relevance in document queries. In Proceedings of the First Instructional Conference on Machine Learning, Citeseer, Los Angeles, CA, USA, 23–24 June 2003; Volume 242, pp. 29–48. [Google Scholar]
  9. Kamath, R.; Ghoshal, A.; Eswaran, S.; Honnavalli, P.B. Emoroberta: An enhanced emotion detection model using roberta. In Proceedings of the IEEE International Conference on Electronics, Computing and Communication Technologies, Bangalore, India, 8–10 July 2022. [Google Scholar]
  10. Blei, D.M.; Lafferty, J.D. Topic models. Text Min. Classif. Clust. Appl. 2009, 10, 34. [Google Scholar]
  11. Grassia, M.G.; Marino, M.; Mazza, R.; Misuraca, M.; Stavolo, A. Topic modeling for analysing the Russian propaganda in the conflict with Ukraine. In ASA 2022; Firenze University Press: Firenze, Italy; Genova University Press: Genova, Italy, 2023; p. 245. [Google Scholar]
  12. Grootendorst, M. BERTopic, Neural topic modeling with a class-base for TF-IDF procedure. arXiv 2022, arXiv:2203.05794. [Google Scholar]
  13. Karas, B.; Qu, S.; Xu, Y.; Zhu, Q. Experiments with LDA and Top2Vec for embedded topic discovery on social media data—A case study of cystic fibrosis. Front. Artif. Intell. 2022, 5, 948313. [Google Scholar] [CrossRef]
  14. Man, I.; Georges, D.; de Carvalho, T.M.; Saraswati, L.R.; Bhandari, P.; Kataria, I.; Siddiqui, M.; Muwonge, R.; Lucas, E.; Berkhof, J.; et al. Evidence-based impact projections of single-dose human papillomavirus vaccination in India: A modelling study. Lancet Oncol. 2022, 23, 1419–1429. [Google Scholar] [CrossRef]
  15. Asmundson, G.J.; Taylor, S. Coronaphobia: Fear and the 2019-nCoV outbreak. J. Anxiety Disord. 2020, 70, 102196. [Google Scholar] [CrossRef] [PubMed]
  16. Manikonda, L. Analysis and Decision-Making with Social Media; Arizona State University: Tempe, AZ, USA, 2019. [Google Scholar]
  17. Kaplan, A.M. Social Media, Definition, and History. In Encyclopedia of Social Network Analysis and Mining; Alhajj, R., Rokne, J., Eds.; Springer: New York, NY, USA, 2018; pp. 2662–2665. [Google Scholar] [CrossRef]
  18. Gao, H.; Barbier, G.; Goolsby, R. Harnessing the crowdsourcing power of social media for disaster relief. IEEE Intell. Syst. 2011, 26, 10–14. [Google Scholar] [CrossRef]
  19. Lindsay, B.R. Social Media and Disasters: Current Uses, Future Options, and Policy Considerations; Technical Report; Library of Congress; Congressional Research Service: Washington, DC, USA, 2011. [Google Scholar]
  20. Du, H.; Nguyen, L.; Yang, Z.; Abu-Gellban, H.; Zhou, X.; Xing, W.; Cao, G.; Jin, F. Twitter vs news: Concern analysis of the 2018 california wildfire event. In Proceedings of the 2019 IEEE 43rd Annual Computer Software and Applications Conference (COMPSAC), Milwaukee, WI, USA, 15–19 July 2019; Volume 2, pp. 207–212. [Google Scholar]
  21. Nguyen, L.H.; Hewett, R.; Namin, A.S.; Alvarez, N.; Bradatan, C.; Jin, F. Smart and connected water resource management via social media and community engagement. In Proceedings of the 2018 IEEE/ACM International Conference on Advances in Social Networks Analysis and Mining (ASONAM), Barcelona, Spain, 28–31 August 2018; pp. 613–616. [Google Scholar]
  22. Yang, Z.; Nguyen, L.; Zhu, J.; Pan, Z.; Li, J.; Jin, F. Coordinating disaster emergency response with heuristic reinforcement learning. In Proceedings of the 2020 IEEE/ACM International Conference on Advances in Social Networks Analysis and Mining (ASONAM), Hague, The Netherlands, 7–10 December 2020; pp. 565–572. [Google Scholar]
  23. Nguyen, L.; Yang, Z.; Li, J.; Pan, Z.; Cao, G.; Jin, F. Forecasting people’s needs in hurricane events from social network. IEEE Trans. Big Data 2019, 8, 229–240. [Google Scholar] [CrossRef]
  24. Lu, Y.; Hu, X.; Wang, F.; Kumar, S.; Liu, H.; Maciejewski, R. Visualizing social media sentiment in disaster scenarios. In Proceedings of the 24th International Conference on World Wide Web, Florence, Italy, 18–22 May 2015; pp. 1211–1215. [Google Scholar]
  25. Kryvasheyeu, Y.; Chen, H.; Obradovich, N.; Moro, E.; Van Hentenryck, P.; Fowler, J.; Cebrian, M. Rapid assessment of disaster damage using social media activity. Sci. Adv. 2016, 2, e1500779. [Google Scholar] [CrossRef] [PubMed]
  26. Hurricane Harvey Tweets. 2017. Available online: https://www.kaggle.com/datasets/dan195/hurricaneharvey (accessed on 6 August 2023).
  27. Ghoshal, A. EmoRoBERTa. 2023. Available online: https://huggingface.co/arpanghoshal/EmoRoBERTa (accessed on 18 August 2023).
  28. Hind Saleh, A.A.; Moria, K. Detection of Hate Speech using BERT and Hate Speech Word Embedding with Deep Model. Appl. Artif. Intell. 2023, 37, 2166719. [Google Scholar] [CrossRef]
  29. Gupta, S.; Lakra, S.; Kaur, M. Study on BERT Model for Hate Speech Detection. In Proceedings of the 2020 4th International Conference on Electronics, Communication and Aerospace Technology (ICECA), Coimbatore, India, 5–7 November 2020; pp. 1–8. [Google Scholar] [CrossRef]
  30. D`Sa, A.G.; Illina, I.; Fohr, D. BERT and fastText Embeddings for Automatic Detection of Toxic Speech. In Proceedings of the 2020 International Multi-Conference on: “Organization of Knowledge and Advanced Technologies” (OCTA), Tunis, Tunisia, 6–8 February 2020; pp. 1–5. [Google Scholar] [CrossRef]
  31. Hoang, M.; Bihorac, O.A.; Rouces, J. Aspect-Based Sentiment Analysis using BERT. In Proceedings of the 22nd Nordic Conference on Computational Linguistics, Turku, Finland, 30 September–2 October 2019; Hartmann, M., Plank, B., Eds.; Linköping University Electronic Press: Turku, Finland, 2019; pp. 187–196. [Google Scholar]
  32. Pota, M.; Ventura, M.; Catelli, R.; Esposito, M. An Effective BERT-Based Pipeline for Twitter Sentiment Analysis: A Case Study in Italian. Sensors 2021, 21, 133. [Google Scholar] [CrossRef]
  33. Gu, J.C.; Li, T.; Liu, Q.; Ling, Z.H.; Su, Z.; Wei, S.; Zhu, X. Speaker-Aware BERT for Multi-Turn Response Selection in Retrieval-Based Chatbots. In Proceedings of the 29th ACM International Conference on Information & Knowledge Management, Online, 19–20 October 2020; Association for Computing Machinery: New York, NY, USA, 2020; pp. 2041–2044. [Google Scholar] [CrossRef]
  34. Xu, Z.; Zhu, P. Using BERT-Based Textual Analysis to Design a Smarter Classroom Mode for Computer Teaching in Higher Education Institutions. Int. J. Emerg. Technol. Learn. 2023, 18, 114–127. [Google Scholar] [CrossRef]
  35. To, Q.G.; To, K.G.; Huynh, V.A.N.; Nguyen, N.T.Q.; Ngo, D.T.N.; Alley, S.J.; Tran, A.N.Q.; Tran, A.N.P.; Pham, N.T.T.; Bui, T.X.; et al. Applying Machine Learning to Identify Anti-Vaccination Tweets during the COVID-19 Pandemic. Int. J. Environ. Res. Public Health 2021, 18, 4069. [Google Scholar] [CrossRef]
  36. Zhu, J.; Weng, F.; Zhuang, M.; Lu, X.; Tan, X.; Lin, S.; Zhang, R. Revealing Public Opinion towards the COVID-19 Vaccine with Weibo Data in China: BertFDA-Based Model. Int. J. Environ. Res. Public Health 2022, 19, 13248. [Google Scholar] [CrossRef]
  37. Rahali, A.; Akhloufi, M.A. MalBERT: Using Transformers for Cybersecurity and Malicious Software Detection. arXiv 2021, arXiv:2103.03806. [Google Scholar]
  38. Liu, Y.; Ott, M.; Goyal, N.; Du, J.; Joshi, M.; Chen, D.; Levy, O.; Lewis, M.; Zettlemoyer, L.; Stoyanov, V. Roberta: A robustly optimized bert pretraining approach. arXiv 2019, arXiv:1907.11692. [Google Scholar]
  39. Demszky, D.; Movshovitz-Attias, D.; Ko, J.; Cowen, A.; Nemade, G.; Ravi, S. GoEmotions: A Dataset of Fine-Grained Emotions. arXiv 2020, arXiv:2005.00547. [Google Scholar]
  40. Devlin, J.; Chang, M.W.; Lee, K.; Toutanova, K. BERT: Pre-training of Deep Bidirectional Transformers for Language Understanding. arXiv 2019, arXiv:1810.04805. [Google Scholar]
  41. Chen, T.H.; Thomas, S.W.; Hassan, A.E. A survey on the use of topic models when mining software repositories. Empir. Softw. Eng. 2016, 21, 1843–1919. [Google Scholar] [CrossRef]
  42. Hofmann, T. Probabilistic latent semantic indexing. In Proceedings of the 22nd Annual international ACM SIGIR Conference on Research and Development in Information Retrieval, Berkeley, CA, USA, 15–19 August 1999; pp. 50–57. [Google Scholar]
  43. Blei, D.M.; Ng, A.Y.; Jordan, M.I. Latent dirichlet allocation. J. Mach. Learn. Res. 2003, 3, 993–1022. [Google Scholar]
  44. Mimno, D.; Wallach, H.M.; Talley, E.; Leenders, M.; McCallum, A. Optimizing Semantic Coherence in Topic Models. In Proceedings of the Conference on Empirical Methods in Natural Language Processing, Scotland, UK, 27–31 July 2011; Association for Computational Linguistics: Cambridge, MA, USA, 2011; pp. 262–272. [Google Scholar]
  45. Thorndike, R. Who belongs in the family? Psychometrika 1953, 18, 267–276. [Google Scholar] [CrossRef]
  46. Pedregosa, F.; Varoquaux, G.; Gramfort, A.; Michel, V.; Thirion, B.; Grisel, O.; Blondel, M.; Prettenhofer, P.; Weiss, R.; Dubourg, V.; et al. Scikit-learn: Machine Learning in Python. J. Mach. Learn. Res. 2011, 12, 2825–2830. [Google Scholar]
Figure 1. Overview of the research framework for climate-change-related stressor extraction.
Mathematics 11 04910 g001
Figure 2. Distribution of predicted emotion tags in the Hurricane Harvey dataset.
Mathematics 11 04910 g002
Figure 3. Overview of all tweets and stressor emotion tweets throughout Hurricane Harvey. (a) All tweets. (b) Stressor emotion tweets.
Mathematics 11 04910 g003
Figure 4. Trend of public emotions during Hurricane Harvey.
Mathematics 11 04910 g004
Figure 5. Number of topics for LDA topic modeling and climate-change-related stressor extraction.
Mathematics 11 04910 g005
Table 1. EmoRoBERTa model’s structure and parameters.
Layer (Type)Output ShapeValue of Parameter
input_ids(None, 50)0
token_type_ids(None, 50)0
roberta(32, 50, 768)124,055,040
emotion(28, 1)612,124
Table 2. Basic descriptive statistics associated with each emotion tag.
LikesRepliesRetweetsTweet
Counts
EmotionMeanMaxMeanMaxMeanMax
caring6.119930.322672.0387637,965
curiosity2.518420.351171.3877319,068
fear3.099770.363032.146449502
sadness4.418460.39713.065776362
anger3.818460.441411.387854633
surprise5.788270.52944.938984103
disgust3.557730.451032.296873024
annoyance4.907650.51912.108482948
disapproval3.797320.46452.084582856
realization6.187590.58842.905462315
grief7.588870.2671.51117283
embarrassment1.06110.1720.225133
pride9.734560.33152.45123130
Table 3. Climate-change-related stressors and their representative terms.
StressorImportant Terms
Care of Family & Friendpraying, family, friend, path, everyone, affect, safety, pray, people, stay, area, state, hit, keep, protection, home
Landfall dangermake, landfall, pray, late, mess, danger, breaking, early, friday, news, expect, path, rockport, powerful, people, terrify
Closuresdue, close, today, cancel, join, school, emergency, safety, government, stay, saturday, service, pray, office, weekend, day
Powerpower, nothing, home, without, port, enough, dry, focus, play, ban, leave, damage, go, cover, thousand, resident
Safety updateupdate, sending, latest, night, terrifying, homeless, prayer, suffer, siege, wrong, everyones, love, positive, path, safety, affect
Lack of resourcesneed, guy, water, give, last, dear, end, world, help, safe, stay, night, pray, go, everyone, time, people
Destructioncause, expect, check, damage, die, lot, flooding, ill, story, catastrophic, whole, rainfall, event, hard, people, go, see, hit
Fake Newsus, bad, feel, year, work, fake, powerful, news, ask, hit, threaten, strengthen, report, likely, major
Evacuation planflee, continue, intensify, run, doings, thousand, people, closely, camp, evacuation, arrive, forget, time, strengthen, assist, path, watch, safety
Floodflood, catastrophic, watch, hit, start, wake, destruction, local, area, home, path, rescue, people, time
Concern for animalscant, animal, morning, believe, terrify, reach, stand, leave, people, go, think, imagine, good, keep
Warningstonight, thinking, land, safety, warning, devastating, stay, moment, nature, heed, path, friend, everyone, pray, hit, family
Heavy rainrain, upgrade, bless, find, problem, heavy, hold, 10, inch, breaking, foot, expect, day, safety, hit, huge
Shelter needs and death tolleye, shelter, city, pet, death, aid, sandy, vote, rise, horrible, toll, face, cancel, find, flooding, show, ask
Oil & Gas price riseprice, report, stop, gas, fema, oil, food, impact, rise, news, expect, high, affect, bad
Landfall Preparednessprepare, think, high, let, attention, wishing, drown, pay, safety, stay, pray, path, rain, brace, make, landfall, catastrophic
Financeready, sure, wont, realize, medium, massive, money, make
Responsecall, tell, response, save, watching, inside, predict, track, life, hard
Climate change policy update demandchange, climate, handle, deluge, administration, make, much, DoE, say, check, evacuate, show, good, people, cnn, rainfall
Alligatormove, turn, follow, beware, tropical, alligator, consider, people, news, see, hit, path, safety
Disclaimer/Publisher’s Note: The statements, opinions and data contained in all publications are solely those of the individual author(s) and contributor(s) and not of MDPI and/or the editor(s). MDPI and/or the editor(s) disclaim responsibility for any injury to people or property resulting from any ideas, methods, instructions or products referred to in the content.

