Article

Locating Anchor Drilling Holes Based on Binocular Vision in Coal Mine Roadways

1
College of Mechanical Engineering, Xi’an University of Science and Technology, Xi’an 710054, China
2
Shaanxi Key Laboratory of Mine Electromechanical Equipment Intelligent Detection and Control, Xi’an 710054, China
3
Faculty of Engineering and Technology, Liverpool John Moores University, Byrom Street, Liverpool L3 3AF, UK
*
Author to whom correspondence should be addressed.
Mathematics 2023, 11(20), 4365; https://doi.org/10.3390/math11204365
Submission received: 26 August 2023 / Revised: 16 October 2023 / Accepted: 17 October 2023 / Published: 20 October 2023

Abstract

:
The implementation of roof bolt support within a coal mine roadway has the capacity to bolster the stability of the encompassing rock strata and thereby mitigate the potential for accidents. To enhance the automation of support operations, this paper introduces a binocular vision positioning method for drilling holes, which relies on the adaptive adjustment of parameters. Through the establishment of a predictive model, the correlation between the radius of the target circular hole in the image and the shooting distance is ascertained. Based on the structural model of the anchor drilling robot and the related sensing data, the shooting distance range is defined. Exploiting the geometric constraints inherent to adjacent anchor holes, the precise identification of anchor holes is detected by a Hough transformer with an adaptive parameter-adjusted method. On this basis, the matching of the anchor hole contour is realized by using linear slope and geometric constraints, and the spatial coordinates of the anchor hole center in the camera coordinate system are determined based on the binocular vision positioning principle. The outcomes of the experiments reveal that the method attains a positioning accuracy of 95.2%, with an absolute error of around 1.52 mm. When compared with manual operation, this technique distinctly enhances drilling accuracy and augments support efficiency.

1. Introduction

The roof stability of coal mine roadways has consistently stood as a foremost challenge during the process of coal mine production [1]. Currently, the reinforcement of roadway roofs predominantly relies on the utilization of single anchor drilling rigs operated by personnel [2]. Nonetheless, this support methodology is characterized by numerous constraints: the support pace is slow and the labor intensity is high and exposes workers to significant security risks due to prolonged activity beneath the unreinforced roof [3]. The current approach to support roofs of coal mine roadways has become a significant obstacle, which limits the realization of high efficiency, environmental protection, and safety of coal mine production. Consequently, enhancing the automation level of the supporting process is regarded as a pivotal avenue for mitigating the aforementioned challenges [4,5,6].
The complex coal mine roadway roof bolt support technology involves a sequence of actions, including drilling, applying an anchor agent, placing anchor rods, mixing the anchor agent, and pretightening. All these steps are conducted in a continuous manner. Accurately locating the anchor drilling holes is key to the bolt support operation, directly affecting the support speed and quality. In this paper, binocular vision positioning technology is proposed to automatically locate the anchor drilling holes. Vision positioning methods can be categorized into monocular [7,8], binocular [9,10], and multiple camera approaches [11,12,13] based on the number of vision sensors employed. Binocular vision positioning utilizes a pair of visual sensors to capture a single scene from distinct angles. By analyzing the disparities in these views, the method calculates the positional data of a specific point of interest. This approach finds extensive applications in various domains such as robot navigation [14,15,16,17], simultaneous localization and mapping (SLAM) [18,19], industrial automation [20,21], and intelligent agriculture [22,23].
Applications of visual positioning in the field of coal mining are emerging, but most of the applications are aimed at the spatial positioning of equipment [24,25,26,27], and no research on the spatial positioning of roof anchor holes in roadways is reported. In order to improve the automation degree of roadway support, an automatic positioning method to extract the spatial 3D coordinates of anchor holes based on binocular vision is proposed. An image segmentation method based on the shape of a roof steel strip is proposed to improve the image segmentation accuracy. With this method, roof steel strip images can be precisely segmented. A parameter-adaptive Hough circle detection method is designed to improve the recognition accuracy and shorten the recognition time. To accurately match the center coordinates of anchor holes, a stereo matching method based on the slope of a straight line is proposed.
The main contributions of this paper are summarized as follows:
(1)
The present paper proposes an approach for the spatial positioning of the anchor drilling center, which employs binocular stereo vision. A corresponding experimental platform for anchor drilling positioning is also introduced. The proposed method is shown to outperform the conventional manual technique in terms of the accuracy and stability of positioning, as demonstrated by the experimental results. The method also exhibits a 60% increase in the roof support speed.
(2)
A circle detection method based on the parameter-adaptive Hough transform is introduced, and a functional relationship between the size of the circular hole in the image and the actual distance is established. The Hough circle detection function’s maximum and minimum radii are adaptively adjusted to enable the accurate identification and segmentation of the anchor hole’s circular contour.
(3)
A stereo matching method is developed by leveraging the slope of the straight line where the contour of the anchor hole is located and geometric constraints during stereo matching. This approach enables rapid matching of the anchor hole even under conditions of weak texture.
The rest of this paper is organized as follows. In Section 2, the relevant preparatory work for this paper is explained, including the structure of the anchor drilling robot, the binocular vision system, and the image preprocessing method. In Section 3, the procedure of the proposed method is presented in detail. In Section 4, a series of experiments are presented to verify the performance of the proposed method. The discussion of the experimental results is presented in Section 5. Finally, the conclusions and future work are presented in Section 6.

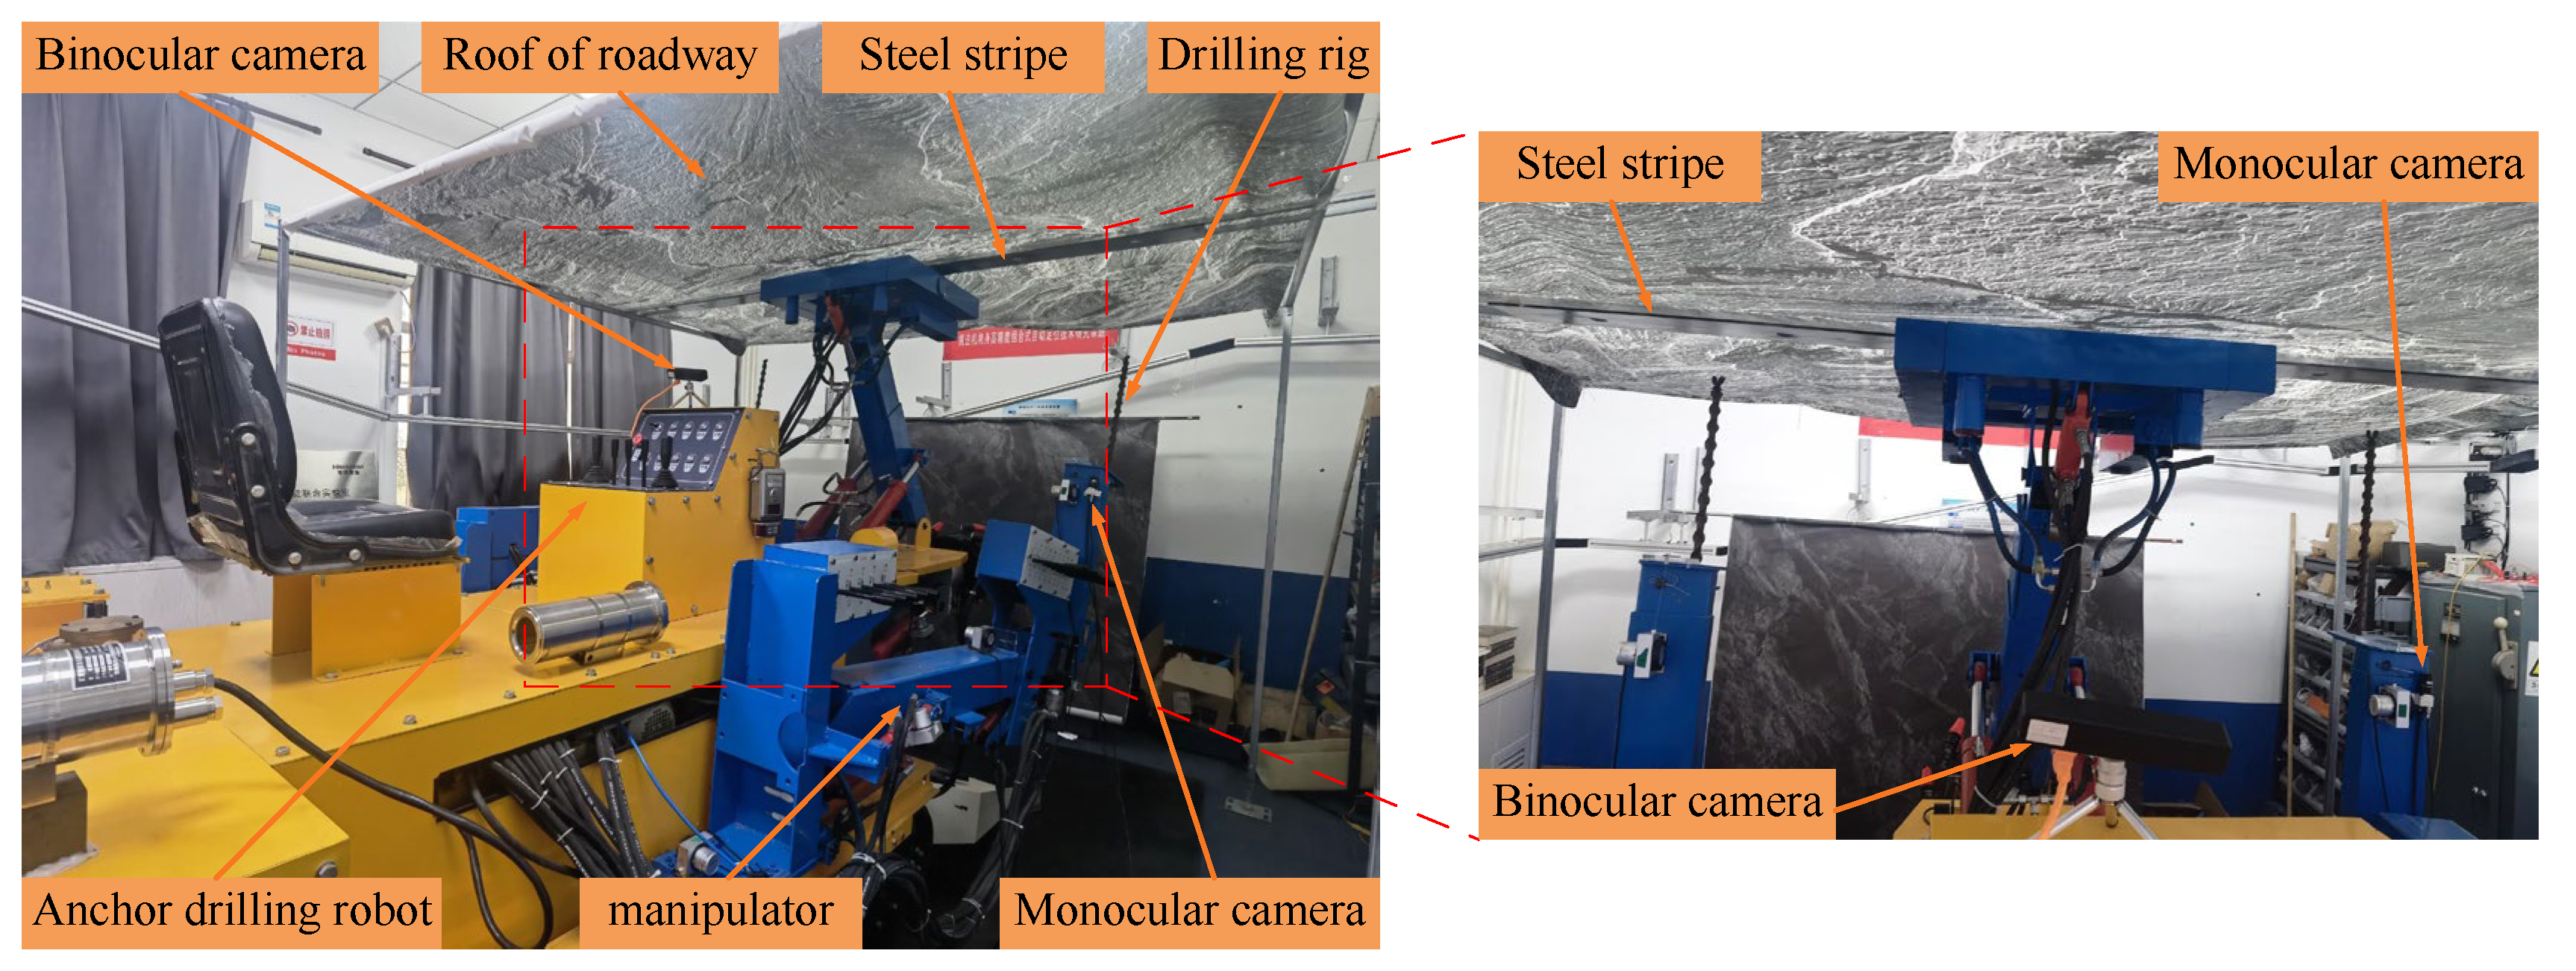
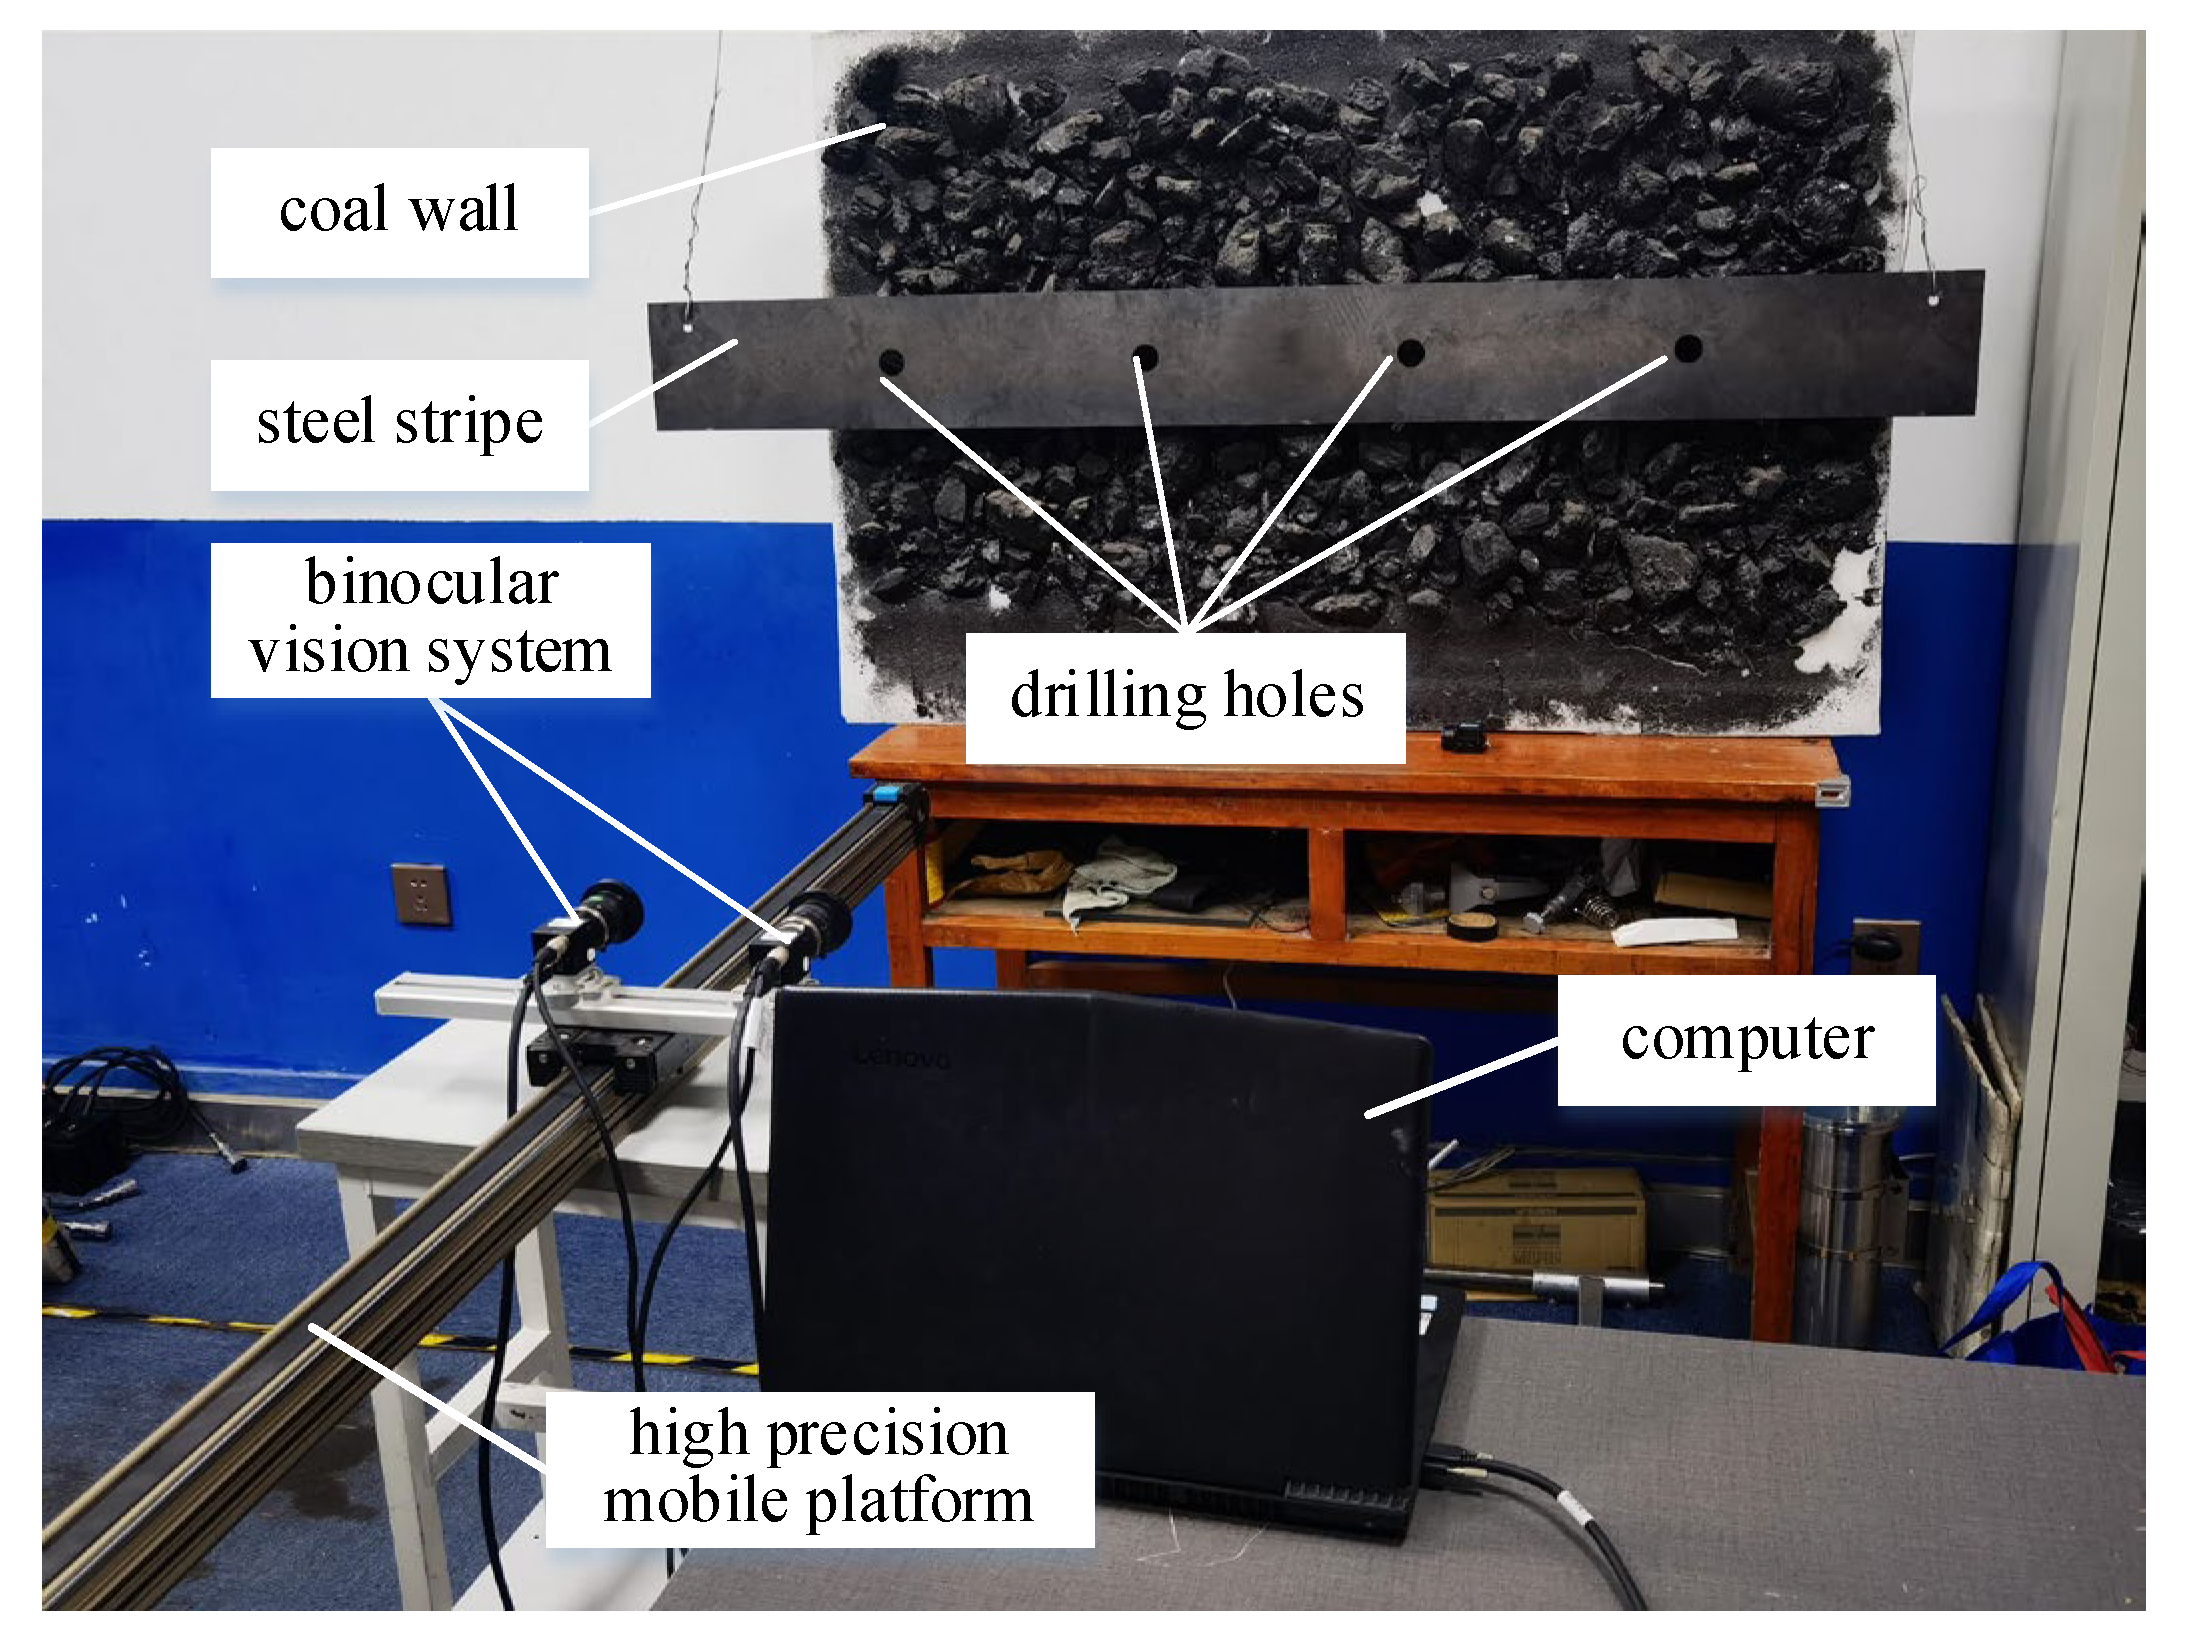
2. Anchor Drilling Robot and Supporting Process

As shown in Figure 1, the anchor drilling robot consists of a cantilever roadheader and two six-degree-of-freedom robotic manipulators, distributed in parallel on both sides of its body, with a drilling rig as its end effector. After the cantilever roadheader completes the tunnel excavation, the drilling rig completes the roof or rib bolting of the roadway in the coal mine.
The process of roadway roof support is carried out according to the following steps: firstly, the binocular vision system captures the images of the roof steel strip, and the positioning method described is used to determine the center coordinates of the anchor drilling holes. Then, the position-based visual servo technology is used to move the manipulator to the vicinity of the target position to complete the rough control of the manipulator. Then, the monocular camera on the manipulator is used to obtain the image of the steel strip, and the image-based visual servo technology is used to accurately position the drilling rig in the center of the anchor hole, so that the drilling rig can complete the anchoring task. The system comprehensively utilizes the visual positioning method and visual servo control method to realize the automation of bolt support in a coal mine roadway. In this paper, the accurate positioning method of anchor drilling is studied.

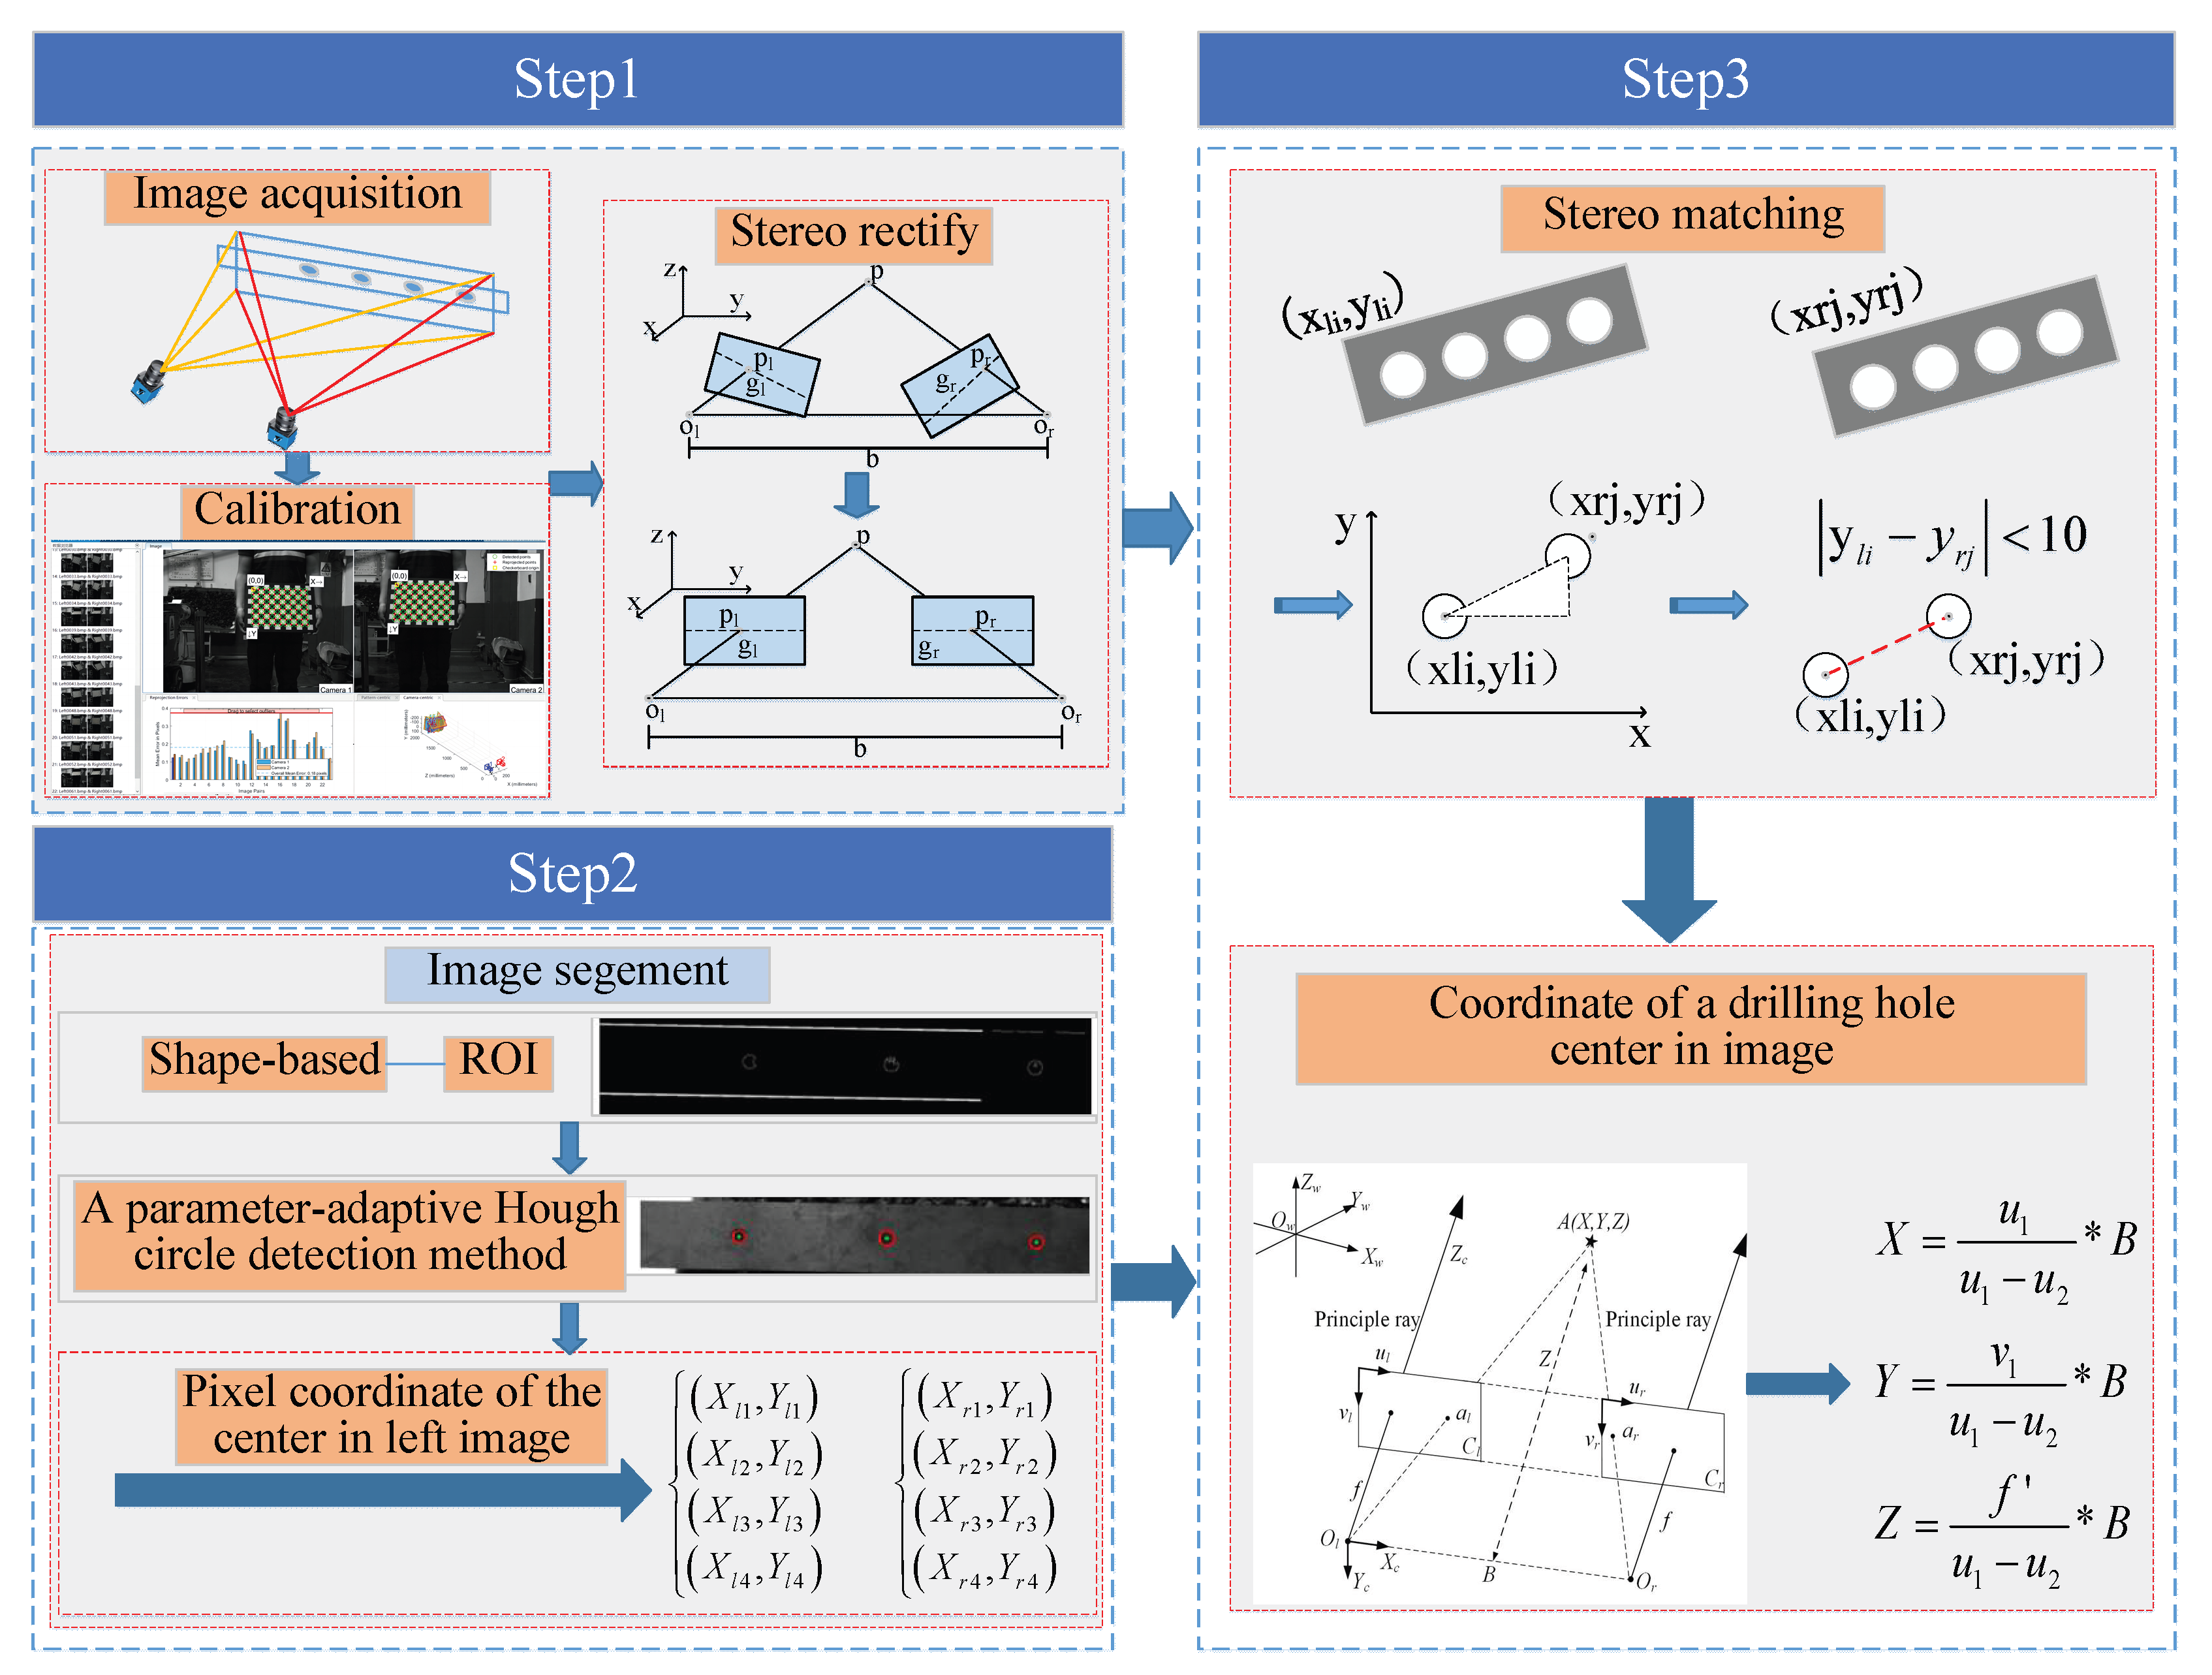
2.1. Flowchart of Binocular Vision Positioning Algorithm

The binocular vision system for positioning consists of a computer, two industrial cameras, a calibration board, and software for positioning. As shown in Figure 2, the 3D coordinate extraction method based on the binocular vision system is composed of three steps. In step 1, the cameras are used to simultaneously capture images of the calibration board in different positions, and the MATLAB toolbox is used to calibrate the images in order to determine the camera’s internal and external parameters [28]. It was necessary to complete the stereo rectification for the images captured using the parameters obtained from the calibration result, such that the two cameras’ imaging planes were parallel and pixels in the rows were aligned to form an ideal binocular stereo vision model [29]. In Step 2, the Otsu method is employed to perform image binarization, while median filtering effectively eliminates salt and pepper noise, culminating in comprehensive image preprocessing. Simultaneously, the steel strip is segmented based on its distinct shape characteristics, with the steel strip area serving as the designated Region of Interest (ROI). Ultimately, the anchor drilling holes on the steel strip are pinpointed through parameter-adaptive Hough circle detection, allowing for the retrieval of their precise pixel coordinates. Moving to Step 3, the procedure initiates by executing stereo matching between the left and right steel stripe, enabling the subsequent determination of the anchor hole’s spatial coordinates via the application of triangulation principles.

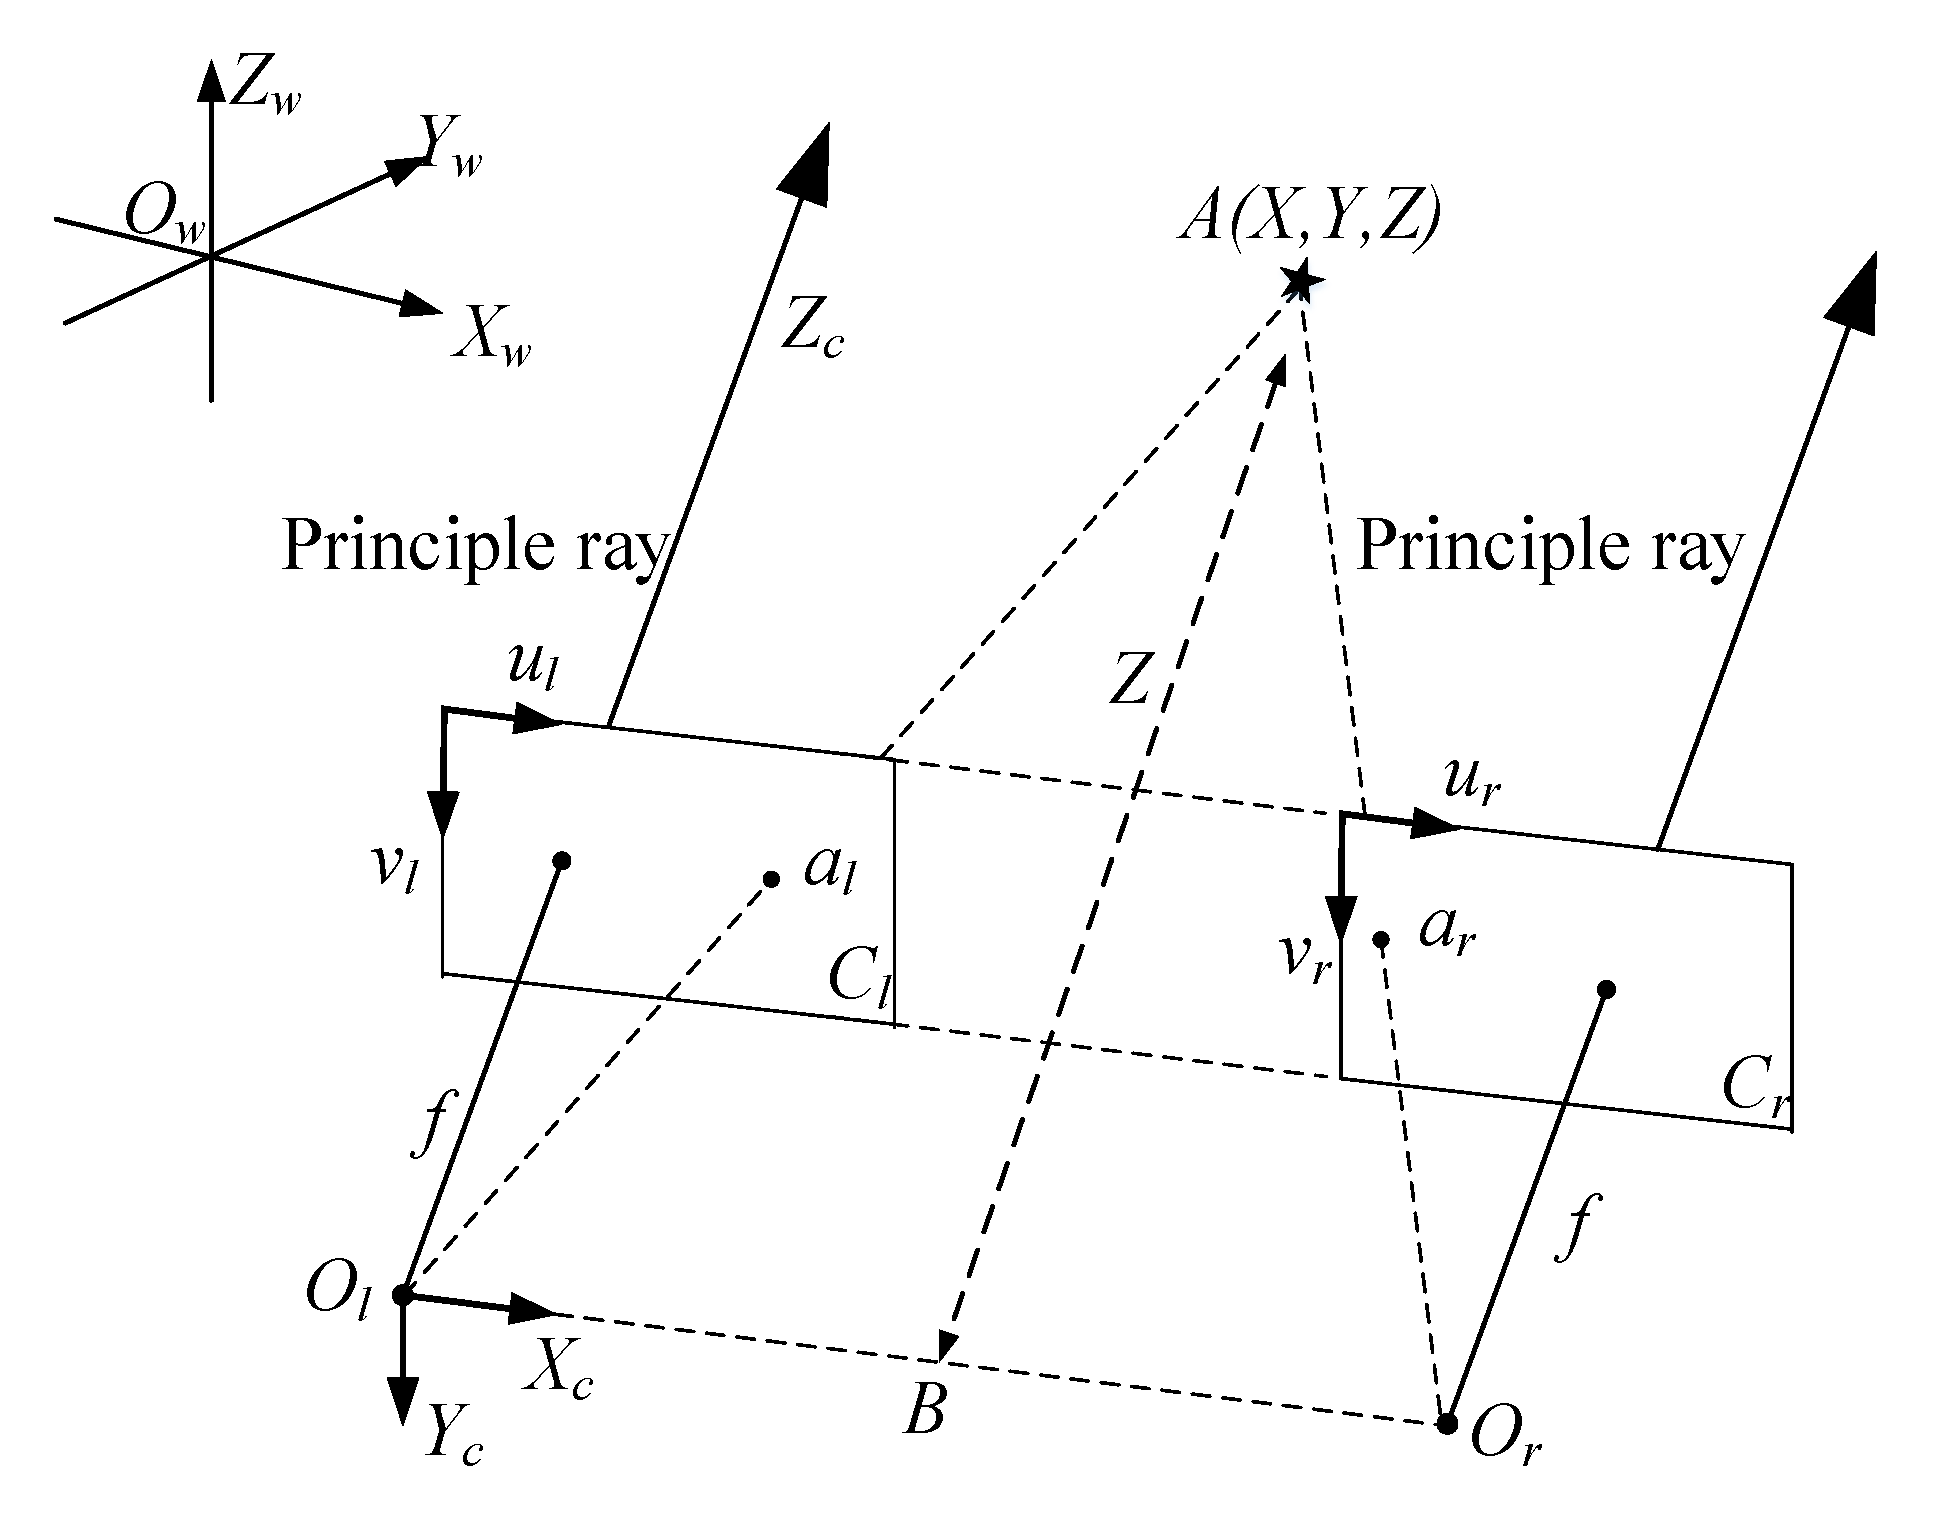
2.2. Calibration of Cameras and Stereo Rectification of Images

The calibration of the camera is an important step in computer vision, and is also the foundation for other computer programs. To generate a relationship between the 3D coordinates of a spatial point and the pixel coordinates of the same point on the image plane, calibration involves obtaining the camera’s internal parameters (such as the focal length and the central pixel) and external parameters (such as the rotation and translation matrix). Once the calibration process has been completed, we can use the calibrated parameters to complete the stereo rectification of the camera, which will allow the system to be transformed into the ideal model of a stereo vision system. In both the left and right images, the image rows of the same single point were unanimous after rectification. We only had to locate their matching points on the same line in order to improve the efficiency of stereo matching since the images satisfied bipolar constraints.
As a result of the calibration, a relationship is established between the space point and the corresponding point on the image plane. To reduce the difficulty and improve the efficiency of stereo matching, it is necessary to perform stereo rectification on the two images, which can convert the coordinates corresponding to a particular point on the right side of the coordinate image from a two-dimensional search to a one-dimensional search. Figure 3 shows the left and right image pairs before stereo correction, and Figure 4 shows the image pairs after stereo correction. As can be seen from Figure 3, the left and right images before stereo rectification are not coplanar. The red line in the left picture passes through the anchor hole, but there is still some distance from the anchor hole in the right picture, which can be clearly seen from the enlarged picture in the upper left corner. As can be seen from Figure 4, the left and right images after stereo rectification are coplanar and linearly aligned, the red straight line in the figure is tangent to the anchor hole, and the spatial dotted lines in the left and right images are aligned.

3. Locating Anchor Drilling Holes Based on Binocular Vision

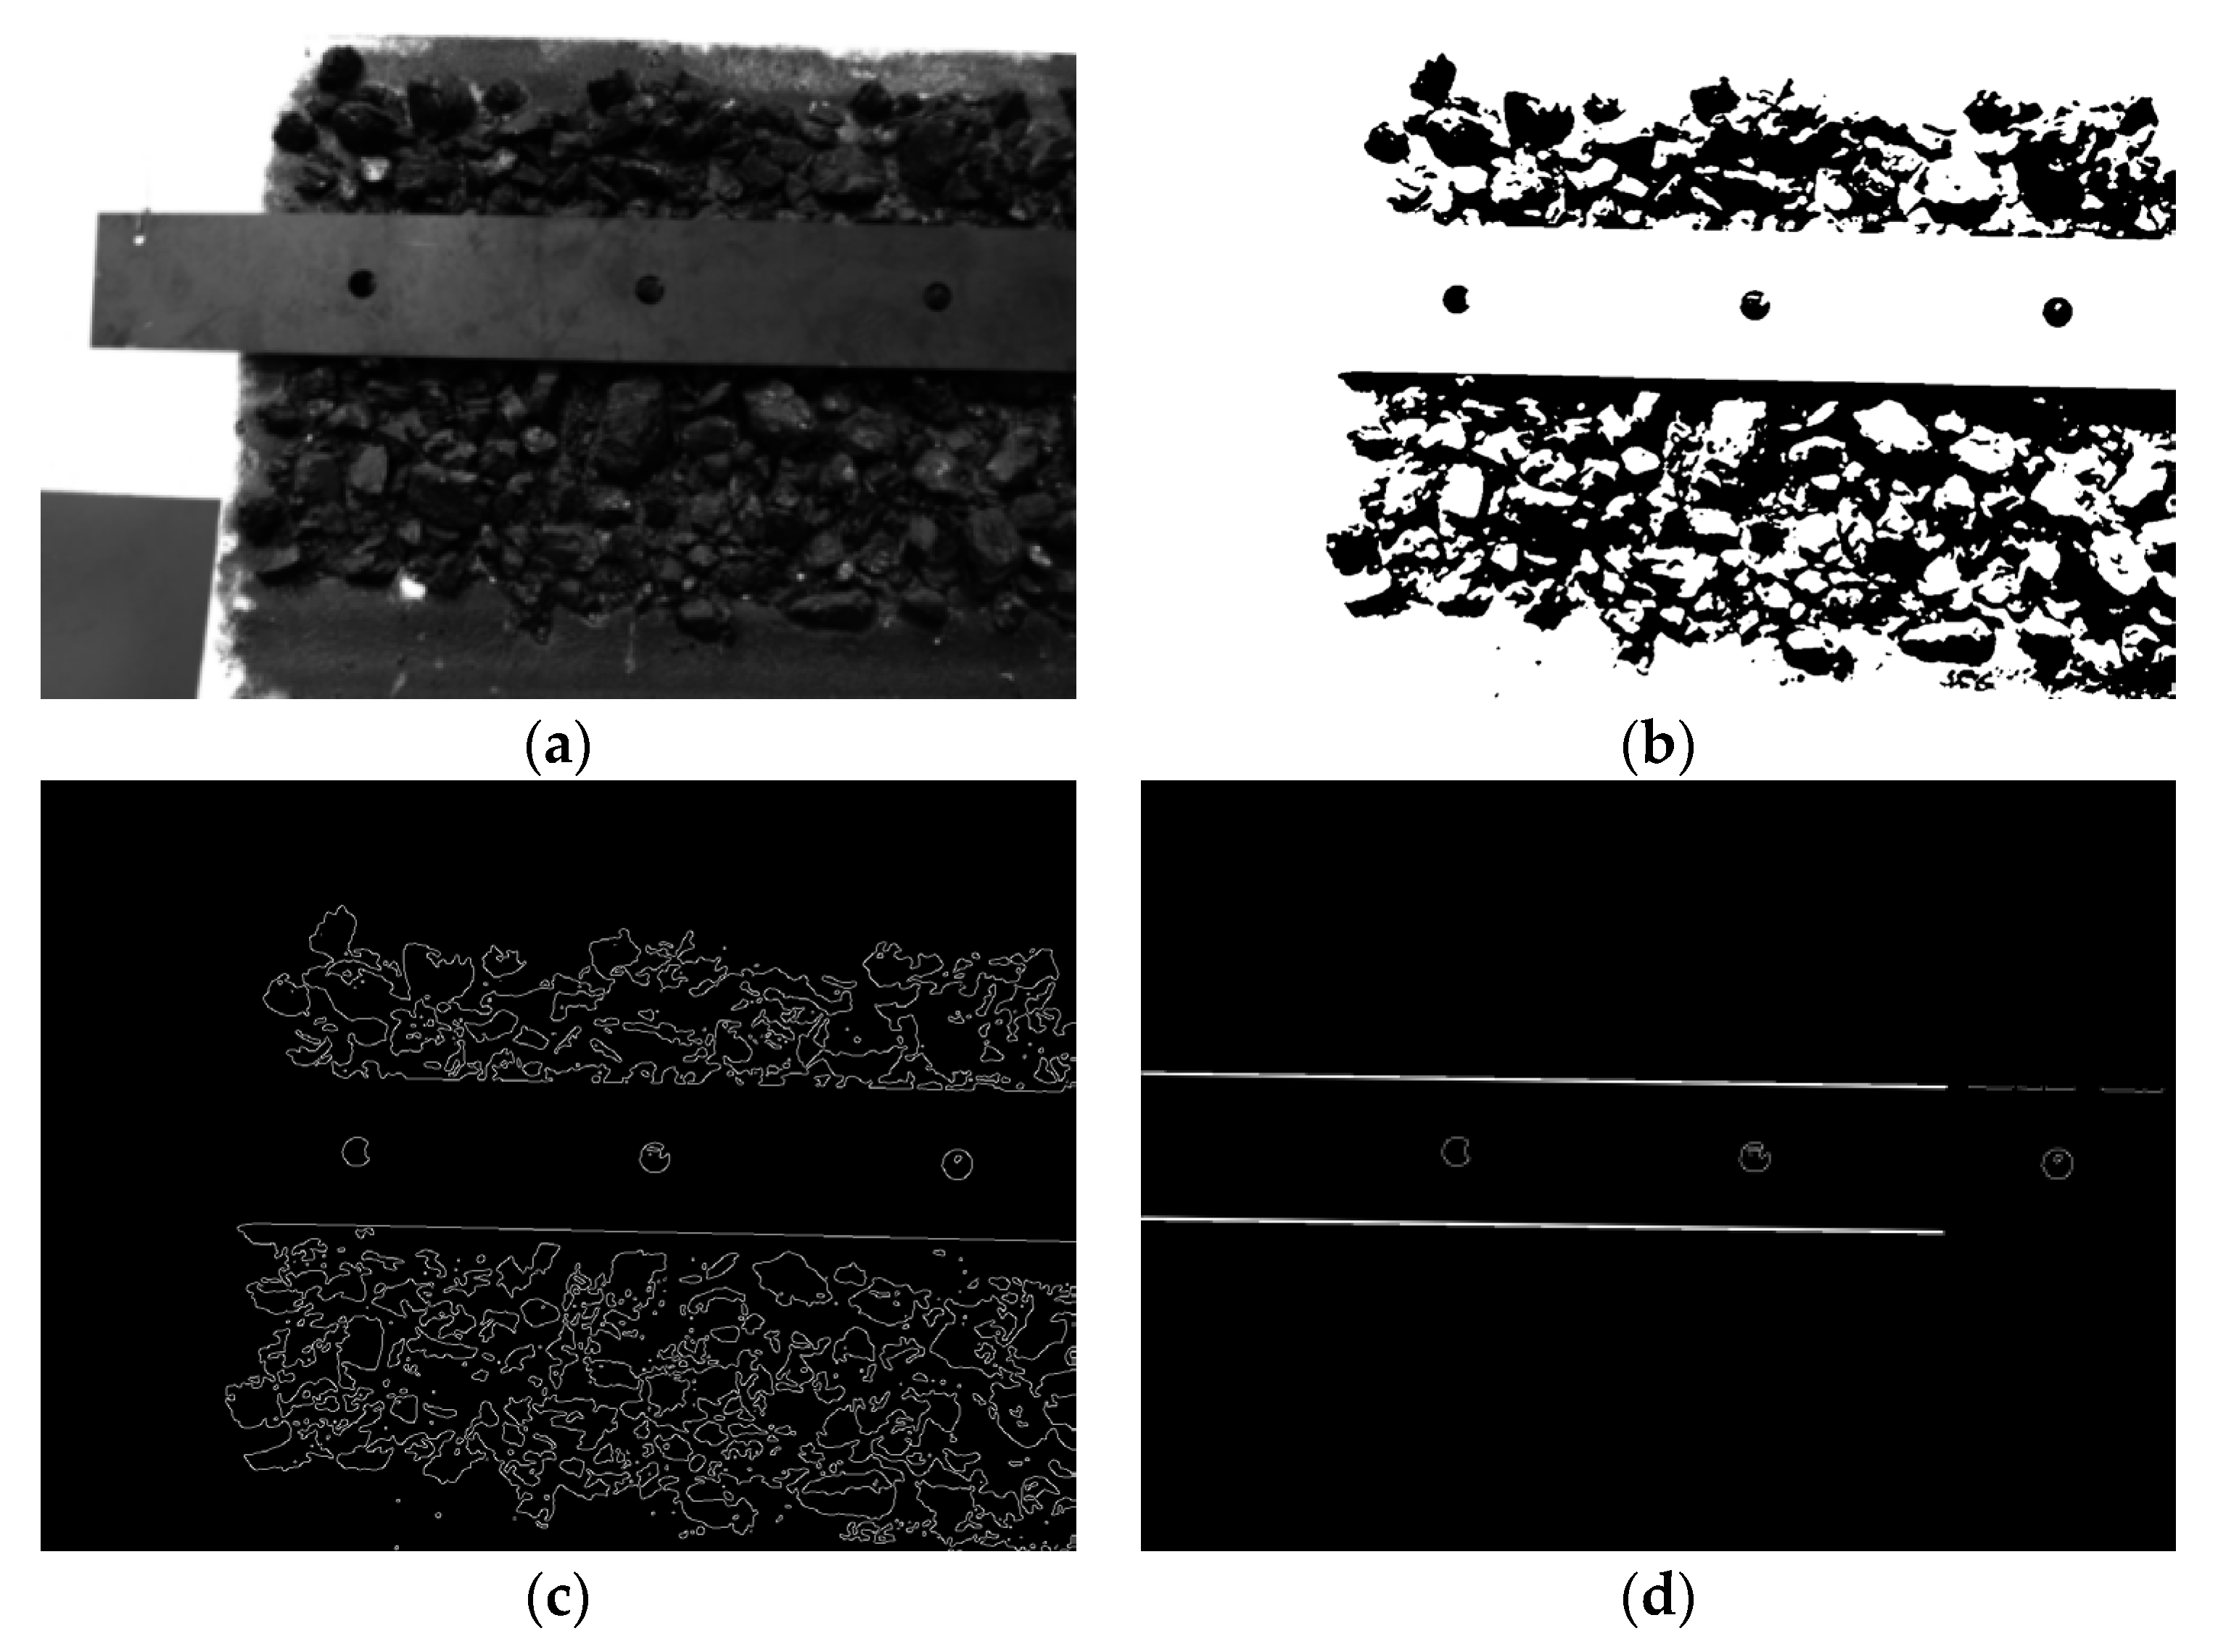
3.1. Detection Method of Anchor Drilling Holes Based on Adaptive Parameter Hough Transformation

Normally, shape-based [30], color-based [31,32], and label-based [33] analyses are used in the visual recognition industry. The colors of coal, rock, and steel strips are generally black or gray. Therefore, it is difficult to distinguish the circle on the steel strips from the background of coal and rock solely based on color. It is therefore inappropriate to utilize a color-based recognition method. In tunnels utilizing different types of steel strips, label-based recognition has some limitations. In contrast to this, the steel strips used for support are generally rectangular with circular or elliptical holes.
Based on Figure 5a, the shape of the steel strip was considered to be a more effective indicator. Thus, a method based on shape analysis was used to identify the steel strips, and then, contour fitting by the Hough transform was used to locate drilling holes in the images.
The upper and lower sides of the steel strip cross the entire image in most cases; therefore, we considered these two straight lines as information and made the steel strip region the ROI. Thus, using the straight line detection method, which consists of three steps, the segmentation of the image can be determined. Computer vision requires the preprocessing of the original images, which includes calibration, stereo rectification, and image binarization based on the Otsu threshold, as shown in Figure 5b. Then, the edge image was extracted using the Canny edge detector, as shown in Figure 5c. As a final step, the least squares method was used to detect straight lines. A straight-line function in Cartesian coordinates can be expressed as follows:
y = k x + b ,
where k is the slope of the straight line, and b is the ordinate at the origin. To solve linear Equation (1), the function must be translated from the Cartesian coordinate system to the polar coordinate system. As a result, Equation (1) can be rewritten as follows:
r = x cos θ + y sin θ ,
where r represents the coordinate origin of the straight line, and θ represents the angle between the vertical line from the coordinate origin of the straight line and the x -axis. We know that a straight line in the Cartesian coordinate system corresponds to a point in parameter space; therefore, this translation transforms the problem of solving the straight-line function into finding the point with the most intersection points with curves in the parameter space. Once the linear equations governing the upper and lower edges of the steel strip are ascertained, employing mathematical calculations facilitates the deduction of four sets of coordinates. These coordinates correspond to the intersections of the aforementioned straight lines with the image boundary. The resultant enclosed geometric configuration constituted by these four coordinate points can be duly recognized as the image’s designated region of interest. Figure 5d illustrates the straight lines and the ROI.
As shown in Figure 5d, there were only a few holes in the ROI of the image because the steel strip was black and had few features. The drilling holes were evenly distributed on the steel strip, with the same radius and a certain distance between them. The diameter of the drilling holes used in this study was 30 mm, and the distance between adjacent drilling holes was 30 cm. Thus, geometric constraints can be used to determine the coordinates of the holes in space. It is possible to detect circles using the Hough transform circle detection method. The circle function is defined as follows:
x = x 0 + r 0 cos α y = y 0 + r 0 sin α
where r0 is the radius of the drilling holes, x0 and y0 are the center coordinates of the drilling hole, x and y are the image coordinates, and α represents the angle, whose value ranged from 0° to 360°.
Circle detection using the Hough transform is often implemented in OpenCV by calling the Hough circle function, which requires the setting of several parameters, including the minimum and maximum radii of the circle. Properly selecting these two parameters can significantly reduce the detection of invalid circles and improve the accuracy of circle detection.
To improve the precision of circle detection, it is necessary to determine an optimal range for the radii of circles. However, since the radii of the drilling holes in the images vary with the distance between the camera and the steel strip on the roadway, it is challenging to identify a fixed range of values that can adapt to different distances. To address this issue, we propose an adaptive method for adjusting the parameters in the Hough circle function during the detection process. This method involves three steps and can effectively screen and remove invalid circles, thus improving the speed and accuracy of detection.

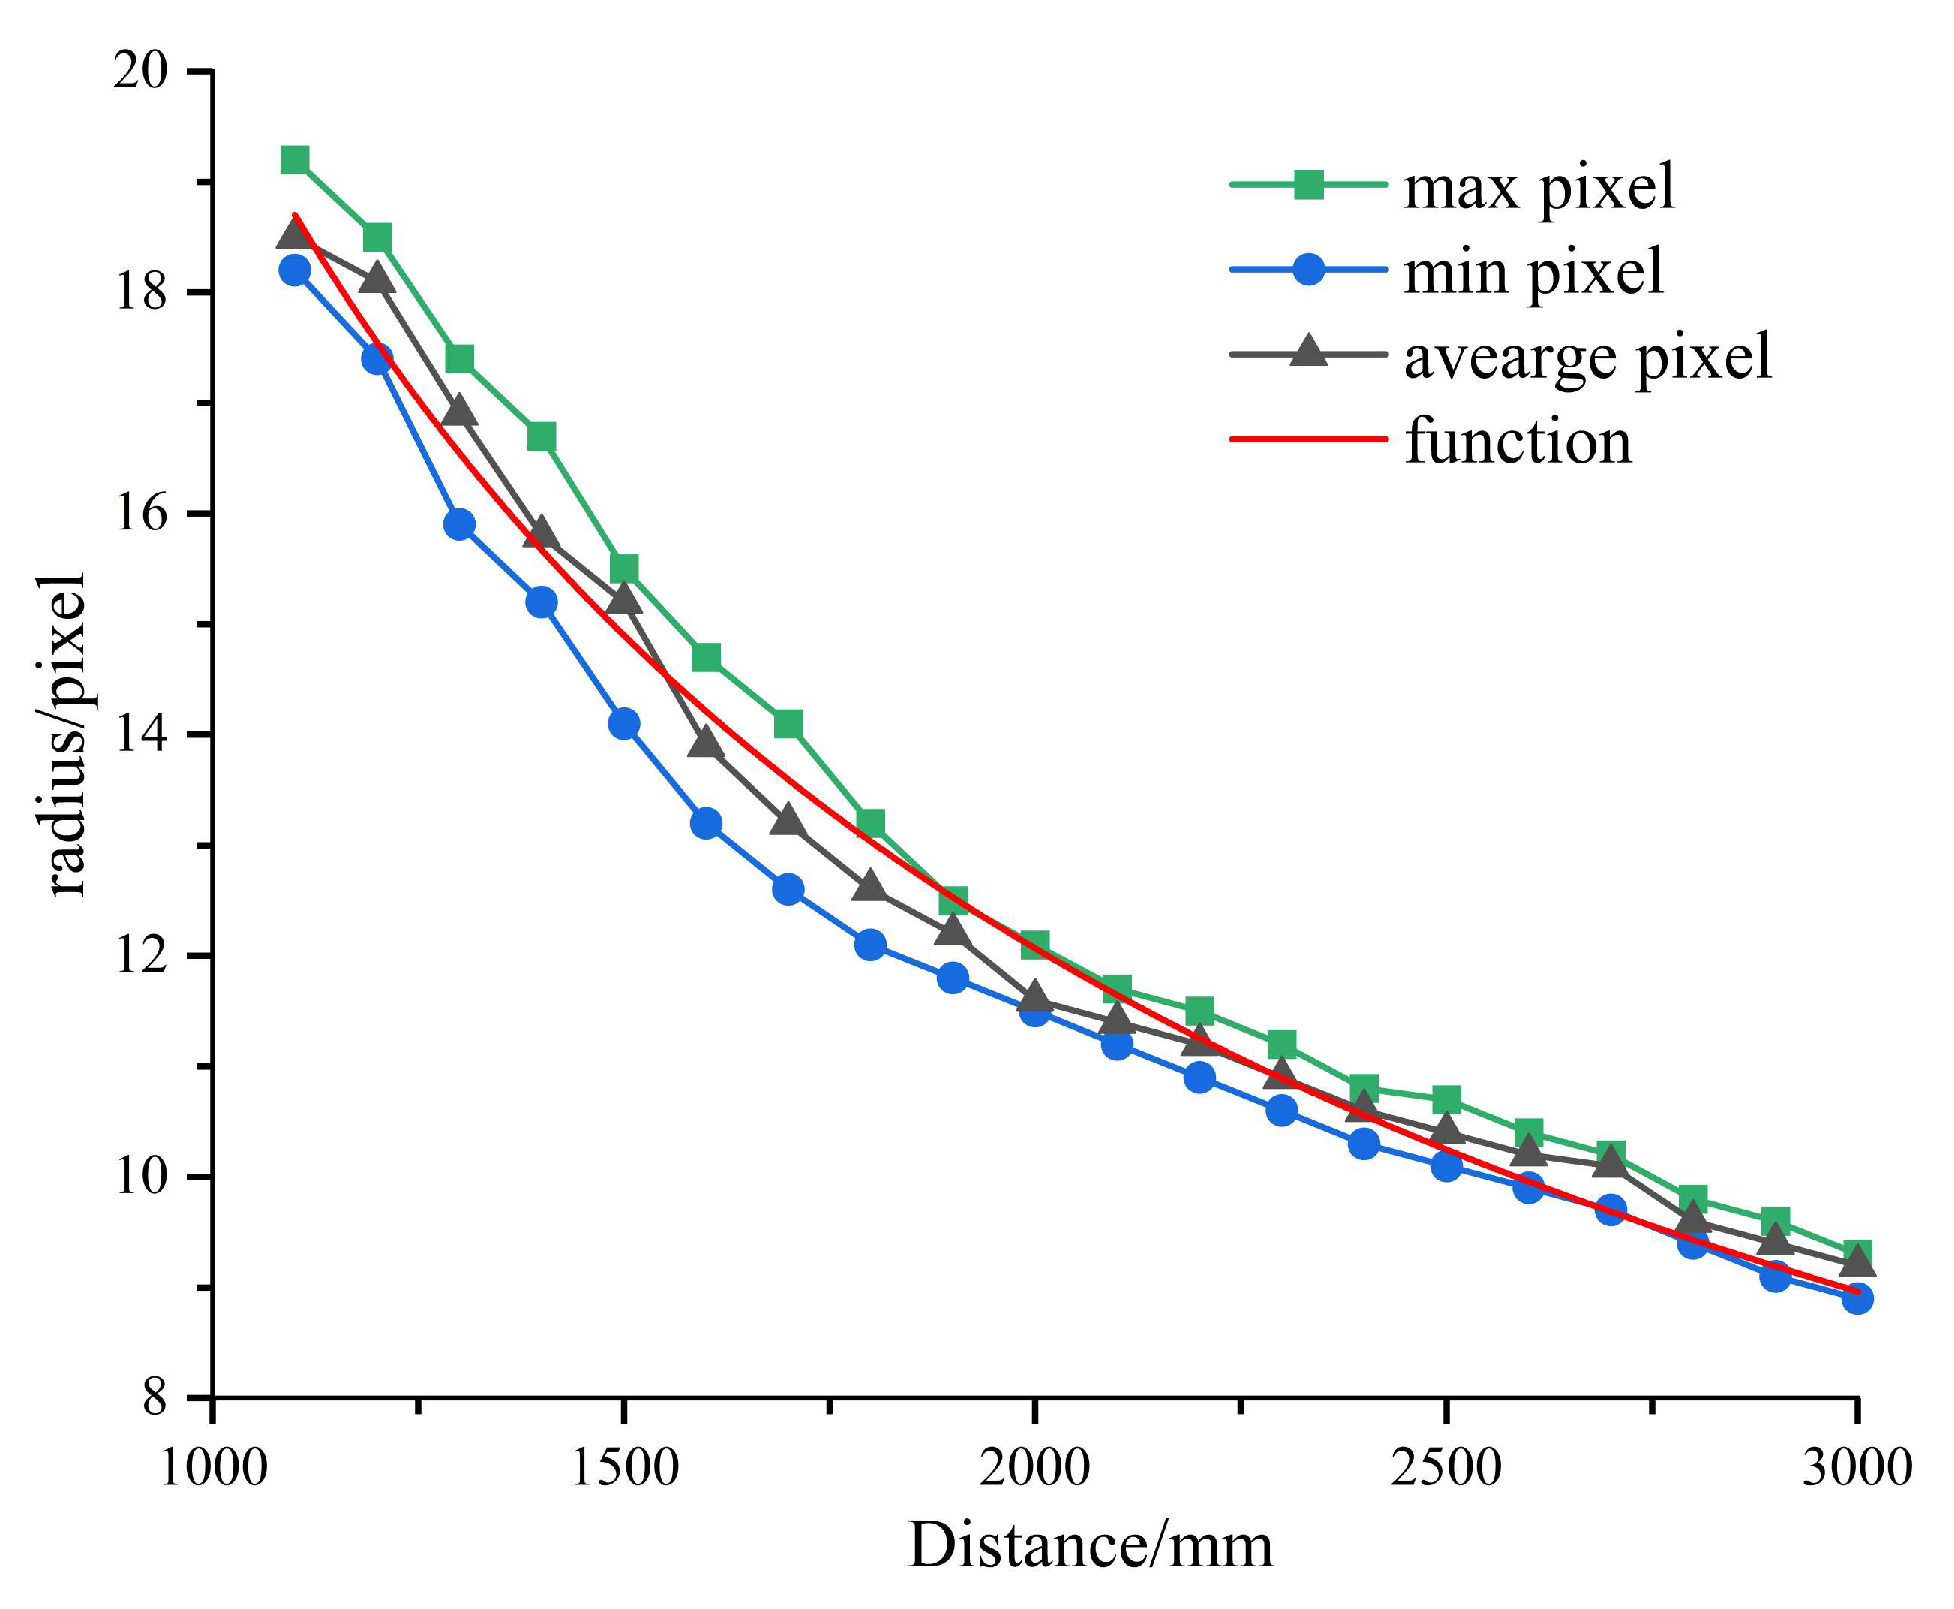
3.1.1. Constructing the Prediction Model

For a given camera, the size of the circular hole in an image is linked to the distance between the camera and the object being photographed, with the hole size decreasing as the distance increases. To account for the impact of ineffective drilling images on the detection accuracy, it is important to create a predictive model that correlates the distance represented in the images with the radius of the circular hole.
In the binocular vision positioning system described in this paper, the camera’s working distance was mainly concentrated in the range of 1000–3000 mm. Therefore, the prediction model developed in this study was suitable for the radius range of the circular holes in the image within this distance range.
To develop a prediction model, an image acquisition system was constructed, consisting of an industrial camera fixed on a sliding shaft. The optical center of the camera was positioned vertical to the steel strip being inspected. Ten steel strip images were collected at intervals of 100 mm within the range of 1000–3000 mm, and the data were recorded. At each acquisition point, 40 anchor borehole images were obtained. The radius of each anchor hole in the image was measured and averaged using digital image processing methods.
A power function was fitted using the least squares method to obtain the functional relationship between the acquisition distance and the radius of the anchor borehole in the image. This prediction model could effectively screen and remove invalid circles and improve the accuracy and efficiency of the detection process.
The test results are presented in Figure 6, where the X-axis denotes the measured distance, and the Y-axis represents the average radius of the anchor drilling holes in the image. The green, blue, and black dashed lines represent the maximum, minimum, and average values, respectively, of the pixel radius of the anchor borehole under different acquisition distances By least-square fittings, the functional relationship was obtained, which is shown by the red curve in Figure 6. The fitted function can be expressed as follows:
r = 3164.81 * d 0.73 ,
where r and d denote the radius of the anchor drilling holes in the image and the measured distance, respectively. Using this functional relationship, we can determine the radius of the anchor hole in the corresponding image based on a certain measuring distance. It should be noted that the aforementioned relationship can only be used to fit a circle with a specific radius and is not applicable for fitting circles corresponding to a range of radius values. In the process of using Hough detection to fit a circle, we need to use the minimum and maximum radii of the circle as geometric constraints to filter out invalid round holes. Thus, we need to find the relationship between the maximum and minimum radii and the fitted radius based on this functional relationship. Therefore, we can use the measured data to estimate the ratios of the maximum and the minimum radii to the average radius at a specific distance. The formulas for the maximum and minimum radii, respectively, are as follows:
r a t e max = r i max / r i a v e 20 r a t e min = r i min / r i a v e 20 ,
where r a t e max and r a t e min indicate the ratio of the maximum and minimum radii to the calculated radius above, respectively, i represent the ith distance, and r i max , r i min , and r i a v e represent the maximum, minimum, and average radii, respectively, of the corresponding circular hole when measuring the distance. The experimental results showed that in the range of 1000–3000 mm, the values of r a t e max and r a t e min were 103.8% and 96.5%, respectively.
By constructing the prediction model of the circular hole radius on the image, the corresponding circular hole radius d could be determined at any measurement distance, and the maximum and minimum radii of the Hough detection circle were set as d * r a t e max and d * r a t e min , respectively. With this geometric constraint, invalid circles can be effectively screened out, and the detection efficiency and speed can be improved.

3.1.2. Calculating the Distance

The acquisition distance refers to the spatial distance between the camera position and the roof steel strip when the image is acquired. Accurate distance measurement can ensure that the radius interval of the circular hole in the calculated image is reasonable, and then the outline of the anchor hole in the image can be effectively detected.
Based on the structure of the above-mentioned drilling and anchoring robot, the joint variables were accurately measured in real time by using displacement sensors and angle sensors arranged on each joint of the manipulator, and the Denavit–Hartenberg parameter table was constructed based on the robotics and structural parameters of the drilling and anchoring robot. Through the conversion relationship of each coordinate system, the conversion relationship between the camera coordinate system and the fuselage coordinate system can be obtained. The 3D coordinates of the camera coordinate system in the world coordinate system can be obtained in real time by the method of fuselage positioning.
A camera coordinate system, a base coordinate system, and a world coordinate system were constructed, wherein the spatial coordinate of a point A on the camera plane in the camera coordinate system was A C = x 1 , y 1 , z 1 , and it was converted into the spatial coordinates in the world coordinate system A W = x 2 , y 2 , z 2 . The transformation relation is as follows:
A W = T B W T C B A C = T B W T C B x 1 y 1 z 1 1 = x 2 y 2 z 2 1 ,
where T C B represents the conversion relationship between the camera coordinate system and the fuselage coordinate system, and T B W represents the conversion relationship between the fuselage coordinate system and the world coordinate system. Both T C B and T B W can be determined based on the robot kinematics.
The size of coal mine roadway is certain, and the coordinates of point B on the steel strip in the world coordinate system are B W = x 3 , y 3 , z 3 , where x 3 and y 3 are unknown. The acquisition distance can be approximately represented by the distance between point A on the camera and point B on the steel strip:
d 1 = x 2 x 3 2 + y 2 y 3 2 + z 2 z 3 2 ,
To ensure that the steel strip is within the field of view of the camera, the two points A and B change little on the X-axes and Y-axes. The experimental results showed that the measuring distance is mainly determined by the difference in the Z-axis. To mitigate the impact arising from disparities between the X-axis and Y-axis, an attenuation factor denoted as α was introduced. The experimental outcomes substantiate the adoption of a value of 1.1 for α. Therefore, the acquisition distance was set as:
d = d 1 = 1.1 z 2 z 3 .
Consequently, the method described above was employed to compute the acquisition distance, which in turn enabled the determination of the maximum and minimum radii.

3.1.3. Additional Geometric Constraints

The geometric constraints mentioned above allowed us to finish the contour fitting of the drilling hole, reducing the number of non-target contours. In spite of this, some redundant circles can be detected due to the wide range of geometric constraints. To eliminate these redundant circles, two rules were developed.
In the experiment of establishing the predictive model correlating shooting distance with anchor hole radius, as discussed in Section 3.1.1, certain notable observations come to the forefront. At a shooting distance of 1400 mm, the image exhibits the most substantial disparity between the maximum and minimum anchor hole radii, with a maximum radius of 16.7 mm, a minimum radius of 14.9 mm, and an average radius of 15.8 mm. The deviation between the maximum and minimum radii stands at approximately 12.5%. Conversely, when the acquisition distance extends to 2000 mm, the image displays the narrowest gap between the maximum and minimum radii, with a maximum radius of 11.9 mm, a minimum radius of 11.5 mm, and an average radius of 11.6 mm. Here, the discrepancy between the maximum and minimum radii is around 3.4%. Within the range of 1000–3000 mm, the average error concerning the maximum and minimum anchor hole radii remains at approximately 9.6%. Given a certain amount of redundancy, the error between the maximum radius and the minimum radius of the anchor hole on the same image is less than 15% within the acquisition distance.
In the practical execution of the process, the gravitational forces acting on the steel strip induce deformations, leading to fluctuations in the center-to-center distance between adjacent anchor holes. Presuming an initial center-to-center distance of 300 mm between two consecutive anchor holes on the steel strip, empirical observations demonstrate that within the range of shooting distances spanning 1000–3000 mm, the center-to-center distance varies between 296.5 mm and 305.6 mm. For instance, when the shooting distance stands at 1600 mm, the maximum center-to-center distance between adjacent anchor hole centers reaches 305.6 mm, resulting in a corresponding distance error of 5.6 mm, representing the largest discrepancy. Conversely, at a shooting distance of 1800 mm, the center-to-center distance between adjacent anchor holes aligns precisely with the nominal value of 300 mm. During this condition, the center-to-center distance error between adjacent anchor holes is minimized to zero. In the same way, a certain amount of redundancy needs to be given, so the distance error between the centers of adjacent anchor holes is set to 10 mm. The following expressions can be used to describe the two rules:
r i m a x r i m i n r i m i n 0.15 x i x i + 1 2 + y i y i + 1 2 300 10 ,
where x i and y i represent the coordinates of the ith circle in the image.
Based on the method above, the radius parameters can be obtained through the prediction model of the bolt drilling radius on the image and adjusted adaptively. The Hough detection method with adaptive parameter adjustment is used to fit the outline of the anchor hole on the image, and the center coordinates and radius information of the anchor hole are obtained.

3.2. Matching Method for Segmented Drilling Holes

Image segmentation and stereo matching [34,35] are two important components of binocular vision. In stereo matching, pixels representing the same spatial point are matched between left and right images, primarily by searching for the corresponding point. Binocular rectification optimizes the two-dimensional search into a one-dimensional search, that is, the search is conducted only horizontally, which reduces the difficulty of stereo matching. Although there are many stereo matching methods, the research object for this project is in an environment with limited texture information; therefore, stereo matching is a challenge.
In the above-mentioned image segmentation process, the Hough line detection method can be used to determine the linear equation of the upper and lower lines of the steel strip. Because the anchor holes are evenly distributed on the steel strip and are on the same horizontal line, the slope of the central connecting line of the anchor holes on the same steel strip is equal to the upper and lower sides of the steel strip.
When the slope of the straight line is zero, theoretically, the anchor boreholes in the left and right images are all on the same straight line, and the pixel coordinates of each anchor borehole are consistent in the vertical direction but different in the horizontal direction. This situation increases the difficulty of matching and cannot guarantee the accuracy of the matching results. This paper proposes a method of stereo matching using coordinate matching based on the fact that the coordinates of the different centers of the drilling holes within the same image are consistent both vertically and horizontally when the slope is not zero.
The segmentation described in the previous section allows us to determine the pixel coordinates of the center of the drilling holes. Because the contour on the image is directional, the coordinates of the center of the circle can be arranged from small to large in the horizontal direction; O l 1 u l 1 , v l 1 , O l 2 u l 2 , v l 2 , O l 3 u l 3 , v l 3 , …, O l m u l m , v l n are the centers of the anchor drilling holes in the image taken by the left camera, and O r 1 u r 1 , v r 1 , O r 2 u r 2 , v r 2 , O r 3 u r 3 , v r 3 , …, O r n u r n , v r n are the centers of the anchor drilling holes in the image taken by the right camera, which are arranged according to increasing horizontal pixel coordinate values. Theoretically, the pixel coordinate values of the same point in the vertical direction of the left and right images are the same, and different anchor drilling centers can be stereo matched using this property. Since the noise causes some error in the rectified images, there will be some errors in the rectified images. Several experiments have shown that the vertical coordinate error of the same point on the left and right images is less than 8 pixels; therefore, we set the threshold value to 10, and any point on the left and right images that is less than 10 pixels in the vertical dimension is considered to be the same. Through this method, 3D matching of the drilling center can be completed quickly, and the spatial coordinates of the drilling center can be determined.
The accuracy of stereo matching of the drilling center can be verified based on the contour directionality. If the i t h point on the left and the j t h point on the right are a set of matching points, then i ± p and j ± p on the image are a set of matching points. Moreover, the distance between two adjacent matching points is basically the same, fluctuating in a small scope:
O l i O l i + 1 = O r j O r j + 1 ,

3.3. Calculating the Center Coordinates of Anchor Drilling Holes

An ideal model of the binocular vision system is shown in Figure 7, where X W , Y W , and Z W are the world coordinates, X C , Y C , and Z C are the camera coordinates, and u , and v are the pixel plane coordinates; O l and O r are the optical centers of the two cameras, B is the distance between the two cameras, and f is the focal length; C l and C r are the left and right image planes, respectively, which are perpendicular to Z C (optical axis of the cameras). A parallel optical system between the two cameras would be the ideal model, but in reality, most models do not follow this principle. Therefore, stereo rectification is an essential step before determining the location of a space point. The point A X , Y , Z is a point in the world coordinate system, and its response points in the image plane are a 1 u 1 , v 1 and a 2 u 2 , v 2 . Because the triangles are similar [36,37], we can formulate the conversion formula between the world coordinate system and the image coordinate system as follows:
X = u 1 u 1 u 2 * B Y = v 1 u 1 u 2 * B Z = f u 1 u 2 * B ,
This formula can be used to calculate a point’s coordinates; f is one of the intrinsic parameters, and it was obtained by camera calibration. The quantity u 1 u 2 is defined as the disparity.
By recognizing and matching circles, we can determine the pixel coordinates in the image of a drilling hole, including the coordinates in the left and right images. The spatial coordinates of a point were calculated using Equation (1) based on the calibration result as well as the segmentation and stereo matching results. Due to the coordinate conversion relationship, the spatial coordinates of the anchor hole are transformed into the coordinate system of the anchor drilling robot body, thereby facilitating the precise and expeditious movement of the drilling rig towards the anchor hole.

4. Experiment and Results

To validate the method proposed in this paper, two experiments were conducted. As a first step, drilling holes were identified in the images captured by the stereo vision system from different distances. An experiment was conducted using the identification and stereo matching method to locate drilling holes in the world coordinates.

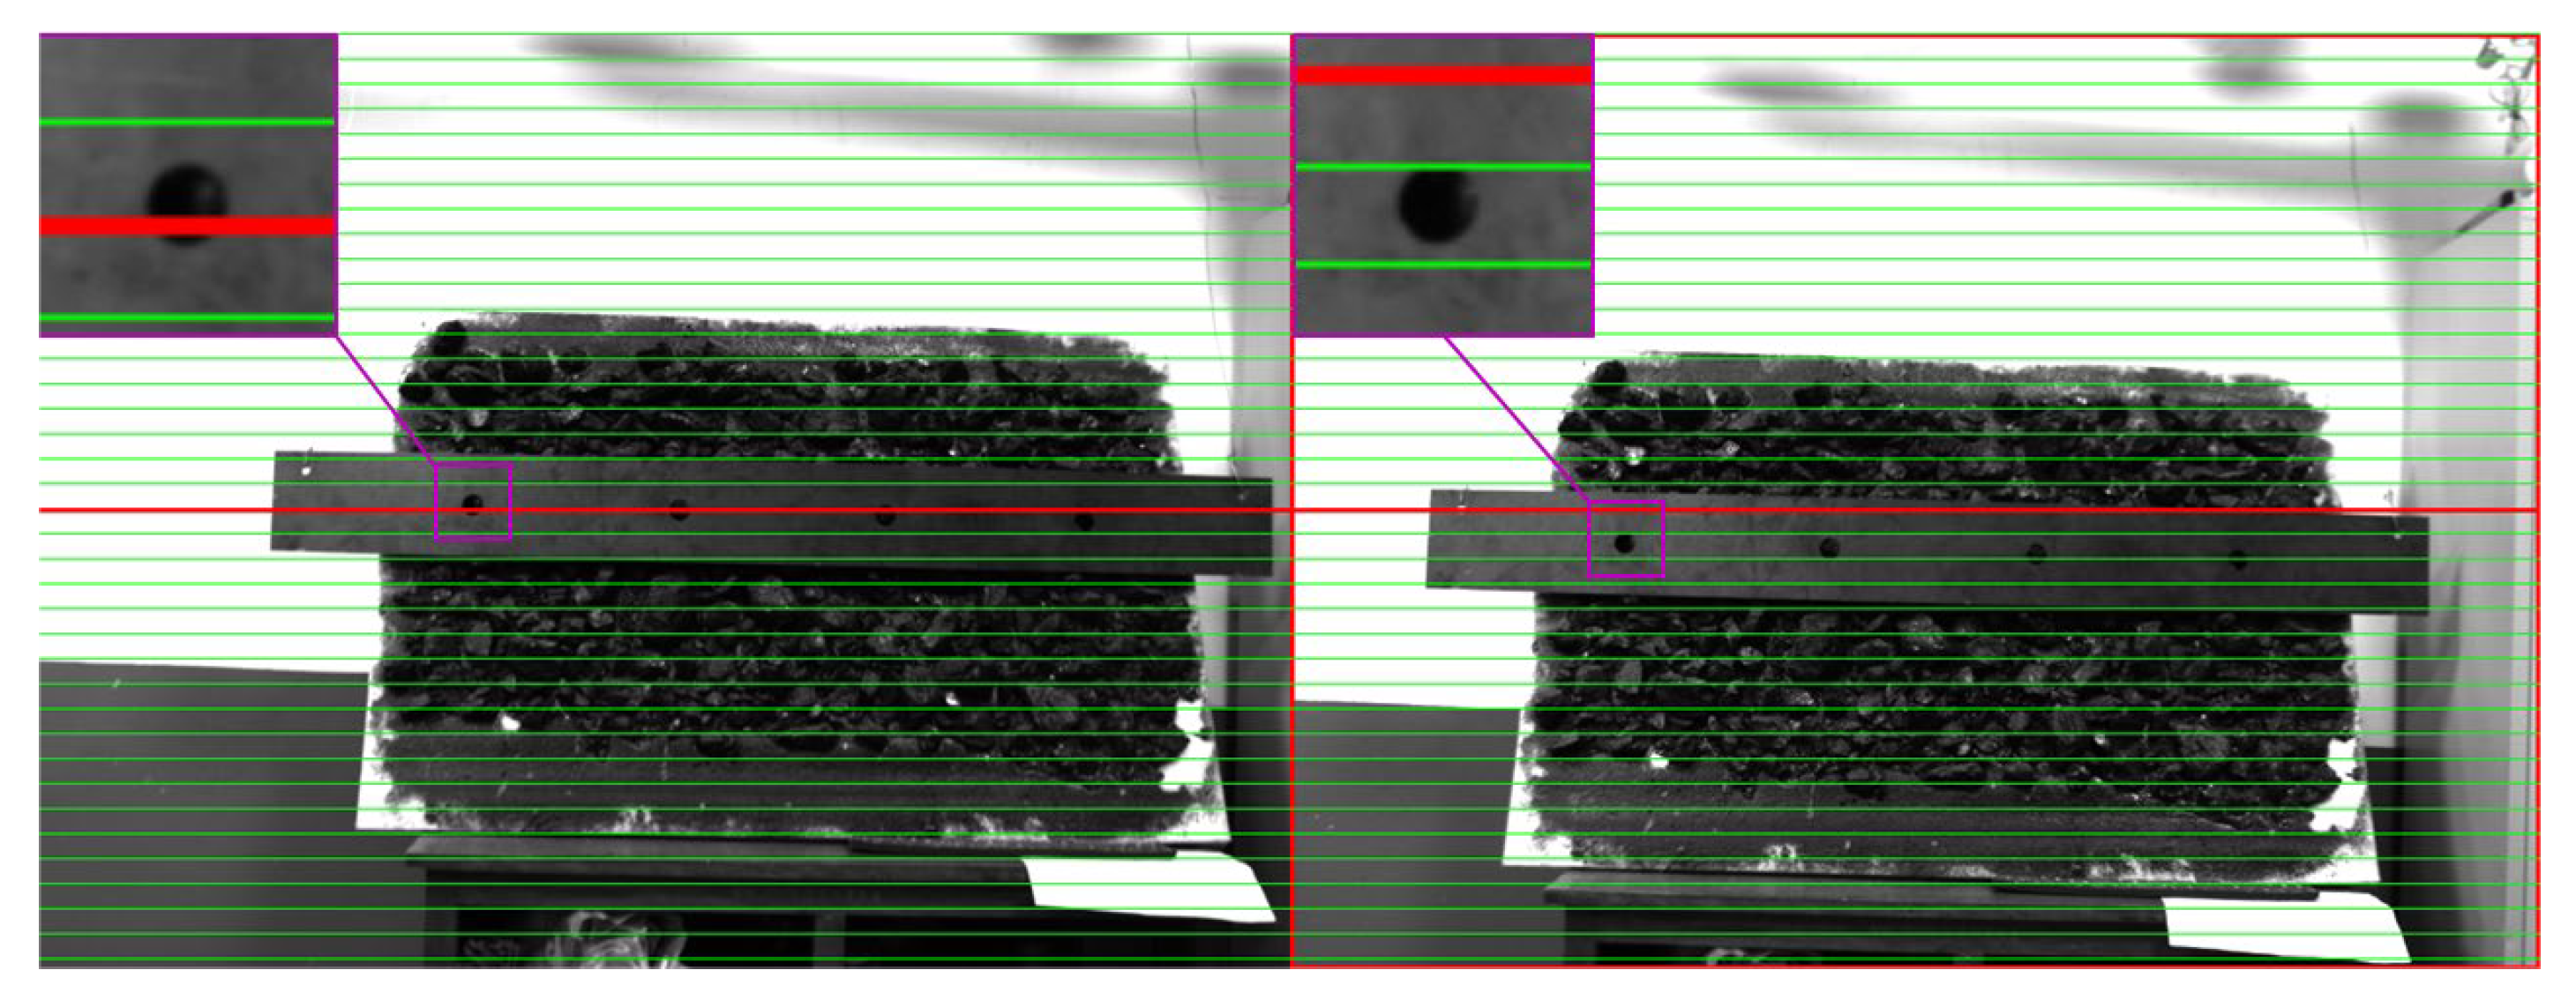
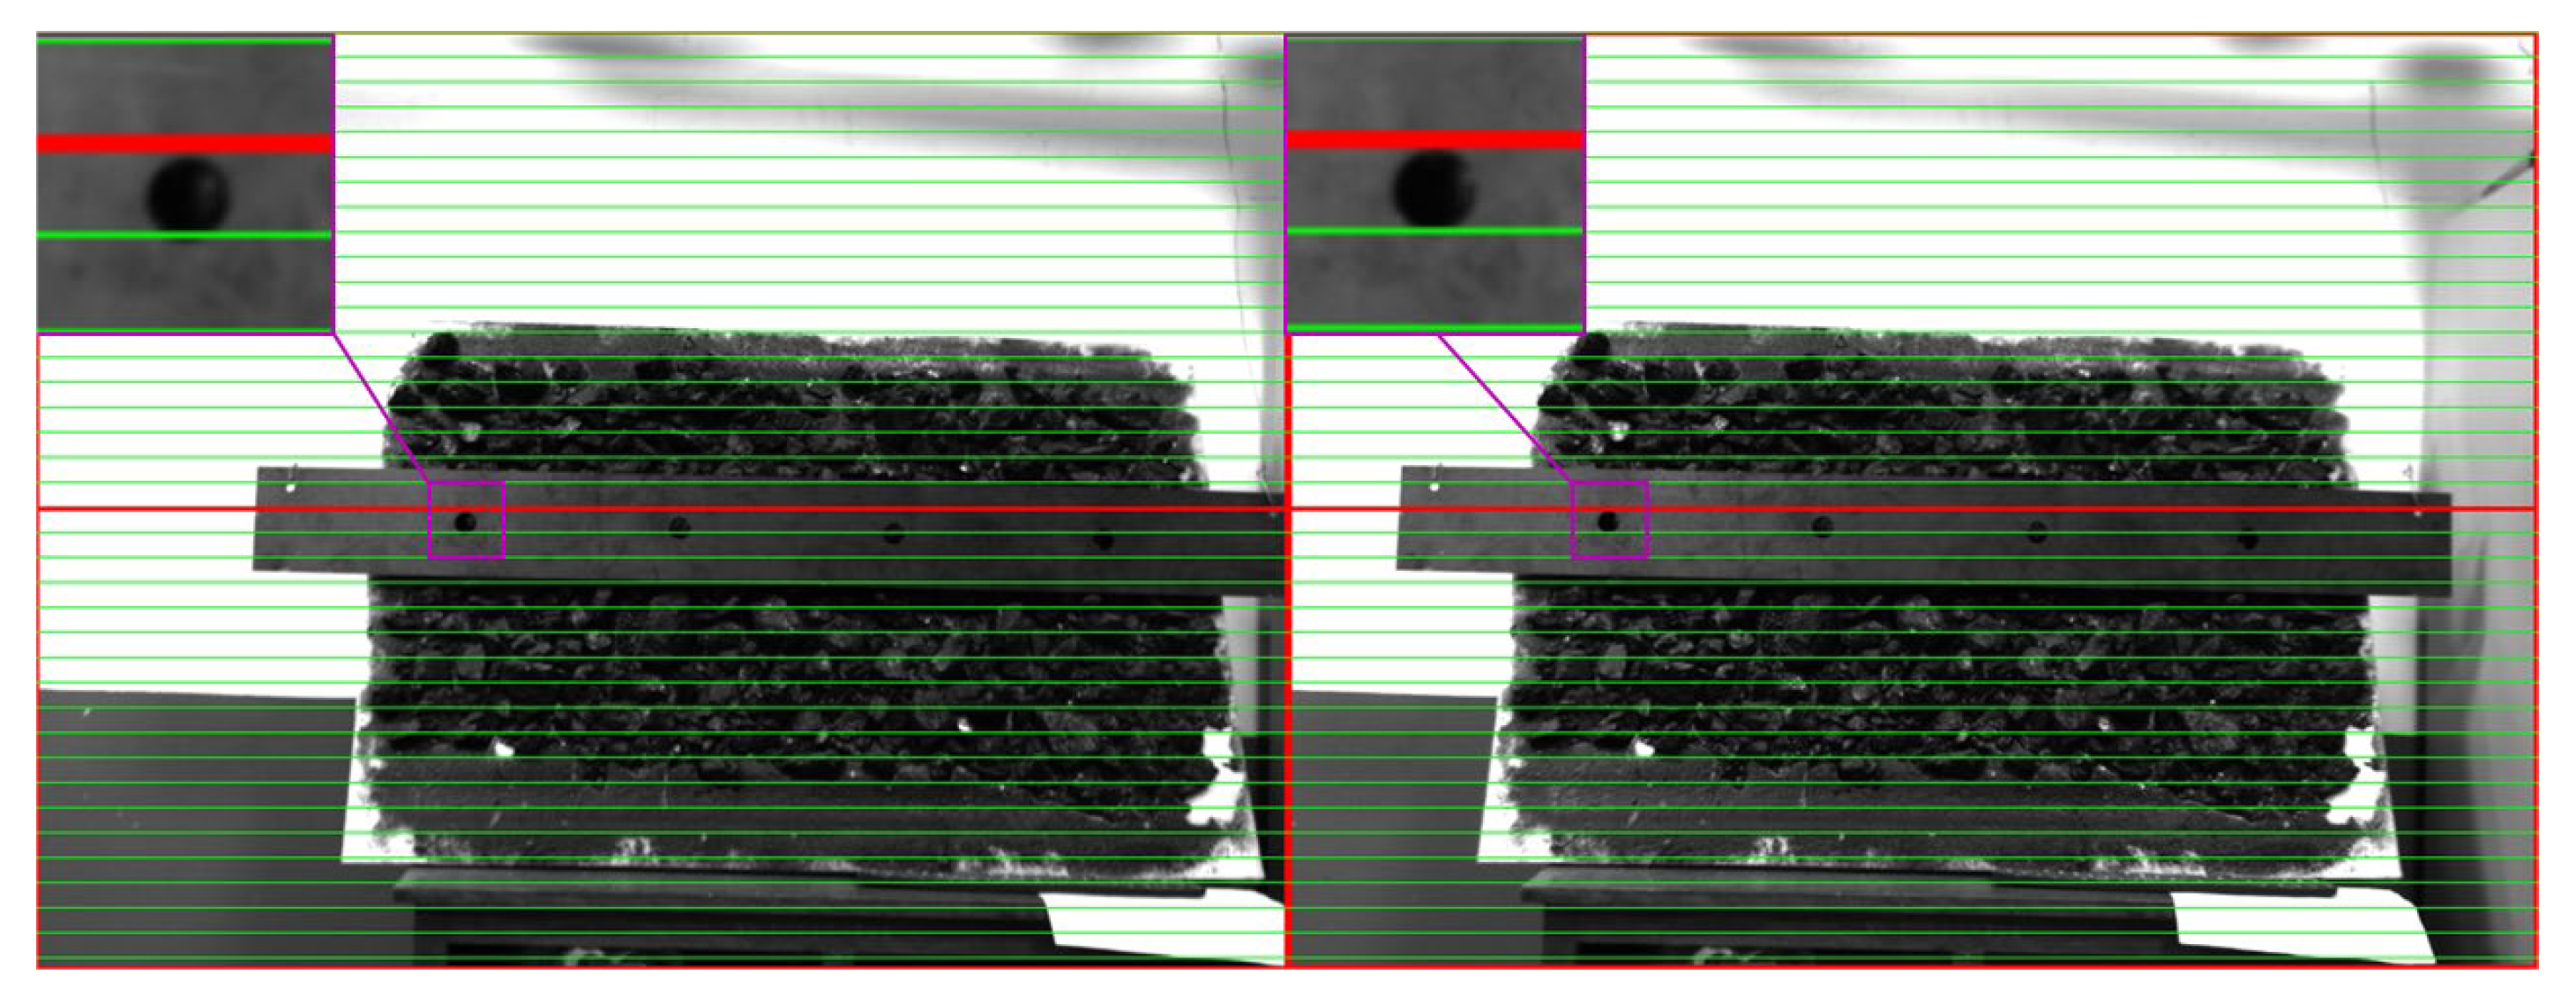
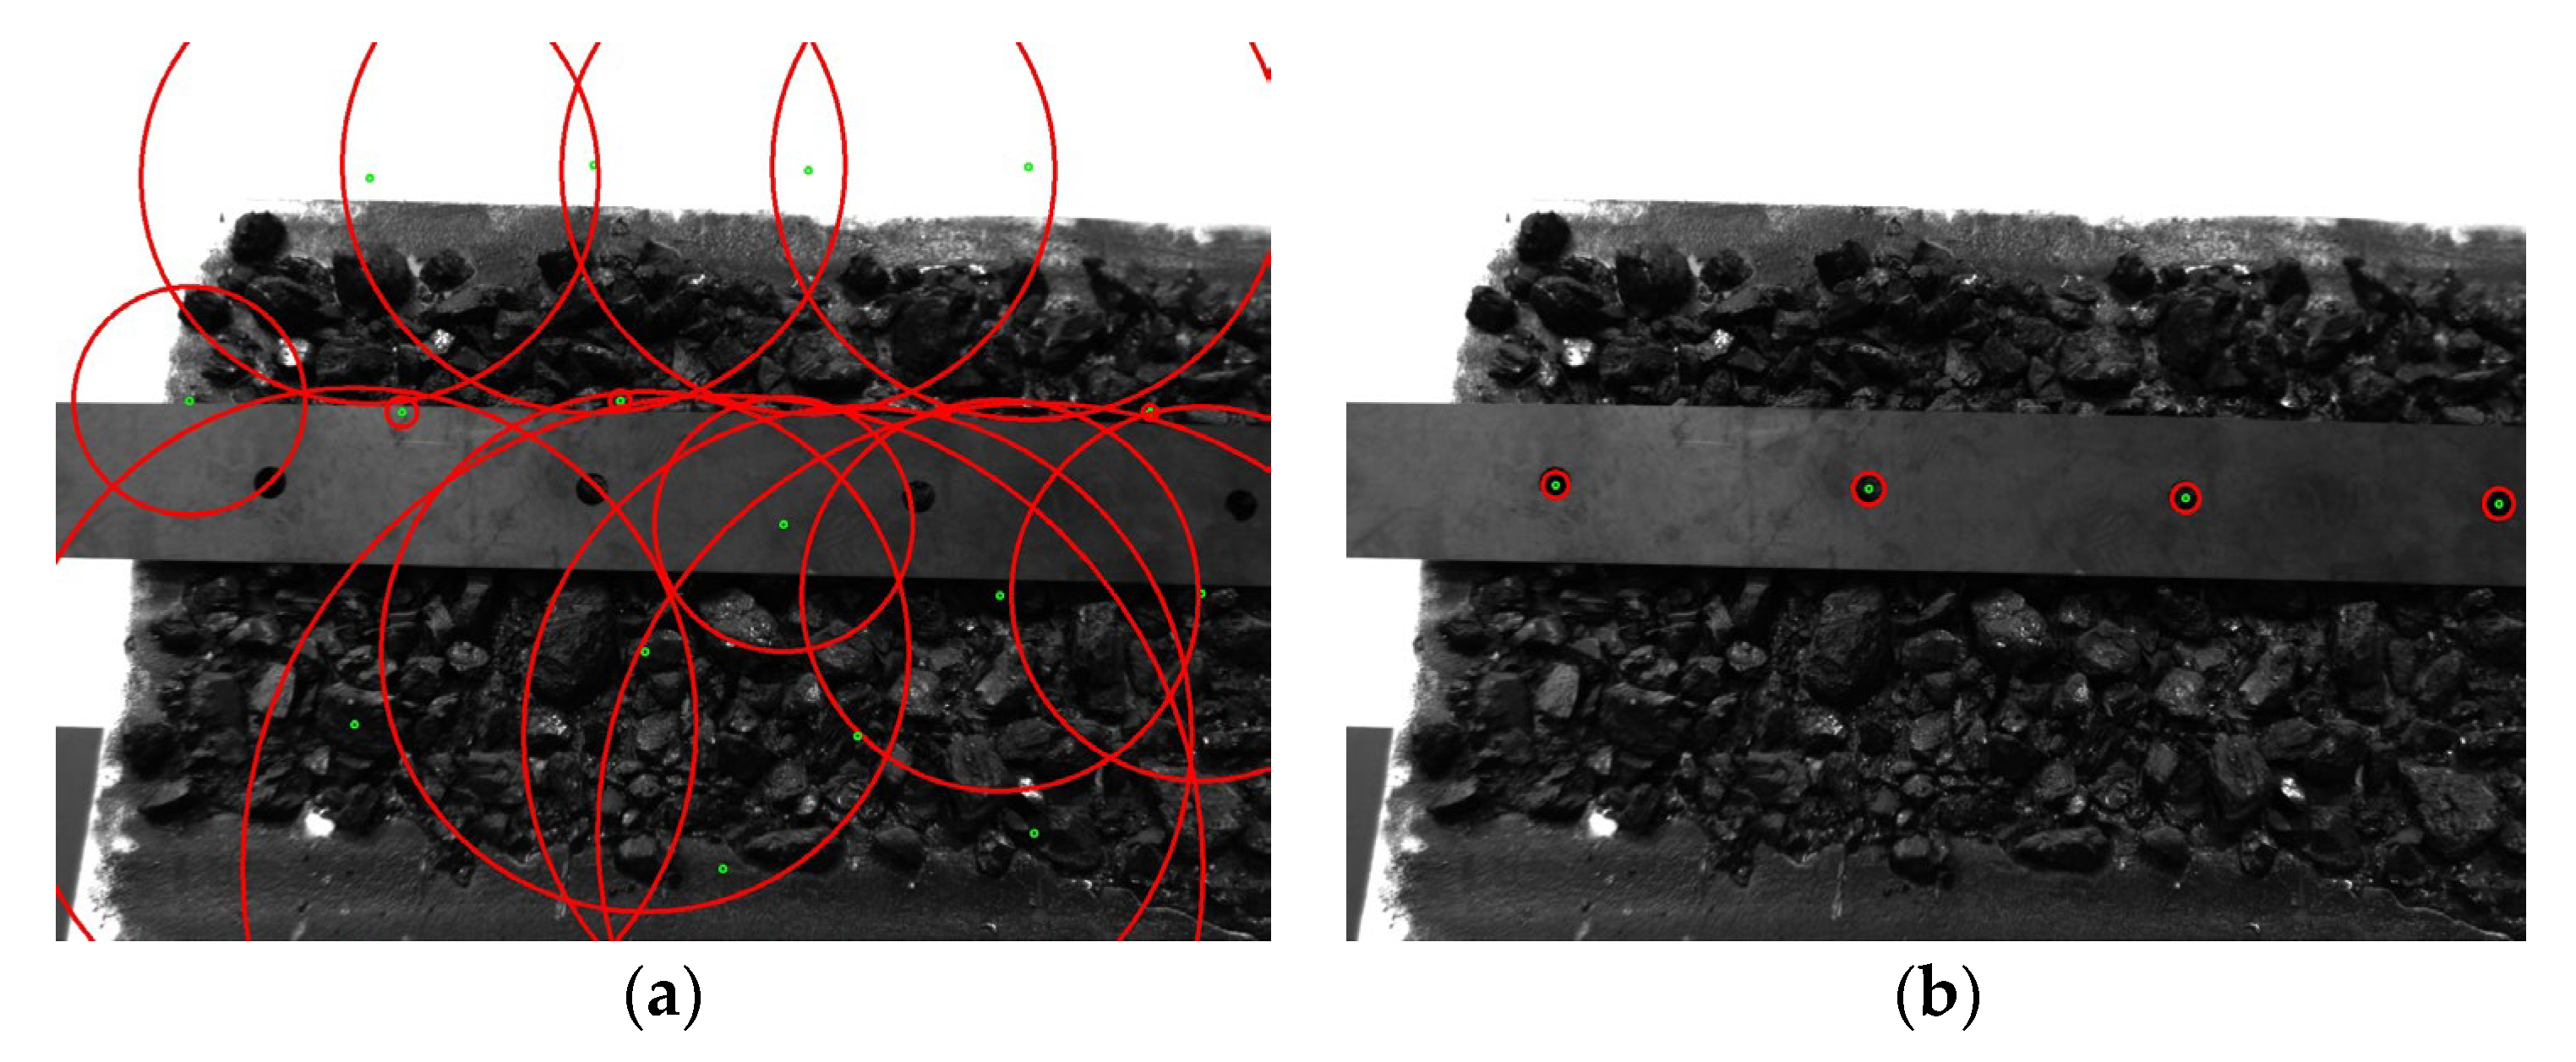
4.1. Identifying Anchor Drilling Holes at Different Distances

An experiment was conducted in the laboratory to simulate the actual working conditions in order to verify the accuracy rate of the identification method. To identify the drilling holes, a simulation experiment was conducted, as shown in Figure 8. In the experiment, there were blackboards containing coal blocks replicating coal walls on coal mine roadways and steel strips containing four drilling holes placed on the blackboards. On a high-precision mobile platform, the stereo vision system could be translated to adjust the distance between it and the blackboard. The binocular vision system captured three groups of images at each position at intervals of 100 mm within the range of 1100–2000 mm. As all four drilling holes cannot be captured in every image, there are actually fewer than 240 drilling holes.
Based on the method proposed above, the identified results are presented in Figure 9. Figure 9a,b show the contour fitting results of the drilling holes based on Hough circle detection and the method proposed in this paper, respectively. The red circles represent the contours of the detected drilling holes, and the green circles represent the centers of the corresponding drilling holes. As can be seen from Figure 9a, the contours of the drilling holes detected by traditional methods using initial parameters were numerous and disordered, had different radii, and mostly did not meet the actual requirements.
Identifying anchor drilling holes in steel strips by using the adaptive parameter Hough transformation described in this paper mainly includes the following steps: first is preprocessing the images, including image binarization, image enhancement, and stereo correction. The Canny edge detection method is then used to process the images, and the steel strip is divided into the region of interest (ROI) with the upper and lower edge lines as the characteristics. On this basis, the acquisition distance is estimated by the transformation relationship between the structural parameters and coordinate axes of the anchor drilling robot. Using the functional relationship between the acquisition distance and the radius of the anchor drilling holes in the image, the radius at any distance is determined. Finally, based on the geometric constraints of the maximum radius and the minimum radius, Hough transform with adaptive adjustment of radius parameters is used to detect the anchor drilling holes on the steel strip, and the detection results are shown in Figure 9b. The contours of the drilling holes detected in Figure 9b are completely consistent with the actual holes, with a high degree of overlap, and there are no problems such as false detection, missed detection, and multiple detection. The experimental results showed that the detection method of anchor drilling holes based on the adaptive parameter Hough transform proposed is more accurate and can effectively eliminate invalid results.
In each image, only three drilling holes can be seen on the steel strip when the distance is 1100 mm. The right camera’s images contained four drilling holes at distances between 1200 and 1500 mm, while the left camera’s images contained three drilling holes. Whenever the distance exceeded 1600 mm, each image contained four anchor holes. The identification results of the drilling holes obtained by the different methods are shown in Table 1. The total number of drilling holes when the distance was from 1100 to 2000 mm was between 18 and 24. The numbers of identified drilling holes based on the traditional Hough circle detection were different from each other; the smallest number was 31 and the largest number was 121. However, the results of the adaptive parameter Hough transformation ranged from 18 to 24. When the distance was below 1800 mm, the identification rate was 100%. The identification rate dropped to 87.5% when the distance exceeded 1800 mm. The average identification rate reached about 91.5%.
It is worth noting that the time consumption was also shortened. The amount of time required for identifying drilling holes using the traditional method was 650–2300 ms, while that of the proposed method was 590–670 ms. The average speed of the drilling hole identification increased by 55.6%.
The experimental results showed that the proposed method could effectively improve the recognition rate of drilling holes, eliminate the influence of invalid circular holes on the recognition results, and greatly improve the recognition speed.

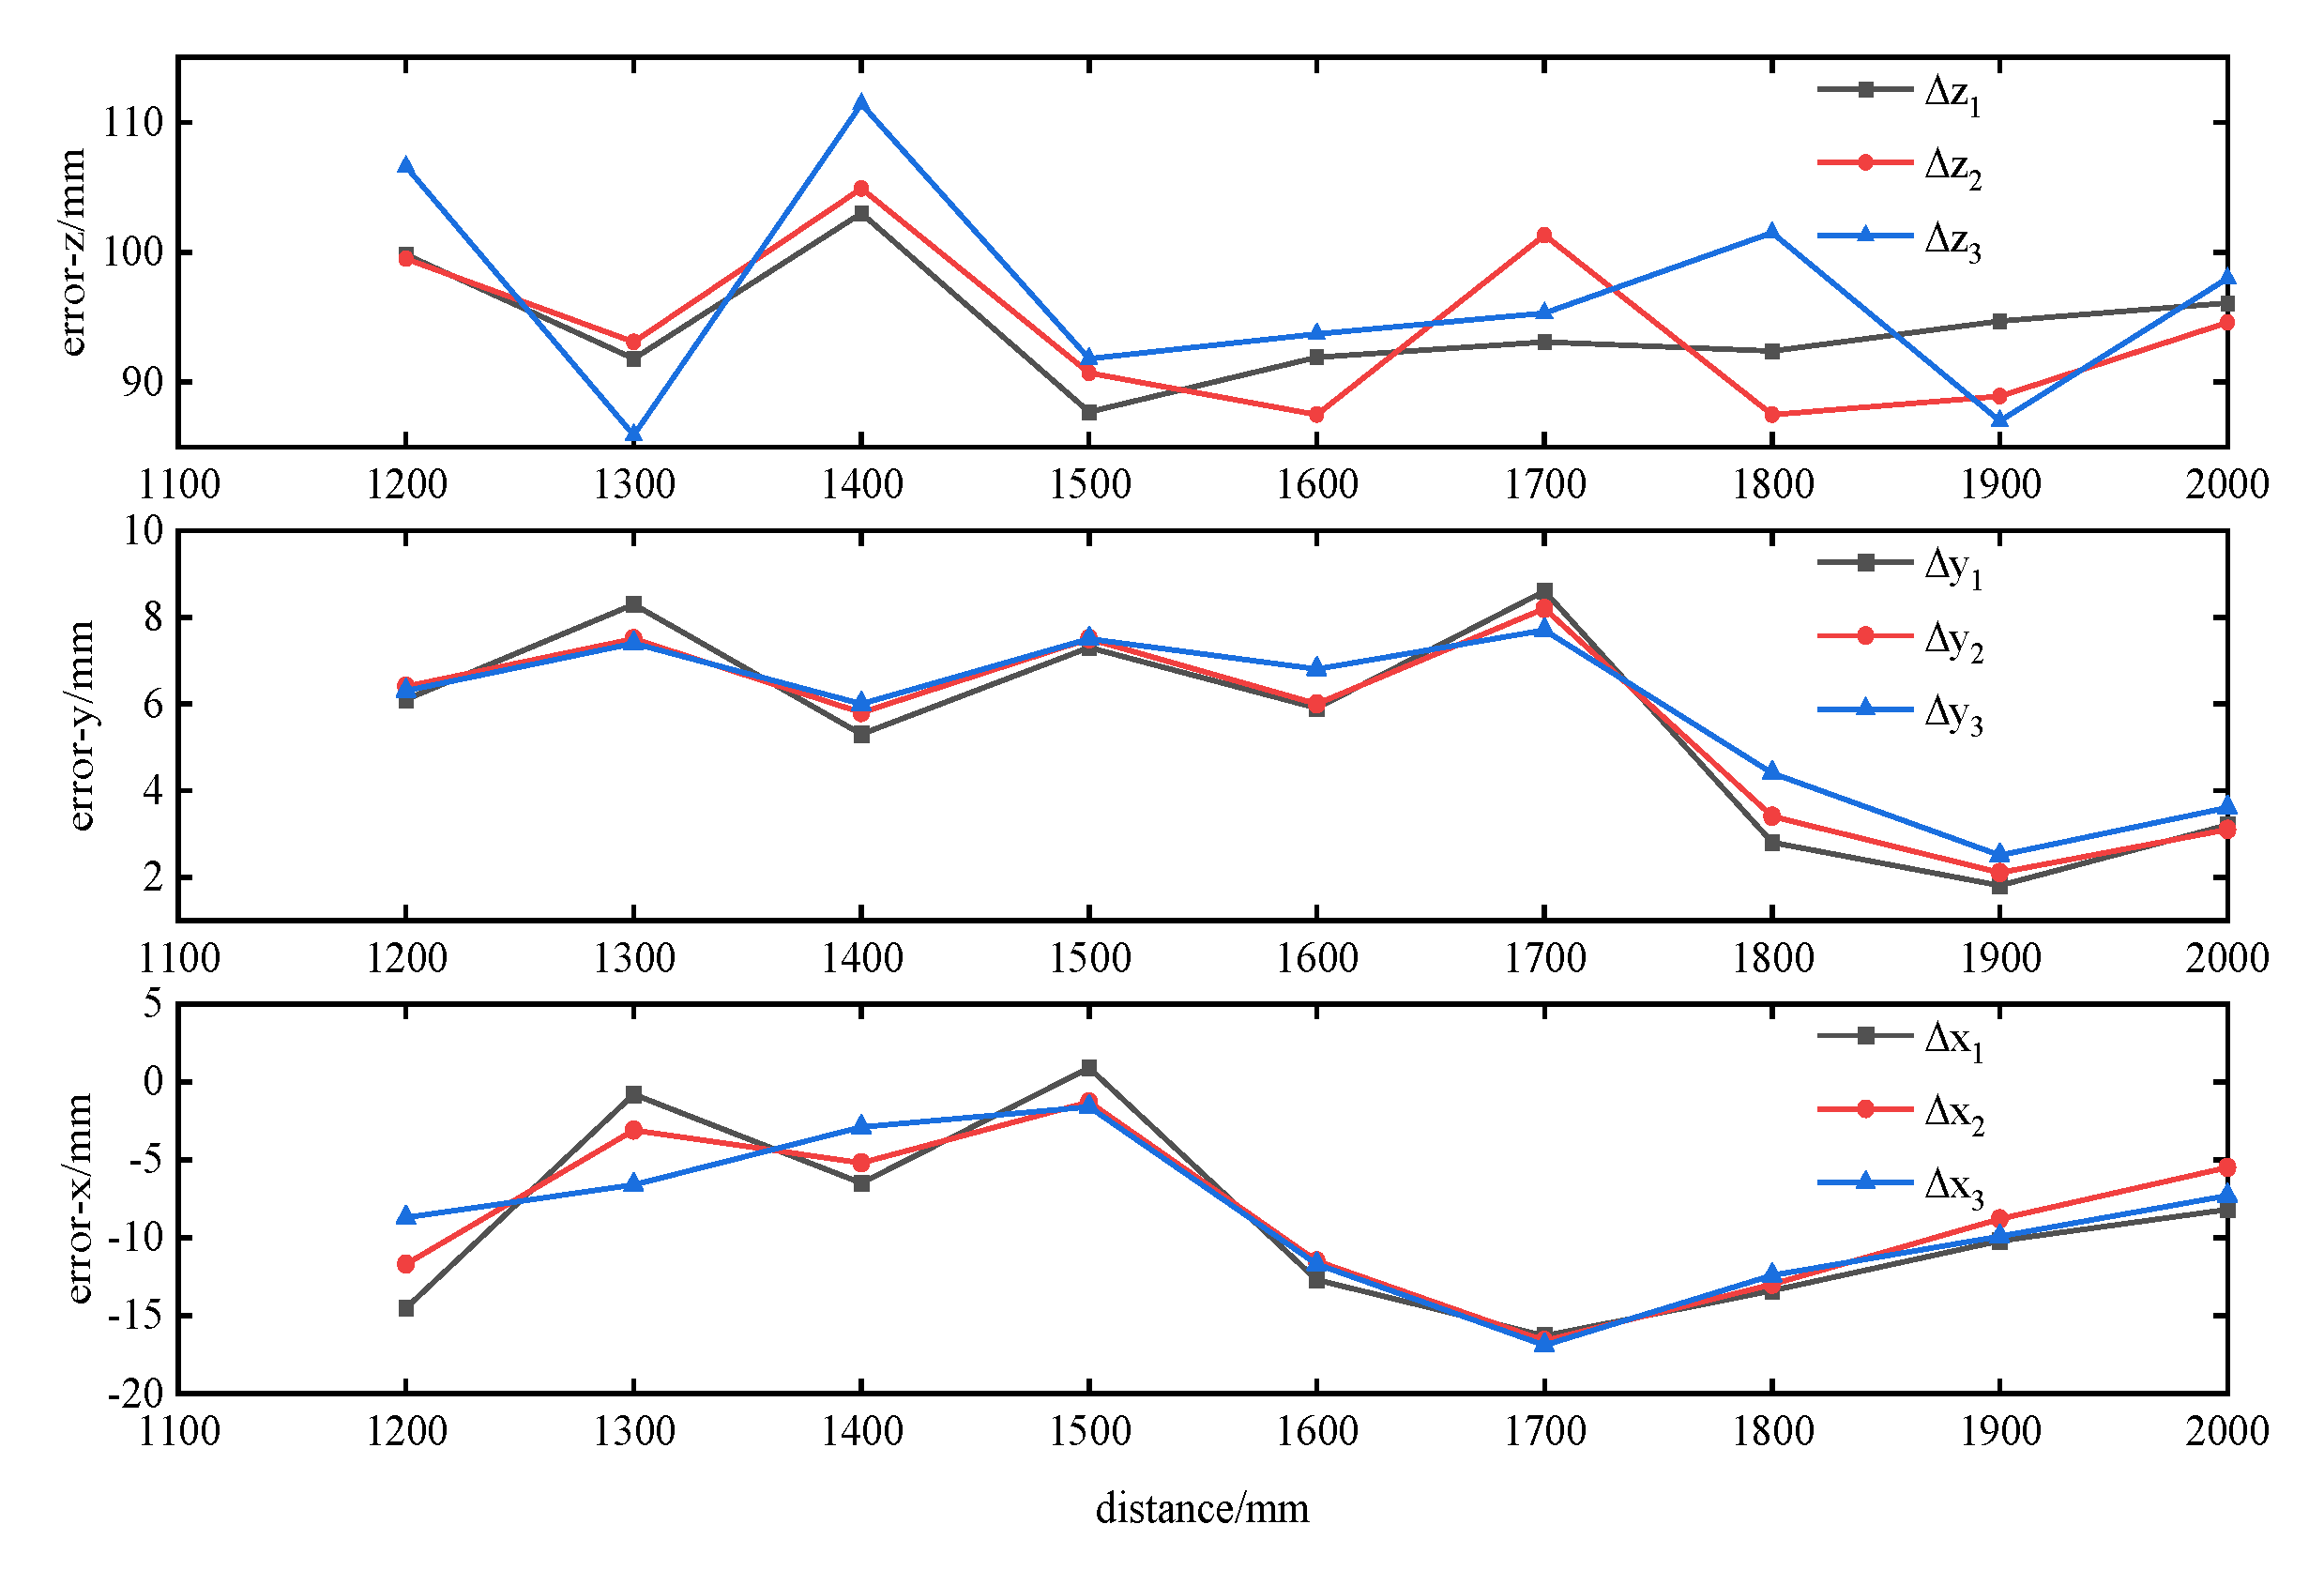
4.2. Localization of Drilling Holes

It was necessary to extract the 3D coordinates of the drilling holes after identifying them in the images. A laboratory localization test was conducted in order to determine the precision of the stereo vision positions as well as the accuracy in three dimensions. Initially, the world coordinate system was determined by the optical center coordinates of the left camera of the binocular camera system. In this scenario, the X-axis corresponded to the optical center of the left camera, the Z-axis corresponded to the coal wall along the optical center direction, and the Y-axis was determined by the right-hand rule. To simulate the positioning accuracy of the bolt drilling at various distances from the coal wall, the camera’s position on the high-precision mobile platform was adjusted during the experimental process. We collected a group of images every 100 mm in the range of 1100–2000 mm, and we used the method proposed in this paper to perform preprocessing, correction, recognition of targets, contour detection, stereo matching, and other steps so as to determine the spatial positions of the drilling holes in the world coordinate system. Based on the binocular vision positioning principle, we could calculate the spatial coordinates of the drilling hole centers in the images using the proposed method. The results are presented in Table 2.
As it is impossible to precisely determine the spatial coordinates of the center of the drilling hole on the steel strip, the positioning accuracy was evaluated from two aspects. First, the positioning accuracy was evaluated by determining the spatial distance between two adjacent drilling holes. Through the 3D coordinates of two points in space, the spatial distance between two points could be calculated. The maximum and minimum errors between the distances of two adjacent boreholes calculated by the method described in this paper and the actual distance (300 mm) occurred when the distance was 1600 mm. In the case of 1600 mm, the spatial distance between the first hole and the second hole was calculated to be 300 mm, which is entirely consistent with the distance between two corresponding points on the steel strip. The spatial distance between the third hole and the fourth hole was 305.6 mm, and the maximum error was 5.6 mm. The maximum error of the distance between two adjacent drilling holes and the actual distance was 2.3 mm, and the error rate between the calculated distance of the adjacent drilling holes and the actual distance was approximately 0.51%, which indicated a high relative positioning accuracy, as shown in Table 2.
This paper also focuses on the changes in the spatial coordinates of a drilling hole over a range of distances. The method proposed in this paper could accurately locate holes 1–3 in the range of 1100–2000 mm, whereas hole 4 could only be accurately located in the range of 1700–1800 mm. Therefore, this paper focuses primarily on the change in spatial coordinates between holes 1 and 3. As we can see from Figure 10, in the X-direction, the maximum change between two adjacent drilling holes was −16.9 mm, the minimum change was −0.8 mm, and the average change was −8.8 mm. In the Y-direction, the maximum variation was 8.6 mm, the minimum variation was 1.8 mm, and the average change was 5.6 mm. In the Z-direction, the maximum variation was 111.4 mm, the minimum variation was 85.9 mm, and the average variation was 95.2 mm. Because the binocular camera system was only moved along the Z-axis on a high-precision mobile platform, and the distance between each movement was 100 mm, the positioning error along the Z-axis was −4.8 mm. The positioning accuracy on the Z-axis reached 95.2%.
At present, the coal mine roadway support operation mainly depends on the manual operation of single pieces of equipment, which generally requires three people to work at the same time, and it takes about 7 min to complete an anchor drilling support operation. In addition, in the construction process of different anchor drilling operations, it takes time to move the equipment. For a cross section, it takes an average of 8 min to carry out bolt drilling support.
The robot for drilling anchors introduced in this paper realizes the automatic positioning of drilling anchors through binocular vision positioning technology to control the drilling boom to complete the supporting operation. The experimental results showed that it took about 30 s from image acquisition to determine the coordinates of the drilling anchor, about 1 min to move the boom to the target position, and about 3 min to complete the drilling anchor operation, corresponding to a total of 4.5 min. It takes an average of 5 min for the equipment to complete an anchor drilling support operation. In contrast to the existing method, only one worker needs to participate, lowering the number by two workers, improving the support speed by about 60%, and improving the safety of the system. This is of great significance for reducing the required manpower, improving efficiency, and realizing automation and intelligence in coal mines.

5. Discussion

An effective method for improving the support efficiency of roadways is to use binocular cameras to collect images of the roof steel strip and accurately position anchor holes. An anchor hole identification experiment revealed that a 97.3% accuracy was achieved in identifying anchor holes. For distances between 1100 and 1500 mm, due to the short distance, not all anchor holes could be imaged on the left and right cameras. Thus, only the spatial coordinates of the anchor holes appearing on the left and right images could be determined. At a distance of 1600–1800 mm, as the distance increased, all anchor holes on the steel strip could be identified on the image, allowing the spatial coordinates of the four anchor holes on the steel strip to be determined. When the distance exceeded 1800 mm, even though all anchor holes on the steel strip could be displayed on the left and right images, the image quality decreased due to the distance from the edge. The brightness of the part near the edge of the steel strip was low, and it was highly similar to the color of the coal wall, making it difficult to distinguish. It was difficult to determine the spatial coordinates of the anchor holes here. Therefore, further research should focus on the identification of anchor holes when the brightness is reduced.
During the anchor hole positioning experiment, the binocular camera system was only adjusted along the high-precision moving platform, and spatial coordinates of the anchor hole only changed along the Z-axis. Because the optical axis of the camera was not perfectly perpendicular to the plane where the steel strip was positioned, the spatial coordinates of the bolt drilling changed on the X- and Y-axes. Consequently, as soon as the camera moved along the high-precision mobile platform, the origin of the world coordinate system changed in all three directions of the three axes, not just along the Z-axis. The steel strip, however, was not a plane, but rather a curved surface, which could cause the X and Y coordinates to change.

6. Conclusions

This paper proposes a novel spatial positioning method for anchor drilling holes, which utilizes binocular stereo vision to capture images of steel strips on roadway roofs. The captured images undergo a series of preprocessing steps such as image enhancement, denoising, and stereo correction, followed by the application of a circle detection algorithm based on parameter-adaptive Hough transform. The method constructs a function model that relates the anchor drilling hole radius in the image to the distance from the camera to the anchor hole. This enables the automatic adjustment of the maximum and minimum radii of the anchor hole based on its actual distance, facilitating accurate and fast identification and segmentation of the anchor hole contour. The experimental results demonstrate that the proposed method achieves an average recognition rate of 97.3% within the working range. To address the stereo matching problem of anchor holes under weak texture conditions, this paper proposes a matching method based on the slope of the straight line where the anchor holes are located and geometric constraints to realize fast image matching. The spatial coordinates of the anchor drilling center are calculated based on parallax primitive understanding. The experimental results reveal that the positioning accuracy of anchor drilling based on this method can reach 95%, exhibiting improved stability and robustness when compared to the manual positioning method.
The spatial positioning technology of anchor holes based on binocular vision technology has high development potential, which is of great significance for improving the efficiency of coal mine roadway driving and developing automation and intelligence of coal mines. In the pursuit of enhancing the system’s practicality and robustness, we propose continued research into the spatial positioning of bolt drilling under low illumination conditions and undertaking industrial experiments in coal mines as part of our future work.

Author Contributions

Conceptualization, M.L. and X.Z.; methodology, M.L. and Z.D.; software, C.Z. and J.W.; validation, M.L. and C.Z.; formal analysis, G.Z.; investigation, M.L.; resources, X.Z. and G.Z.; data curation, J.W.; writing—original draft preparation, M.L. and Z.D.; writing—review and editing, M.L. and X.Z.; visualization, M.L., Z.D., J.W. and C.Z.; supervision, M.L.; project administration, X.Z.; funding acquisition, X.Z. and G.Z. All authors have read and agreed to the published version of the manuscript.

Funding

This research was funded through the financial support of The National Natural Science Foundation of China (NSFC) under Grant Nos. 52104166 and 52174149 and The Natural Science Foundation of Shaanxi Province under Grant No. 2021JLM-03.

Data Availability Statement

The data used to support the findings of this study are available from the corresponding author upon request.

Conflicts of Interest

The authors declare no conflict of interest.

References

  1. Kang, H.P. Sixty years development and prospects of rock bolting technology for underground coal mine roadways in China. J. China Univ. Min. Technol. 2016, 45, 1071–1081. [Google Scholar]
  2. Wang, B.K. Current status and trend analysis of readway driving technology and equipment in coal mine. Coal Sci. Technol. 2020, 48, 1–11. [Google Scholar]
  3. Wang, H.; Wang, B.K.; Zhang, X.F.; Li, F.Q.; Du, C.Y. Key technology and engineering practice of intelligent rapid heading in coal mine. J. China Coal Soc. 2021, 46, 2068–2083. [Google Scholar]
  4. Wang, G.F. New technological progress of coal mine intelligence and its problems. Coal Sci. Technol. 2022, 50, 1–27. [Google Scholar]
  5. Wang, H.; Wang, J.L.; Zhang, X.F. Theory and technology of efficient roadway advance with driving and bolting integration. J. China Coal Soc. 2020, 45, 2021–2030. [Google Scholar]
  6. Tajduś, K.; Misa, R.; Sroka, A. Analysis of the surface horizontal displacement changes due to longwall panel advance. Int. J. Rock Mech. Min. 2018, 104, 119–125. [Google Scholar] [CrossRef]
  7. Luo, H.; Zhang, K.; Su, Y.; Zhong, K.; Li, Z.W.; Guo, J.; Guo, C. Monocular vision pose determination-based large rigid-body docking method. Measurement 2022, 204, 112049. [Google Scholar] [CrossRef]
  8. Gao, Q.Y.; Jin, Y.L.; Liu, Q.; Yan, P.; Zhang, H.Y.; Li, F.Y.; Wang, H. Monocular vision measurement technology applied in dynamic compaction ramming settlement monitoring. Measurement 2023, 216, 112941. [Google Scholar] [CrossRef]
  9. Li, J. Relative pose measurement of binocular vision based on feature circle. Optik 2019, 194, 163121. [Google Scholar] [CrossRef]
  10. Lv, J.; Shi, P.; Wan, Z.J.; Cheng, J.Y.; Xing, K.K.; Wang, M.L.; Gou, H. Research on a Real-Time Monitoring Method for the Three-Dimensional Straightness of a Scraper Conveyor Based on Binocular Vision. Mathematics 2022, 10, 3545. [Google Scholar] [CrossRef]
  11. Kim, S.; Fan, M.; Jung, S.; Ko, S. External Vehicle Positioning System Using Multiple Fish-Eye Surveillance Cameras for Indoor Parking Lots. IEEE Syst. J. 2021, 15, 5107–5118. [Google Scholar] [CrossRef]
  12. Siratanita, S.; Chamnongthai, K.; Muneyasu, M. A Method of Football-Offside Detection Using Multiple Cameras for an Automatic Linesman Assistance System. Wireless Pers. Commun. 2021, 118, 1883–1905. [Google Scholar] [CrossRef]
  13. Ma, C.; Yang, F.; Li, Y.; Jia, H.; Xie, X.; Gao, W. Deep Trajectory Post-Processing and Position Projection for Single & Multiple Camera Multiple Object Tracking. Int. J. Comput. Vision 2021, 129, 3255–3278. [Google Scholar]
  14. Zhang, C. Binocular Vision Navigation Method of Marine Garbage Cleaning Robot in Unknown Dynamic Scene. J. Coastal Res. 2020, 103, 864. [Google Scholar] [CrossRef]
  15. Deng, F.C.; Zhu, X.R.; He, C. Vision-Based Real-Time Traversable Region Detection for Mobile Robot in the Outdoors. Sensors 2017, 17, 2101. [Google Scholar] [CrossRef] [PubMed]
  16. Meng, Y.; Wu, Z.X.; Li, Y.T.; Chen, D.; Tan, M.; Yu, J.Z. Vision-Based Underwater Target Following Control of an Agile Robotic Manta with Flexible Pectoral Fins. IEEE Robot. Autom. Lett. 2023, 8, 2277–2284. [Google Scholar] [CrossRef]
  17. Zhao, D.D.; He, W.; Deng, L.; Wu, Y.H.; Xie, H.; Dai, J.J. Trajectory Tracking and Load Monitoring for Moving Vehicles on Bridge Based on Axle Position and Dual Camera Vision. Remote Sens. 2021, 13, 4868. [Google Scholar] [CrossRef]
  18. Yin, H.S.; Ma, Z.; Zhong, M.; Wu, K.; Wei, Y.T.; Guo, J.L.; Huang, B. SLAM-Based Self-Calibration of a Binocular Stereo Vision Rig in Real-Time. Sensors 2020, 20, 621. [Google Scholar] [CrossRef]
  19. Zhang, H.H.; Xie, C.; Toriya, H.; Shishido, H.; Kitahara, I. Vehicle Localization in a Completed City-Scale 3D Scene Using Aerial Images and an On-Board Stereo Camera. Remote Sens. 2023, 15, 3871. [Google Scholar] [CrossRef]
  20. Sheng, H.Y.; Wei, S.M.; Yu, X.I.; Tang, L. Research on Binocular Visual System of Robotic Arm Based on Improved SURF Algorithm. IEEE Sens. J. 2020, 20, 11849–11855. [Google Scholar] [CrossRef]
  21. Lyu, C.Y.; Li, P.; Wang, D.C.; Yang, S.S.; Lai, Y.P.; Sui, C.Y. High-Speed Optical 3D Measurement Sensor for Industrial Application. IEEE Sens. J. 2021, 21, 11253–11261. [Google Scholar] [CrossRef]
  22. Zhang, H.J.; Tang, C.H.; Sun, X.M.; Fu, L.S. A Refined Apple Binocular Positioning Method with Segmentation-Based Deep Learning for Robotic Picking. Agronomy 2023, 13, 1469. [Google Scholar] [CrossRef]
  23. Ye, L.; Duan, J.L.; Yang, Z.; Zou, X.G.; Chen, M.Y.; Zhang, S. Collision-free motion planning for the litchi-picking robot. Comput. Electron. Agric. 2021, 185, 106151. [Google Scholar] [CrossRef]
  24. Yang, W.J.; Zhang, X.H.; Ma, H.W.; Zhang, G.M. Infrared LEDs-Based Pose Estimation with Underground Camera Model for Boom-Type Roadheader in Coal Mining. IEEE Access 2019, 7, 33698–33712. [Google Scholar] [CrossRef]
  25. Cui, Y.M.; Liu, S.Y.; Yao, J.; Gu, C.C. Integrated Positioning System of Unmanned Automatic Vehicle in Coal Mines. IEEE Trans. Instrum. Meas. 2021, 70, 1–13. [Google Scholar] [CrossRef]
  26. Wan, J.C.; Zhang, X.H.; Zhang, C.; Yang, W.J.; Lei, M.Y.; Du, Y.Y.; Dong, Z. Vision and Inertial Navigation Combined-Based Pose Measurement Method of Cantilever Roadheader. Sustainability 2023, 15, 4018. [Google Scholar] [CrossRef]
  27. Chen, H.Y.; Yang, W.; Ma, Y.; Tian, L.Y. Multi-sensor fusion method for roadheader pose detection. Mechatronics 2021, 80, 102669. [Google Scholar] [CrossRef]
  28. Zhang, Z.Y. A Flexible New Technique for Camera Calibration. IEEE Trans. Pattern Anal. 2000, 11, 1330–1334. [Google Scholar] [CrossRef]
  29. Hu, Y.; Chen, Q.; Feng, S.J.; Tao, T.Y.; Asundi, A.; Zuo, C. A new microscopic telecentric stereo vision system—Calibration, rectification, and three-dimensional reconstruction. Opt. Lasers Eng. 2019, 113, 14–22. [Google Scholar] [CrossRef]
  30. Lin, G.C.; Tang, Y.C.; Zou, X.J.; Xiong, J.T.; Fang, Y.M. Color-, depth-, and shape-based 3D fruit detection. Precis. Agric. 2020, 21, 1–17. [Google Scholar] [CrossRef]
  31. Jabłoński, M.; Tylek, P.; Walczyk, J.; Tadeusiewicz, R.; Piłat, A. Colour-Based Binary Discrimination of Scarified Quercus robur Acorns under Varying Illumination. Sensors 2016, 16, 1319. [Google Scholar] [CrossRef] [PubMed]
  32. Aligholi, S.; Lashkaripour, G.R.; Khajavi, R.; Razmara, M. Automatic mineral identification using color tracking. Pattern Recogn. 2017, 65, 164–174. [Google Scholar] [CrossRef]
  33. Taniai, T.; Matsushita, Y.; Sato, Y.; Naemura, T. Continuous 3D Label Stereo Matching Using Local Expansion Moves. IEEE Trans. Pattern Anal. 2018, 40, 2725–2739. [Google Scholar] [CrossRef] [PubMed]
  34. Hong, P.N.; Ahn, C.W. Stereo Matching Methods for Imperfectly Rectified Stereo Images. Symmetry 2019, 11, 570. [Google Scholar] [CrossRef]
  35. Zhong, F.Q.; Quan, C.G. Stereo-rectification and homography-transform-based stereo matching methods for stereo digital image correlation. Measurement 2021, 173, 108635. [Google Scholar] [CrossRef]
  36. Ma, Y.P.; Li, Q.W.; Chu, L.L.; Zhou, Y.Q.; Xu, C. Real-Time Detection and Spatial Localization of Insulators for UAV Inspection Based on Binocular Stereo Vision. Remote Sens. 2021, 13, 230. [Google Scholar] [CrossRef]
  37. Li, J. Binocular vision measurement method for relative position and attitude based on dual-quaternion. J. Mod. Optic. 2017, 64, 1846–1853. [Google Scholar] [CrossRef]
Figure 1. Anchor drilling robot.
Mathematics 11 04365 g001
Figure 2. Algorithm flowchart for extracting the three-dimensional (3D) spatial information of a drilling hole center using binocular vision system.
Mathematics 11 04365 g002
Figure 3. Image pairs before stereo rectify.
Mathematics 11 04365 g003
Figure 4. Image pairs after stereo rectify.
Mathematics 11 04365 g004
Figure 5. Example of image segmentation: (a) original image; (b) preprocessing image; (c) Canny-detected image; and (d) straight line and region of interest (ROI).
Mathematics 11 04365 g005
Figure 6. Variation in the radius with distance.
Mathematics 11 04365 g006
Figure 7. Model of binocular camera.
Mathematics 11 04365 g007
Figure 8. Simulation experiment of identifying and locating the drilling holes.
Mathematics 11 04365 g008
Figure 9. Contour fitting of the drilling hole: (a) based on Hough circle detection; (b) based on the proposed method.
Mathematics 11 04365 g009
Figure 10. The variation in spatial coordinates of the same drilling hole every 100 mm interval.
Mathematics 11 04365 g010
Table 1. Identification results of drilling holes by different methods.
Distance
(mm)
Number of Drilling HolesIdentified Drilling Holes (Initial Parameter)Identified Drilling Holes (Adaptive Parameter)Identification Rate
(Adaptive Parameter)
Time
(Initial Parameter)
Time
(Adaptive Parameter)
1100183218100%693 ms658 ms
1200213721100%967 ms640 ms
1300218521100%1466 ms623 ms
14002110321100%2073 ms665 ms
15002112121100%2634 ms591 ms
1600243824100%654 ms607 ms
1700244224100%897 ms638 ms
1800247724100%1603 ms618 ms
190024952187.5%2257 ms649 ms
200024312187.5%896 ms604 ms
Table 2. The location result of the drilling holes based on the stereo vision system.
Distance (mm)Drilling HolesPixel Coordinates of the Center of the Left ImagePixel Coordinates of the Center of the Right ImageSpatial CoordinatesSpatial Distance between Two Adjacent Drilling HolesAverage Distance (mm)Average Error of Distance (mm)
11001(−249.5, −18.3)(−434.5, −1.9)(−203.3, −14.9, 1106.4)/299.40.6
2(118.8, −10.8)(−68.3, −11.6)(95.7, −8.7, 1094.0)l12(1100) = 299.4
3(493.1, −2.4)(304.9, −2.4)(394.9, −1.9, 1087.6)l23(1100) = 299.4
4////
12001(−245.2, −9.9)(−414.9, −10.7)(−217.8, −8.8, 1206.2)/302.32.3
2(95.6, −2.6)(−75.9, −3.6)(84.0, −2.3, 1193.5)l12(1200) = 302.3
3(439.2,5)(267.8, 4.8)(386.2, 4.4, 1194.2)l23(1200) = 302.3
4/(608.0, 12.9)//
13001(−228.7, −0.5)(−386.4, −1.3)(−218.6, −0.5, 1298.0)/299.30.7
2(85.4, 5.5)(−73.7, 4.6)(80.9, 5.2, 1286.6)l12(1300) = 299.8
3(402.7, 12.5)(242.8, 11.8)(379.6, 11.8, 1280.1)l23(1300) = 298.8
4/(557.0, 19.1)//
14001(−218.2, 4.6)(−364.3, 3.6)(−225.1, 4.8, 1401.0)/301.21.2
2(73.9, 10.7)(−73.2, 9.8)(75.7, 11.0, 1391.5)l12(1400) = 301.1
3(367.6, 17.4)(220.5, 16.6)(376.7, 17.8, 1391.5)l23(1400) = 301.3
4/(510.4, 23.1)//
15001(−204.5, 11.0)(−342.0, 10.2)(−224.18, 12.1, 1488.7)/299.80.2
2(68.2, 16.9)(−69.9, 16.0)(74.4, 18.5, 1482.2)l12(1500) = 298.8
3(343.4, 23.4)(205.4, 22.4)(375.1, 25.3, 1483.3)l23(1500) = 300.7
4/(477.2, 29.3)//
16001(−203.5, 15.5)(−333.0, 14.6)(−236.9, 18.0, 1580.6)/299.01.0
2(54.4, 21.2)(−76.0, 20.0)(62.9, 24.5, 1569.7)l12(1600) = 300.0
3(312.9, 27.6)(183.1, 26.8)(363.4, 32.1, 1577.0)l23(1600) = 300.7
4(566.9, 29.7)(439.0, 33.0)(668.1, 35.0, 1600.4)l34(1600) = 305.6
17001(−205.4, 21.6)(−327.7, 20.6)(−253.2, 26.6, 1673.7)/298.81.2
2(37.6, 26.6)(−84.9, 25.5)(46.3, 32.7, 1671.0)l12(1700) = 299.5
3(281.4, 32.3)(159.0, 31.3)(346.5, 39.8, 1672.3)l23(1700) = 300.4
4(521.2, 37.2)(399.0, 36.9)(642.9, 45.9, 1675.1)l34(1700) = 296.5
18001(−205.0, 22.6)(−320.9, 22.0)(−266.6, 29.4, 1766.1)/299.50.5
2(25.7, 27.9)(−90.7, 27.4)(33.3, 36.1, 1758.5)l12(1800) = 300.1
3(255.8, 33.8)(140.4, 32.8)(334.1, 44.2, 1773.8)l23(1800) = 301.3
4(482.3, 39.3)(367.1, 38.3)(631.1, 51.4, 1776.8)l34(1800) = 297.0
19001(−202.0, 22.8)(−312.0, 21.6)(−276.8, 31.2, 1860.8)/300.90.9
2(18.0, 28.1)(−92.8, 27.2)(24.5, 38.2, 1847.4)l12(1900) = 301.7
3(236.6, 34.1)(126.6, 32.8)(324.2, 46.7, 1860.8)l23(1900) = 300.1
4(452.0, 39.1)///
20001(−197.8, 23.9)(−302.4, 20.8)(−285.0, 34.4, 1956.9) 301.51.5
2(13.3, 28.9)(−92.1, 26.8)(19.0, 41.3, 1942.0)l12(2000) = 304.4
3(219.7, 34.9)(115.2, 30.8)(316.9, 50.3, 1958.8)l23(2000) = 298.5
4(423.8, 39.6)///
Disclaimer/Publisher’s Note: The statements, opinions and data contained in all publications are solely those of the individual author(s) and contributor(s) and not of MDPI and/or the editor(s). MDPI and/or the editor(s) disclaim responsibility for any injury to people or property resulting from any ideas, methods, instructions or products referred to in the content.

