
Criteria-Based Model of Hybrid Photovoltaic–Wind Energy System with Micro-Compressed Air Energy Storage

Abstract
:1. Introduction
Micro-CAES
2. Materials and Methods
2.1. Modeled System
- Monocrystalline silicon solar panels (solar energy power plus SE-185M24/F) were utilized, with a peak power of 185 W and efficiency of 13%;
- A 1 kW wind turbine (Foshan OUYAD FD3.0-1000) with cut-in wind speed of 2 m/s;
- AGM-type batteries (Effekta, BTL 12–200 12 V/200 Ah) with an efficiency of 85%;
- A charge controller (Phocos CXN 40 A) for both systems;
- An AC inverter (Cotek 300 W/24 V) with 5.75 kW power and 90% efficiency;
2.2. Sizing of the System
2.3. System Simulation
and SOS(j + 1) = EB(j + 1) × 100/CB
2.4. Cost Analysis
2.5. Case Study
3. Results
3.1. Scenarios of the Investigated Systems
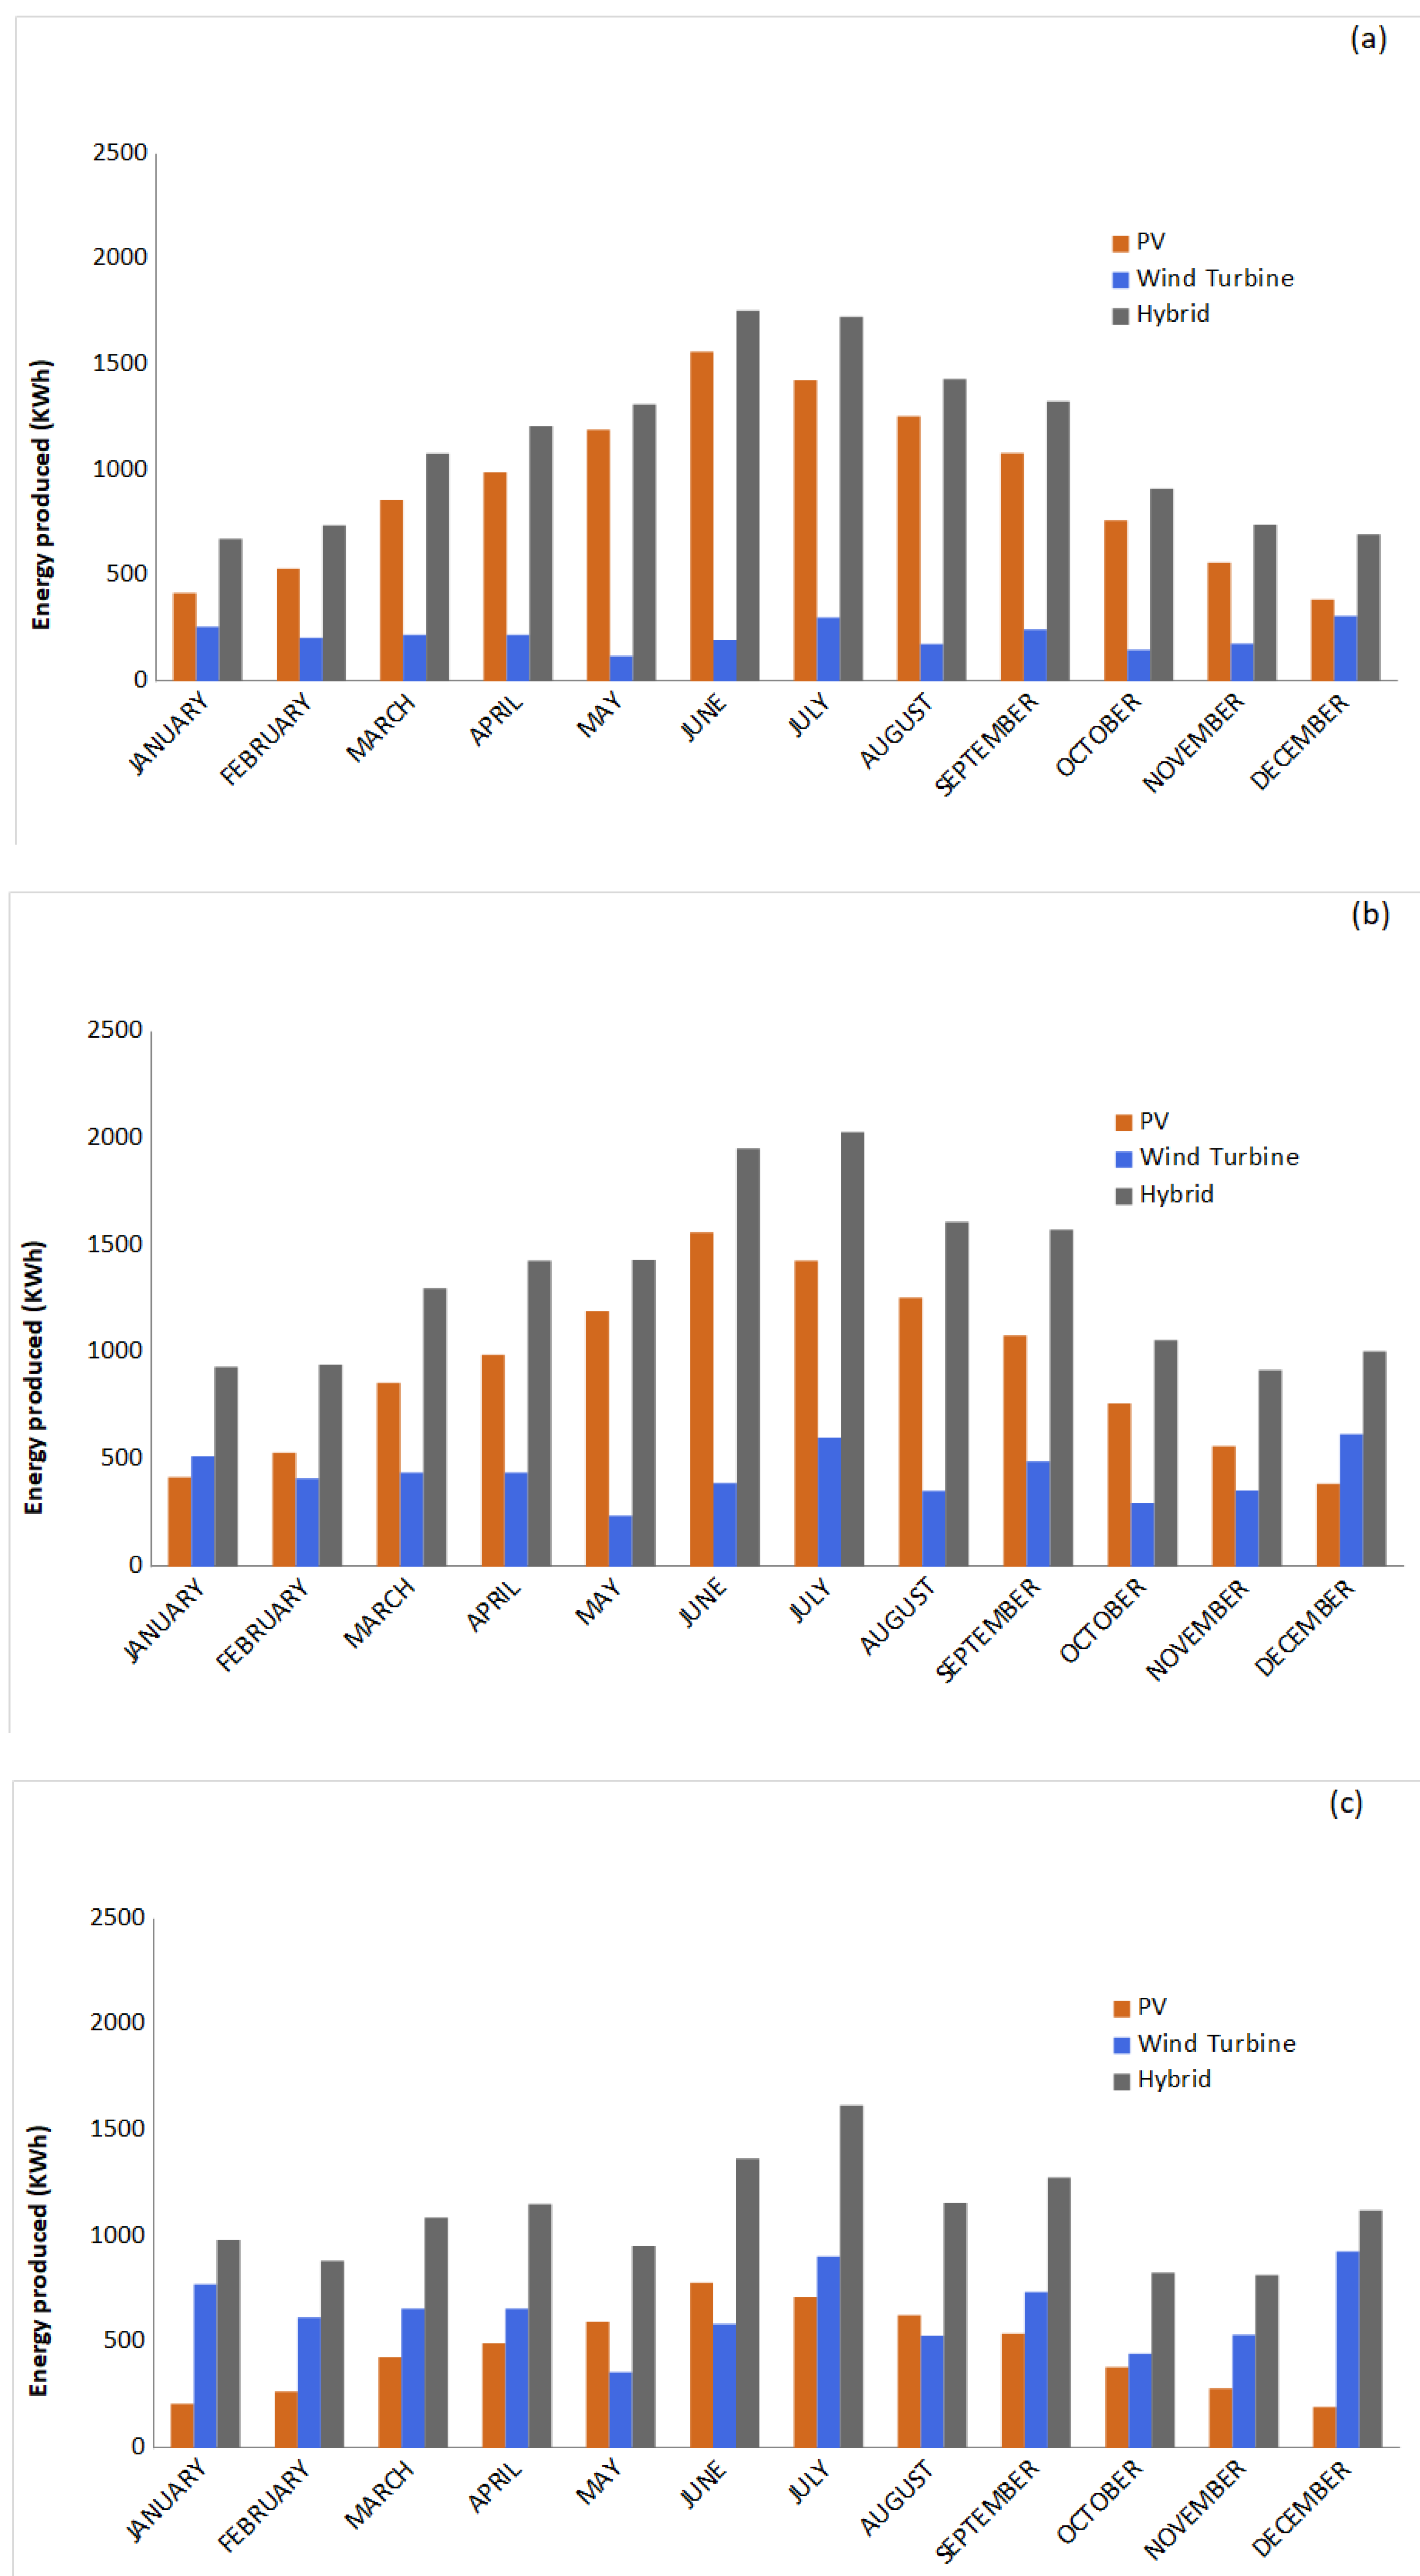
3.2. Generated Electrical Energy
4. Discussion
5. Conclusions
Author Contributions
Funding
Data Availability Statement
Acknowledgments
Conflicts of Interest
Nomenclature
| CSP | Concentrated solar power |
| BOS | Balance of system |
| CAES | Compressed sir energy storage |
| LFG | Landfill gas |
| LOLP | Loss of load probability |
| O&M | Operation and maintenance |
| TACAS | Thermal and compressed air storage |
| SSCAES | Small subsurface compressed air energy storage |
| UPS | Uninterruptible power supply |
| CB | Battery capacity |
| DOD | Depth of discharge |
| Edem(j) | Energy load demand |
| Euser(j) | Energy supplied to the user |
| EU(j) | Unsatisfied energy |
| ES(j) | Energy for storage |
| Eunused(j) | Unused energy |
| SOS(j) | State of storage at j hour |
| ηinv | Efficiency of inverter |
| ηbat | Efficiency of battery |
| ηc | Efficiency of compression and expansion |
References
- Solar PV—Analysis. Available online: https://www.iea.org/reports/solar-pv (accessed on 24 November 2022).
- Arnaoutakis, G.E.; Katsaprakakis, D.A.; Christakis, D.G. Dynamic Modeling of Combined Concentrating Solar Tower and Parabolic Trough for Increased Day-to-Day Performance. Appl. Energy 2022, 323, 119450. [Google Scholar] [CrossRef]
- Ziyati, D.; Dollet, A.; Flamant, G.; Volut, Y.; Guillot, E.; Vossier, A. A Multiphysics Model of Large-Scale Compact PV–CSP Hybrid Plants. Appl. Energy 2021, 288, 116644. [Google Scholar] [CrossRef]
- Manley, P.; Segantini, M.; Ahiboz, D.; Hammerschmidt, M.; Arnaoutakis, G.; MacQueen, R.W.; Burger, S.; Becker, C. Double-Layer Metasurface for Enhanced Photon up-Conversion. APL Photonics 2021, 6, 036103. [Google Scholar] [CrossRef]
- Arnaoutakis, G.E.; Katsaprakakis, D.A. Concentrating Solar Power Advances in Geometric Optics, Materials and System Integration. Energies 2021, 14, 6229. [Google Scholar] [CrossRef]
- Mahon, N.S.; Korolik, O.V.; Khenkin, M.V.; Arnaoutakis, G.E.; Galagan, Y.; Soriūtė, V.; Litvinas, D.; Ščajev, P.; Katz, E.A.; Mazanik, A.V. Photoluminescence Kinetics for Monitoring Photoinduced Processes in Perovskite Solar Cells. Sol. Energy 2020, 195, 114–120. [Google Scholar] [CrossRef]
- Arnaoutakis, G.E.; Kefala, G.; Dakanali, E.; Katsaprakakis, D.A. Combined Operation of Wind-Pumped Hydro Storage Plant with a Concentrating Solar Power Plant for Insular Systems: A Case Study for the Island of Rhodes. Energies 2022, 15, 6822. [Google Scholar] [CrossRef]
- Cole, W.; Frazier, A.W.; Augustine, C. Cost Projections for Utility-Scale Battery Storage: 2021 Update; National Renewable Energy Lab. (NREL): Golden, CO, USA, 2021. [Google Scholar]
- Gyuk, I. EPRI-DOE Handbook of Energy Storage for Transmission and Distribution Applications; EPRI, Palo Alto, CA, and the U.S. Department of Energy: Washington, DC, USA, 2003; p. 1001834. [Google Scholar]
- Katsaprakakis, D.A. 15-Energy Storage for Offshore Wind Farms. In Offshore Wind Farms; Ng, C., Ran, L., Eds.; Woodhead Publishing: Sawston, UK, 2016; pp. 459–493. ISBN 978-0-08-100779-2. [Google Scholar]
- Mason, J.; Fthenakis, V.; Zweibel, K.; Hansen, T.; Nikolakakis, T. Coupling PV and CAES Power Plants to Transform Intermittent PV Electricity into a Dispatchable Electricity Source. Prog. Photovolt. Res. Appl. 2008, 16, 649–668. [Google Scholar] [CrossRef]
- Shan, R.; Reagan, J.; Castellanos, S.; Kurtz, S.; Kittner, N. Evaluating Emerging Long-Duration Energy Storage Technologies. Renew. Sustain. Energy Rev. 2022, 159, 112240. [Google Scholar] [CrossRef]
- Farret, F.A.; Simoes, M.G. Integration of Alternative Sources of Energy; John Wiley & Sons: Hoboken, NJ, USA, 2006; ISBN 978-0-471-75561-6. [Google Scholar]
- Succar, S.; Williams, R.H. Compressed Air Energy Storage: Theory, Resources, and Applications for Wind Power. Princet. Environ. Inst. Rep. 2008, 8, 81. [Google Scholar]
- Nakhamkin, M.; Wolk, R.H.; van der Linden, S.; Patel, M. New Compressed Air Energy Storage Concept Improves the Profitability of Existing Simple Cycle, Combined Cycle, Wind Energy, and Landfill Gas Power Plants; American Society of Mechanical Engineers Digital Collection: Vienna, Austria, 2008; pp. 103–110. [Google Scholar]
- Struckmeier, W.; Richts, A. WHYMAP and the World Map of Transboundary Aquifer Systems at the Scale of 1:50,000,000 (Special Edition for the 4th World Water Forum, Mexico City, March 2006). Epis. J. Int. Geosci. 2006, 29, 274–278. [Google Scholar] [CrossRef] [Green Version]
- Guo, C.; Li, C.; Zhang, K.; Cai, Z.; Ma, T.; Maggi, F.; Gan, Y.; El-Zein, A.; Pan, Z.; Shen, L. The Promise and Challenges of Utility-Scale Compressed Air Energy Storage in Aquifers. Appl. Energy 2021, 286, 116513. [Google Scholar] [CrossRef]
- DTI, D. Status of Electrical Energy Storage Systems. Rep. DTI (Dep. Trade Ind.) 2004. [Google Scholar]
- Active Power, Austin, Texas; Group, S.M. Thermal and Compressed-Air Storage System Provides Alternative to UPS Batteries. Available online: https://www.techbriefs.com/component/content/article/tb/pub/briefs/mechanics-and-machinery/332 (accessed on 28 October 2022).
- Congedo, P.M.; Baglivo, C.; Panico, S.; Mazzeo, D.; Matera, N. Optimization of Micro-CAES and TES Systems for Trigeneration. Energies 2022, 15, 6232. [Google Scholar] [CrossRef]
- Anierobi, C.C.; Bhattacharya, K.; Canizares, C.A. Behind-the-Meter Compressed Air Energy Storage Feasibility and Applications. Electr. Power Syst. Res. 2020, 189, 106630. [Google Scholar] [CrossRef]
- Thanos, D.; Maragkaki, A.; Venieri, D.; Fountoulakis, M.; Manios, T. Enhanced Biogas Production in Pilot Digesters Treating a Mixture of Olive Mill Wastewater and Agro-Industrial or Agro-Livestock By-Products in Greece. Waste Biomass Valor 2021, 12, 135–143. [Google Scholar] [CrossRef]
- Castellani, B.; Morini, E.; Nastasi, B.; Nicolini, A.; Rossi, F. Small-Scale Compressed Air Energy Storage Application for Renewable Energy Integration in a Listed Building. Energies 2018, 11, 1921. [Google Scholar] [CrossRef] [Green Version]
- Romero-Fiances, I.; Livera, A.; Theristis, M.; Makrides, G.; Stein, J.S.; Nofuentes, G.; de la Casa, J.; Georghiou, G.E. Impact of Duration and Missing Data on the Long-Term Photovoltaic Degradation Rate Estimation. Renew. Energy 2022, 181, 738–748. [Google Scholar] [CrossRef]
- Theristis, M.; Livera, A.; Micheli, L.; Ascencio-Vásquez, J.; Makrides, G.; Georghiou, G.E.; Stein, J.S. Comparative Analysis of Change-Point Techniques for Nonlinear Photovoltaic Performance Degradation Rate Estimations. IEEE J. Photovolt. 2021, 11, 1511–1518. [Google Scholar] [CrossRef]
- Theristis, M.; Stein, J.S.; Deline, C.; Jordan, D.; Robinson, C.; Sekulic, W.; Anderberg, A.; Colvin, D.J.; Walters, J.; Seigneur, H.; et al. Onymous Early-Life Performance Degradation Analysis of Recent Photovoltaic Module Technologies. Prog. Photovolt. Res. Appl. 2022. [Google Scholar] [CrossRef]
- Früh, W.-G. From Local Wind Energy Resource to National Wind Power Production. AIMSE 2015, 3, 101–120. [Google Scholar] [CrossRef]
- Theristis, M.; Papazoglou, I.A. Markovian Reliability Analysis of Standalone Photovoltaic Systems Incorporating Repairs. IEEE J. Photovolt. 2014, 4, 414–422. [Google Scholar] [CrossRef]
- Arnaoutakis, G.E.; Papadakis, N.; Katsaprakakis, D. CombiCSP: A Python Routine for Dynamic Modeling of Concentrating Solar Power Plants. Softw. Impacts 2022, 13, 100367. [Google Scholar] [CrossRef]
- Früh, W.-G.; Trigg, C.; Jacob, R. A Model for Optimum Prioritisation of Energy Storage Use. I: Optimum Local Use of Local Generation. REPQJ 2022, 20, 301–306. [Google Scholar] [CrossRef]
- Huld, T.; Müller, R.; Gambardella, A. A New Solar Radiation Database for Estimating PV Performance in Europe and Africa. Sol. Energy 2012, 86, 1803–1815. [Google Scholar] [CrossRef]
- Panayiotou, G.; Kalogirou, S.; Tassou, S. Design and Simulation of a PV and a PV–Wind Standalone Energy System to Power a Household Application. Renew. Energy 2012, 37, 355–363. [Google Scholar] [CrossRef]
- Katsaprakakis, D.A.; Papadakis, N.; Christakis, D.G.; Zervos, A. On the Wind Power Rejection in the Islands of Crete and Rhodes. Wind Energy 2007, 10, 415–434. [Google Scholar] [CrossRef]
- Nikolakakis, T.; Fthenakis, V. Compressed Air Energy Storage Models for Energy Arbitrage and Ancillary Services: Comparison Using Mixed Integer Programming Optimization with Market Data from the Irish Power System. Energy Technol. 2018, 6, 1290–1301. [Google Scholar] [CrossRef]
- Hany Elgamal, A.; Kocher-Oberlehner, G.; Robu, V.; Andoni, M. Optimization of a Multiple-Scale Renewable Energy-Based Virtual Power Plant in the UK. Appl. Energy 2019, 256, 113973. [Google Scholar] [CrossRef]
- Katsaprakakis, D.A.; Dakanali, I.; Condaxakis, C.; Christakis, D.G. Comparing Electricity Storage Technologies for Small Insular Grids. Appl. Energy 2019, 251, 113332. [Google Scholar] [CrossRef]
- Katsaprakakis, D.A.; Proka, A.; Zafirakis, D.; Damasiotis, M.; Kotsampopoulos, P.; Hatziargyriou, N.; Dakanali, E.; Arnaoutakis, G.; Xevgenos, D. Greek Islands’ Energy Transition: From Lighthouse Projects to the Emergence of Energy Communities. Energies 2022, 15, 5996. [Google Scholar] [CrossRef]
- Kim, Y.M.; Favrat, D. Energy and Exergy Analysis of a Micro-Compressed Air Energy Storage and Air Cycle Heating and Cooling System. Energy 2010, 35, 213–220. [Google Scholar] [CrossRef] [Green Version]
- Wang, S.; Chen, G.; Fang, M.; Wang, Q. A New Compressed Air Energy Storage Refrigeration System. Energy Convers. Manag. 2006, 47, 3408–3416. [Google Scholar] [CrossRef]
- Papadakis, N.; Reynolds, N.; Pharaoh, M.W.; Wood, P.K.C.; Smith, G.F. Strain Rate Dependency of the Shear Properties of a Highly Oriented Thermoplastic Composite Material Using a Contacting Displacement Measurement Methodology—Part B: Shear Damage Evolution. Compos. Sci. Technol. 2004, 64, 739–748. [Google Scholar] [CrossRef]
- Baker, J. New Technology and Possible Advances in Energy Storage. Energy Policy 2008, 36, 4368–4373. [Google Scholar] [CrossRef]


| Scenario | PV | WT | Battery | LOLP (%) | Eunused (kWh) |
|---|---|---|---|---|---|
| B-1 | 40 | 1 | 23 | 1.95% | 172.39 |
| B-2 | 30 | 1 | 27 | 1.97% | 189.54 |
| B-3 | 30 | 2 | 11 | 1.99% | 168.46 |
| B-4 | 20 | 2 | 17 | 1.90% | 160.75 |
| B-5 | 15 | 3 | 10 | 1.97% | 157.76 |
| Scenario | PV | WT | μ-CAES (Wh) | LOLP (%) | Eunused (kWh) |
|---|---|---|---|---|---|
| C-1 | 40 | 1 | 9840 | 1.84% | 406.84 |
| C-2 | 30 | 1 | 10,320 | 1.90% | 444.81 |
| C-3 | 30 | 2 | 7920 | 1.98% | 328.35 |
| C-4 | 20 | 2 | 8640 | 1.86% | 345.02 |
| C-5 | 15 | 3 | 7440 | 1.94% | 289.62 |
| Annual Demand Statistics | |
| Annual peak power demand (kW) | 2.63 |
| Annual minimum power demand (KW) | 0.20 |
| Annual electricity consumption (MWh) | 4.77 |
| Average daily consumption (kWh) | 9.71 |
| Annual Production Statistics | |
| Annual wind turbine production (MWh) | 3.78 |
| Annual photovoltaics production (MWh) | 8.08 |
| Annual unsatisfied energy (MWh) | 0.32 |
| Annual energy supplied to the user (MWh) | 2.14 |
| Annual unused energy (MWh) | 6.88 |
| Total production (MWh) | 11.87 |
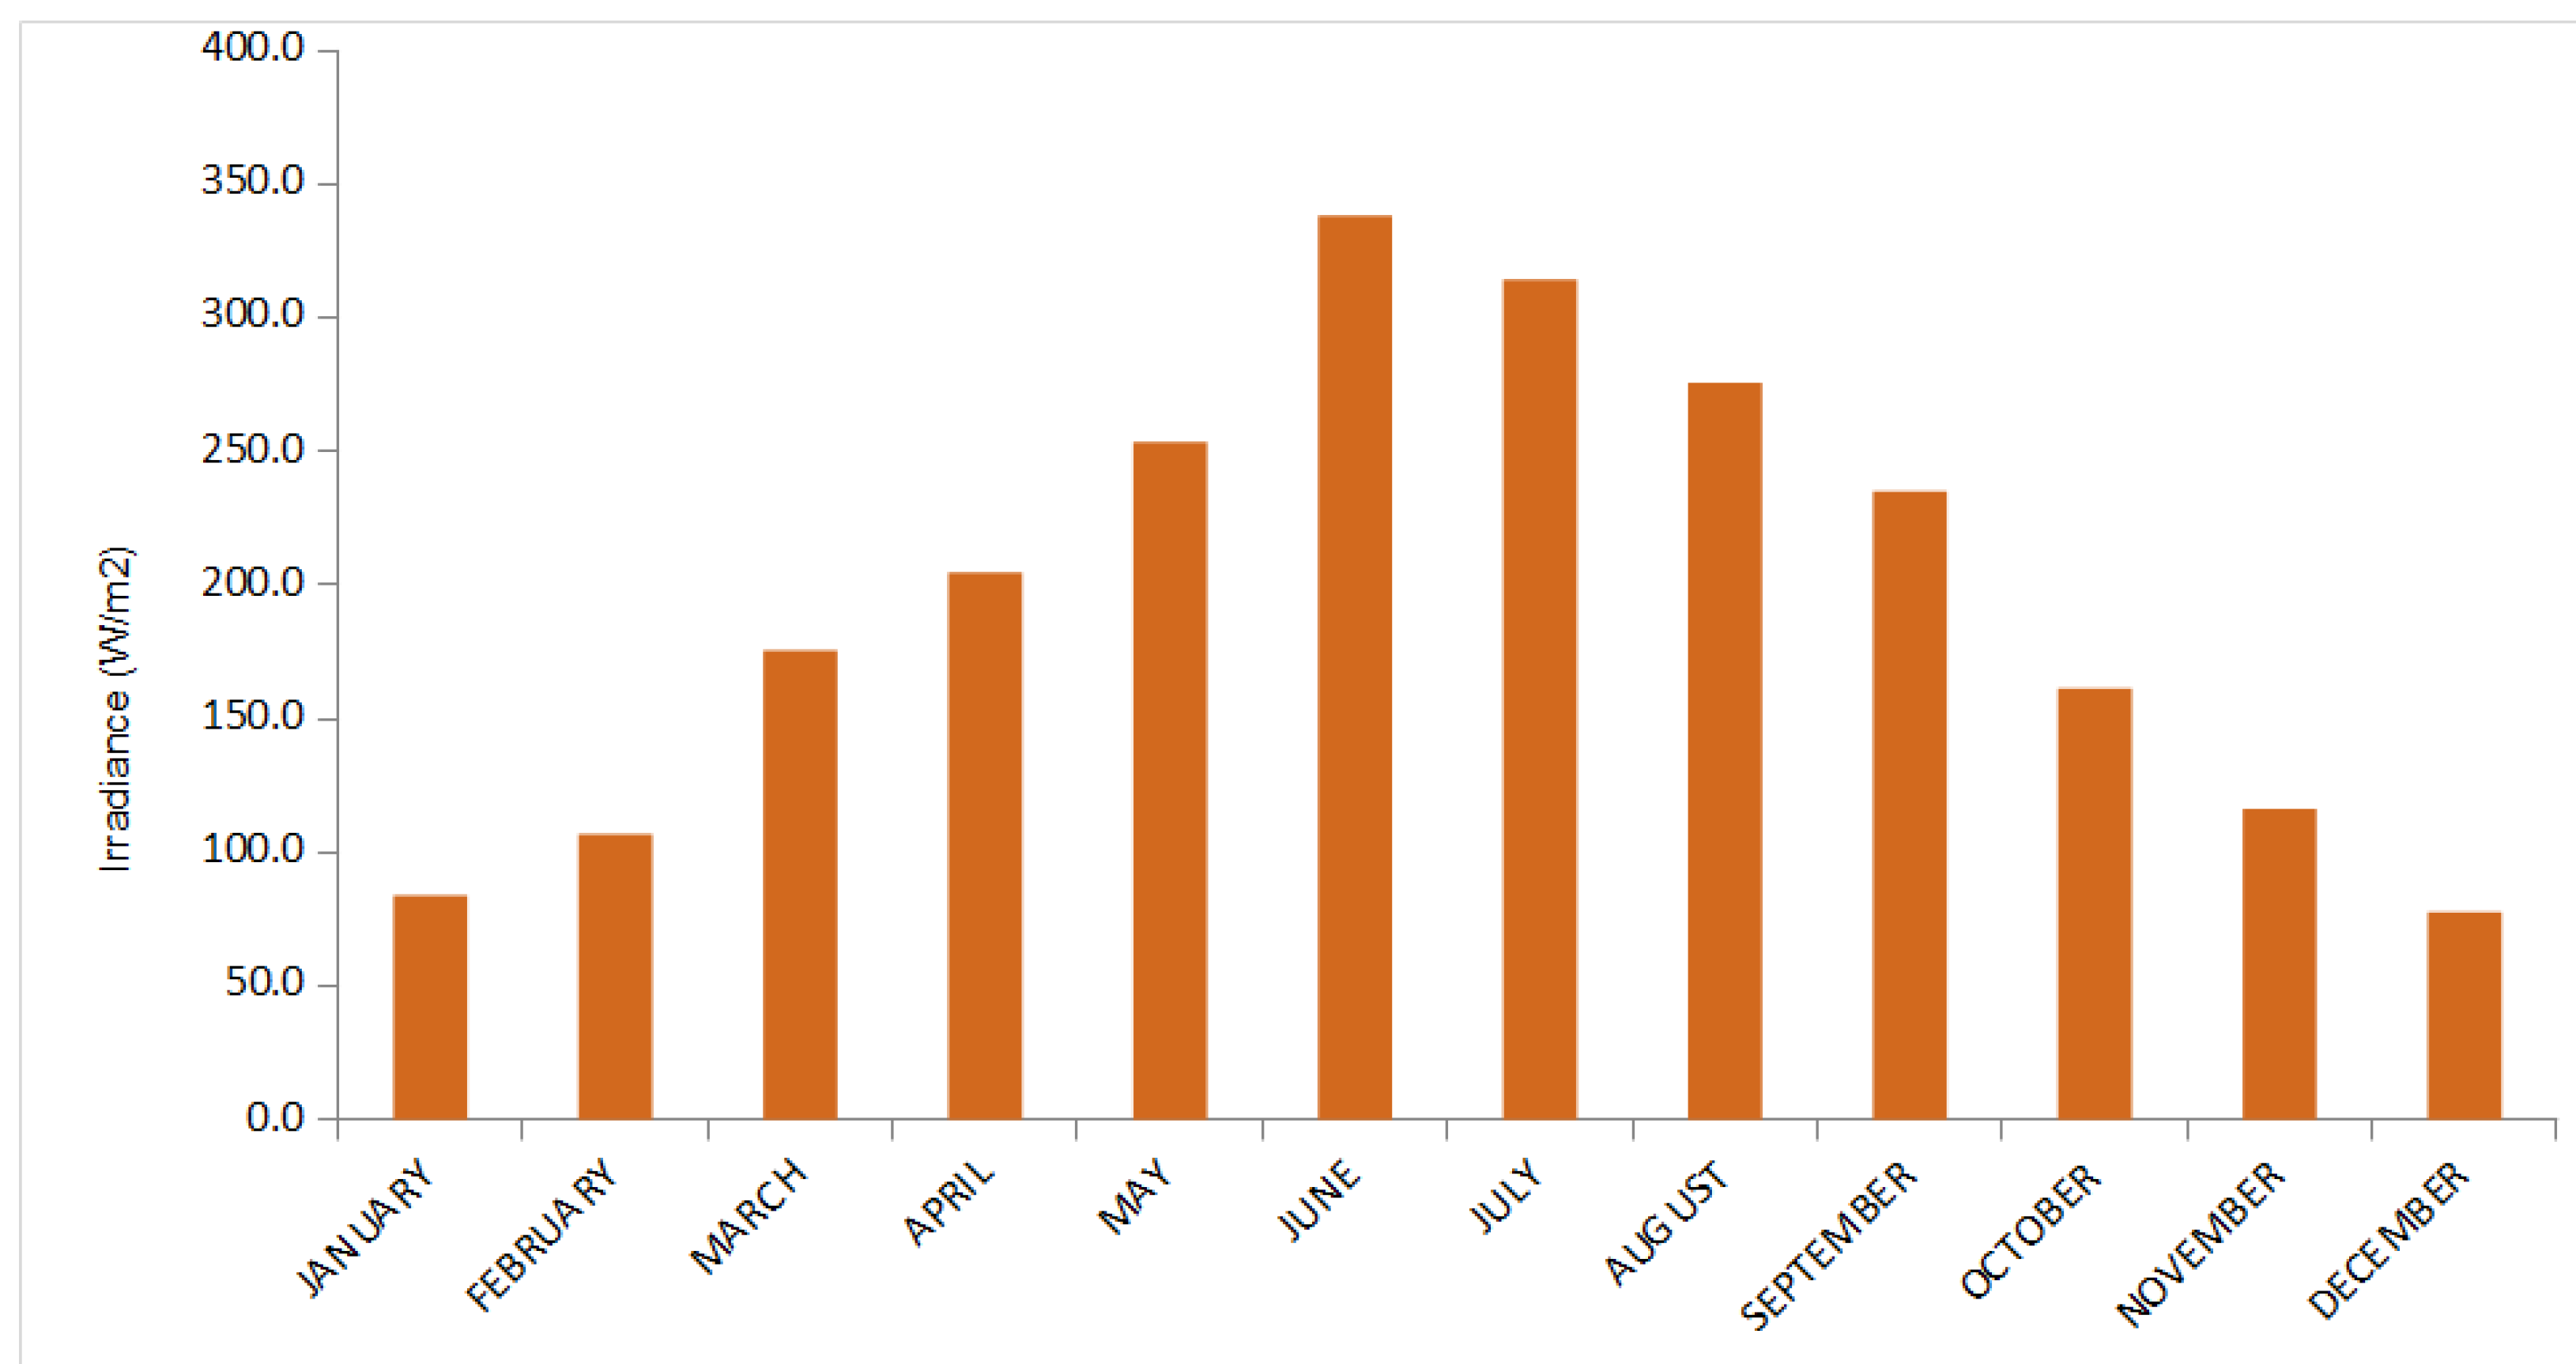
| Month | Gh (W/m2) | Ws (m/s) | PV (Wh) | WT (Wh) | Hybrid (Wh) |
|---|---|---|---|---|---|
| Jan | 84.0 | 2.87 | 418 | 516 | 934 |
| Feb | 107.0 | 2.47 | 533 | 412 | 945 |
| Mar | 175.7 | 2.70 | 860 | 439 | 1299 |
| Apr | 204.8 | 2.71 | 991 | 439 | 1428 |
| May | 253.7 | 1.85 | 1193 | 239 | 1432 |
| Jun | 338.1 | 2.53 | 1562 | 391 | 1953 |
| Jul | 314.4 | 3.38 | 1428 | 603 | 2031 |
| Aug | 275.9 | 3.38 | 1257 | 354 | 1611 |
| Sep | 235.1 | 2.33 | 1081 | 492 | 1574 |
| Oct | 161.5 | 2.94 | 763 | 297 | 1060 |
| Nov | 116.4 | 2.13 | 563 | 357 | 921 |
| Dec | 77.8 | 3.35 | 388 | 619 | 1007 |
Disclaimer/Publisher’s Note: The statements, opinions and data contained in all publications are solely those of the individual author(s) and contributor(s) and not of MDPI and/or the editor(s). MDPI and/or the editor(s) disclaim responsibility for any injury to people or property resulting from any ideas, methods, instructions or products referred to in the content. |
© 2023 by the authors. Licensee MDPI, Basel, Switzerland. This article is an open access article distributed under the terms and conditions of the Creative Commons Attribution (CC BY) license (https://creativecommons.org/licenses/by/4.0/).
Share and Cite
Arnaoutakis, G.E.; Kocher-Oberlehner, G.; Katsaprakakis, D.A. Criteria-Based Model of Hybrid Photovoltaic–Wind Energy System with Micro-Compressed Air Energy Storage. Mathematics 2023, 11, 391. https://doi.org/10.3390/math11020391
Arnaoutakis GE, Kocher-Oberlehner G, Katsaprakakis DA. Criteria-Based Model of Hybrid Photovoltaic–Wind Energy System with Micro-Compressed Air Energy Storage. Mathematics. 2023; 11(2):391. https://doi.org/10.3390/math11020391
Chicago/Turabian StyleArnaoutakis, Georgios E., Gudrun Kocher-Oberlehner, and Dimitris Al. Katsaprakakis. 2023. "Criteria-Based Model of Hybrid Photovoltaic–Wind Energy System with Micro-Compressed Air Energy Storage" Mathematics 11, no. 2: 391. https://doi.org/10.3390/math11020391