Article

Can FinTech Applied to Payments Improve Consumer Financial Satisfaction? Evidence from the USA

1
The Academy of China Open Economy Studies, University of International Business and Economics, Beijing 100029, China
2
School of International Trade and Economics, University of International Business and Economics, Beijing 100029, China
3
Department of Big Data and Internet, Shenzhen Technology University, Shenzhen 518118, China
*
Authors to whom correspondence should be addressed.
Mathematics 2023, 11(2), 363; https://doi.org/10.3390/math11020363
Submission received: 19 December 2022 / Revised: 2 January 2023 / Accepted: 9 January 2023 / Published: 10 January 2023
(This article belongs to the Section Financial Mathematics)

Abstract

:
The rapid development of financial technology (FinTech) has profoundly affected consumers’ financial life, especially their financial satisfaction. The advancement of FinTech has given momentum to the development of mobile payments to some extent. The objective of this study is to investigate the effects of FinTech applied to payments on consumer financial satisfaction utilizing data from the U.S. 2015 and 2018 National Financial Capability Study (NFCS). The method of probit regression is utilized to perform more accurate estimates since the variable of consumer financial satisfaction is non-continuous and ordered. The empirical results of this study indicate that FinTech positively contributes to consumer financial satisfaction. In addition, this study selects financial education and financial capability as mediating variables to explore the possible influence channels between the development of mobile payments and the increase in consumer financial satisfaction. The mediating effects analysis demonstrates that FinTech positively affects financial education and financial capability, ultimately increasing consumer financial satisfaction. These findings have implications for consumer policymakers when promoting FinTech to consumers and helping them increase their financial satisfaction through mobile payments.

1. Introduction

Financial technology (FinTech) has permeated every facet of the financial sector during the past ten years [1], and affected the transformation of investment and financing modes as well as consumers’ payment methods [2]. Relying on third-party payment platforms, mobile payment methods have been favored by increasing consumers for their advantages of convenient transactions, quick payment, portability, and anti-counterfeiting [3]. Furthermore, previous studies illustrated that mobile payments can be used to represent the form of impact of FinTech on general consumers [4]. Thus, this study utilizes mobile payments as a quantifiable variable to explore the roles of FinTech applied to payments in consumer financial satisfaction. Prior research has suggested that using mobile payments enables to promote consumer financial satisfaction [5].
In extant studies, FinTech is defined broadly as digital technologies using blockchain and big data, which can improve the operational efficiency of the financial system and promote the integration of financial services with information and communication technologies [6,7]. The upsurge of mobile payments can be considered as a significant manifestation of the development of FinTech, and an important derivative branch of the FinTech sector. The advancement of disintermediation has made cashless societies and technological innovations gain increasing popularity around the world [8]. In this study, mobile payments are defined as using mobile phones, pads, and other mobile terminals to pay bills, covering a more elaborate scope than cashless payments at the conceptual level. According to the report data of the People’s Bank of China, the overall quantity of mobile transactions in China has overtaken the total amount of bank card transactions by 43%. While the widespread acceptance of physical bank cards may inhibit the growth of mobile payments in the short term in some regions, such as Western Europe [9], the convergence of retail operators and cutting-edge information technology makes the application of mobile payments commercially promising [1]. In addition to the aggregate amount of mobile payments going up, the number of users using mobile payments is also growing. In terms of the Survey of Internet Development in China conducted by China Internet Network Information Center (CNNIC), China now has 904 million users of online payments, making up 87.6% of all Internet users worldwide. With rapidly evolving FinTech offering more innovative financial services and products, The Five-Year Statistical Report on China’s Internet Development released in 2018 shows that Internet wealth management users are continuing to grow from 78.49 million in 2014 to 1.5 billion in 2018. In the United States, credit cards have always been favored by consumers. The National Consumer Statistics Agency found that American consumers’ annual credit card penetration rate exceeded 80% in 2020. Although during COVID-19, American credit card issuers did not feel any signs of economic recession, and credit cards became more popular. According to statistics from Bank of America, in June 2022, credit card expenditures increased by 16% year on year. However, while providing convenience for consumption, credit cards will charge high-interest rates when the balance is not fully paid off, which makes credit card overdraft an expensive form of debt. Based on the Federal Reserve Bank of New York, in 2021, the credit card debt increased by $100 billion, with a growth rate of 13%. In the second quarter of 2022, credit card balances increased by $46 billion. The continued growth of Internet wealth management users has provided an opportunity for the rapid spread of mobile payments. It has become common for small, medium, and large merchants to register and set up QR codes to receive payments and create online transfer payment methods. The prevalence of cashless collection operations has given consumers the feasibility of using cashless electronic payments in the retail sector. Mobile payments are gaining prominence and gradually becoming the mainstream consumer payment method.
A large and growing body of literature has investigated the determinants of consumer financial satisfaction in the past decades. From a conceptual perspective, financial satisfaction was described as an investor’s perspective on their present financial status [10]. In addition, consumer financial satisfaction is an important component of subjective wellbeing. More specifically, enhancing consumer satisfaction with their financial situation can make consumers feel happier [11]. Furthermore, factors affecting financial satisfaction have many overlaps with those influencing consumer subjective wellbeing, such as age, whether they are married, and income [12], in addition to risk attitudes [13,14]. As early as 2001, Hsieh found that income and age have non-linear effects on consumer financial satisfaction, and this effect remained significant after controlling other social variables such as gender, race, physical condition, and the like. Plagnol [15] further indicated that consumer financial satisfaction fluctuates with age and exists at a peak at midlife. In terms of risk attitudes, Joo and Grable [14], in their construction of a framework of factors influencing financial satisfaction, suggested that consumers who are more risk tolerant tend to be more satisfied with their financial situation.
In contemporary financial markets, consumer financial capability to deal with risk and seize opportunities could no longer be ignored. Prior studies have illustrated that consumers will benefit directly from the increased financial capacity [16,17]. Financial behaviors and financial literacy are, conceptually speaking, two crucial elements of financial capability [18]. According to the original definition, financial literacy relates to an individual’s ability to manage money. As financial literacy became increasingly important, it was further described as the synthesis of current financial knowledge, financial awareness, and future financial attitudes [19]. According to several studies, consumers who engage in better financial practices are likely to be happier with their financial circumstances [17]. In other words, desirable financial behaviors contribute to financial satisfaction. Receiving financial education either actively or passively can also enhance consumer financial knowledge and influence their investment decisions, financial mindset, asset allocation preferences, and other financial behaviors, which could affect how financially satisfied they are. More specifically, consumers’ access to sustainable financial education positively contributes to their satisfaction [20].
According to previous studies, mobile payments will positively contribute to consumer general satisfaction [5]. However, even if overall satisfaction is represented as financial satisfaction, it cannot be simply assumed that mobile payments will positively affect consumer financial satisfaction until a systematic empirical analysis is conducted. Consumer trust has a positive impact on behavioral intention to make mobile payments [2], and is significantly and positively associated with consumer satisfaction [21]. Some evidence reveals that innovative mobile payments could entail perceived risk for consumers and reduce their trust in FinTech services [22], which may decrease consumer financial satisfaction. Therefore, under the influence of many uncertainties, it is imperative to explore the factors and transmission pathways of the impact of FinTech on consumer financial satisfaction. The significance of investigating FinTech and consumer financial satisfaction can also be demonstrated for the following reasons. First, extant studies showed that financial satisfaction is an essential aspect of consumer happiness [15,23]. The effective identification of these factors can help consumers use mobile payments to enhance their satisfaction and thus their wellbeing. Second, it can inspire the FinTech sectors and help them gain an advantageous position in the competition. Third, prior studies have proven that the promotion of Fintech can alleviate geographic poverty [24], and support government policies [25,26]. This study can provide enlightenment for policymakers when promoting FinTech to consumers, which has important practical significance.
Although extensive research has been separately carried out on the impact of FinTech and consumer financial satisfaction, only a few studies have used empirical research to date to examine the connection between FinTech applied to payments and consumer financial satisfaction. This study will investigate the factors and influence channels of FinTech affecting consumer financial satisfaction to fill the gap in the theoretical fields. Furthermore, to provide a more refined explanation for the reasons why FinTech positively contributes to financial satisfaction, financial education and financial capability will be investigated as vital mediators.
The purpose of this study is to investigate the impacts of FinTech applied to payments on consumer financial satisfaction and further analyze the possible influence channels. Hence, this study contributes to the literature on the associations between FinTech applied to payments and consumer financial satisfaction, which differs from extant studies that only consider general determinants of financial wellbeing. Meanwhile, this study also explores the mediating roles of financial education and financial capability, which further enriches the literature in related fields. The remainder of this study will proceed as follows, using data from the National Financial Capability Study (NFCS) in 2015 and 2018. Section 2 reviews prior literature on consumer financial satisfaction and how mobile payments affect consumer financial satisfaction. Furthermore, the hypotheses of this study are developed in this section as well. Section 3 introduces the selected data, the variable specifications, and the empirical methods. Section 4 displays empirical findings and explores the mediating roles of financial education and financial capability. The study’s conclusion and its pertinent recommendations are presented in Section 5.

2. Previous Literature Review and Hypotheses

2.1. Financial Satisfaction

Based on Maslow’s notion of the hierarchy of needs, as people’s living standards and quality of life continue to rise, the level of people’s needs gradually rises as well, which can be reflected as an increase in people’s requirements for satisfaction. Since financial satisfaction is an indispensable part of an individual’s subjective wellbeing or overall satisfaction [11], the importance of studying financial satisfaction has become increasingly prominent. As a relatively complex concept, previous studies have explored financial satisfaction in a variety of ways. In terms of conceptualization, Ali et al. [10] depicted a long-term, sustainable perspective on the definition of financial satisfaction that reflects consumers’ perceptions of (a) current and future financial needs, (b) risk-averse attitudes, (c) precautionary funding needs, (d) loss-absorbing capacity and (e) perceptions of financial behavior. Financial satisfaction was identified as a mediator variable between salary and general satisfaction [27]. They demonstrated in their study that such an influence path exists in practice, that is, income first affects financial satisfaction and then transmits to overall satisfaction.
Much of the extant literature pays particular attention to the methods to quantify financial satisfaction. Veblen [28] concluded that individuals can subjectively compare their financial situation with that of their perceived peers in his study of utility. Joo and Grable [14] extracted several indicators to measure financial satisfaction and composed them into a theoretical framework. Based on this, Vera-Toscano et al. [29] put forward a theory that consumer financial satisfaction can be measured by asking consumers directly. Considering that individuals can discern their levels of financial satisfaction [22,30], the potential variables can be represented in terms of the degree of strength or weakness by direct questioning or by administering a questionnaire. Most of the literature on financial satisfaction has used this approach. Xiao and Porto [31] proposed that the Likert-type scale can be used to measure financial satisfaction. The results of these surveys can be compared with each other, provided that the participating consumers evaluate their satisfaction rationally and respond correctly.
In terms of influencing factors, besides the common influencing factors such as age, income, marital status, level of physical health, and risk attitude, there are many subsequent additions to the literature on factors affecting financial satisfaction. Kim et al. [32] emphasized the importance of receiving a comprehensive financial education by explaining the mediating role of financial education in the relationship between student loan holding and financial satisfaction, in which financial education is divided into formal schooling as well as informal financial education. Improving financial knowledge, financial literacy, and long-term financial education plays a remarkably important role in effectively enhancing financial satisfaction. Consumers with higher self-rated financial literacy tend to be more sensitive to the perception of financial satisfaction and tend to have higher financial satisfaction through their control of financial behaviors and their attitudes toward expenditure and savings.

2.2. Mobile Payments and Consumer Financial Satisfaction

With the continuous integration of “finance” and “technology”, the barriers to payment services in various countries are gradually breaking down and a new stage of development of interconnection is underway. There have been several previous studies on the specific areas of FinTech including the ubiquity of mobile payments [33,34]. Allen et al. [33] demonstrated that consumers who are currently well-served tend to prefer FinTech for continued access to quality services. Agarwal et al. [1] elaborated on the advantages of mobile payments and cited extensive data to demonstrate the popularity of mobile payments among consumers. Farag and Johan [34] highlighted that consumers are more conscious of their privacy protection while enjoying the perceived convenience of mobile payments in the FinTech era. In terms of empirical evidence, several studies have already explored the relationships between mobile payments and consumer general satisfaction, using different countries as a landing point [35]. For instance, Mainardes, Costa, et al. [35] collected data from 294 FinTech consumers through an online questionnaire and used partial least squares to analyze the data with structural equation modeling to conclude that innovative payment methods derived from FinTech are more likely to increase satisfaction if they are used by consumers who are capable of perceiving usefulness. Building on the extant literature, this study proposes the following hypothesis:
Hypothesis 1 (H1). 
FinTech applied to payments positively contributes to consumer financial satisfaction.

2.3. The Mediating Role of Financial Education and Financial Capability

Lack of financial education has long been considered one of the culprits for consumers’ poor savings rates, high debt leverage, and greater financial stress. Financial education improves objective and subjective financial literacy, which in turn improves consumer financial decision-making [36]. Financial education can be defined as any program that helps consumers figure out (a) their understanding of financial concepts, (b) their attitudes toward the past, present, or future financial affairs, and (c) hands-on financial behaviors they can perform in response to financial events [37]. A survey of the financial education system at the beginning of the 21st century divides financial education in the United States into three major programs: First, educational programs for school-age students aimed at developing financial literacy in the areas of money management, saving, and budgeting; second, financial education training provided by employers that involve employees before and after retirement; and third, financial education program training in the area of investment, such as real estate investment, and the like. Since it is not easy to reach a unified approach to distinguish financial education, the extant literature studying financial education aspects tends to be diverse in terms of experimental settings. Gnan et al. [26] concluded from a quantitative meta-analysis of 37 experiments designed on financial education received by youth in schools that financial education was remarkably successful in improving financial literacy. Prior research has examined the effect of time spent in education on consumer financial behaviors, using the length of time they spent in financial education as evidence [20]. To be more specific, Chen et al. [20] put forward the concept of sustainable financial education, building on the research of other scholars who studied short periods of financial education (averaging about 12 h) and adding factors such as the time or money continued to be invested after receiving formal financial education, concluding that consumers who continue to receive financial education have a higher assessment of their financial satisfaction. This enriches the research on financial education in the time continuity area. Bernheim and Garrett [38] verified the effectiveness of financial education by distinguishing how or where consumers received their financial education, such as by having discussions in seminar rooms or having a self-directed study of educational materials. To assess the possible effects of financial education, they contrasted consumers who received it with those who were similar but did not.
Previous studies have suggested that financial education appears to have a favorable impact on consumer financial satisfaction [20,31,39], and the adoption of mobile payments can boost consumer financial satisfaction [4]. As can be seen in numerous studies of modern societies with rapid FinTech development, the vast majority of prior studies imply that educators or policymakers should be encouraged to formulate policies to improve national or regional financial education levels as soon as possible [31]. At the present time when FinTech has innovated numerous financial products and services, consumers are facing a much more complex financial environment than in the past, and they may tend to be proactive in receiving financial education in order to make more rational financial decisions and avoid non-essential financial losses [37]. Whether active or passive, there may be some weak causal links between mobile payments, great products of the rapid development of FinTech, and financial education, a progressive approach in the ever-evolving financial markets. Therefore, to further explore the causal chain, the following hypothesis is proposed in this study.
Hypothesis 2 (H2). 
Financial education mediates the relationships between FinTech applied to payments and consumer financial satisfaction.
Moreover, consumers are becoming conscious that improving their financial capability will not only benefit them directly but will also enable them to exert greater leverage in the retail marketplace [16], which in turn may help enhance their financial satisfaction. Financial capability is defined as an individual’s ability to manage their finances, choose and handle financial services, and make sound financial judgments. Atkinson et al. [40] examined consumer financial capability by designing questionnaires or conducting interviews and improved the reliability of the empirical results by reducing the weight of some specific regions, such as the ethnic minority sample in the UK [40]. Xiao, et al. [17] combined three sets of variables to construct financial capability indicators, and the results indicate that financial satisfaction is positively associated with perceived financial capability.
Similarly, the development of FinTech enhances financial capability, and financial capability raises consumer financial satisfaction [17]. Financial capability also has the potential to act as a mediating variable to transmit the effect of mobile payments on consumer financial satisfaction. To provide a more refined explanation, this study proposes the following hypothesis:
Hypothesis 3 (H3). 
Financial capability mediates the relationship between FinTech applied to payments and consumer financial satisfaction.

3. Methodology

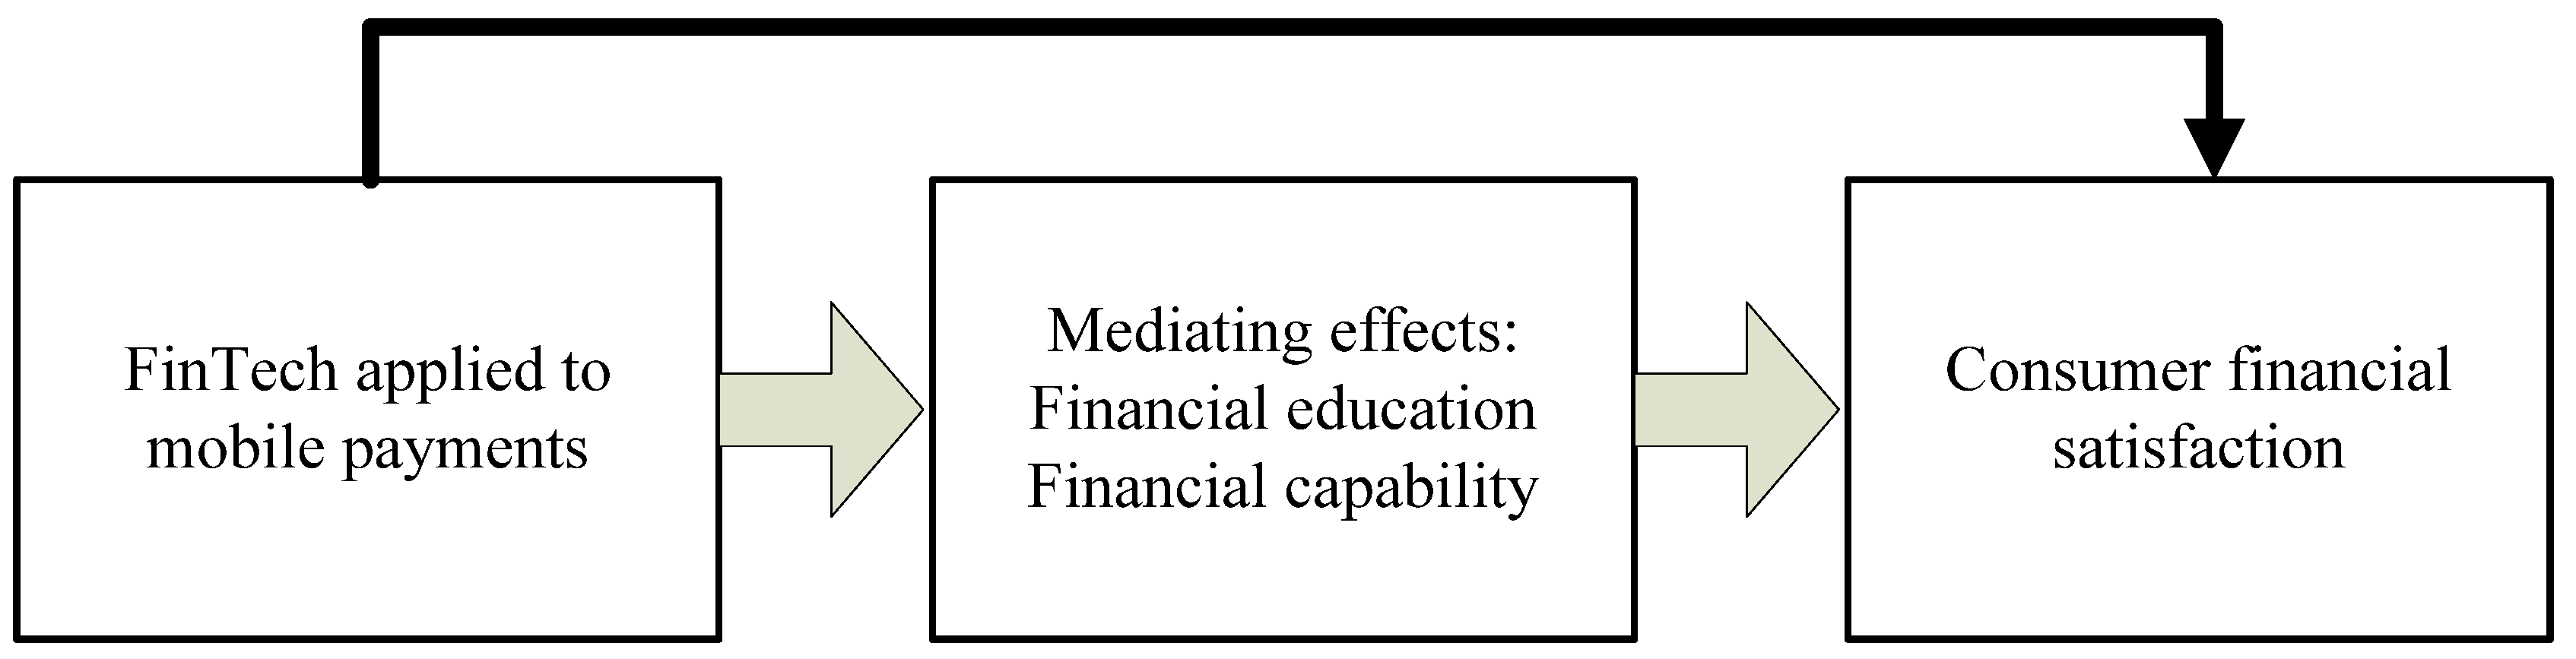
3.1. The Conceptual Framework

This study aims to explore the nexus between FinTech applied to payments and consumer financial satisfaction. First, the data and variables are described, and the econometric estimation is specified. Second, this study performs correlation analysis among dependent, independent, and other primary variables. Third, the baseline regressions between mobile payments and consumer financial satisfaction are performed, and the robustness is verified as well. Additionally, the mediating roles of financial education and financial capability are further investigated. Thus, the conceptual framework of this study is displayed in Figure 1.

3.2. Data

In this study, the data are from the state-by-state tracking dataset of the NFCS in 2015 and 2018. The NFCS is a national online survey of more than 25,000 US adults conducted via questionnaire. The survey results are weighted to represent the census distribution based on the American Community Survey. The questionnaire’s question set includes age, number of children, current living arrangements, financial satisfaction, marital status, whether or not they work part-time, annual income, and the like. More specifically, Agarwal and Chua [4] suggested that mobile payments can be used to represent the impact of FinTech on the general consumer in their study of the impact of FinTech on household finance. Thus, this study will extract the data related to mobile payment from the questionnaire. Since only the NFCS in 2015 and 2018 incorporates questions related to consumer mobile payments, the research samples in this study come from the above two waves of NFCS.
Based on the selection of variables, some samples with missing values are excluded from the data processing in this study to ensure the accuracy and reliability of the empirical results. In detail, the original sample size for the NFCS in 2015 and 2018 is 54,655. Following the approach of Xiao et al. [17], the excluded samples include those who responded “don’t know” or “prefer not to say” when asked how frequently they use mobile payments, and those who answered “don’t know” or “prefer not to say” about their satisfaction with their financial situation. Thus, the sample size in this study is 53,038.

3.3. Variables

Following the study conducted by Xiao and Porto [31], consumer financial satisfaction is measured on a scale of 1 to 10, that is, 1 is “Not satisfied at all” and 10 is “Extremely satisfied”. According to Agarwal and Chua [4], the independent variable of FinTech applied to payments is proxied by the use of mobile payments. In the questionnaire, the question is worded, “How often do you use your cell phone to show the QR code or scan the retailer’s code to make mobile payments at the checkout?” The original responses range from 1 (Frequently) to 3 (Never). In this study, the variable of mobile payments is re-coded as 1 if the answer is 3, and 3 if the answer is 1. Therefore, the new variable of mobile payments ranges from 1 (Never) to 3 (Frequently). In addition, for the mediating variable of financial education, if consumers received financial education in high school, college, work, and the military, the variable is coded as 1, otherwise 0. Subjective financial ability is measured by the question “Do you consider yourself to be good at handling day-to-day financial matters?”. The responses range from 1 (Very bad) to 7 (Very good). Objective financial capability is measured by a 5-point scale. The respondents were asked five questions related to income and expenditure, debt repayment, emergency savings, child education savings as well as saving for retirement, if they performed any of these behaviors, the variable is encoded 1, otherwise 0. The financial capability index is equal to a sum of Z-scores of objective financial capability and subjective financial capability. In addition, following the approaches conducted by Xiao and Porto [31] and Chen et al. [13], the variables of gender, age, education levels, marital status, number of financially dependent children, ethnicity, risk attitude, whether participating in financial markets, credit situations, annual income, and subjective math capability are controlled. All variables are specified in Table 1.

3.4. Estimation Method

Since both the dependent variable of consumer financial satisfaction and the independent variable of mobile payments are discrete and ordered, and the method of ordinary least squares (OLS) is generally used for continuous variables, while the method of ordered probit regression is utilized in this study. Meanwhile, the OLS regression is also performed, and the results serve as references. Thus, the econometric specification in this study is as follows:
f i n s a t i = α 0 + γ i m o b p a y i + k = 1 M φ k c v k , i + ε i  
In Equation (1), the subscript i stands for the sampling consumer individual. The dependent variable f i n s a t i represents consumer financial satisfaction, and the independent variable m o b p a y i denotes mobile payments. Meanwhile, α 0 is a constant term, β i and φ k are the coefficients of the independent variable of mobile payments and the control variables, respectively. Moreover, c v k , i is the control variable k, the superscript M of the summation sign is the number of control variables, and ε i is the disturbance term.
Moreover, to examine the influence channels between FinTech applied to payments and consumer financial satisfaction, this study follows the causal stepwise regression test by conducting a three-step regression [41]. Equation (1) is the first step in a three-step regression, and the second step is to regress the mediating variable using mobile payments to determine the significance of the coefficient of mobile payments. The third step is to include the mediating variable based on the first step, and then regress consumer financial satisfaction using both the mediating variable and mobile payments to determine whether the coefficients of mobile payments and the mediating variable are statistically significant.
In this study, financial education and financial capability are selected as mediating variables. Taking financial education as an example (Similar to financial capability), the remaining regression equations are specified as follows:
f i n e d u i = α 0 + γ i m o b p a y i + k = 1 M φ k c v k , i + ε i
f i n s a t i = α 0 + β i m o b p a y i + δ i f i n e d u i + k = 1 M φ k c v k , i + ε i
In Equations (2) and (3), f i n e d u i represents financial education, α 0 and α 0 are constant terms, γ i , β i and δ i are the corresponding coefficients, φ k and φ k are the coefficients of the control variables, ε i and ε i are the disturbance terms.

3.5. Statistical Description

Table 2 presents the results of descriptive statistics. The mean value of consumer financial satisfaction is 5.75 out of 10, which indicates that consumers have a relatively high subjective evaluation of financial wellbeing. The minimum score of consumer financial satisfaction is 1 and the maximum score is 10, with a standard deviation of 2.81, which is greater compared to other variables, indicating that consumers have large variability in their evaluation of financial satisfaction. The average score for mobile payment is 1.35 out of 3, indicating that consumers tend to “never” or “sometimes” use mobile payment.
In terms of control variables, the mean score of 4.95 out of 10 for risk attitudes reveals a lower risk preference among the responding consumers. The variable of participation in financial markets indicates that 33% of consumers are involved in investing in stocks, bonds, other financial products, or other financial activities, which is close to one third of the consumers. In addition, most consumers have confidence in their math skills, reaching an average score of 5.63 out of 7. The average credit record rating score is 3.01 out of 5, illustrating that more respondents rate themselves as having a high credit evaluation. The percentage of male consumers is 44%, 73% are White, and 54% of the consumers are married. In terms of education, 61% of the consumers have attended college or earned a bachelor’s degree. As for age, the largest number of consumers are 65 years old and above, accounting for about 20%.

4. Empirical Results

4.1. Results of Correlation Analysis

Table 3 displays the correlations between the variables of consumer financial satisfaction, mobile payments, risk attitude, participation in financial markets, credit record rating, annual income, and subjective mathematical ability. Most correlations are as expected. Annual income is significantly and positively correlated with consumer financial satisfaction, and so is credit record rating status. Most of the control variables turn out to be significantly and positively related to consumer financial satisfaction, but it is worth noting that there is a negative correlation between subjective mathematical ability and mobile payments. A negative correlation is also observed between credit record rating and mobile payments, with a correlation of −0.08 at the 1% level of significance. One possible explanation is that consumers with higher credit record ratings may tend to purchase risk-free financial products or engage in prudent and conservative financial behaviors. However, the innovative nature of mobile payments is perceived as risky by this group of consumers and therefore may have a negative mindset toward FinTech payment methods. In addition, mobile payments are positively correlated with consumer financial satisfaction, with a correlation coefficient of 0.11 at the 1% level of significance.

4.2. Results of Multiple OLS and Ordered Probit Regression

Table 4 shows the results of regressions of mobile payments on consumer financial satisfaction. In Columns (1) and (2), only selected control variables are incorporated. In Column (3), the variable of mobile payments is included. Furthermore, Column (1) is regressed by the method of OLS. Columns (2) and (3), on the other hand, show the empirical results from the regressions using the ordered probit method. As ordered probit regression is used, no results are available for the constant terms to be reported in Columns (2) and (3). In Column (1), the adjusted R 2 is reported. In addition, since not controlling for differences between U.S. states may lead to heterogeneity and thus weaken the explanatory strength of the empirical results, the dummy variable for U.S. states is controlled in all estimates.
In Column (1), except for the coefficient on the control variable “Age 25 to 34”, all the coefficients on the control variables turn out to be significant at the 1% level of significance. Moreover, the coefficients for different age groups are both positive and negative, indicating that consumer financial satisfaction does not change linearly with age, further verifying previous findings on the nexus between age and consumer financial satisfaction [12,15]. For gender, the coefficient of males is 0.11 at a 1% level of significance, which indicates that males tend to be more financially satisfied than females in terms of financial status. According to Table 1, risk attitude is assigned to the variable according to the degree of risk respondents are willing to take. The results show that the coefficient of risk attitude is 0.27 at a 1% level of significance, which indicates that risk attitude is significantly and positively associated with consumer financial satisfaction, which is consistent with earlier studies [14]. In previous studies, consumer risk tolerance is one of the factors affecting consumer financial satisfaction. Ceteris paribus, increased risk tolerance will increase consumer financial satisfaction [22]. If consumers are closer to being risk-taking, that is, more inclusive of risk exposure, then the higher the risk tolerance is likely to be, and thus financial satisfaction can be enhanced. Besides, in terms of educational attainment, both university bachelor’s degrees, as well as master’s degrees, show a significant negative correlation with consumer financial satisfaction, and it can be speculated that within the range of university bachelor’s degree and above, the higher the educational attainment, the less satisfied one is with one’s financial situation, that is, as the educational attainment decreases, the higher the consumer financial satisfaction [31]. Additionally, the coefficients of annual income and credit record rating levels are 0.25 and 0.57 at a 1% significance level, respectively, indicating that the higher the level of annual income and credit record ratings, the more satisfied consumers presented with their financial status. Subjective mathematical capability is significantly and positively related to consumer financial satisfaction. Regarding marital status, the coefficient is significantly positive, indicating that married consumers are more satisfied with their financial situation compared to unmarried ones. In addition, the coefficient of the number of financially dependent children is −0.04 at a 1% significant level, suggesting that the more financially incapable children raise, the lower the financial satisfaction consumers may have.
The ordered probit regression results in Column (2) show that all coefficients of control variables are significant, including the control variable “Age 25 to 34”, and the signs of positive or negative coefficients are consistent with Column (1). In Column (3), the independent variable, mobile payments, is added. In detail, the coefficients of the control variables remain significant, and the results maintain the same sign as column (1). The coefficient of mobile payments is 0.21 at the 1% significance level, indicating that there is a positive relationship between FinTech applied to payments and consumer financial satisfaction, which is aligned with H1.

4.3. Robustness Check

To test the robustness of the estimation and further prove H1, this study conducts a comprehensive check. First, to eliminate the coincidence of empirical results from specific regression methods, this study substitutes the regression method from OLS regression and ordered probit regression with ordered logit regression, as shown in Column (1). Second, to remove the effect of income differentials, Column (2) excludes outliers with income less than $15,000 or greater than $150,000. Third, to demonstrate the general applicability of the empirical results to different regions, robustness tests for different parts of the U.S. are designed in this study. Columns (3) to (6) apply samples from the Northeastern U.S., Midwestern U.S., Southern U.S., and Western U.S., respectively. Table 5 displays the results of the robustness tests. The results suggest that the coefficients of mobile payments are still significantly positive after excluding outliers, changing the regression method, or applying samples from different regions of the U.S., indicating that the empirical results keep unchanged.

4.4. Mediating Effects of Financial Education and Financial Capability

This study examines the mediating effects of financial education and financial capability based on the stepwise regression method of Baron and Kenny [41]. Table 6 shows the results of the mediating effects.
As is aforementioned, there is a significantly positive relationship between mobile payments and consumer financial satisfaction. The analysis of the mediating role of financial education is as follows: As shown by Column (1), there is a significantly positive association between mobile payments and financial education, implying that consumers who use mobile payments will give more importance to their financial education. As indicated by Column (2), the coefficients of financial education and mobile payments are 0.03 and 0.21 at a 1% significance level, respectively, suggesting that the simultaneous development of financial education and mobile payments will make consumers more satisfied with their financial status. The results corroborate H2 by showing that financial education has played a significant mediating role in the associations between mobile payments and consumer financial satisfaction, and financial education serves as a partial mediator. This mirrors the previous literature that financial education contributes to a greater sense of financial self-efficacy, which in turn enhances financial wellness [31].
For financial capability, since it is measured by a sum of Z-scores of objective and subjective financial capabilities, indicating a continuous variable, the OLS regressions are conducted. In Column (3), the coefficient of mobile payments is significantly positive, indicating that an increase in the frequency of mobile payment utilization results in an increase in consumer financial capability. In Column (4), it can be found that the coefficients of both financial capability and mobile payments are significantly positive. It can be concluded that financial capability can also work as a partial mediator that has a direct or indirect effect on financial satisfaction, thus in line with H3. These findings are consistent with the extant literature, that is, consumers will benefit directly from the increased financial capacity [16,17].

5. Conclusions and Implications

Over the past decade, the development of FinTech has prompted the emergence of many innovative financial services and financial products. This innovative payment method enables consumers to perform payment operations on their mobile devices without using cash, greatly compensating for the shortcomings of traditional cash payments. Utilizing the data from the NFCS in 2015 and 2018, this study aims to identify whether FinTech applied to payments has a direct or indirect impact on consumer financial satisfaction. Financial satisfaction is a measure of subjective financial happiness, and data are obtained through questionnaire statistics. Simultaneously, this study investigates whether financial education and financial capability can work as mediators between FinTech payments and consumer financial satisfaction. The findings show that consumers’ use of mobile payments can enhance their satisfaction with their current financial situation. In addition, both financial education and financial capability can serve as mediating variables in the influence channels from mobile payments to consumer financial satisfaction. Besides, both financial education and financial capability in this study are partially mediating variables, which means that the causal chains constructed by financial education and financial capability are not the only two influence channels. Except for indirect positive effects, FinTech applied to payments can directly and positively affect consumer financial satisfaction.
This study has some shortcomings that could be addressed in further study. First, due to the limitation of data access, this study chooses cross-sectional data to empirically analyze the relationships between FinTech applied to payments and consumer financial satisfaction, but this lacks comparability in vertical dimensions to some extent. Second, this study chooses data on mobile payments from 2015 and 2018 NFCS to represent the impact of FinTech for interpretation. Although such a substitution has theoretical support [4], the fact is that the two conceptions cannot achieve a complete match. However, due to the limitation of the data source, the series of questions on FinTech impacts can not be found in the NFCS. To ensure the completeness of the study, this study uses mobile payments as a proxy variable. Future research can be conducted on top of more rigorous and complete data for the subsequent analysis related to FinTech. Third, this study only selected the ordered probit regression method to explore the significance of the coefficients of the “mobile payments” variable. With further updating of the empirical model or refinement of the data, it is possible to use a complicated but more precise research method in the following studies.
In light of the above findings, this study proposes the following recommendations for enhancing consumer financial satisfaction. To begin with, the government should encourage financial institutions to develop the FinTech business within reasonable limits in terms of policy and continue to facilitate the transformation and upgrading of payment methods. It should also be noticed that while the government slackens the entry threshold of FinTech, complementary regulatory measures must be supplemented to provide protection for consumers and to ensure the reasonable and healthy development of mobile payments. Second, the analysis of mediating effects in this study can also yield insights into how to improve consumer financial satisfaction. Policymakers need to emphasize more on the importance of financial education. Increase investment in financial education and popularize financial education for low and middle-income consumers, such as setting up financial education public service activities or adding relevant university courses, to raise consumer financial knowledge and enable them to make reasonable responses when they encounter financial problems. Finally, for financial institutions, while designing and launching innovative FinTech products, it is important to put in place consumer surveys and feedback. Through analysis of consumer needs and differentiation of consumer groups, product attributes and functions can be refined in a targeted manner. On this basis, financial institutions enable to expand their markets and gain an advantageous position in fierce competition.

Author Contributions

Conceptualization, F.C.; methodology, F.C. and X.D.; resources, X.D.; data collection, X.D.; writing—original draft preparation, F.C. and X.D.; writing—review and editing, F.C. and W.W.; supervision, F.C. and W.W.; project administration, F.C.; funding acquisition, F.C. All authors have read and agreed to the published version of the manuscript.

Funding

This research was funded by the General Research Fund of The Academy of China Open Economy Studies at the University of International Business and Economics (Grant No. 2022GK10).

Institutional Review Board Statement

Not applicable.

Informed Consent Statement

Not applicable.

Data Availability Statement

The datasets analyzed for this study can be found at: http://www.usfinancialcapability.org/downloads.php (accessed on 18 December 2022).

Conflicts of Interest

The authors declare that the research was conducted in the absence of any commercial or financial relationships that could be construed as a potential conflict of interest.

References

  1. Agarwal, S.; Zhang, J. FinTech, lending and payment innovation: A review. Asia Pac. J. Financ. St. 2020, 49, 353–367. [Google Scholar] [CrossRef]
  2. Alkhowaiter, W.A. Use and behavioural intention of m-payment in GCC countries: Extending meta-UTAUT with trust and Islamic religiosity. J. Innov. Knowl. 2022, 7, 100240. [Google Scholar] [CrossRef]
  3. Teo, A.-C.; Tan, G.W.-H.; Ooi, K.-B.; Hew, T.-S.; Yew, K.-T. The effects of convenience and speed in m-payment. Ind. Manag. Data Syst. 2015, 115, 311–331. [Google Scholar] [CrossRef]
  4. Agarwal, S.; Chua, Y.H. FinTech and household finance: A review of the empirical literature. China Financ. Rev. Int. 2020, 10, 361–376. [Google Scholar] [CrossRef]
  5. Zhang, L.; Kim, H. The influence of financial service characteristics on use intention through customer satisfaction with mobile fintech. J. Syst. Manag. Sci. 2020, 10, 82–94. [Google Scholar]
  6. Chen, M.A.; Wu, Q.; Yang, B. How valuable is FinTech innovation? Rev. Financ. Stud. 2019, 32, 2062–2106. [Google Scholar] [CrossRef] [Green Version]
  7. Patel, K.J.; Patel, H.J. Adoption of internet banking services in Gujarat: An extension of TAM with perceived security and social influence. Int. J. Bank Mark. 2018, 36, 147–169. [Google Scholar] [CrossRef]
  8. Rahman, M.; Ismail, I.; Bahri, S. Analysing consumer adoption of cashless payment in Malaysia. Digit. Bus. 2020, 1, 100004. [Google Scholar] [CrossRef]
  9. Liao, S.-H.; Ho, C.-H. Mobile payment and mobile application (app) behavior for online recommendations. J. Organ. End User Com. 2021, 33, 1–26. [Google Scholar] [CrossRef]
  10. Ali, A.; Rahman, M.S.A.; Bakar, A. Financial satisfaction and the influence of financial literacy in Malaysia. Soc. Indic. Res. 2015, 120, 137–156. [Google Scholar] [CrossRef]
  11. Ngamaba, K.H.; Armitage, C.; Panagioti, M.; Hodkinson, A. How closely related are financial satisfaction and subjective wellbeing? Systematic review and meta-analysis. J. Behav. Exp. Econ. 2020, 85, 101522. [Google Scholar] [CrossRef]
  12. Hsieh, C.-M. Correlates of financial satisfaction. Int. J. Aging Hum. Dev. 2001, 52, 135–153. [Google Scholar] [CrossRef] [PubMed]
  13. Chen, F.; Hsu, C.-L.; Lin, A.J.; Li, H. Holding risky financial assets and subjective wellbeing: Empirical evidence from China. N. Am. J. Econ. Financ. 2020, 54, 101142. [Google Scholar] [CrossRef]
  14. Joo, S.-h.; Grable, J.E. An exploratory framework of the determinants of financial satisfaction. J. Fam. Econ. Iss. 2004, 25, 25–50. [Google Scholar] [CrossRef]
  15. Plagnol, A.C. Financial satisfaction over the life course: The influence of assets and liabilities. J. Econ. Psychol. 2011, 32, 45–64. [Google Scholar] [CrossRef] [Green Version]
  16. De Meza, D.; Irlenbusch, B.; Reyniers, D. Financial capability: A behavioural economics perspective. Consum. Res. 2008, 69, 192–193. [Google Scholar]
  17. Xiao, J.J.; Chen, C.; Chen, F. Consumer financial capability and financial satisfaction. Soc. Indic. Res. 2014, 118, 415–432. [Google Scholar] [CrossRef]
  18. Lusardi, A. Financial literacy and the need for financial education: Evidence and implications. Swiss J. Econ. Stat. 2019, 155, 1. [Google Scholar] [CrossRef] [Green Version]
  19. Remund, D.L. Financial literacy explicated: The case for a clearer definition in an increasingly complex economy. J. Consum. Aff. 2010, 44, 276–295. [Google Scholar] [CrossRef]
  20. Chen, F.; Lu, J.; Li, J.; Wang, W.; Bissielou, H. Sustainable Financial Education and Consumer Life Satisfaction. Sustainability 2020, 12, 1150. [Google Scholar] [CrossRef] [Green Version]
  21. Sarkar, S.; Chauhan, S.; Khare, A. A meta-analysis of antecedents and consequences of trust in mobile commerce. Int. J. Inform. Manag. 2020, 50, 286–301. [Google Scholar] [CrossRef]
  22. Hu, Z.; Ding, S.; Li, S.; Chen, L.; Yang, S. Adoption intention of fintech services for bank users: An empirical examination with an extended technology acceptance model. Symmetry 2019, 11, 340. [Google Scholar] [CrossRef]
  23. Tahir, M.S.; Shahid, A.U.; Richards, D.W. The role of impulsivity and financial satisfaction in a moderated mediation model of consumer financial resilience and life satisfaction. Int. J. Bank Mark. 2022, 40, 773–790. [Google Scholar] [CrossRef]
  24. Ye, Y.; Chen, S.; Li, C. Financial technology as a driver of poverty alleviation in China: Evidence from an innovative regression approach. J. Innov. Knowl. 2022, 7, 100164. [Google Scholar] [CrossRef]
  25. Arner, D.W.; Buckley, R.P.; Zetzsche, D.A.; Veidt, R. Sustainability, FinTech and financial inclusion. Eur. Bus. Organ. Law Re. 2020, 21, 7–35. [Google Scholar] [CrossRef]
  26. Gnan, E.; Silgoner, M.A.; Weber, B. Economic and financial education: Concepts, goals and measurement. Monet. Policy Econ. 2007, 3, 28–49. [Google Scholar]
  27. Diener, E.; Biswas-Diener, R. Will money increase subjective wellbeing? Soc. Indic. Res. 2002, 57, 119–169. [Google Scholar] [CrossRef]
  28. Veblen, T. The limitations of marginal utility. J. Polit. Econ. 1909, 17, 620–636. [Google Scholar] [CrossRef] [Green Version]
  29. Vera-Toscano, E.; Ateca-Amestoy, V.; Serrano-Del-Rosal, R. Building financial satisfaction. Soc. Indic. Res. 2006, 77, 211–243. [Google Scholar] [CrossRef] [Green Version]
  30. Lim, S.H.; Kim, D.J.; Hur, Y.; Park, K. An empirical study of the impacts of perceived security and knowledge on continuous intention to use mobile fintech payment services. Int. J. Hum. Comput. Int. 2019, 35, 886–898. [Google Scholar] [CrossRef]
  31. Xiao, J.J.; Porto, N. Financial education and financial satisfaction: Financial literacy, behavior, and capability as mediators. Int. J. Bank Mark. 2017, 35, 805–817. [Google Scholar] [CrossRef]
  32. Kim, K.T.; Lee, J.M.; Lee, J. Student loans and financial satisfaction: The moderating role of financial education. J. Financ. Couns. Plan. 2021, 32, 266–279. [Google Scholar] [CrossRef]
  33. Allen, F.; Gu, X.; Jagtiani, J. A survey of fintech research and policy discussion. Rev. Corp. Financ. 2021, 1, 259–339. [Google Scholar] [CrossRef]
  34. Farag, H.; Johan, S. How alternative finance informs central themes in corporate finance. J. Corp. Financ. 2021, 67, 101879. [Google Scholar] [CrossRef]
  35. Mainardes, E.W.; Costa, P.M.F.; Nossa, S.N. Customers’ satisfaction with fintech services: Evidence from Brazil. J. Financ. Serv. Mark. 2022, 1–18. [Google Scholar] [CrossRef]
  36. Gerrans, P.; Heaney, R. The impact of undergraduate personal finance education on individual financial literacy, attitudes and intentions. Account. Financ. 2019, 59, 177–217. [Google Scholar] [CrossRef]
  37. Fox, J.; Bartholomae, S.; Lee, J. Building the case for financial education. J. Consum. Aff. 2005, 39, 195–214. [Google Scholar] [CrossRef]
  38. Bernheim, B.D.; Garrett, D.M. The effects of financial education in the workplace: Evidence from a survey of households. J. Public Econ. 2003, 87, 1487–1519. [Google Scholar] [CrossRef]
  39. Chen, F.; Lu, X.; Wang, W. Informal financial education and consumer financial capability: The mediating role of financial knowledge. Front. Psychol. 2022, 13, 1042085. [Google Scholar] [CrossRef]
  40. Atkinson, A.; McKay, S.; Collard, S.; Kempson, E. Levels of financial capability in the UK. Public Money Manag. 2007, 27, 29–36. [Google Scholar] [CrossRef]
  41. Baron, R.M.; Kenny, D.A. The moderator–mediator variable distinction in social psychological research: Conceptual, strategic, and statistical considerations. J. Pers. Soc. Psychol. 1986, 51, 1173. [Google Scholar] [CrossRef] [PubMed]
Figure 1. The conceptual framework.
Mathematics 11 00363 g001
Table 1. Variable specification.
TypeVariablesAttribute
Dependent variableConsumer financial satisfaction“How satisfied are you with your current personal financial condition?”
From 1 (Not at all satisfied) to 10 (Extremely satisfied)
Independent variableMobile payments“How often do you pay with your cell phone code at retail stores?”
1—Never, 2—Sometimes, and 3—Frequently
Mediating variablesFinancial education“Have you received financial education in high school/college/from workplace/military?” 1—Yes, and 0—No
Financial capabilityA sum of Z-scores of objective and subjective financial capabilities
Control variablesRisk attitude“When it comes to financial investments, what is your desire to take risks?” Increasing preference for risk from 1 to 10.
Participating in financial markets“Are there any stocks, bonds, or mutual funds in your account that you own shares of?” 1—Yes, and 0—No
Credit record rating“What do you consider your credit situation to be?” From 1 (Very bad) to 5 (extremely good)
Annual income1 = 0 to 15,000 dollars, 2 = 15,000 to 25,000 dollars, 3 = 25,000 to 35,000 dollars, 4 = 35,000 to 50,000 dollars, 5 = 50,000 to 75,000 dollars, 6 = 75,000 to 100,000 dollars, 7 = 10,000 to 150,000 dollars, 8 = greater than 150,000 dollars
Subjective math capability“Evaluate this statement: I have a good grasp of mathematics.” From 1 (Strongly disagree) to 7 (Strongly agree)
Male1 = Male, and 0 = Female
Age 18 to 241 if the respondent’s age was between 18 and 24 years, and 0 otherwise.
Age 25 to 341 if the respondent’s age was between 25 and 34 years, and 0 otherwise.
Age 35 to 441 if the respondent’s age was between 35 and 44 years, and 0 otherwise.
Age 45 to 541 if the respondent’s age was between 45 and 54 years, and 0 otherwise.
Age 55 to 641 if the respondent’s age was between 55 and 64 years, and 0 otherwise.
Age 65 or older1 if the respondent’s age was 65 years or older, and 0 otherwise.
Some college to bachelor’s degree1—Yes, and 0—No
Postgraduate degree or higher1—Yes, and 0—No
Marital status1 = Being married, and 0 otherwise
Number of financially dependent children“What is the number of children who are economically dependent?” 0 to 4 or more.
Ethnicity1 = White, and 0 = Non-white
Note: All the binary variables are documented properly and concretely to the corresponding variables in the source dataset.
Table 2. Descriptive Statistics.
VariableObs.MeanStd. Dev.Min.Max.
Financial satisfaction53,0385.752.81110
Mobile payments53,0381.350.6213
Financial education53,0380.210.4101
Financial capability53,0380.001.62−5.562.87
Risk attitude53,0384.952.73010
Participating in the financial markets53,0380.330.4701
Credit record rating53,0383.011.2805
Annual income53,0384.472.0518
Subjective math capability53,0385.631.6207
Male53,0380.440.501
Age 18 to 2453,0380.110.3101
Age 25 to 3453,0380.180.3801
Age 35 to 4453,0380.170.3701
Age 45 to 5453,0380.180.3801
Age 55 to 6453,0380.180.3801
Age 65 or older53,0380.20.401
High school or lower53,0380.260.4401
Some college to Bachelor’s degree53,0380.610.4901
Postgraduate degree or higher53,0380.140.3401
Being married53,0380.540.501
White53,0380.730.4401
Number of financially dependent children53,0380.671.0604
Note: Data used for descriptive statistics are from the NFCS in 2015 and 2018.
Table 3. Correlations between FinTech payment and consumer financial satisfaction.
Financial SatisfactionMobile PaymentFinancial EducationFinancial CapabilityRisk AttitudeParticipating in the Financial MarketsCredit Record RatingAnnual Income
Mobile payments0.11 ***
Financial education0.07 ***0.08 ***
Financial capability0.53 ***0.01 *0.11 ***
Risk attitude0.36 ***0.25 ***0.12 ***0.26 ***
Participating in the financial markets0.37 ***0.07 ***0.11 ***0.38 ***0.31 ***
Credit record rating0.42 ***−0.08 ***0.04 ***0.41 ***0.12 ***0.27 ***
Annual income0.38 ***0.06 ***0.07 ***0.43 ***0.28 ***0.37 ***0.29 ***
Subjective math capability0.20 ***−0.02 ***0.10 ***0.44 ***0.14 ***0.15 ***0.16 ***0.19 ***
Notes: The sample size is 53,038. The significance levels of 1 percent, and 10 percent are indicated by the symbols ***, and *, respectively.
Table 4. Results of regressions of mobile payment on consumer financial satisfaction.
Variables(1)(2)(3)
Mobile payments 0.21 ***
(0.01)
Risk attitude0.27 ***0.13 ***0.12 ***
(0.01)0.000.00
Participating in the financial markets0.73 ***0.34 ***0.32 ***
(0.02)(0.01)(0.01)
Credit record rating0.57 ***0.25 ***0.26 ***
(0.01)(0.01)(0.01)
Annual income0.25 ***0.11 ***0.10 ***
(0.01)0.000.00
Subjective math capability0.09 ***0.04 ***0.05 ***
(0.01)0.000.00
Male0.11 ***0.05 ***0.04 ***
(0.03)(0.01)(0.01)
Age 25 to 340.070.04 *0.05 **
(0.04)(0.02)(0.02)
Age 35 to 44−0.26 ***−0.13 ***−0.10 ***
(0.04)(0.02)(0.02)
Age 45 to 54−0.36 ***−0.18 ***−0.12 ***
(0.04)(0.02)(0.02)
Age 55 to 640.16 ***0.07 ***0.14 ***
(0.05)(0.02)(0.02)
Age 65 or older0.90 ***0.42 ***0.50 ***
(0.05)(0.03)(0.02)
Some college to Bachelor’s degree−0.29 ***−0.15 ***−0.15 ***
(0.02)(0.01)(0.01)
Postgraduate degree or higher−0.35 ***−0.18 ***−0.17 ***
(0.04)(0.02)(0.02)
Being married0.21 ***0.09 ***0.09 ***
(0.03)(0.01)(0.01)
White−0.12 ***−0.06 ***−0.03 **
(0.03)(0.01)(0.01)
Number of financially dependent children−0.04 ***−0.01 *−0.02 ***
(0.01)(0.01)(0.01)
Constant0.87 ***
(0.06)
State fixed effectYesYesYes
Observations53,03853,03853,038
Adjusted R20.36
Pseudo R2 0.100.10
Notes: Age 18 to 24 and High school or lower are the reference groups. The significance levels of 1 percent, 5 percent, and 10 percent, respectively, are indicated by the symbols ***, **, and *. The numbers in parentheses are robust clustered standard deviations.
Table 5. Results of the robustness check.
Variables(1)(2)(3)(4)(5)(6)
Mobile payments0.36 ***0.22 ***0.17 ***0.21 ***0.24 ***0.21 ***
(0.02)(0.01)(0.03)(0.02)(0.02)(0.02)
Risk attitude0.21 ***0.12 ***0.14 ***0.12 ***0.12 ***0.10 ***
(0.01)0.00(0.01)(0.01)0.00(0.01)
Participating in the financial markets0.54 ***0.32 ***0.31 ***0.34 ***0.30 ***0.33 ***
(0.02)(0.01)(0.02)(0.02)(0.02)(0.02)
Credit record rating0.46 ***0.29 ***0.26 ***0.26 ***0.24 ***0.27 ***
(0.01)(0.01)(0.01)(0.01)(0.01)(0.01)
Annual income0.18 ***0.10 ***0.10 ***0.10 ***0.11 ***0.11 ***
(0.01)0.00(0.01)(0.01)(0.01)(0.01)
Subjective math capability0.08 ***0.05 ***0.04 ***0.05 ***0.04 ***0.05 ***
(0.01)0.00(0.01)(0.01)(0.01)(0.01)
Male0.06 ***0.05 ***(0.01)0.010.08 ***0.06 ***
(0.02)(0.01)(0.03)(0.03)(0.02)(0.02)
Age 25 to 340.08 ***0.020.05 **0.020.10 **0.00
(0.03)(0.02)(0.02)(0.03)(0.04)(0.04)
Age 35 to 44−0.17 ***−0.12 ***−0.12 **−0.10 ***−0.07 **−0.11 ***
(0.03)(0.02)(0.05)(0.04)(0.03)(0.03)
Age 45 to 54−0.22 ***−0.16 ***−0.10 **−0.12 ***−0.08 **−0.19 ***
(0.03)(0.02)(0.05)(0.03)(0.04)(0.03)
Age 55 to 640.25 ***0.12 ***0.10 **0.13 ***0.16 ***0.14 ***
(0.04)(0.02)(0.05)(0.04)(0.04)(0.04)
Age 65 or older0.88 ***0.48 ***0.54 ***0.47 ***0.56 ***0.44 ***
(0.04)(0.03)(0.05)(0.04)(0.05)(0.04)
Some college to bachelor’s degree−0.24 ***−0.15 ***−0.14 ***−0.15 ***−0.15 ***−0.14 ***
(0.02)(0.01)(0.03)(0.02)(0.02)(0.02)
Postgraduate degree or higher−0.29 ***−0.16 ***−0.19 ***−0.11 ***−0.24 ***−0.11 ***
(0.03)(0.02)(0.06)(0.03)(0.02)(0.02)
Being married0.16 ***0.08 ***0.12 ***0.10 ***0.07 ***0.11 ***
(0.02)(0.01)(0.02)(0.03)(0.02)(0.02)
White−0.05 **−0.05 ***(0.08)(0.02)−0.05 ***0.01
(0.02)(0.02)(0.05)(0.03)(0.02)(0.02)
Number of financially dependent children−0.04 ***−0.01 **(0.02)−0.05 ***0.00−0.02 **
(0.01)(0.01)(0.02)(0.01)(0.01)(0.01)
State fixed effectYesYesYesYesYesYes
Observations53,03843,803922712,17717,02514,609
Pseudo R20.100.090.100.100.100.10
Notes: Age 18 to 24 and High school or lower are the reference groups. Column (1) is ordered logit regression, and Columns (2) to (6) are ordered probit regressions. The significance levels of 1 percent, and 5 percent, respectively, are indicated by the symbols ***, and **. The numbers in parentheses are robust clustered standard deviations.
Table 6. Results of financial education and capability as mediators.
Variables(1)(2)(3)(4)
Financial
Education
Financial
Satisfaction
Financial CapabilityFinancial
Satisfaction
Financial education 0.03 ***
(0.01)
Financial capability 0.27 ***
0.00
Mobile payments0.07 ***0.21 ***0.04 ***0.21 ***
(0.01)(0.01)(0.01)(0.01)
Risk attitude0.02 ***0.12 ***0.05 ***0.11 ***
0.000.000.000.00
Participating in the financial markets0.21 ***0.32 ***0.50 ***0.20 ***
(0.02)(0.01)(0.02)(0.01)
Credit record rating0.000.26 ***0.32 ***0.19 ***
(0.01)(0.01)(0.01)(0.01)
Annual income0.01 ***0.10 ***0.15 ***0.07 ***
0.000.000.000.00
Subjective math capability0.08 ***0.05 ***0.32 ***−0.04 ***
0.000.000.000.00
Male0.09 ***0.04 ***−0.10 ***0.07 ***
(0.01)(0.01)(0.01)(0.01)
Age 25 to 34−0.36 ***0.05 **0.32 ***−0.04*
(0.03)(0.02)(0.03)(0.02)
Age 35 to 44−0.48 ***−0.09 ***0.37 ***−0.20 ***
(0.03)(0.02)(0.03)(0.02)
Age 45 to 54−0.44 ***−0.12 ***0.44 ***−0.25 ***
(0.04)(0.02)(0.03)(0.02)
Age 55 to 64−0.51 ***0.15 ***0.57 ***0.00
(0.04)(0.02)(0.03)(0.02)
Age 65 or older−0.55 ***0.51 ***0.52 ***0.39 ***
(0.04)(0.03)(0.03)(0.02)
Some college to Bachelor’s degree0.45 ***−0.15***0.10 ***−0.18 ***
(0.02)(0.01)(0.01)(0.01)
Postgraduate degree or higher0.48 ***−0.17 ***0.11 ***−0.21 ***
(0.03)(0.02)(0.02)(0.02)
Being married−0.03 *0.09 ***0.03 **0.09 ***
(0.02)(0.01)(0.01)(0.01)
White−0.11 ***−0.03 **0.02−0.04 ***
(0.02)(0.01)(0.01)(0.01)
Number of financially dependent children0.03 ***−0.02 ***0.03 ***−0.03 ***
(0.01)(0.01)(0.01)(0.01)
Constant−1.40 *** −4.42 ***
(0.05) (0.04)
State fixed effectYesYesYesYes
Observations53,03853,03853,03853,038
Adjusted R2 0.43
Pseudo R20.060.10 0.12
Notes: Age 18 to 24 and high school or lower are reference groups. The significance levels of 1 percent, 5 percent, and 10 percent, respectively, are indicated by the symbols ***, **, and *. Column (3) is OLS regression; all others are ordered probit regression. The numbers in parentheses are robust clustered standard deviations.
Disclaimer/Publisher’s Note: The statements, opinions and data contained in all publications are solely those of the individual author(s) and contributor(s) and not of MDPI and/or the editor(s). MDPI and/or the editor(s) disclaim responsibility for any injury to people or property resulting from any ideas, methods, instructions or products referred to in the content.

