Article

Classification of Motor Imagery Using Trial Extension in Spatial Domain with Rhythmic Components of EEG

by
Md. Khademul Islam Molla
1,2,*,
Sakir Ahamed
2,
Ahmed M. M. Almassri
3 and
Hiroaki Wagatsuma
4
1
Department of Computer Science and Engineering, University of Rajshahi, Rajshahi 6205, Bangladesh
2
Department of Computer Science and Engineering, Varendra University, Rajshahi 6204, Bangladesh
3
Department of Intelligent Robotics, Faculty of Engineering, Toyama Prefectural University, Toyama 939-0398, Japan
4
Department of Human Intelligence Systems, Graduate School of Life Science and Systems Engineering, Kyushu Institute of Technology, Fukuoka 808-0196, Japan
*
Author to whom correspondence should be addressed.
Mathematics 2023, 11(17), 3801; https://doi.org/10.3390/math11173801
Submission received: 26 July 2023 / Revised: 28 August 2023 / Accepted: 1 September 2023 / Published: 4 September 2023
(This article belongs to the Special Issue Machine Learning in Bioinformatics and Biostatistics)

Abstract

:
Electrical activities of the human brain can be recorded with electroencephalography (EEG). To characterize motor imagery (MI) tasks for brain–computer interface (BCI) implementation is an easy and cost-effective tool. The MI task is represented by a short-time trial of multichannel EEG. In this paper, the signal of each channel of raw EEG is decomposed into a finite set of narrowband signals using a Fourier-transformation-based bandpass filter. Rhythmic components of EEG are represented by each of the narrowband signals that characterize the brain activities related to MI tasks. The subband signals are arranged to extend the dimension of the EEG trial in the spatial domain. The spatial features are extracted from the set of extended trials using a common spatial pattern (CSP). An optimum number of features are employed to classify the motor imagery tasks using an artificial neural network. An integrated approach with full-band and narrowband signals is implemented to derive discriminative features for MI classification. In addition, the subject-dependent parameter optimization scheme enhances the performance of the proposed method. The performance evaluation of the proposed method is obtained using two publicly available benchmark datasets (Dataset I and Dataset II). The experimental results in terms of classification accuracy (93.88% with Dataset I and 91.55% with Dataset II) show that it performs better than the recently developed algorithms. The enhanced MI classification accuracy is very much applicable in BCI implementation.

1. Introduction

A brain–computer interface (BCI) is a modern technology that helps people to control external machines or devices without using any muscle or peripheral nerve [1]. It has potential applications in neuroscience and neuro-engineering. The recent application of BCI offers neurorehabilitation to assist stroke patients in restoring their impaired motor functions [2]. Different electronic devices, like prosthetics, robots, etc., used in neurorehabilitation tasks are fully controlled by motor imagination [3]. It is relatively easy and comfortable to implement BCI through non-invasive electroencephalography (EEG). The brain activity of BCI user’s is typically measured by EEG. Commonly, the analysis of EEG signals has been the focus of several investigations, because of its ability to provide an objective of capturing brain stimulation, which is widely used in research related to BCIs. It is applicable in rehabilitation engineering and medical diagnosis [4].
Motor imagery (MI) is a mental process by which an individual rehearses or simulates a given action. It is a common mental task that is widely used in BCI implementation. A subject is needed to perform an imagination in the brain corresponding to a specific task in MI-based BCI [5]. It provides a high degree of freedom, and it helps motor-disabled people communicate with the device by performing a sequence of MI tasks. The captured EEG signals associated with MI are classified to translate into respective control commands for each imagery task, such as movement of a hand, foot, etc. [5]. In terms of neurophysiology, motor imagery accompanies the attenuation or enhancement of rhythmical synchrony over the sensorimotor cortex [6]. MI is used to boost neuroplasticity in the patient’s brain after a stroke [3,4]. This paper focuses on the classification of two motor imagery tasks using EEG signals.
Feature extraction over EEG signals for MI-based BCI systems is crucial to the classification performance. It is an important step in the process of EEG signal classification. Any feature represents a distinguishing characteristic, a recognizable measurement, and a functional element derived from a segment of a pattern. Extracted features aim to reduce the loss of important information contained within the signal. In addition, they also rationalize the resources required to describe a huge set of data accurately. It is necessary to minimize the complexity of implementation, reduce the computational cost, and retain the potential need for information compression. A variety of methods are being used to extract the features from EEG signals, such as fast Fourier transform (FFT) [7], time-frequency distributions (TFD) [8], eigenvector methods (EM) [9], wavelet transform (WT) [10], and the auto-regressive method (ARM) [11].
The multivariate EEG signal is collected using a set of sensors spatially distributed over the scalp. The spatial filtering approach is very effective in extracting features from EEG. Common spatial pattern (CSP) filters are used to extract the spatial features in the cortical region. The CSP algorithm has been widely used for feature extraction in EEG-based BCI systems for MI [12]. As the EEG signals have noise and over-the-fitting issues, various regularized CSP algorithms are introduced to cater to these issues [13]. It is a feature extraction method that uses spatial filters to maximize the discriminability of two classes.
For MI classification, several methods, including filter-bank CSP (FBCSP) [14,15], subband CSP [16], sparse filter-bank CSP [17], and discriminative filter-bank CSP [18] have been proposed in order to extract the features from the narrowband EEG signals. The sparse representation of the CSP feature is implemented by Jiao et al., 2018 [19] for two classes of MI classification. Such works encourage subband CSP implementation to extract discriminative features, yielding a consistent recognition of MI tasks. Different approaches to subband decomposition have already been implemented, including empirical mode decomposition (EMD) [20]. Although EMD is a fully data-adaptive approach, it requires a high computational cost. The discrete wavelet transform (DWT) is widely used to decompose any signal into a finite set of subbands to resolve the problem of high computational cost [21]. The multivariate wavelet transform (mWT) was introduced by Oweiss et al., 2001 [22], to decompose multichannel EEG signals followed by feature extraction. The wavelet transformation decomposes the signal with the nature of a dyadic filter-bank. It is difficult to obtain a subband with desired cut-off frequencies. The use of a Fourier-transform-based bandpass filter resolves such a problem.
The features obtained from narrowband EEG signals become more discriminative for MI classification [23]. The selection of effective frequency bands of the EEG signal is a significant factor affecting the performance of MI-BCI [24]. It is not unlikely that some apparent features are carried out by the wideband signal to increase MI classification performance. In this study, the narrowband (subband) signals derived from the recorded EEG channels are integrated into the original trial as a spatial component, and hence, an extended trail is obtained [25]. The CSP is applied to the newly generated trial to obtain the spatial features. The inclusion of subband signals makes the spatial features more discriminative. Therefore, the trial extension-based CSP method is implemented in this study to extract effective features for MI classification.
The existing methods extract features from individual subbands, and the features obtained from all the subbands are combined. In that case, the co-variation of different subbands is not considered during feature extraction. It is noted that different frequency components are not independent to represent any motor imagery task, and hence, it is required to extract features by considering the co-variation of different narrowband signals. In this paper, multivariate EEG is decomposed into a finite set of subbands using Fourier-transform-based bandpass filters. The obtained narrowband signals are arranged to extend the size of the trial. The CSP features are extracted from the extended trial. It includes the narrowband signals as individual rows in the trial. Thus, all the narrowband and wideband signals are considered together to derive the features used in an effective MI classification system. The classification of MI tasks is performed using an artificial neural network. The main contribution of the study is to incorporate the impact of the selected rhythmic components in MI classification. The rhythmic components are narrowband signals of EEG that localize the brain activities in the spectral domain. The inclusion of several components with the original EEG data boosts the characterization of MI events. A set of subband signals is associated with EEG for MI classification in Molla et al., 2021 [25], whereas, the rhythmic components rather than arbitrary subbands are selected in this study. The experimental results of this study illustrate that the use of rhythmic components enhances the MI classification performance. Another remarkable contribution of this work is subject-based optimization. It is well known that the implementation of BCI is very much subject-dependent, and hence, a subject-wise parameter optimization scheme is implemented to enhance the performance.
The rest of the content of the paper is organized as follows—the description of datasets used in this study is provided in Section 2, the method is explained in Section 3, Section 4 contains experimental results, the discussion is presented in Section 5, and finally, Section 6 draws the concluding remarks on this study.

2. Data Description

In this study, two publicly accessible benchmark datasets are used to assess the effectiveness of the proposed method. They are detailed in the following subsections.
Dataset I: BCI Competition III (4a) is a well-known dataset to evaluate the performance of motor imagery classification. The data were recorded from five healthy subjects of the age group 24–25 years, denoted as ‘aa’, ‘al’, ‘av’, ‘aw’, and ‘ay’ [26]. The subjects are properly instructed in priory about the experimental conditions. They sat on a comfortable chair, and their eye movements were avoided while the EEG was recorded. The visual stimulus was presented for 3.5 s. The participant was instructed to execute three MI tasks, i.e., movement of the right foot, movement of the left hand, and movement of the right hand, all while the stimulus was presented. The MIs of the right hand and right foot movements were considered for classification. A total of 280 trials of EEG were recorded from each subject, utilizing 118 channels while they were involved in motor imagery tasks according to the instructions. The trials of the dataset were divided into training and testing groups. The labeled testing data are used to evaluate the performance of the proposed method. The EEG signals were recorded with a 1000 Hz sampling frequency and 16-bit quantization. For further processing, it was downsampled at 100 Hz. Details about the experimental setup are provided in [26]. The EEG trial of length 2 s (0.5–2.5 s) is used to extract meaningful features for MI classification. The initial 0.5 s (0–0.5 s) and the final 0.5 s (3.5–4.0 s) are considered pre- and post-imagination, respectively.
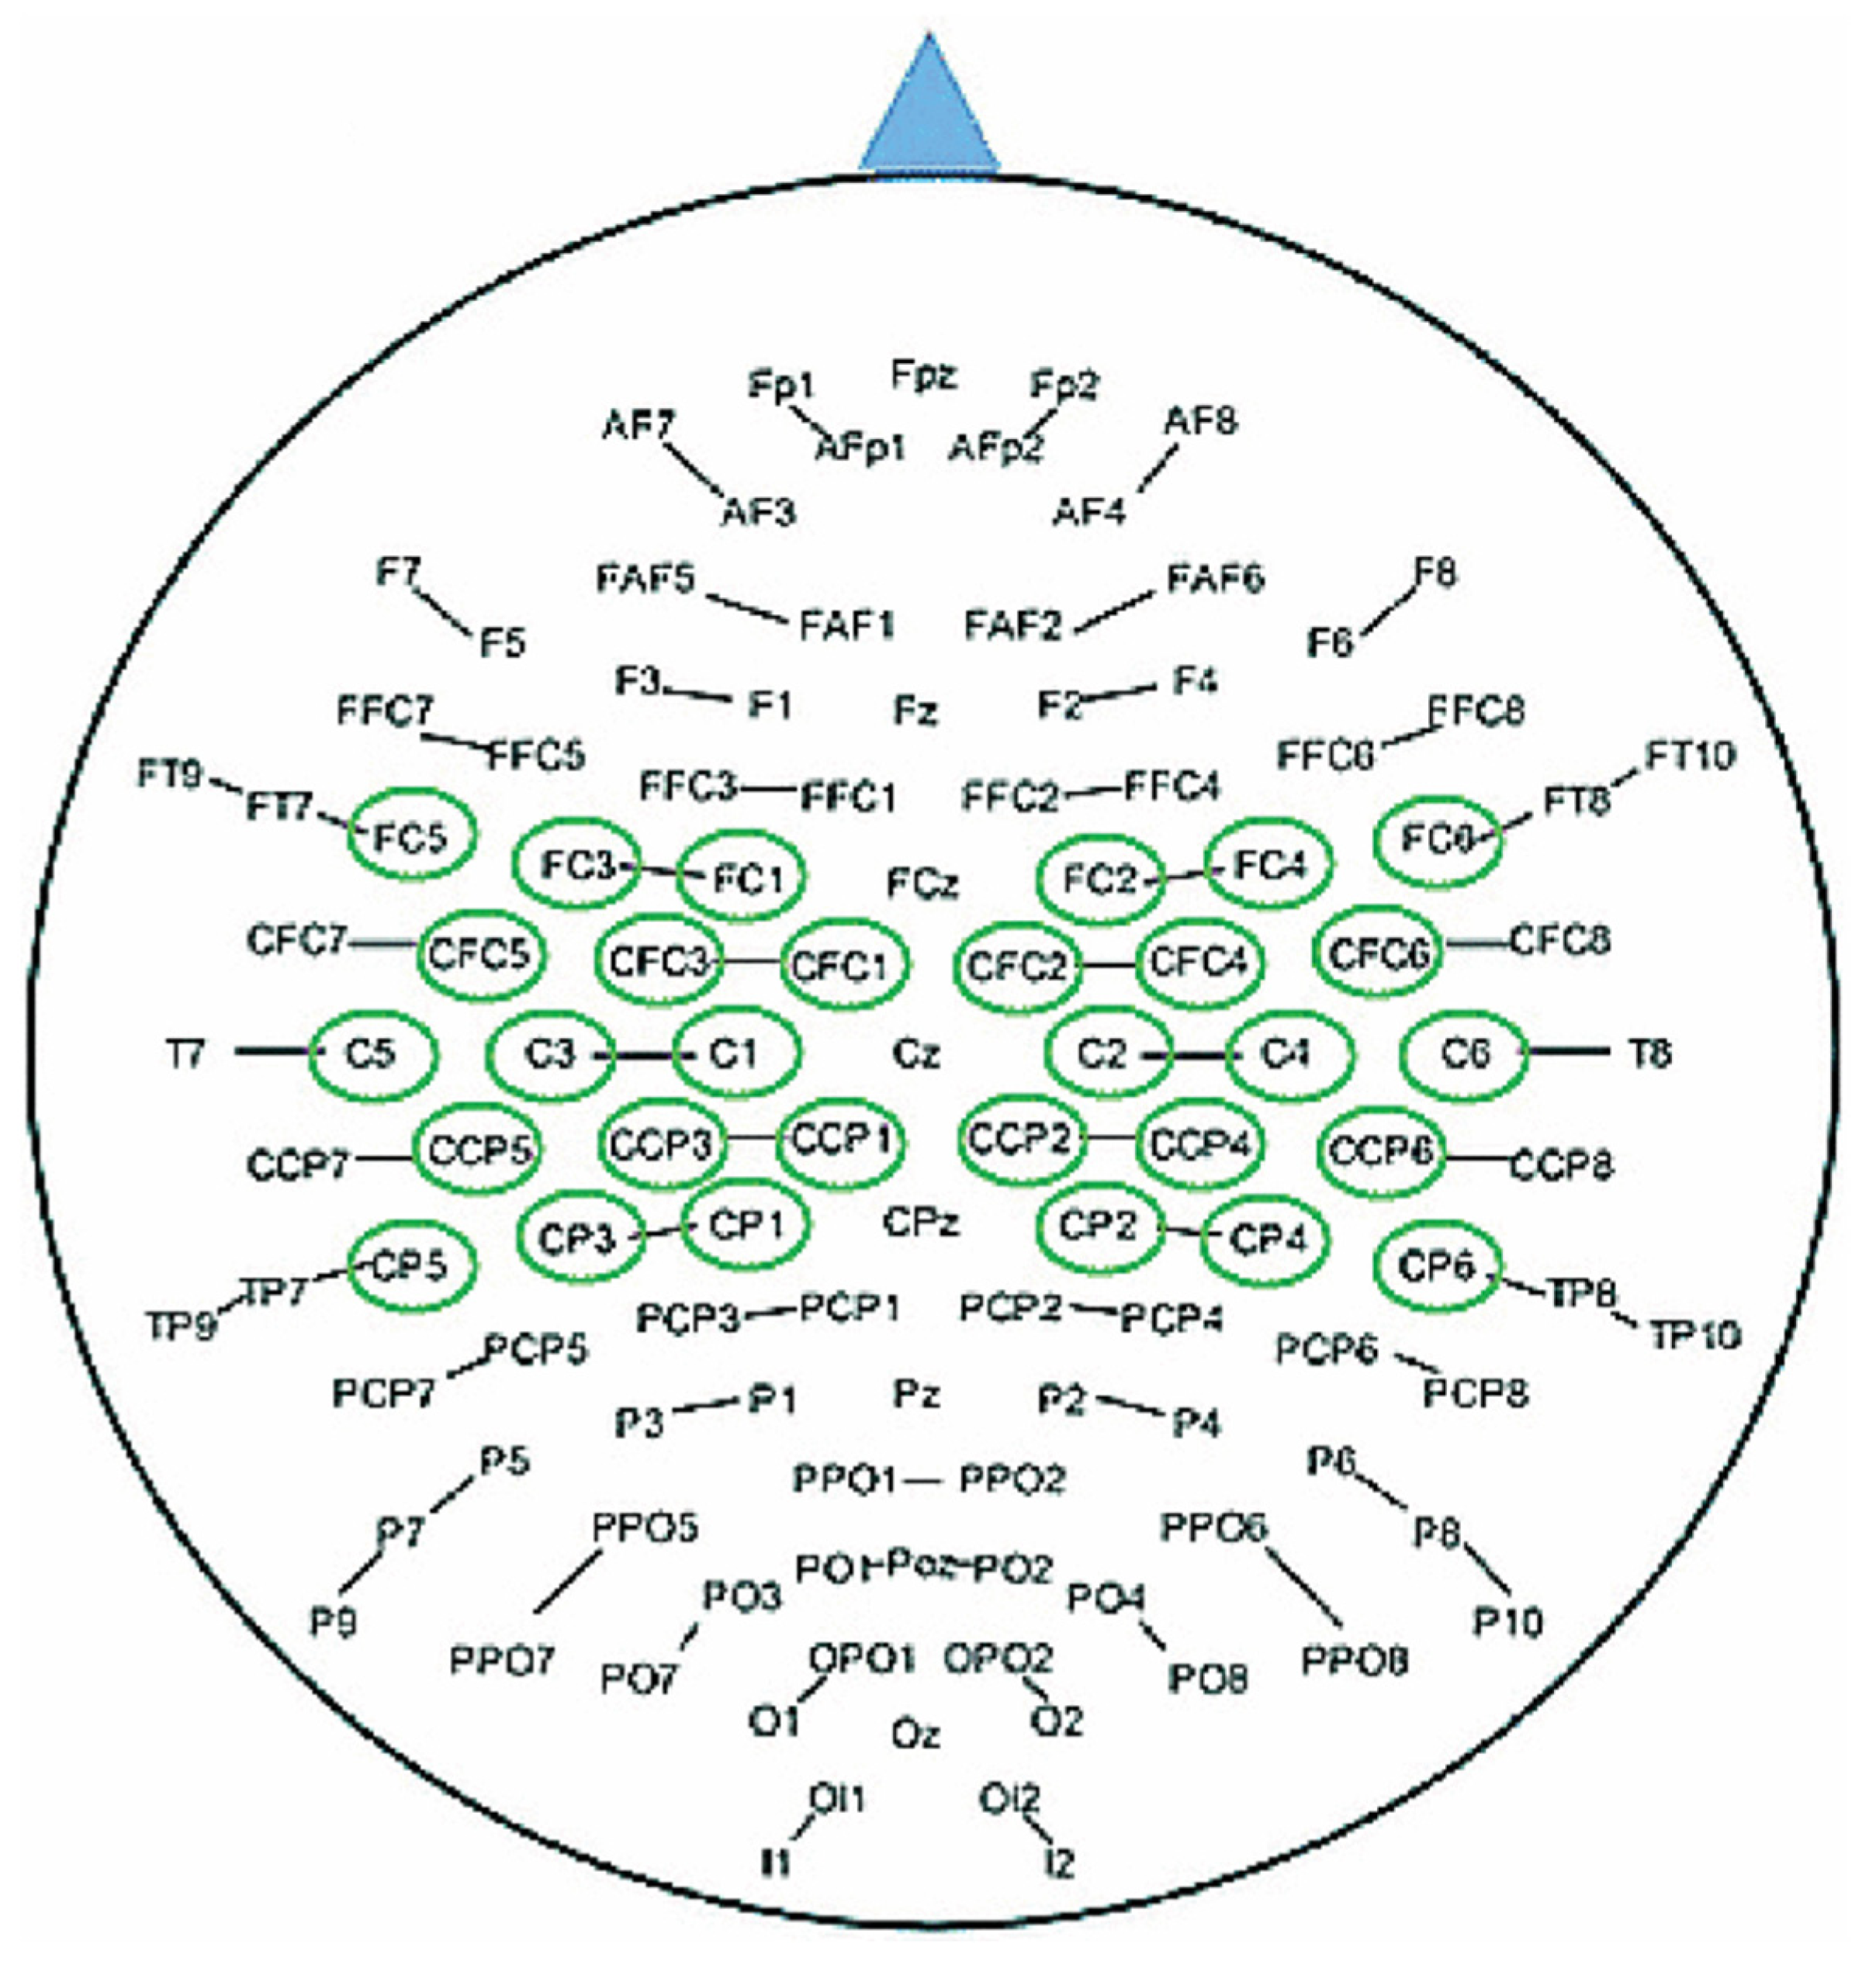
Each trial of EEG recorded with 118 channels includes some irrelevant signals. Not all channels are required to classify the motor imagery tasks. The selection of a smaller number of relevant channels will be effective in BCI implementation. The relevant motor activity zone is the motor cortex region, which includes the primary, supplementary, and premotor cortex areas on the scalp [27]. The electrodes (channels) placed in these areas are essential for MI representation. A selected number of channels, rather than all 118, are used to design the MI-BCI. The 30 channels selected from the area of sensorimotor cortex illustrated in Figure 1 are used in [28,29] to classify two MI tasks. The signals recorded from the selected 30 channels are used in this study. In this paper, the multichannel EEG refers to the signals captured from the following 30 electrodes. These are “C5, C3, C1, C2, C4, C6, CCP5, CCP3, CCP1, CCP2, CCP4, CCP6, CFC5, CFC3, CFC1, CFC2, CFC4, CFC6, CP5, CP3, CP1, CP2, CP4, CP6, FC5, FC3, FC1, FC2, FC4, and FC6”.
Dataset II: Publicly available EEG data obtained from BCI Competition IV (I) [30] were used to evaluate the performance of the proposed motor imagery classification method. Seven healthy subjects (labeled as ‘a’, ‘b’, ‘c’, ‘d’, ‘e’, ‘f’, and ‘g’) participated in the experiment to record EEG data. The MI task was performed without any feedback at the time of recording. Two motor imagery tasks, left-hand movement and right-hand movement, were performed by each subject. Each task was considered an individual class. Each subject was required to perform the predefined motor imagery task. Visual cues were displayed for a duration of 4 s during the trial.
All 200 trials were randomized in a manner that all subjects imagined two tasks equally. The trials were interleaved with 2 s of a blank screen and 2 s with a fixation cross displayed in the center of the screen and superimposed on the cues. The EEG signal was captured using 59 electrodes according to the international 10–20 system with BrainAmp MR plus amplifiers and an Ag/AgCl electrode cap. The signals were digitized with a 16-bit resolution at 1000 Hz. The data were then down-sampled at 100 Hz to be used in this study.
It is widely recognized that the central region of the brain exhibits discriminating activity during the execution of the MI task. A total of 23 channels out of 59 were selected in this study. The selected channels were: “FC5”, “FC3”, “FC1”, “FCZ”, “FC2”, “FC4”, “FC6”, “CZ”, “C3”, “C4”, “C1”, “C2”, “C5”, “C6”, “T7”, “T8”, “CCP3”, “CCP4z”, “CP5”, “CP1”, “CPZ”, “CP2”, and “CP6” following the 10–20 system [31]. The temporal segmentation of the signal with MI is critical for the classification of EEG [24]. An EEG segment of 3.5 s (0.5 s to 4 s) was used here.
There are a huge number of datasets. The two datasets considered in this study are mostly usable benchmark datasets to evaluate the performance of two-class MI classification algorithms. The parameters of the two datasets are summarized in Table 1.

3. Methods

A subband approach to extract the features from the EEG signal is implemented in this study to increase the classification accuracy of motor imagery tasks in the BCI paradigm. A block diagram of the proposed method is shown in Figure 2. The multichannel EEG signals are decomposed into a set of subband signals corresponding to the rhythmic components. The subband signals are used to extend the EEG trials in spatial dimensions. CSP-based features are extracted from the newly generated trials. The artificial neural network (ANN) classifier is trained to create a classification model using the extracted features. The steps to implement the proposed method are mentioned below:
i.
The EEG signal is decomposed into subbands. Each subband represents a rhythmic component;
ii.
Each trial is extended in the spatial dimension by arranging the obtained subband signals;
iii.
CSP is applied to the newly generated trials to extract spatial features;
iv.
Separate training and test sets of publicly available datasets are used to train the ANN and evaluate the performance of the proposed method, respectively.
Figure 2. Block diagram of the proposed MI classification system.
Mathematics 11 03801 g002

3.1. Subband Decomposition

The narrowband signals contain significant information about movement imagination. The use of narrowband signals enhances the MI classification performance. A stronger response to the specific motor imagery task is found in a narrowband signal rather than a signal with full bandwidth. Therefore, the optimum selection of subbands is very important for better accuracy of MI classification. The related studies claim that most brain activities exist within the frequency band 4–30 Hz [30]. In this study, the EEG data are bandpass filtered within the range of 4–40 Hz. The mu and beta rhythmic components contain noticeable information about motor imagery [32]. The beta component has two smaller categories named low beta (13–21 Hz) and high beta (21–30 Hz). Both components have some weight to classify MI [32]. Several hypothetical functions were proposed for the beta rhythm, such as coordination among multiple brain activities in the cortex, inhibition of movement and motor planning, signaling of decision-making, and focusing action-selection network functions. The presence of multiple beta rhythms with varied frequencies, topographies, and with varied functional properties presumes no single neuronal mechanism for their generation. The low gamma band is also involved in generating related MI events. The multichannel EEG is decomposed using a fourth-order Butterworth bandpass filter into four subbands named mu, low beta, high beta, and gamma with frequency ranges 7–12 Hz, 13–20 Hz, 21–30 Hz, and 31–35 Hz. The individual rhythmic component has a direct effect on different brain activities, including motor imagery activities. The selected narrowband rhythmic components are used to enhance the accuracy of MI classification.

3.2. Trial Extension

Usually, spatial filtering is directly applied to multichannel EEG signals to extract the spatial features. The trial extension method is implemented by incorporating the selected rhythmic components with the original trial in the spatial domain [25]. The subband signals contain relatively more frequency-localized discriminative features for MI classification. The selected ranges of frequencies are suppressed from the EEG signals to enhance the classification performance [33,34], whereas it is crucial to select the relevant subbands after multi-band decomposition. All the usable subbands are retained and arranged to reconstruct the trials to overcome the difficulty. Thus, narrowband signals are employed to produce more discriminative features for MI classification. The subbands obtained from each channel are spatially arranged to facilitate the spatial feature extraction method. The inclusion of the subbands to extend the trial is performed in the spatial dimension. The advantage of the trial extension method is to combine the narrowband and full-band signals to derive more discriminative spatial features. Thus, the obtained features enhance MI classification performance.
The bandpass filtering scheme is used here for the multi-band decomposition of EEG data X T = [ x 1 ,   x 2 ,   ,   x C ] , where x(c) represents the cth channel of EEG trial X. The subbands obtained from the cth channel are denoted by xs(c), where c = 1, 2, …, C represents the channels’ index and s = 1, 2, …, 4 is the index of subbands. The frequency ranges of the usable four subbands are 7–12 Hz, 13–20 Hz, 21–30 Hz, and 31–35 Hz. The cth channel x(c) can be represented with four subbands as
[ x ( c ) ] T = [ x 1 ( c ) ,   x 2 ( c ) , , x 4 c ]
where each of x s ( c ) is the sth a subband of the cth channel. It is noted that each channel is added as a row in addition to the subbands in the reconstructed trial. The newly generated trial corresponding to EEG data X with C channels can be represented as
[ X ] T = [ x ( 1 ) ,   x ( 1 ) , x ( 2 ) , x ( 2 ) , x C , x ( C ) ]
In the reconstructed EEG trial X′, the four subbands of any channel are appended as individual rows just after the channel itself, as illustrated in Equation (2). The single row of each channel is extended by four in the spatial dimension, and hence, the spatial dimension is extended five times from the original one. The first subband of each channel illustrates the lowest frequency component filtered from that specific channel [25]. The extended trials, including the subbands obtained from individual channels, are illustrated in Figure 3. In the newly reformed trial, each row represents a narrowband signal in addition to the original channel of EEG signals.

3.3. Feature Extraction

Discriminative features play an important role in the BCI application. It is very challenging to find potential features in the field of BCI. The feature has a direct influence on the performance of the BCI system [35], and hence, recent studies have generally investigated how to develop a novel technique for potential feature extraction. The CSP is one of the most successful and well-known methods in BCI applications to extract features from a multichannel EEG [36]. The CSP decomposes a multichannel EEG into several additive components. A spatial filter is designed such that the variance of filtered data from one class is maximized while that of the other class is minimized. It increases the separation between two classes in terms of variance [36]. The obtained features minimize the intra-class variance while maximizing the inter-class variance. Such a property of CSP makes it an effective spatial filter for classifying MI tasks using multichannel EEG classification. The CSP-based spatial filter was also implemented by Suefusa et al., 2018 [37], to effectively classify the movement-related EEG for BCI implementation.
Let Ei,1 and Ei,2 ∈ ℜC×N denote the ith EEG training trials of dimensions C × N selected from two different classes, where N represents the discrete samples and C is the total channels. The CSP method derives the features through simultaneous diagonalization of covariance matrices of both classes. It determines a spatial filter w ∈ ℜC to transform the EEG trials with a projection matrix, such that the ratio of variance between the two classes becomes maximized.
w = arg max w w T Λ 1 w w T Λ 2 w s . t . w 2 = 1
where Λ q = i = 1 K q E i , q E i , q T / K q and Kq is the number of trials belonging to class q (q = 1, 2). The optimal solution of Equation (3) can be obtained by solving a generalized eigenvalue problem. A matrix w = [w1, w2, …, w2M] ∈ ℜC×2M, including the spatial filters, is formed by the eigenvectors corresponding to the M largest and smallest eigenvalues. For a given EEG sample E, the feature vector is constructed as v = [v1, v2, …, v2M] with entries [31]
v m = l o g v a r ( w m T E ) ,    m = 1 , 2 , , 2 M
where var(.) is the variance. Log transformation is obtained to normalize the elements of vm. Thus, the obtained feature vector is used to train the ANN for training and classification.

3.4. Classification by ANN

In the last few decades, the ANN has been widely used in pattern recognition problems [38]. The feed-forward neural network (FNN) is used in this study for the MI classification of EEG signals. As the information only travels forward in the neural network, through the input neuron, then through hidden layers (single or multiple), and finally through the output neuron, these models are called feed-forward. It is represented by a combination of many simpler neurons and the connections among them. It works well for nonlinearly separable data. The building block of FNN is the neuron. When multiple neurons are connected in an effective way, it establishes the necessary relationship between the neurons to handle nonlinear data.
A set of chosen features derived from the EEG signals is fed into the neural network to perform the classification. The efficient configuration of FNN to address this problem includes one output, one hidden, and one input layer. The output layer holds one neuron to classify two classes of data. The number of neurons in the hidden layer is selected for maximizing the performance using the grid search approach. The number of input neurons is subject-specific and determined by the dimension of the feature vector. The target values are set to 1 and 0 to represent two classes. The hyperbolic tangent sigmoid (HTS) function is used for the input and hidden layer transfer function. The Softmax function is assigned to the output layer. The definition of HTS and the Softmax function are given by Equations (5) and (6), respectively.
f ( h i ) = 2 1 + e 2 h i 1
f h i = e h i j = 1 P e h j
where h i represents the hypothesis of the i t h neuron, and P is the total number of neurons in the output layer. Scaled conjugate gradient backpropagation is used as a network training function to update the weight and bias values of FNN. The training and validation sets were utilized to determine weights and biases, develop model structures, and avoid overfitting by validating an optimal parameter set. The experimental set was only used to study the performance of the trained model and to verify its generalisability. The specification and parameters of the FNN model are summarized in Table 2.

4. Experimental Results

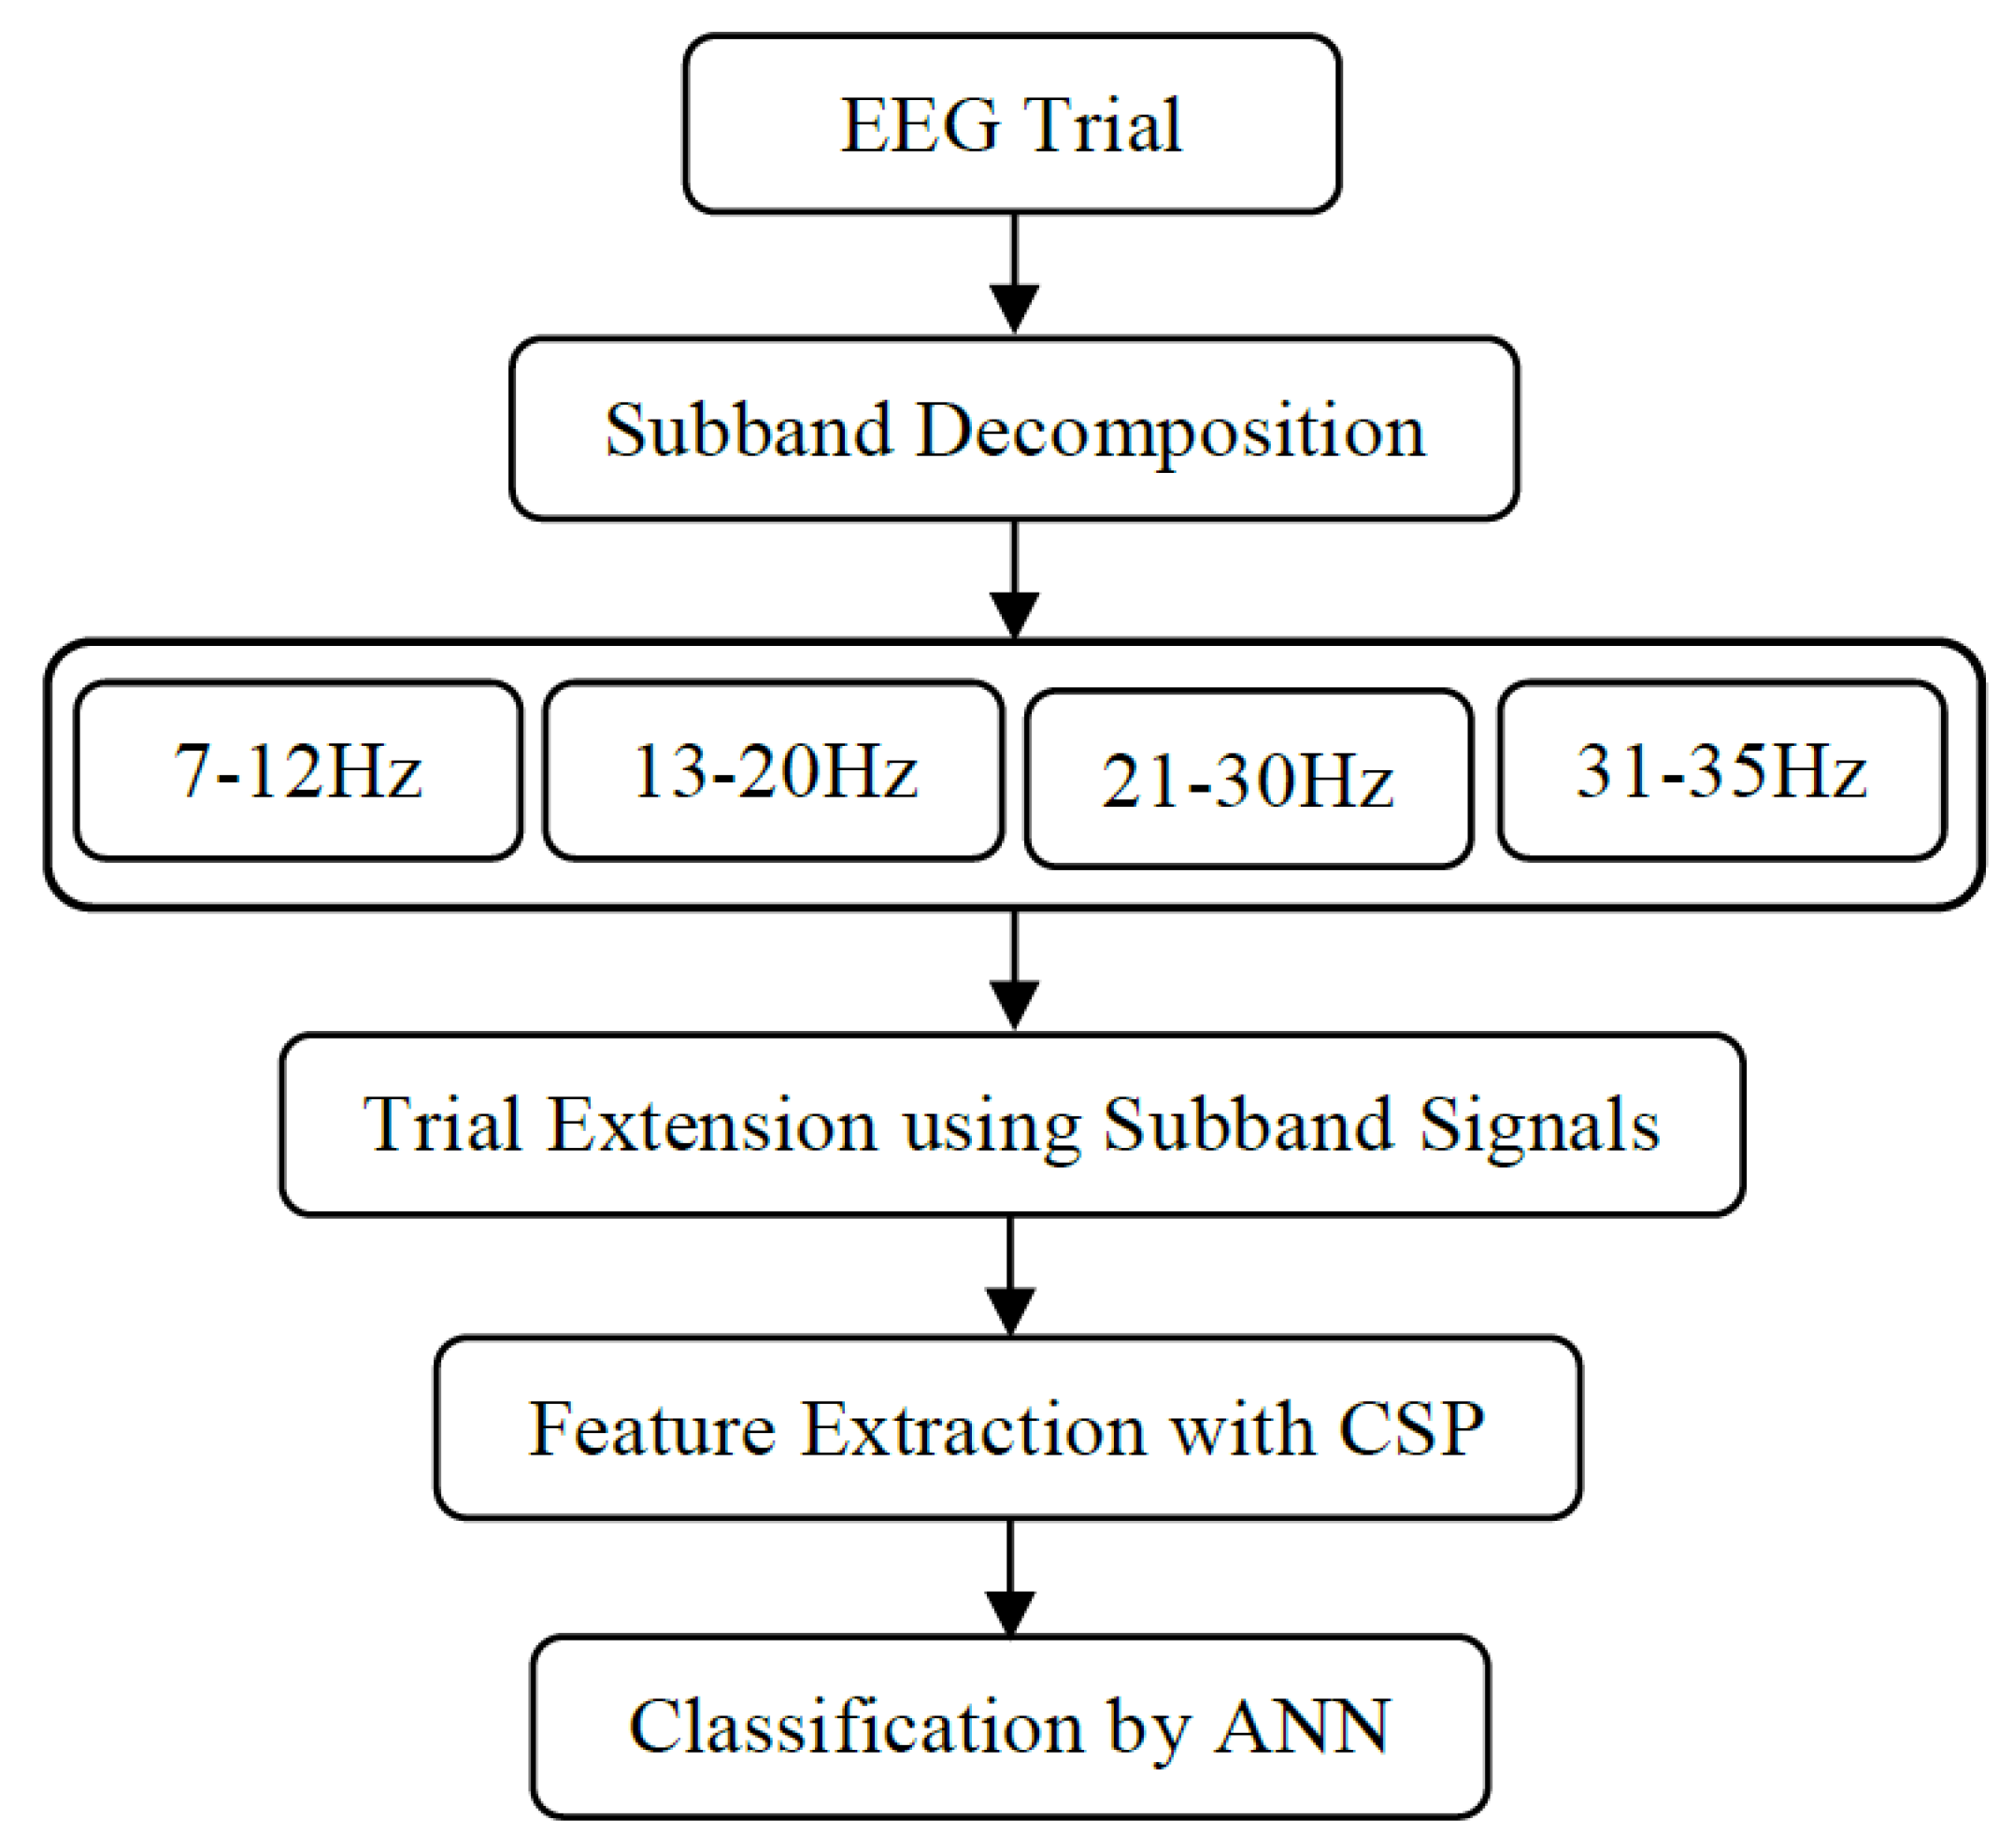
Publicly available two datasets, labeled as Dataset I and Dataset II, are used to evaluate the performance of the proposed method. The BCI Competition III (IVa) is referred to here as Dataset I and BCI Competition IV (I) is referred to as Dataset II, containing five and seven subjects, respectively. Different experiments are conducted with these two datasets to illustrate the efficacy of the proposed method for MI classification. In this study, binary classification is considered to categorize two MI tasks. Each channel of any EEG trial is decomposed into four subband signals after pre-processing, which are the four rhythmic components: alpha, low beta, high beta, and gamma. The components reflect different motor activities, and hence, they have a vital role in MI classification. The obtained subbands, i.e., rhythmic components, are arranged in spatial dimensions to implement the proposed trial extension method. The four components obtained from a channel are appended as individual rows after the channel itself. Then, the dimension of any trial becomes 5C × N, where C is the number of channels and N is the number of discrete samples.
The CSP is applied to the extended EEG trials to extract the spatial features. Thus, computed features are applied to train the classifier, leading to the evaluation of the performance of the proposed method by using FNN. The k-fold (k = 5) cross-validation is used to measure the algorithm’s performance in terms of classification accuracy. The dataset is randomly divided into k equal groups for each subject. The (k − 1) groups are used in training, and the rest are kept for testing. The procedure is repeated for k times. By averaging the results obtained from k repetitions, the accuracy is calculated. The performance is evaluated by classification accuracy Acc = 100 × (TC/TN), where TC and TN are the number of trials correctly recognized out of 
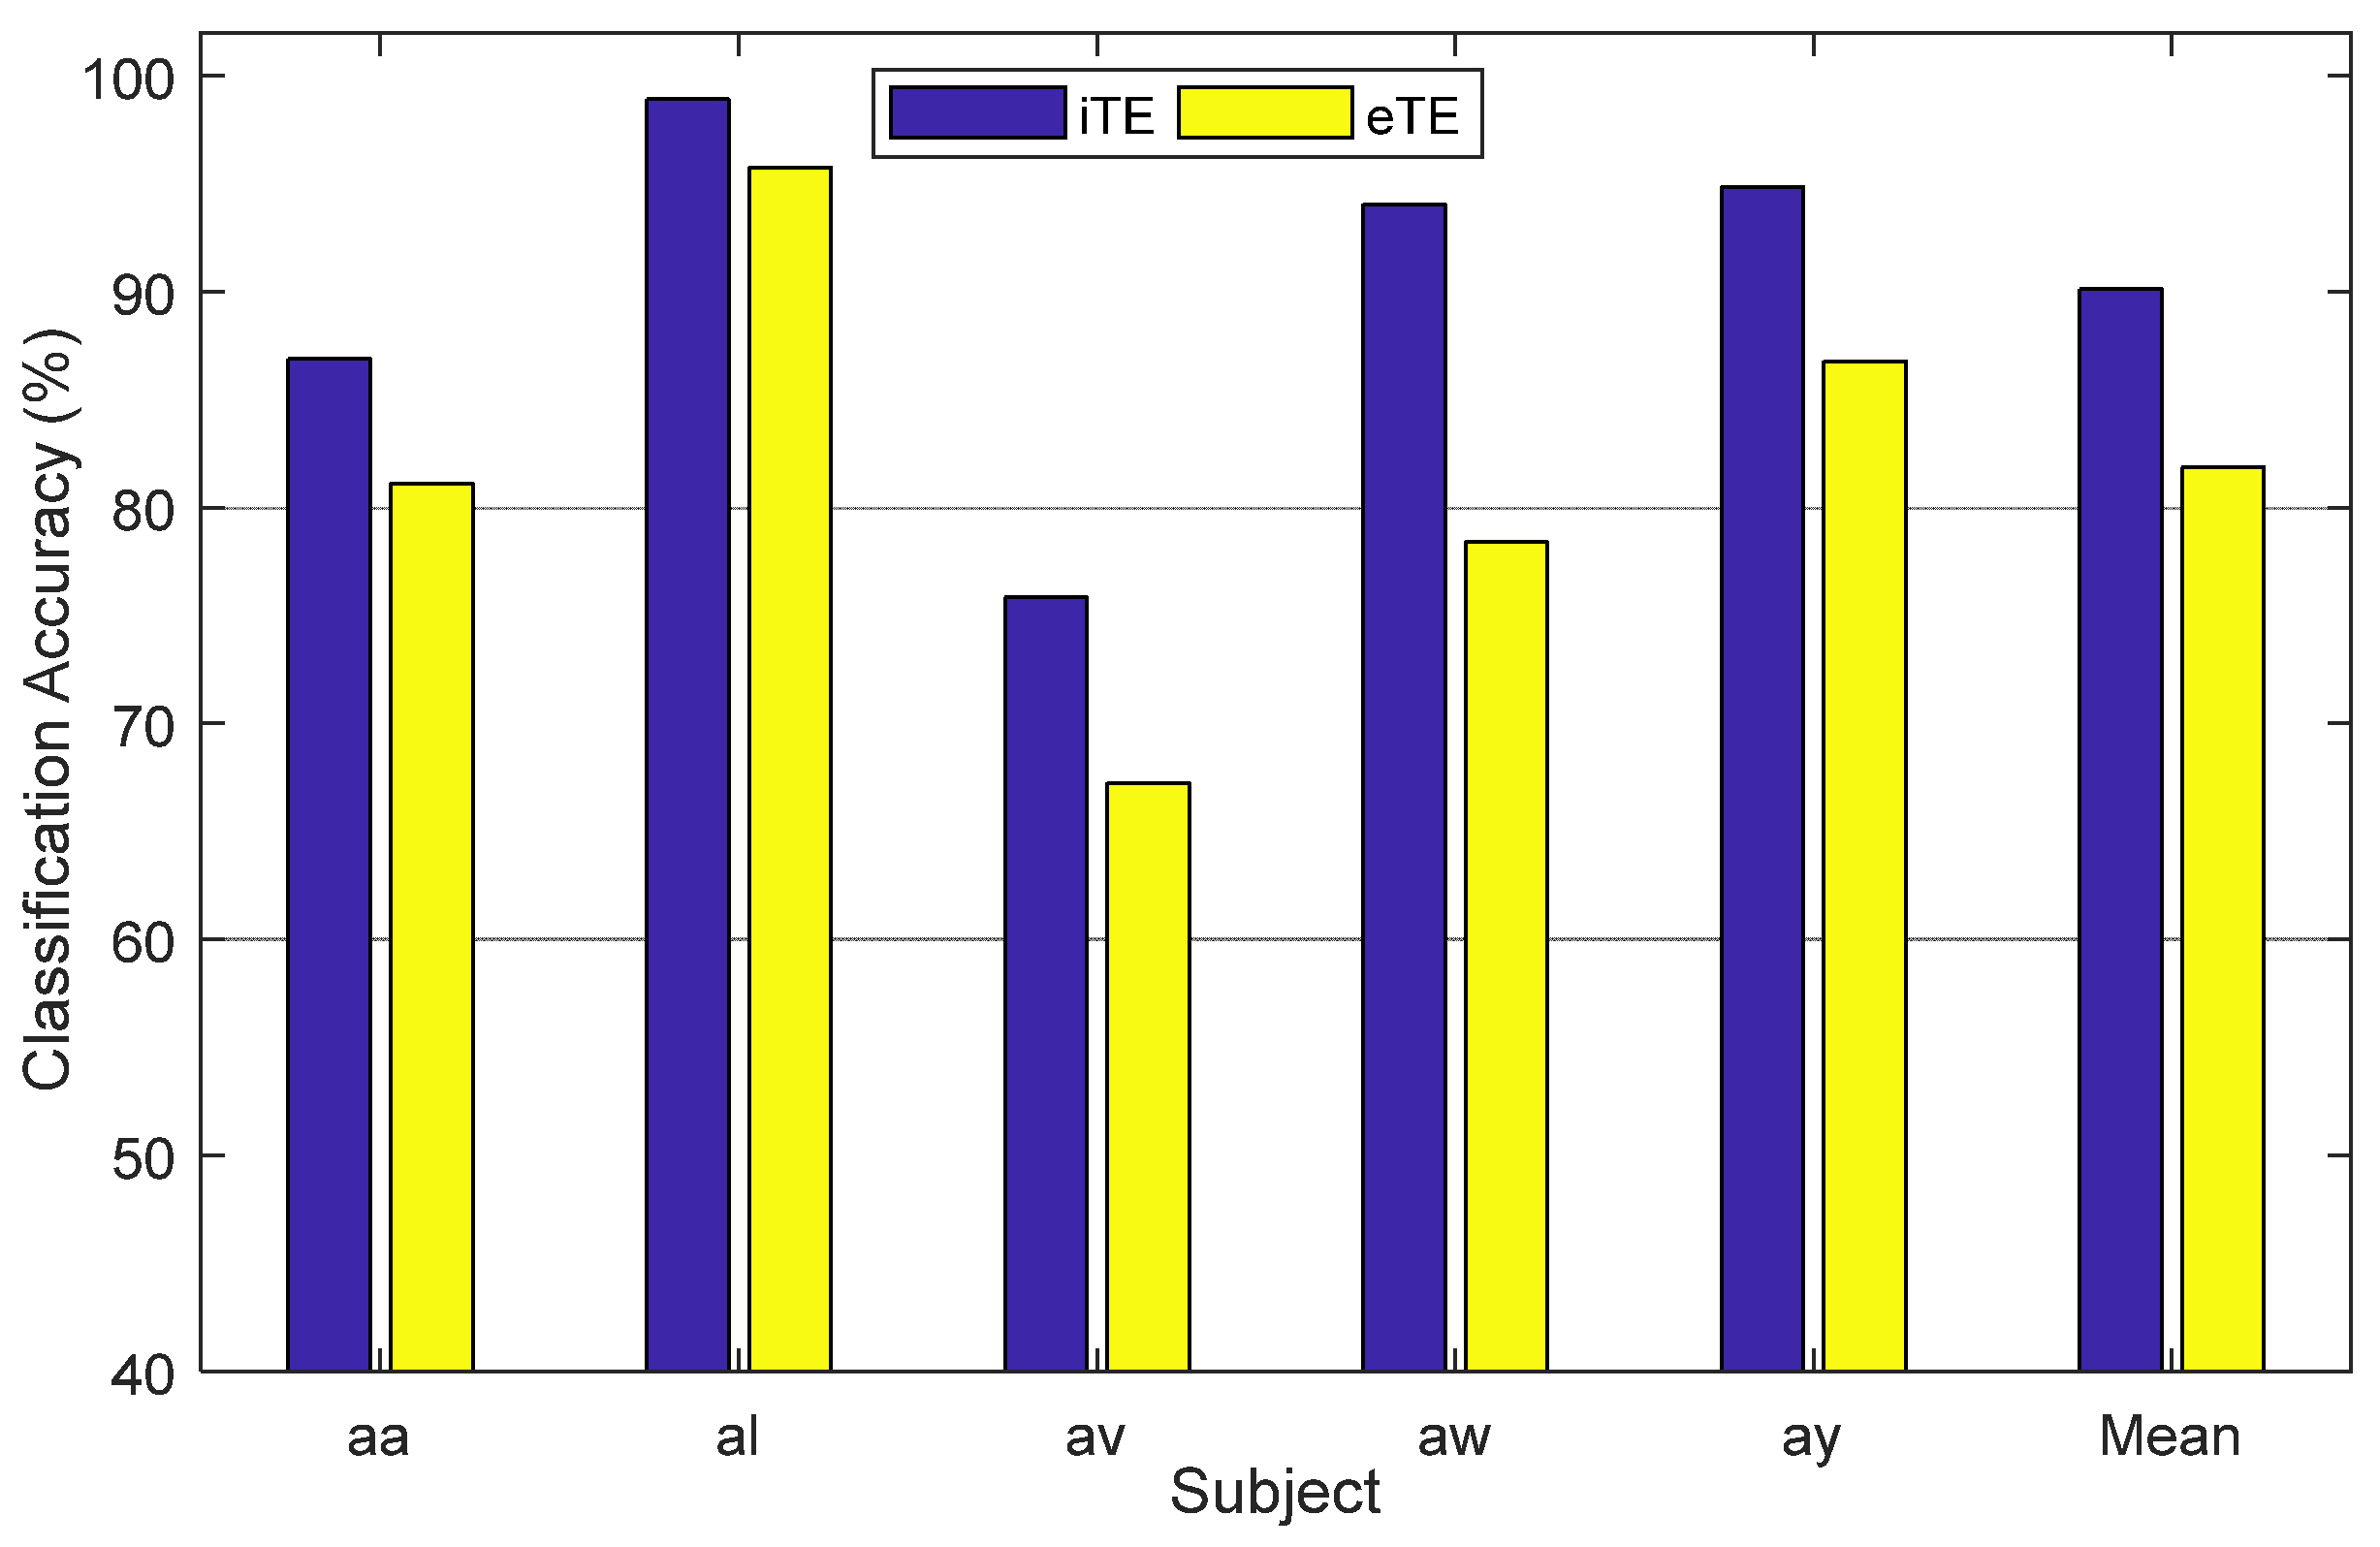
TN and the number of trials in the test dataset, respectively. The performance of the proposed method, including trial extension (iTE) with FNN, is first evaluated with Dataset I. In addition to iTE, the performance evaluation is also carried out, excluding the trial extension (eTE) approach. Each EEG channel is bandpass filtered using the frequency range of 4–40 Hz in eTE. It is implemented by applying CSP on the original trial (without extension) to obtain the spatial features leading to the application of FNN for MI classification. The two pairs of CSP features and five neurons assigned to the hidden layer of FNN are used for both methods. The performances of iTE and eTE are illustrated in Figure 4.
It is observed that the average classification performance is enhanced by 2.52% with iTE compared to the eTE method for Dataset I. The performances of iTE for individual subjects are relatively higher than that of eTE. The standard deviation of the MI classification accuracy with iTE (±9.08) is relatively lower than that with eTE (±10.53). The similar results are presented in Figure 5 with Dataset II. It is observed that there is an improvement in MI classification performance using iTE compared to eTE, whereas the standard deviation with iTE (±7.39) is lower than with eTE (±10.48).
The selection of the number of pairs of CSP filters is a vital factor for MI classification. On the other hand, the use of the number of neurons in the hidden layer is also a crucial factor in fixing the optimal performance of FNN. Both factors are determined experimentally to maximize the classification accuracy. The scalp EEG is very much a subject-sensitive tool to measure the neural response against motor activities. Hence, the number of pairs of CSP features and the number of neurons in the hidden layer are selected through a grid search approach for a specific subject. The features’ pairs and the number of neurons are gradually increased to observe the performance of FNN. The maximum accuracy is spotted in the grid, as illustrated in Figure 6. The number of neurons and the features’ pairs corresponding to the maximum accuracy are selected as usable factors to train the FNN for the specific subject. A similar method is repeated for each subject of both datasets to obtain the maximal performance of the proposed algorithm. Thus, the parameters are tuned to maximize the performance of MI classification with iTE, and it is termed iTE-tP (iTE with tuned parameters). In the case of subject ‘aa’ of Dataset I, the maximum classification accuracy is obtained with three pairs of CSP features and six neurons used in hidden layers of FNN, as illustrated in Figure 6.
The performance of iTE-tP is compared with iTE as well as eTE methods for Dataset I, as illustrated in Table 3.
It is observed that the proposed method iTE-tP outperforms the other two approaches. The average MI classification accuracy over the five subjects with iTE-tP is 93.88%, which is higher than both iTE (90.12%) and eTE (87.64%). The performance of the proposed method iTE-tP is enhanced by 3.76% and 5.24% compared to iTE and eTE methods, respectively. The statistically significant analysis is also obtained to illustrate the superiority of the proposed method iTE-tP. According to the Tukey–Kramer-based post-hoc test [39], the proposed iTE-tP method demonstrates notably superior accuracy across five subjects for MI classification than the other methods (iTE-tP vs. iTE: p < 0.05, iTE-tP vs. eTE: p < 0.002). There is a significant (p < 0.05) improvement in MI classification performance with respect to iTE and eTE.
The performances of iTE-tP, iTE, and eTE-based methods with Dataset II are illustrated in Table 4.
The proposed tuned parameter-based method (iTE-tP) exhibits maximum classification accuracy among the mentioned three methods with Dataset II. Its accuracy is enhanced by about 1.12% and 4.58% with respect to iTE and eTE methods, respectively. The 100% MI classification accuracy is achieved using the iTE-tP method for subject ‘e’. Although the maximum classification accuracy for subject ‘b’ is achieved by iTE, the maximum average accuracy (91.55%) is accomplished by the proposed method iTE-tP. A Tukey–Kramer-based post-hoc test [39] shows that the accuracy of iTE-tP is significantly higher than eTE across seven subjects for MI classification (iTE-tP vs. eTE: p < 0.002).

5. Discussion

The two publicly available datasets (Dataset I and Dataset II) are used to evaluate the performance of the method introduced in this study. Dataset I, i.e., BCI Competition III (IVa), is used in several recently developed methods to evaluate the MI classification performance [40,41,42,43]. The performance comparison (in accuracy) of the proposed method with Dataset I is illustrated in Table 5. The average classification accuracy of the proposed approach iTE-tP over all subjects is 93.88%. The accuracy of the iTE-tP method is compared with the methods implemented using regularized Riemannian features (RRF) [44] and the sparse group representation model (SGRM) of the CSP features [19]. The average classification accuracies of RRF and SGRM with Dataset I are 87.21% and 77.70%, respectively. It is noted that the Riemannian manifold-based feature is used in RRF [44] rather than CSP. The attractor metagene-based feature selection is used in [40] with proper parameter optimization of SVM (AM-SVM) to implement the MI classification with an average accuracy of 85.00%. There is an improvement in classification accuracy (92.20%) using neighborhood component analysis-based feature selection (NCFS) [24]. It is observed that the spatially sparse CSP (SSCSP) method [41] uses sparse CSP and obtains an accuracy of 73.36%. The spatial regularization of CSP is implemented in SRCSP [42] and results in a classification accuracy of 76.37% using Dataset I. The transfer kernel common spatial pattern (TKCSP) is introduced by Dai et al., 2018 [43]. The proposed method outperforms TKCSP by 13.44% in terms of accuracy. The MI classification accuracy with the unsupervised discriminative feature selection (UDFS)-based method [35] is 89.86%. The average performance of iTE-tP across all five subjects in Dataset I is 93.88%, which is at least 1.68% higher than that of all the recently reported methods illustrated in Table 5.
The statistical significance of the techniques listed in Table 5 is accomplished by the Tukey–Kramer–based post-hoc test [39]. According to the test results, the proposed iTE-tP approach demonstrates an enhancement in MI classification accuracy across the five subjects compared to other methods (iTE-tP vs. RRF: p < 0.03; iTE-tP vs. SGRM: p < 0.02; iTE-tP vs. SSCSP: p < 0.01; iTE-tP vs. SRCSP: p < 0.03; iTE-tP vs. TKCSP: p < 0.03; iTE-tP vs. AM-SVM: p < 0.04; iTE-tP vs. UDFS: p < 0.04; iTE-tP vs. eTE: p < 0.002) except NCSP (iTE-tP vs. NCFS: p > 0.06). The EEG trial extension using narrowband signals of individual channels has a significant role in improving classification accuracy. The narrowband features and the selection of the number of CSP features improve the classifier performance.
The MI classification performance in terms of accuracy of the proposed method is compared with a number of recently reported methods using Dataset II. There are seven subjects (namely a, b, c, d, e, f, and g) in the dataset, whereas only four (a, b, f, and g) of them are used to evaluate the performances in several algorithms [45,46,47,48,49]. The classification accuracies of these four subjects are illustrated in Table 6. With iTE-tP, the maximum average accuracy (89.53%) over the mentioned four subjects is achieved. It is higher than any other methods reported in Table 6. The effectiveness of the iTE-tP method is compared against noise-assisted multivariate empirical mode decomposition (NA-MEMD) [45], correlation-based channel selection featuring regularized CSP attributes (CCS-RCSP) [46], channel selection by a correlation coefficient combined with feature extraction via filter-bank CSP (CC-FBCSP) [47], and channel selection utilizing time domain parameters along with a correlation coefficient (TDP-CC) [48]. The performance of the proposed method iTE-tP is compared to noise-assisted multivariate empirical mode decomposition (NA-MEMD) [45], correlation-based channel selection with regularized CSP features (CCS-RCSP) [46], channel selection using a correlation coefficient with features extraction by filter-bank CSP (CC-FBCSP) [47], and channel selection with time domain parameters and a correlation coefficient (TDP-CC) [48]. The average accuracy of the method vertical arrangement of subbands with SVM (VaS-SVMlk) [25] is 87.72%, which is 1.81% lower than that of iTE-tP. The aspect of non-stationarity is taken into account for computing CSP [49], while the selection of effective channels based on the bi-spectrum was implemented by Jin et al., 2020 [50]. The MI classification accuracy of iTE-tP is higher than that of all algorithms, as mentioned in Table 6.
The NA-MEDM method [44] achieves 83.30% classification accuracy with four subjects of Dataset II. It is 6.23% lower than that of the proposed method iTE-tP. The intrinsic mode functions (IMFs) are the basis functions of EMD. In NA-MEMD, the required IMFs are selected heuristically. On the contrary, all the effective subbands are used in the proposed method, and the performance is improved.
Recently, the research on the selection of effective EEG channels has drawn attention. The performances of the proposed methods (iTE-tP and eTE) are compared with the recently developed three algorithms [46,47,48], as shown in Table 6. The correlation-based method, correlation coefficient, and time domain parameter with a correlation coefficient are implemented in CCS-RCSP [46], CC-FBCSP [47], and TDP-CC [48], respectively, to select potential EEG channels. The proposed method iTE-tP exhibits an average MI classification accuracy (89.53%) that is at least 5.13% higher than any of the channel selection-based approaches [46,47,48]. The focus of the proposed techniques lies in extracting promising features from trials that are regenerated through the utilization of narrowband signals from each channel. The performance of MI classification is enhanced by localizing the components associated with the MI task in the frequency domain. The methods based on channel selection [46,47,48] are primarily concentrated on choosing impactful channels rather than extracting potential features.
The significance of the proposed method is studied using appropriate statistical tests. The Tukey–Kramer-based post-hoc test [39] suggests that the accuracy (with four subjects of Dataset II) of the proposed method iTE-tP is significantly higher than the other methods (iTE-tP vs. NA-MEMD: p < 0.05; iTE-tP vs. CCS-RCSP: p < 0.04, iTE-tP vs. CC-FBCSP: p < 0.04, iTE-tP vs. TDP-CC: p < 0.05, iTE-tP vs. NS-CSP: p < 0.01, iTE-tP vs. BCS-CSP: p < 0.04, iTE-tP vs. eTE: p < 0.001) except VaS-SVMlk (iTE-tP vs. VaS-SVMlk: p > 0.052).
All seven subjects from Dataset II are used to compare the performance of iTE-tP with other related methods, as illustrated in Table 7. Park et al., 2019 [51], present spatial region-based frequency optimized CSP (LRFCSP) features for MI classification. The selected spatial regions yield features that are highly effective. Feng et al., 2018 [52], have introduced a novel algorithm on the basis of correlation-based time window selection (CTWS). The algorithm addresses the issue of using a static time window frequency-optimized features used in MI-based BCI systems. A limited number of localized spatial areas are selected to extract the optimal feature set. The feature derived from subspace optimization has been applied to achieve optimal performance.
Table 7 demonstrates a comparison of the mean MI classification accuracies of iTE-tP across seven subjects from Dataset II with the newly developed algorithms CTWS [52], LRFCSP [51], and VaS-SVMlk [25]. The results show that the mean classification accuracy of iTE-tP (91.55%) outperforms LRFCSP [51], CTWS [52], and VaS-SVMlk [25].
The maximum accuracy only for subject ‘c’ is attained by CTWS (85.50%), whereas the proposed method iTE-tP exhibits maximum accuracy for the other six subjects. The maximum average accuracy over the seven subjects is achieved by iTE-tP (shown in Table 7). The average accuracy of iTE-tP is 6.85%, 6.69%, and 1.95% higher than that of LRFCSP [51], CTWS [52], and VaS-SVMlk [25], respectively. A statistical test is conducted to assess the significance of the proposed approach. It is suggested by the Tukey–Kramer post-hoc test [39] that the accuracy of iTE-tP over all subjects of Dataset II is significantly (p < 0.05) higher than the other methods (iTE-tP vs. LRFCSP: p < 0.03; iTE-tP vs. CTWS: p < 0.03; iTE-tP vs. eTE: p < 0.002) except VaS-SVMlk (iTE-tP vs. VaS-SVMlk: p > 0.05). The important reason for the performance improvement of the proposed method is the integration of the rhythmic components of EEG signals in trial regeneration. The rhythmic components exhibit a better representation of neural activities represented by EEG signals recorded from the scalp. Hence, the features extracted from the proposed extended trials are more discriminative for MI classification. The multichannel EEG signal has the apparent features of MI activities. Additionally, several rhythmic components are responsible for representing MI in EEG signals. In the proposed trial extension-based method, the features are derived by integrating both types of signals (narrowband and wideband). It is obvious that the combined approach with full-band EEG and narrowband rhythmic components enhances the performance of MI classification. The subject-dependent parameter optimization is implemented to maximize the classification performance, and hence, the proposed method outperforms the others.
The classification accuracy of the proposed method is quantitatively compared with several existing methods. The performance of the deep learning approach is not tested due to the inadequacy of data volume. The MI events, as well as their classification performance, are very much subject-dependent. The number of subjects is also limited to declare it a robust method. Two publicly available datasets are used in this study. The spatial resolutions represented by the number of EEG channels are different for individual datasets. A similar pre-processing is performed for both datasets and hence, there is a possibility to affect the results. The evaluation of the performance of the proposed method using other available benchmark datasets and the comparison of MI classification performance with a convolution neural network are considered future extensions of this work.

6. Conclusions

In this study, a method for extracting features based on trial extension is implemented for the classification of MI with EEG signals. Two publicly available datasets (Dataset I and Dataset II) are employed in experiments to evaluate the performance of the proposed method. The 30 channels out of 118 are used for Dataset I to represent a binary MI task for EEG classification within the context of the BCI framework. The multichannel EEG signals of frequency range 7–35 Hz are decomposed into four subbands that include mu, low beta, high beta, and gamma rhythmic components. The extracted narrowband (rhythmic components) and the full-band signals of the EEG channel are arranged to extend the trial dimension, termed trial extension. The CSP-based features are extracted from the EEG signals of extended trials, and then, a feed-forward neural network is used for classification. A high-dimensional feature space is produced by CSP. It is noted that the selection of the number of usable features and the number of hidden layer neurons in FNN are crucial factors for MI classification performance. A subject-dependent grid search approach is implemented to select the number of features obtained from CSP as well as the number of hidden neurons in FNN. The trial extension, the selection of features, and the number of hidden neurons enhance the MI classification accuracy of the proposed method.
A filter bank is designed to separate the narrowband rhythmic components containing the signal components usable for movement-related MI classification. In addition to these components, the EEG channel with a full band (4–40 Hz) is also included in the trial. Incorporating the full-band signal plays a vital role in distinguishing MI tasks. The superiority of the proposed method becomes clear when the performance is evaluated using publicly available EEG datasets. Various experimental assessments are carried out for the binary MI-based EEG classification challenge. The experimental results of the proposed method are compared with recent algorithms. It is observed that the proposed trial extension-based method enhances the classification accuracy. The obtained result establishes the superiority of the proposed method.

Author Contributions

Conceptualization, M.K.I.M.; methodology, M.K.I.M.; software, S.A. and A.M.M.A.; validation, M.K.I.M. and S.A.; formal analysis, M.K.I.M.; investigation, A.M.M.A.; resources, H.W.; data curation, S.A.; writing—original draft preparation, S.A. and M.K.I.M.; writing, review and editing, H.W.; visualization, S.A.; supervision, M.K.I.M.; project administration, H.W.; funding acquisition, H.W. All authors have read and agreed to the published version of the manuscript.

Funding

This work was supported in part by JSPS KAKENHI (16H01616, 17H06383) and the JSPS Invitational Fellowships for Research in Japan (FY2019, ID: S19169).

Data Availability Statement

All the data used in this study are publicly available.

Conflicts of Interest

The authors declare no conflict of interest.

References

  1. Gao, S.; Wang, Y.; Gao, X.; Hong, B. Visual and auditory brain—Computer interfaces. IEEE Trans. Biomed. Eng. 2014, 61, 1436–1447. [Google Scholar]
  2. van Dokkum, L.; Ward, T.; Laffont, I. Brain computer interfaces for neurorehabilitation—Its current status as a rehabilitation strategy post-stroke. Ann. Phys. Rehabil. Med. 2015, 58, 3–8. [Google Scholar] [CrossRef]
  3. Nuyujukian, P.; Fan, J.M.; Kao, J.C.; Ryu, S.I.; Shenoy, K.V. A High-Performance Keyboard Neural Prosthesis Enabled by Task Optimization. IEEE Trans. Biomed. Eng. 2015, 62, 21–29. [Google Scholar] [CrossRef]
  4. Al-Qazzaz, N.K.; Aldoori, A.A.; Ali, S.H.B.M.; Ahmad, S.A.; Mohammed, A.K.; Mohyee, M.I. EEG Signal Complexity Measurements to Enhance BCI-Based Stroke Patients’ Rehabilitation. Sensors 2023, 23, 3889. [Google Scholar] [CrossRef]
  5. Lakshminarayanan, K.; Shah, R.; Daulat, S.R.; Moodley, V.; Yao, Y.; Sengupta, P.; Ramu, V.; Madathil, D. Evaluation of EEG Oscillatory Patterns and Classification of Compound Limb Tactile Imagery. Brain Sci. 2023, 13, 656. [Google Scholar] [CrossRef]
  6. Lakshminarayanan, K.; Shah, R.; Daulat, S.R.; Moodley, V.; Yao, Y.; Madathil, D. The effect of combining action observation in virtual reality with kinesthetic motor imagery on cortical activity. Front. Neurosci. 2023, 17, 1201865. [Google Scholar] [CrossRef]
  7. Faust, O.; Acharya, R.; Allen, A.; Lin, C. Analysis of EEG signals during epileptic and alcoholic states using AR modeling techniques. IRBM 2008, 29, 44–52. [Google Scholar] [CrossRef]
  8. Guerrero-Mosquera, C.; Vazquez, A.N. New approach in features extraction for EEG signal detection. In Proceedings of the Annual International Conference of the IEEE Engineering in Medicine and Biology Society (EMBC ’09), Minneapolis, MN, USA, 3–6 September 2009; pp. 13–16. [Google Scholar]
  9. Übeyli, E.D. Analysis of EEG signals by combining eigenvector methods and multiclass support vector machines. Comput. Biol. Med. 2008, 38, 14–22. [Google Scholar] [CrossRef]
  10. Cvetkovic, D.; Übeyli, E.D.; Cosic, I. Wavelet transform feature extraction from human PPG, ECG, and EEG signal responses to ELF PEMF exposures: A pilot study. Digit. Signal Process. 2008, 18, 861–874. [Google Scholar] [CrossRef]
  11. Subasi, A.; Kiymik, M.K.; Alkan, A.; Koklukaya, E. Neural Network Classification of EEG Signals by Using AR with MLE Preprocessing for Epileptic Seizure Detection. Math. Comput. Appl. 2005, 10, 57–70. [Google Scholar] [CrossRef]
  12. Lemm, S.; Blankertz, B.; Curio, G.; Muller, K.-R. Spatio-spectral filters for improving the classification of single trial EEG. IEEE Trans. Biomed. Eng. 2005, 52, 1541–1548. [Google Scholar] [CrossRef]
  13. Samek, W.; Vidaurre, C.; Müller, K.-R.; Kawanabe, M. Stationary common spatial patterns for brain–computer interfacing. J. Neural Eng. 2012, 9, 026013. [Google Scholar] [CrossRef]
  14. Ang, K.K.; Chin, Z.Y.; Wang, C.; Guan, C.; Zhang, H. Filter Bank Common Spatial Pattern Algorithm on BCI Competition IV Datasets 2a and 2b. Front. Neurosci. 2012, 6, 39. [Google Scholar] [CrossRef]
  15. Higashi, H.; Tanaka, T. Simultaneous Design of FIR Filter Banks and Spatial Patterns for EEG Signal Classification. IEEE Trans. Biomed. Eng. 2012, 60, 1100–1110. [Google Scholar] [CrossRef]
  16. Novi, Q.; Guan, C.; Dat, T.H.; Xue, P. Sub-band common spatial pattern (SBCSP) for brain-computer interface. In Proceedings of the International IEEE/EMBS Conference on Neural Engineering, Kohala Coast, HI, USA, 2–5 May 2007; pp. 204–207. [Google Scholar]
  17. Zhang, Y.; Zhou, G.; Jin, J.; Wang, X.; Cichocki, A. Optimizing spatial patterns with sparse filter bands for motor-imagery based brain–computer interface. J. Neurosci. Methods 2015, 255, 85–91. [Google Scholar] [CrossRef]
  18. Thomas, K.P.; Guan, C.; Lau, C.T.; Vinod, A.P.; Ang, K.K. A New Discriminative Common Spatial Pattern Method for Motor Imagery Brain–Computer Interfaces. IEEE Trans. Biomed. Eng. 2009, 56, 2730–2733. [Google Scholar] [CrossRef]
  19. Jiao, Y.; Zhang, Y.; Chen, X.; Yin, E.; Jin, J.; Wang, X.Y.; Cichocki, A. Sparse Group Representation Model for Motor Imagery EEG Classification. IEEE J. Biomed. Health Inform. 2018, 23, 631–641. [Google Scholar] [CrossRef]
  20. Molla, M.K.I.; Islam, M.R.; Tanaka, T.; Rutkowski, T. Artifact suppression from EEG signals using data adaptive time domain filtering. Neurocomputing 2012, 97, 297–308. [Google Scholar] [CrossRef]
  21. Zhang, Q.; Benveniste, A. Wavelet networks. IEEE Trans. Neural Netw. 1992, 3, 889–898. [Google Scholar] [CrossRef]
  22. Oweiss, K.G.; Anderson, D.J. Noise reduction in multichannel neural recordings using a new array wavelet denoising algorithm. Neurocomputing 2001, 38–40, 1687–1693. [Google Scholar] [CrossRef]
  23. Islam, M.R.; Tanaka, T.; Molla, M.K.I. Multiband Tangent Space Mapping and Feature Selection for Classification of EEG during Motor Imagery. J. Neural Eng. 2018, 15, 046021. [Google Scholar] [CrossRef] [PubMed]
  24. Molla, M.K.I.; Shiam, A.A.; Islam, M.R.; Tanaka, T. Discriminative Feature Selection Based Motor Imagery Classification Using EEG Signal. IEEE Access 2020, 8, 98255–98265. [Google Scholar] [CrossRef]
  25. Molla, K.I.; Saha, S.K.; Yasmin, S.; Islam, R.; Shin, J. Trial Regeneration with Subband Signals for Motor Imagery Classification in BCI Paradigm. IEEE Access 2021, 9, 7632–7642. [Google Scholar] [CrossRef]
  26. Dornhege, G.; Blankertz, B.; Curio, G.; Müller, K.R. Boosting bit rates in non-invasive EEG single-trial classifications by feature combination and multi-class paradigms. IEEE Trans. Biomed. Eng. 2004, 51, 993–1002. [Google Scholar] [CrossRef]
  27. He, L.; Hu, D.; Wan, M.; Wen, Y.; von Deneen, K.M.; Zhou, M. Common Bayesian Network for Classification of EEG-Based Multiclass Motor Imagery BCI. IEEE Trans. Syst. Man Cybern. Syst. 2016, 46, 843–854. [Google Scholar] [CrossRef]
  28. Sreeja, S.R.; Rabha, J.; Samanta, D.; Mitra, P.; Sarma, M. Classification of motor imagery based EEG signals using sparsity approach. In Proceedings of the International Conference on Intelligent Human Computer Interaction, New York, NY, USA, 25–29 September 2017; pp. 47–59. [Google Scholar]
  29. Rabha, J.; Nagarjuna, K.Y.; Samanta, D.; Mitra, P.; Sarma, M. Motor imagery EEG signal processing and classification using machine learning approach. In Proceedings of the International Conference on New Trends in Computing Sciences (ICTCS), Amman, Jordan, 11–13 October 2017; pp. 61–66. [Google Scholar]
  30. Yeh, C.-Y.; Su, W.-P.; Lee, S.-J. An efficient multiple-kernel learning for pattern classification. Expert Syst. Appl. 2013, 40, 3491–3499. [Google Scholar] [CrossRef]
  31. Klem, G.; Lüders, H.; HH, H.J.; Elger, C. The ten-twenty electrode system of the International Federation. Electroencephalogr. Clin. Neurophysiol. 1999, 52, 3–6. [Google Scholar]
  32. Yu, H.; Ba, S.; Guo, Y.; Guo, L.; Xu, G. Effects of Motor Imagery Tasks on Brain Functional Networks Based on EEG Mu/Beta Rhythm. Brain Sci. 2022, 12, 194. [Google Scholar] [CrossRef]
  33. Hsu, K.-C.; Yu, S.-N. Detection of seizures in EEG using subband nonlinear parameters and genetic algorithm. Comput. Biol. Med. 2010, 40, 823–830. [Google Scholar] [CrossRef]
  34. Molla, M.K.I.; Tanaka, T.; Osa, T.; Islam, M.R. EEG signal enhancement using multivariate wavelet transform application to single-trial classification of event-related potentials. In Proceedings of the IEEE International Conference on Digital Signal Processing, Singapore, 21–24 July 2015; pp. 804–808. [Google Scholar]
  35. Shiam, A.A.; Islam, M.R.; Tanaka, T.; Molla, M.K.I. Electroencephalography Based Motor Imagery Classification Using Unsupervised Feature Selection. In Proceedings of the Cyberworld, Kyoto, Japan, 2–4 October 2019. [Google Scholar]
  36. Zhang, Y.; Wang, Y.; Zhou, G.; Jin, J.; Wang, B.; Wang, X.; Cichocki, A. Multi-kernel extreme learning machine for EEG classification in brain-computer interfaces. Expert Syst. Appl. 2018, 96, 302–310. [Google Scholar] [CrossRef]
  37. Suefusa, K.; Tanaka, T. Asynchronous Brain–Computer Interfacing Based on Mixed-Coded Visual Stimuli. IEEE Trans. Biomed. Eng. 2018, 65, 2119–2129. [Google Scholar] [CrossRef] [PubMed]
  38. Bebis, G.; Georgiopoulos, M. Feed-forward neural networks. IEEE Potentials 1994, 13, 27–31. [Google Scholar] [CrossRef]
  39. Molla, M.K.I.; Morikawa, N.; Islam, M.R.; Tanaka, T. Data-adaptive Spatiotemporal ERP Cleaning for Single-trial BCI Implementation. IEEE Trans. Neural Syst. Rehabil. Eng. 2018, 26, 1334–1344. [Google Scholar] [CrossRef]
  40. Selim, S.; Tantawi, M.M.; Howida, A.S.; Badr, A. A CSP\AM-BA-SVM Approach for Motor Imagery BCI System. IEEE Access 2018, 6, 49192–49208. [Google Scholar] [CrossRef]
  41. Arvaneh, M.; Guan, C.; Ang, K.K.; Quek, H.C. Spatially sparsed common spatial pattern to improve BCI performance. In Proceedings of the IEEE International Conference on Acoustics, Speech and Signal Processing, Prague, Czech Republic, 22–27 May 2011; pp. 2412–2415. [Google Scholar]
  42. Lotte, F.; Guan, C. Spatially regularized common spatial patterns for EEG classification. In Proceedings of the 20th International Conference on Pattern Recognition, Washington, DC, USA, 23–26 August 2010; pp. 3712–3715. [Google Scholar]
  43. Dai, M.; Zheng, D.; Liu, S.; Zhang, P. Transfer Kernel Common Spatial Patterns for Motor Imagery Brain-Computer Interface Classification. Comput. Math. Methods Med. 2018, 2018, 9871603. [Google Scholar] [CrossRef] [PubMed]
  44. Singh, A.; Lal, S.; Guesgen, H.W. Small Sample Motor Imagery Classification Using Regularized Riemannian Features. IEEE Access 2019, 7, 46858–46869. [Google Scholar] [CrossRef]
  45. Park, C.; Looney, D.; Rehman, N.U.; Ahrabian, A.; Mandic, D.P. Classification of Motor Imagery BCI Using Multivariate Empirical Mode Decomposition. IEEE Trans. Neural Syst. Rehabil. Eng. 2012, 21, 10–22. [Google Scholar] [CrossRef]
  46. Jin, J.; Miao, Y.; Daly, I.; Zuo, C.; Hu, D.; Cichocki, A. Correlation-based channel selection and regularized feature optimization for MI-based BCI. Neural Netw. 2019, 118, 262–270. [Google Scholar] [CrossRef]
  47. Park, Y.; Chung, W. Optimal Channel Selection Using Correlation Coefficient for CSP Based EEG Classification. IEEE Access 2020, 8, 111514–111521. [Google Scholar] [CrossRef]
  48. Park, Y.; Chung, W. Selective Feature Generation Method Based on Time Domain Parameters and Correlation Coefficients for Filter-Bank-CSP BCI Systems. Sensors 2019, 19, 3769. [Google Scholar] [CrossRef]
  49. Wang, H.; Xu, T.; Tang, C.; Yue, H.; Xu, L.; Pei, Z.; Bezerianos, A.; Li, J. Diverse Feature Blend Based on Filter-Bank Common Spatial Pattern and Brain Functional Connectivity for Multiple Motor Imagery Detection. IEEE Access 2020, 8, 155590–155601. [Google Scholar] [CrossRef]
  50. Jin, J.; Liu, C.; Daly, I.; Miao, Y.; Li, S.; Wang, X.; Cichocki, A. Bispectrum-Based Channel Selection for Motor Imagery Based Brain-Computer Interfacing. IEEE Trans. Neural Syst. Rehabil. Eng. 2020, 28, 2153–2163. [Google Scholar] [CrossRef] [PubMed]
  51. Park, Y.; Chung, W. Frequency-Optimized Local Region Common Spatial Pattern Approach for Motor Imagery Classification. IEEE Trans. Neural Syst. Rehabil. Eng. 2019, 27, 378–1388. [Google Scholar] [CrossRef]
  52. Feng, J.; Yin, E.; Jin, J.; Saab, R.; Daly, I.; Wang, X.; Hu, D.; Cichocki, A. Towards correlation-based time window selection method for motor imagery BCIs. Neural Netw. 2018, 102, 87–95. [Google Scholar] [CrossRef] [PubMed]
Figure 1. The encircled (green color) thirty electrodes (channels) out of 118 are used in this study for experimental evaluation.
Mathematics 11 03801 g001
Figure 3. Arrangement of subband signals used for trial extension in the spatial domain.
Mathematics 11 03801 g003
Figure 4. MI classification performance (accuracy in percentage) of iTE with Dataset I. The results are compared with the eTE method.
Mathematics 11 03801 g004
Figure 5. MI classification performance (accuracy in percentage) of iTE with Dataset II. The performance factors are compared with the eTE approach.
Mathematics 11 03801 g005
Figure 6. The grid search approach to determine the number of hidden neurons and the pairs of CSP features of subject ‘aa’ from Dataset I. The pairs of CSP features and the hidden neurons are selected as three and six, respectively.
Mathematics 11 03801 g006
Table 1. Summary of the datasets used in this study to evaluate the performance of the proposed method.
DatasetOriginal NameSubjectsTrialsNo. of ChannelsSelected ChannelsDuration
Dataset IBCI Competition III (4a)5280118303.5 s
Dataset IIBCI Competition IV (i)720059234 s
Table 2. The summary of specifications and parameters of the FNN model.
Training Parameters/ComponentValues
Neural network model usedFeed-forward
Input nodesDetermined by the size of feature vector
Hidden layer1
Hidden layer neuronsDetermined by the grid-search approach
Output nodes1
Training network algorithmScaled conjugate gradient
Transfer function hidden and input layer Hyperbolic Tangent Sigmoid (HTS)
Transfer function output layerSoftmax
Data divisionRandom
No. of epochs1000
Validation checks (iterations)6
Table 3. Performance comparison of the methods iTE-tP, iTE, and eTE with Dataset I in terms of accuracy (%) and sensitivity (%). The bold numbers (both for accuracy and sensitivity) represent the maximum value of the row.
SubjectiTEiTE-tPeTE
SensitivityAccuracySensitivityAccuracySensitivityAccuracy
aa85.8886.9095.3294.9480.9881.12
al98.1298.9298.7598.1894.8995.76
av76.1175.8476.1276.2567.6267.24
aw94.8694.0699.89100.0077.8878.42
ay93.7894.8699.88100.0085.9886.78
Mean89.7590.1294.0093.8881.4781.87
SD8.869.0810.1710.0710.0710.54
Table 4. Performance comparison of the methods iTE-tP, iTE, and eTE with Dataset II in terms of accuracy (%) and sensitivity (%). The bold numbers (for accuracy and sensitivity) represent the maximum value of the row.
SubjectiTEiTE-tPeTE
SensitivityAccuracySensitivityAccuracySensitivityAccuracy
a93.8893.2494.8794.1482.6683.45
b77.7878.1578.6878.0860.4360.88
c84.2183.383.9884.8975.6776.44
d96.7797.4297.1297.7889.5690.43
e97.6798.3399.3410091.3392.68
f89.8989.2891.8691.0479.2279.54
g94.8793.5594.2194.8680.8481.88
Mean90.7390.4791.4491.5579.9680.76
SD7.347.447.457.6910.2510.49
Table 5. Comparison of classification accuracy (%) of the proposed iTE-tP method with recently developed algorithms with Dataset I. The bold numbers represent the maximum value of the column.
MethodsSubjectsMean ± SD
aaavalayaw
RRF [44]81.2576.53100.0091.2687.0587.22 ± 9.08
SGRM [19]73.9059.5094.5079.9080.7077.70 ± 12.67
SSCSP [41]72.3254.1096.4273.4170.5473.36 ± 13.50
SRCSP [42]69.6459.1896.4386.5170.0976.37 ± 13.31
TKCSP [43]68.1068.4793.8874.9388.4078.76 ± 10.54
AM-SVM [40]86.6166.84100.0080.9590.6385.00 ± 11.00
UDFS [35]86.9876.0497.4594.9493.9389.86 ± 8.65
NCFS [24]90.0076.7198.9397.1498.2192.20 ± 9.36
eTE81.1267.2495.7686.7878.4281.87 ± 10.53
Proposed iTE-tP94.9476.2598.18100.00100.0093.88 ± 9.00
Table 6. Comparison of classification accuracy (%) of the proposed method with recently developed algorithms using four subjects (a, b, f, and g) of Dataset II. The bold numbers represent the maximum value of the column.
MethodSubjectMean ± SD
abfg
VaS-SVMlk [25]92.5077.0088.8092.6087.72 ± 7.36
NA-MEMD [45]85.9077.6078.8090.9083.30 ± 6.25
CCS-RCSP [46]85.5067.0079.5094.5081.60 ± 11.50
CC-FBCSP [47]86.5069.5087.5094.0084.40 ± 8.20
TDP-CC [48]86.5057.2592.5090.5081.69 ± 16.80
NS-CSP [49]82.0067.5065.0087.5075.50 ± 11.00
BCS-CSP [50]79.0079.0092.0088.0084.50 ± 5.69
eTE83.4560.8879.5481.8876.44 ± 10.50
Proposed iTE-tP94.1478.0891.0494.8689.53 ± 6.82
Table 7. Comparison of classification accuracy (%) of the proposed method with recently developed algorithms using seven subjects of Dataset II. The bold numbers represent the maximum value of the row.
SubjectLRFCSP [51]CTWS [52]VaS-SVMlk [25]eTEProposed iTE-tP
a87.4083.0092.5083.4594.14
b70.0067.0077.0060.8878.08
c67.4085.5082.7076.4484.89
d92.9093.0096.4090.4397.78
e93.4099.0097.2092.68100.00
f88.8085.5088.8079.5491.04
g93.2081.0092.6081.8894.86
Mean84.7084.8689.6080.7691.55
SD5.7810.47.4110.487.11
Disclaimer/Publisher’s Note: The statements, opinions and data contained in all publications are solely those of the individual author(s) and contributor(s) and not of MDPI and/or the editor(s). MDPI and/or the editor(s) disclaim responsibility for any injury to people or property resulting from any ideas, methods, instructions or products referred to in the content.

