Article

Deep Learning-Based Classification of Abrasion and Ischemic Diabetic Foot Sores Using Camera-Captured Images

1
Department of Computer Engineering, Bahauddin Zakariya University, Multan 60000, Pakistan
2
Department of Computer Science, University of Management and Technology, Lahore 54000, Pakistan
3
Department of Intelligent Mechatronics Engineering, Sejong University, Seoul 05006, Republic of Korea
4
Division of Oncology, Washington University, St. Louis, MO 63130, USA
5
School of Computing, Gachon University, Seongnam 13120, Republic of Korea
6
School of Medicine, Sungkyunkwan University, Suwon 16419, Republic of Korea
*
Authors to whom correspondence should be addressed.
These authors contributed equally to this work.
Mathematics 2023, 11(17), 3793; https://doi.org/10.3390/math11173793
Submission received: 17 July 2023 / Revised: 25 August 2023 / Accepted: 1 September 2023 / Published: 4 September 2023

Abstract

:
Diabetic foot sores (DFS) are serious diabetic complications. The patient’s weakened neurological system damages the tissues of the foot’s skin, which results in amputation. This study aims to validate and deploy a deep learning-based system for the automatic classification of abrasion foot sores (AFS) and ischemic diabetic foot sores (DFS). We proposed a novel model combining convolutional neural network (CNN) capabilities with Vgg-19. The proposed method utilized two benchmark datasets to classify AFS and DFS from the patient’s foot. A data augmentation technique was used to enhance the accuracy of the training. Moreover, image segmentation was performed using UNet++. We tested and evaluated the proposed model’s classification performance against two well-known pre-trained classifiers, Inceptionv3 and MobileNet. The proposed model classified AFS and ischemia DFS images with an accuracy of 99.05%, precision of 98.99%, recall of 99.01%, MCC of 0.9801, and f1 score of 99.04%. Furthermore, the results of statistical evaluations using ANOVA and Friedman tests revealed that the proposed model exhibited a remarkable performance. The proposed model achieved an excellent performance that assist medical professionals in identifying foot ulcers.

1. Introduction

The human skin is the most extensive part of the human body [1]. It is flexible enough to allow movement for body parts, whereas it is strong enough to prevent ripping or breaking [2]. Every portion of the body has a different texture and thickness. The two primary layers that make up the skin are known as the epidermis and the dermis [3]. The epidermis is the outermost layer of the skin, composed of numerous cells organized in sheets [4]. The dermis is the layer that lies beneath the epidermis and is composed of protein fibers (collagen) and elastic fibers (elastin) that give the skin its suppleness and strength. Moreover, blood vessels, sebaceous glands, hair follicles, and nerve endings are all found in the dermis [1,2,3]. Abrasion occurs when the epidermis layer of the skin is damaged. Abrasions are more likely to occur on bony or thin-skinned body areas (such as the knees, ankles, and elbows) [5]. Abrasions frequently cause scraped skin that contains debris. A diabetic neuropathy ulcer, also known as a DNU, is a form of lesion that leads to major health issues such as kidney failure, lack of vision, amputation of lower limbs, and cardiovascular disease [6]. These medical problems are concerning symptoms that might accompany diabetic neuropathy in the foot. People with diabetes run the risk of developing open lesions on their feet, which are often commonly referred to as sores [7].
As reported by the International Diabetes Federation (IDF), the number of people with diabetic neuropathic ulcers is between 40 and 60 million worldwide [8]. In addition, the global diabetes prevalence estimates that the number of people living with diabetes reach 578 million by the end of 2030 and about 700 million by the end of 2045 [8]. Roughly 80% of patients come from developing nations, and these nations typically have poor health literacy and inadequate access to medical facilities [9]. Over one million individuals with “high-risk-foot” lose parts of their legs each year due to inadequate treatment and the failure to recognize neuropathic ulcers. Diabetic patients are responsible for monitoring their health, taking their medicine as prescribed, and scheduling regular checks with their primary care physician [10]. A traditional medical treatment approach is used to treat people whose ulcer sores are caused by neuropathic disorders. A diabetic foot specialist carefully examines the neuropathic ulcer; the patient’s medical history is reviewed; and additional tests like computed tomography (CT) [11], magnetic resonance imaging (MRI) [12], and x-rays are performed to initiate the treatment procedure. In most cases, the patient has swelling, itching, and soreness in their lower legs due to their condition. Some visible characteristics of a neuropathic ulcer are blisters, redness, slough, callus formation, scaly skin, essential tissues (such as granulation), and bleeding [13].
By utilizing computer vision techniques, it is possible to improve the diagnostic accuracy and the speed of the entire clinical practice [14]. Image processing is essential in the medical field for assisting physicians in identifying diseases. This methodology is utilized in the medical fields of surgery, biological imaging, and treatment planning [12]. Low-level image-processing processes (such as line recognition masks, region growth, and edge detection) [3] and analytical approaches [13] are used to address particular issues that are present in the healthcare domain. One of the most important steps in developing these disease detection systems is extracting relevant image features. Deep learning (DL) technologies [14] are widely used instead of traditional image-processing techniques. With the help of these technologies, computers now recognize the relevant features of a given medical condition [15].
Deep learning classifiers opened a door to diagnosing the disease [16,17]. The healthcare industry made significant and effective diagnostic advancements using CNN-based models [18,19]. These advancements are made in areas such as the detection of neuropathic ulcers [1], the segmentation and classification of breast tumors [20], the diagnosis of cancer cells [21,22], the analysis of genetic patterns [23,24], and image segmentation [25,26,27,28]. For this study, we developed a novel model that combines Vgg-19 with six layers of CNN to reliably categorize AFS and ischemic DFS from a patient’s foot. This is the first study that uses a Vgg-19 with CNN to detect the disease images related to AFS and ischemic DFS.
Moreover, the proposed model was compared to Inception-v3 [29] and Mobile Net [30] in terms of a wide range of performance evaluation parameters, such as accuracy, recall, precision, f1-score, “Mathews correlation coefficient” (MCC), and “area under the receiver operating characteristic” AU(ROC). This study aims to develop an automated deep learning system that assists healthcare professionals in classifying AFS and ischemic DFS swiftly and accurately. The main contribution of this work is stated as follows:
  • We present a novel deep learning-based model, in which features are extracted using Vgg-19 and then given to six layers of CNN to produce a final classification system. Furthermore, we also compared the proposed model with state-of-the-art (SOTA) models.
  • The quality of AFS and ischemic DFS images were increased using noise reduction and data pre-processing algorithms, which eliminated artefacts and noise from images. After evaluating our dataset, we selected preparation methods and parameter configurations that yielded the best results.
  • Statistical evaluations using ANOVA and Friedman tests were performed on the proposed method to validate its efficiency.
  • Image segmentation was performed using UNet++.
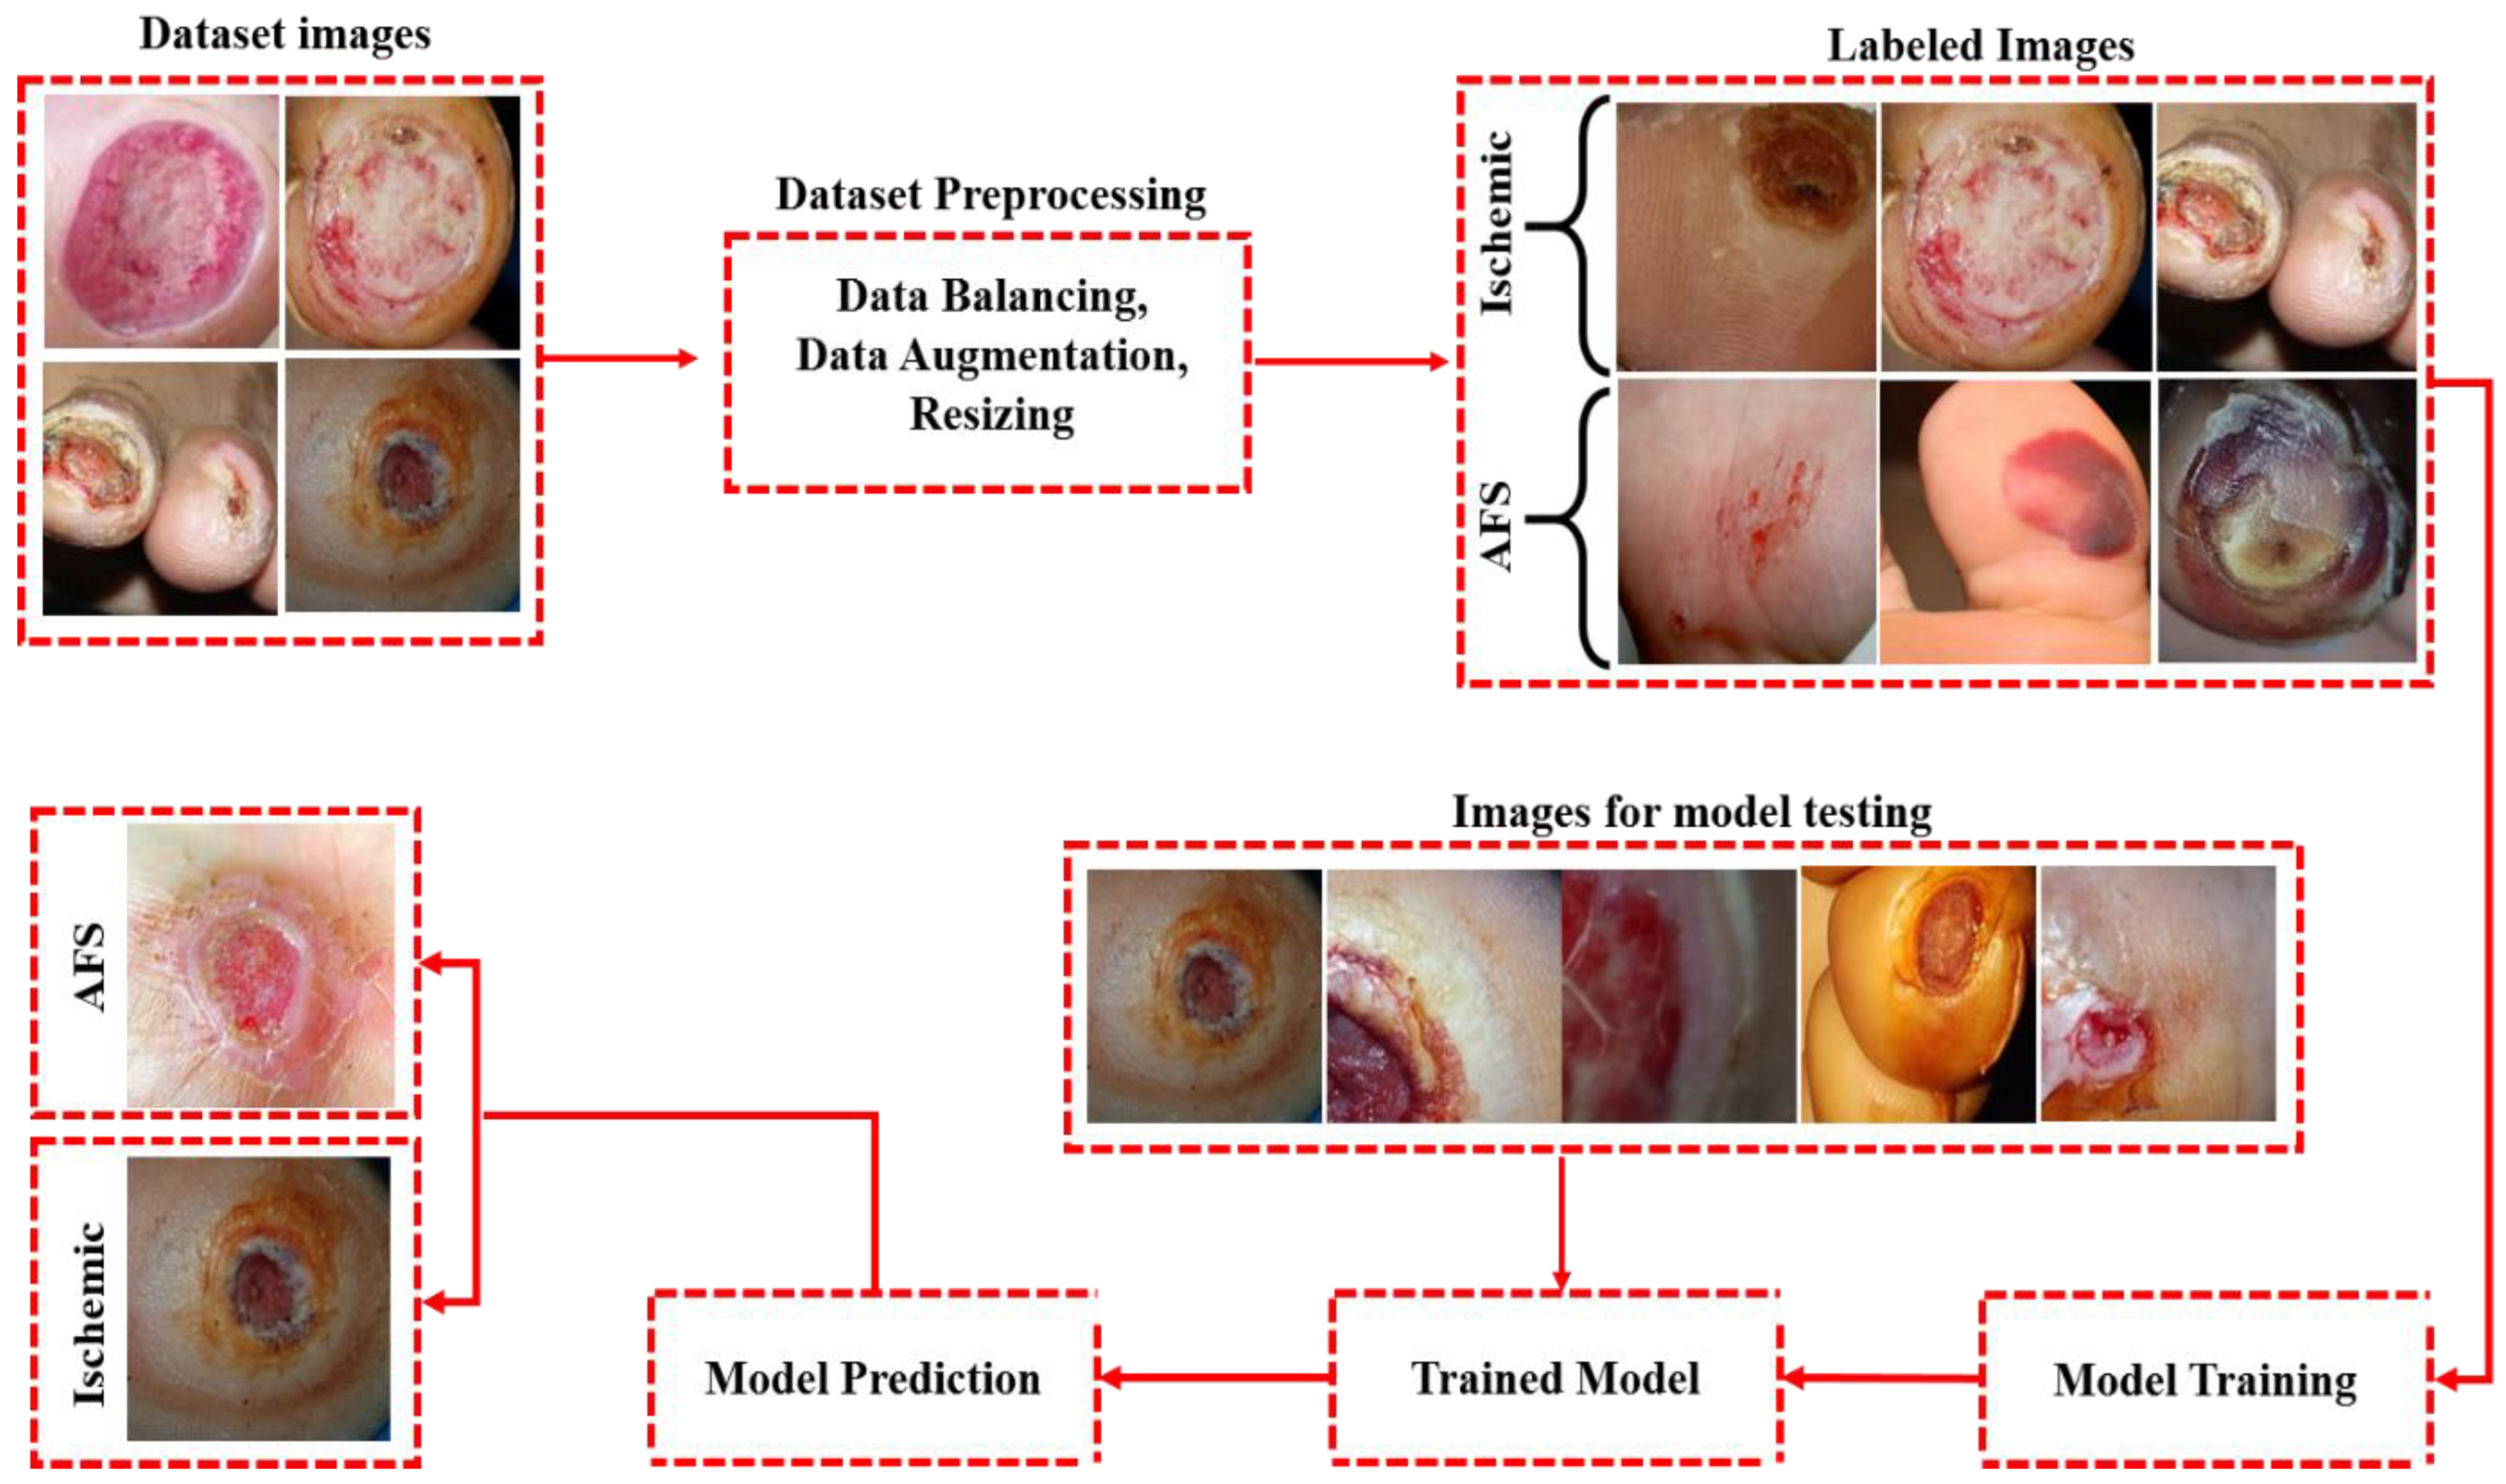
  • AFS and ischemic DFS images were used to train and evaluate the proposed model. Images of these two diseases were collected from publicly available databases to researchers [30,31]. Both datasets have a combined total of 2826 camera-captured images, in which 1413 images belonged to AFS and 1413 images belonged to ischemia DFS. A data augmentation technique was applied to enhance the number of images in the datasets, improving its classification performance. A total of 8478 images were used in the proposed model, with 70% representing the training set, 20% representing the validation set, and 10% representing the testing set.
  • The proposed model accomplished the following results: an accuracy score of 99.05%, a precision score of 98.99%, a recall score of 99.01%, an MCC score of 0.9801, and an f1 score of 99.04%.
  • The CNN-based pre-trained models, namely Inception-v3 and MobileNet, were fine-tuned and re-trained on the same datasets for the classification of foot ulcers. The results of these models were then compared with the results of the proposed model in terms of performance evaluation metrics. In the classification, the performance of the proposed model was found to be superior to that of the two pre-trained techniques.
  • We conducted an in-depth analysis of the most recent research on CNN-based classifiers in addition to the conventional machine learning approaches used for classifying AFS and ischemia DFS.
The following is the structure of this research: Section 2 covers recent developments in the relevant fields of study. The study’s methodology is presented in Section 3. Experimental results and a discussion are presented in Section 4. Limitations of this study are presented in Section 5. This study is concluded in Section 6.

2. Literature Review

Deep learning is utilized in developing several different healthcare systems that can diagnose various conditions, such as ischemic diabetic foot sores, neuropathic foot ulcers, and abrasions.
A computer vision-based system was developed to diagnose neuropathic ulcer patients for infection and ischemia [3]. A superpixel color technique was utilized for detection, and it was made possible with the assistance of CNN-based ensembling. Using this strategy, it reached an accuracy of 0.730 for infections and 0.900 for ischemic disease. Yap et al. [17] compared the work of the numerous authors who had contributed to the DFUC2020 challenge dataset. The DFUC2020 dataset contains 4000 images, with 2000 of those images serving as test data and the remaining 2000 serving as training data. They discovered that the method known as the Deformable Convolutional model (DCM), which is a version of the Faster R-CNN methodology, produced the greatest results. This method had an f1-score of 0.743. Alzubaidi et al. [30] presented a novel architecture for classifying healthy images and neuropathic ulcers in their study. DFU QUTNet is the name that has been given to this architecture. To analyze and compare the performance of the CNN-based pre-trained models such as AlexNet, GoogleNet, and VGG16, the researchers made a few minimal changes to the parameters of the models. The precision of the DFU QUTNet model was 95.4 percent, the recall was 93.6 percent, and the F1-score was 94.5 percent. AI-Garaawi et al. [32] designed a CNN method that may be used to classify DFU image datasets. The proposed approach includes two primary steps: Initially, a “mapped binary patterns” method was utilized to extract texture features from RGB photographs. This method produced a mapped binary image, including information on a texture. Then, information about the texture was inputted into the CNN model that was used to perform the classification task during the second stage. The suggested model performed quite well on the DFU dataset, with an AUC of 98.1% and an F1 score of 95.2%.
Goyal et al. [3] proposed a novel feature descriptor called the Superpixel Color Descriptor using a hand-crafted ML technique. The Ensemble Convolutional Neural Network (CNN) model was then implemented to improve the detection of ischemia and infection. We suggested using a natural data-augmentation technique that concentrated on the relevant region in images of people’s feet and extracted their most important data. This study focused on the binary classification of disease as ischemia versus benign. Overall, this technique was more successful in categorizing ischemia than infection. This method outperformed traditional ML methods and achieved a classification accuracy of 90% for ischemia.
Das et al. [33] focused on the model DFU-SPNet for categorizing DFU images instead of healthy ones. The DFU-SPNet model makes use of a variety of different kernel sizes and is composed of three tiers of convolutional layers, each of which abstracts both global and local features. The model achieved 97.4% AUC by utilizing the SDG optimizer in its construction. Thotad et al. [34] proposed a deep neural network model, EfficientNet, for early identification and diagnosis of diabetic foot ulcers. EfficientNet was employed for analyzing 840 images of feet, including images of feet with diabetic ulcers and healthy feet. EfficientNet outperformed previous models when the network’s width, depth, and image resolution were optimized. EfficientNet outperformed prominent models such as VGG16, GoogleNet, VGG19, and AlexNet. This method achieved an outstanding accuracy of 98.97%.
Stefanopoulos et al. [35] created a novel strategy for predicting neuropathic ulcers in diabetic patients by using a decision tree that he named “CTREE”. To estimate the chance of developing neuropathic ulcers, the authors of this study looked at a total of six relevant criteria. When it came to classification, the CTREE model produced the best results. This model had an accuracy of 0.789, an AUC of 0.88, a recall of 0.806, and a precision of 0.783.
To ascertain whether or not neuropathic ulcers were present, Costa [36] developed a two-layer architecture that he named Faster R-CNN DFU. This model’s first layer is a deep convolutional region proposal network (RPN), which can propose a region to the model’s second layer for neuropathic ulcer identification. Regarding the f1 score, they obtained a performance of 0.94 with their proposed model. The development of an intelligent method for identifying neuropathic ulcers was made possible by researchers [3,32] using spectral and infrared thermal imaging. Wang [37] developed a model that, when presented with an image, could find the neuropathic ulcer zone and pinpoint its exact location. An SVM was utilized in the construction of this model. Implementing a super pixel technique would allow for the completion of the segmentation stage, which was the first step in this procedure. Attributes would be extracted as part of the classification process, which would take place during the second phase of the model that has been proposed. The system suffers from several shortcomings, the most notable of which is its inability to process huge datasets; among these shortcomings is the fact that it is impracticable to use the captured picture box for data collecting. This is because the patient’s foot needs to be in direct contact with the box’s surface, which is not permitted in healthcare settings due to concerns regarding infection control. After putting into practice the procedure that had been suggested, the findings yielded a precision of 0.733 and a recall of 0.946. Cui et al. [38] developed an algorithm for the segmentation of diabetic patients’ sores that was based on CNN. The University of New York provided the dataset used in this study effort to identify neuropathic ulcers. The project’s primary objective was to determine the prevalence of neuropathic ulcers. Image segmentation through the use of a patch-based CNN was carried out as the initial step in the process of preparing the dataset. After that, they put the suggested CNN model through its paces by comparing it to various other segmentation methods, such as U-net and SVM, to determine how well it performed. The recommended CNN model surpassed both U-net and SVM, and it attained a substantial accuracy of 0.934, sensitivity of 0.9, precision of 0.722, specificity of 0.947, MCC of 0.753, and dice of 0.770. In addition to this, the CNN model that was proposed was successful in cutting the total number of false positives by 0.9.
Botros et al. [39] shared their findings from their study on applying dynamic pressure distributions to predict neuropathic foot lesions. They used a dataset that evaluated the dynamic plantar pressure of 56 diabetic patients and 28 healthy volunteers. Throughout the entirety of their investigation, they made use of the SVM approach. The data went through a preprocessing step to retrieve meaningful characteristics from it. Amazing results were obtained using the SVM, with an accuracy score of 0.946, a precision score of 0.952, and a ROC score of 0.946. Keerthika et al. [40] focused their investigation on finding a way to predict the development of foot ulcers in their study. The dataset for this investigation was produced with the help of information that physicians provided. This study used regional growth and watershed techniques and image segmentation to forecast foot sores accurately. After segmentation, to provide the clearest possible identification of sore areas based on photographs, the SVM model was utilized to complete the classification task. Pushpaleela and Padmajavalli [41] presented their work on the topic of predicting neuropathic foot sores using ML classification methods such as decision trees, SVM, K-nearest neighbor (KNN), C4.5, and Naive Bayes. (NB). The real-world dataset, which was acquired from hospitals, contained the data of 455 people, 100 of whom are healthy, with the remaining being 355 images of diabetic foot ulcers. The information was gathered from actual occurrences in the world. The machine learning algorithms examined before were used and their degrees of accuracy were analyzed. Their findings indicated that the SVM achieved a level of accuracy that was 0.922 times better than the approaches utilized by other rivals.
In addition to this, Veredas et al. [42] presented a technique that combined elements of neural networks and NB. The study’s authors were particularly interested in modifying tissues in the sores. The strategies of regional growth and mean shift were utilized in carrying out region segmentation, and the results of this endeavor were the acquisition of sore texture and color characteristics. The researchers utilized both the Ensemble Averaging Committee Machine (EACM) and the Bayesian Committee Machine (BCM), which integrates the output of neural networks, throughout the classification process. Heuristics were applied to make the diagnosis system more accurate. They discovered that EACM with heuristics performed better than other machine learning algorithms—such as BCM and SVM—with recall, precision, and specificity scores of 0.857, 0.964, and 0.910, respectively, and accuracy scores of 0.942. The “load cell” method for determining whether or not a patient has a foot ulcer was developed by Sudarvizhi et al. [43]. The load cell is a sensor that generates data and is installed into the foot mat. SVM was applied to the data obtained from the load cell sensor, and the results showed that the data had an accuracy of 0.946 and a precision of 0.952. Patel et al. [44] emphasized the necessity for image processing technology to classify and identify neuropathic foot sores. The system that detects neuropathic foot sores has the most significant challenges in preprocessing images, categorizing those images, segmenting those images, detecting textures, and extracting features. The authors used various methodologies during the categorization process, including neural networks, fuzzy logic, SVM, NB, and KNN. After this, the wound was evaluated to determine whether it exhibited signs of granulation, slough, or necrosis based on its outward appearance. Neither the highlighted ways nor the comparison was examined in this research to determine which method was more effective. The search was limited to those photographs that belonged to one of three unique categories that were categorized together.
Liu et al. [45] proposed a method that used EfficientNet with a complete set of baselines. Moreover, an augmented DFU dataset was generated by geometric and color image processing to classify binary infection and ischemia. This method achieved a classification accuracy of 99% for ischemia and 98% for infection. Adam et al. [46] correctly predicted the occurrence of neuropathic ulcers in individuals who had neuropathy and those who did not. The hospitals that treated patients with neuropathic ulcers were contacted to obtain the information for their study. In the process of diagnosing neuropathic ulcers, ML techniques (such as “Quadratic Discriminant Analysis” (QDA), “Linear Discriminant Analysis” (LDA), decision trees, and neural networks) were utilized. They found that the KNN model performed the best compared to other models, with an accuracy score of 0.931, a precision score of 0.980, and a recall score of 0.909.
Manual approaches increase variability in diagnosis and enhance the risk of infection due to their close association with the wound. Furthermore, there is a high risk of losing parts of the foot in patients suffering from AFS and ischemia DFS. However, a few automated medical procedures have been developed in the past for the diagnosis of AFS and ischemia DFS. The primary goal of this study is to automate the disease identification process to lower medical expenses, enhance the accuracy of medical systems, and assist healthcare professionals.

3. Materials and Methods

Foot sores is a disease that cannot be cured with exercise or a healthy diet. These lesions or open sores take a long time to heal. Sores on the feet and ankles occur as a result of tissue rupture. Pain, swelling, and burning in the feet are typical signs of this disease. Depending on their effect on the skin, location, and appearance, foot sores are often divided into three categories: “arterial ulcers”, “venous ulcers”, and “neurotic ulcers”. The primary objective of the present work is to classify AFS and ischemic DFS from the patient’s feet and begins with the collection of foot sore datasets. This section contains an experimental process for determining the proposed model’s classification accuracy and two CNN-based pre-trained baseline models such as Inception-v3 and Mobile Net. For our proposed model, we used two datasets [30,31], each with two subclasses: one for abrasion foot sore images and the other for the patient’s foot with ischemic DFS. Both datasets were combined and reviewed with the help of concerned medical specialists, and some of the images were deleted due to insignificant detection parameters and low image quality. The size of the dataset was enhanced by using data augmentation techniques. After ensuring the dataset was reliable, we began training the proposed model. The proposed model was validated by employing a separate test set that was not utilized during the training phase of the project. The block diagram of the proposed model is shown in Figure 1.

3.1. Dataset Description

For the training and testing of the proposed model, two publicly available benchmark datasets were collected from two distinct resources. Alzubaidi et al. [30] made a publicly available dataset, which was used in this work. Another dataset was collected from the Kaggle repository [31] in order to ensure that the data was evenly distributed. In the final dataset, there were a total of 1413 ischemic DFS samples, as well as 1413 asymptomatic AFS samples. In addition, the resolution of each image is set to 224 × 224 × 3 pixels. Many data samples were necessary to train the CNN model [28] properly. Figure 2 illustrates some example photos from each of the datasets.

3.2. Data Augmentation and Preprocessing

This section contains the data balancing and data augmentation techniques used for this study. The limited number of samples prevented CNN parameters from being tweaked to their optimal values. Therefore, affected the classification performance of the model. A data augmentation strategy expanded the number of data samples within a dataset [47]. Various image processing techniques, including rotating, padding, zooming, and flipping were used for data augmentation [41,42,43,44]. Using previously collected data samples in conjunction with these modifications helped to expand the dataset, which in turn facilitated the training of the proposed model [48]. Furthermore, the quality of AFS and ischemic DFS images were increased by using noise reduction and data pre-processing algorithms, which eliminated artifacts and noise from the images. After evaluating our dataset, we selected the preparation methods and parameter configurations that yielded the best results.
As a consequence of this, we turned to methods of data augmentation to combat the issue of a limited dataset negatively impacting the performance of the suggested model. This investigation utilized approaches for increasing the amount of the dataset, such as vertical flipping and horizontal flipping, along with zooming and other flipping procedures. As a consequence of this, the number of samples contained in the dataset was raised to a total of 8478 photos. A final dataset was used to train and test the proposed model. The dataset was divided as follows: 70% for training, 20% for validation, and 10% for testing. The overall statistics of the dataset are presented in Table 1, and Figure 3 illustrates the effect that the data augmentation techniques utilized had on the initial image sample.

3.3. Image Segmentation Using UNet++

Lesions and abnormalities in medical imaging need more precise segmentation than in ordinary images. Clinical outcomes suffer if incorrect edge segmentation is performed on medical images. In the proposed method, UNet++ was used to perform image segmentation as shown in the Figure 4.
In U-Net, a map of features is generated by the encoder and sent to the decoder. UNet++’s number of convolutional layers is determined by its U-shaped architecture and its use of a dense convolutional block. The dense convolution block effectively bridges the information divide between the feature maps employed during the encoding and decoding phases. If the feature maps used by the encoder and the decoder are semantically comparable, then the optimizer has no trouble finding solutions. The effective incorporation of U-Nets with varying depths reduces network depth uncertainty. To help with model refinement and enhancement, these U-Nets train concurrently under deep supervision and share a portion of an encoder. This redesigned skip connection may automatically build a highly adaptable feature fusion technique by collecting semantic features of varying sizes on the decoder subnet [49].

3.4. Proposed Methodology

To classify AFS and ischemic DFS, a novel proposed model based on a CNN was developed as part of this research. In this model, the features were extracted with the help of a pre-trained model known as Vgg-19, and then they were fed to six CNN layers to be processed further. Figure 5 illustrates these six levels, which are as follows: the convolutional layer, the activation layer, the global average pooling layer, the flattening layer, and the two dense layers.

3.4.1. Vgg-19

Simonyan and Zisserman developed the Visual Geometry Group (Vgg) model from Oxford University. Their paper “A very deep convolutional network for large scale image recognition” [50] introduced the initial Vgg 16 model. Later on, an updated variant of Vgg 16 was introduced, named Vgg-19, which comprises 16 convolution layers, 3 fully connected layers (FCL), 5 max-pooling layers (MPL), and 1 SoftMax layer. The input of this model is 224 × 224 × 3, while the filter size of the convolutional layers is 3 × 3, which is considered on the smaller side [51,52].

3.4.2. Input Layer

The images utilized in the training process for CNN were stored in the network’s input layers. In most cases, the input layer is responsible for representing the unprocessed pixel data of the images. The suggested model was given the dimensions of the input image samples, which were set at 224 × 224 × 3 as input data [53,54].

3.4.3. Convolutional Layer

The basic component for the construction of neural networks is the Convolutional (Conv) layer. This layer is also called the feature extractor layer [55] because it assists in extracting features from DFS and AFS images. Because the weights point to the application of a convolution filter, this layer takes the output of the layer before it and convolves it with a learnable filter set. Each filter is moved vertically and horizontally across the input volume to generate activation maps of relevant filters in a two-dimensional space. In addition, output size can be modified using three hyperparameters: zero-padding, stride, and depth. Zero-padding [44] refers to padding zeros around the input borders to maintain their size. In contrast, stride refers to the number of pixels the filter skips while sliding across the image (i.e., the number of filters applied to the input image) [47,56]. In this study, features were extracted using Vgg-19, and then those features were added to six CNN layers that each include filters that were 3 by 3 pixels in size.

3.4.4. ReLU

In the model that was proposed, the ReLU [39] filtered the data by using the max (0, x) function, with the thresholding set to zero and x standing in for the neuron’s input. For images of the same size, ReLU did not change the resolution.

3.4.5. Global Average Pooling

This layer minimizes the size of its input by separating it into rectangular pooling regions of various sizes, such as 2 × 2, 3 × 3, and so on, before determining the average values of small spatial blocks. The Global Average pooling process takes a block of data that may contain either significant or trivial pixel information and generates normalized feature information from that block. This information is gleaned by examining the entire block [42]. A block contains only the significant pixel information that signals sharpening characteristics or only the pixels with less relevant qualities than sharpening features. Either way, the block can be said to have sharpening features. The highest possible polling rate produces sharpening qualities like edges, corners, and clear and distinct lines. The process of sharpening results in the development of certain traits [44]. The best strategy for the network’s last segment would be to use global average pooling rather than maximum pooling. The maximum pooling layer can remove certain features from the network. The ability to discern between distinct classes is dependent on all of these features, regardless of how significant or unimportant they may be in and of themselves.

3.4.6. Dropout

The dropout layer prevents the model from overfitting and enhances its performance. As a result, the neurons in this layer have their activation states shuffled around at random. In the model that was proposed, there was only one dropout layer, and its value was 0.20.

3.4.7. FCL

In this layer, connections are made between every neuron from the layer below it. This layer comprises the characteristics used to distinguish between the two types of foot skin patches: ischemic DFS and AFS.

3.4.8. Sigmoid Layer

The Sigmoid [47] layer is the name given to the last output layer in the model that is being considered for use in binary classification, as described in Equation (1). This layer gives the output image a specific disease category to correspond to. Both ischemic DFS and AFS syndrome are included in this grouping of diseases.
f x = 1 e x
The Vgg-19 model comprises 19 layers: 16 convolution layers, 3 completely connected layers, and 5 max-pooling layers. A 224-by-224-pixel RGB image was acceptable for use with this model. Although the filter size could be adjusted, it is important to point out that all of the convolutional layers used by the Vgg-19 model had the same 3 × 3 kernel size. During the training process for the proposed model, the input filter size for each convolutional layer was set to 32, and the maximum pooling size applied after each convolutional layer block was set to 2 × 2. The filter used in the third and fourth convolutional layers was 128, the filter used in the fifth layer was 256, and 512 was the convolutional filter used in the remaining Vgg-19 model layers. To extract features from this model, the layers were fused to form FCL. After the feature process, extraction was finished with the utilization of Vgg-19; the six layers of CNN carried out their tasks for the classification of AFS and ischemic DFS image samples with the assistance of the convolutional layer, ReLU, global average pooling, dropout, and the two dense layers. Utilizing a dropout layer, a convolutional layer, a ReLU layer, a global average pooling layer, and both dense layers was essential to accomplishing these responsibilities. The dropout and two dense layers were also factors, as stated earlier in this section. After a feature map was generated for each classification category by utilizing a global average pooling layer, the average of each feature map was then transferred to the softmax layer. A dropout layer with a value of 0.20 was applied to the model to prevent it from overfitting the data. The two dense layers that comprised 64 and 2 neurons came before the softmax layers. A total of 32 batch sizes of images were used during the training process, which lasted for a maximum of 150 epochs. The binary cross-entropy function was utilized, since the model needed to classify binary problems such as ischemic DFS and AFS. An illustration of the suggested model architecture is shown in Figure 5, and a description of the parameters is discussed in Table 2.
In this particular investigation, there were 37,938,351 trainable parameters, further subdivided into two categories: trainable and non-trainable. The value of the trainable parameters was 37,938,000, and 351 was the value of the non-trainable parameters. The trainable parameters were the ones that were changed during the training procedures, whilst the non-trainable parameters were the ones that were not updated and optimized during training. Therefore, the classification process proceeded without the participation of the non-trainable parameters.

3.5. Performance Evaluation Metrics

The effectiveness of disease classification models for AFS and ischemic DFS was evaluated using a variety of different metrics, such as accuracy [57], recall [58], precision, f1-score, MCC [59], and AUC. These metrics were calculated by using Equations (2)–(6). As a direct consequence, a confusion matrix was constructed for the proposed model, and it is presented in Figure 6.
A c c u r a c y = T P + T N T P + T N + F P + F N
P r e c i s i o n = T P T P + F P
R e c a l l = T P T P + F N
F 1 s c o r e = 2 × P r e c i s i o n × R e c a l l P r e c i s i o n + R e c a l l
M C C = T P T N ( F P F N ) ( T p + F P ) T N + F N T N + F P ( T N + F N )

3.6. Statistical Analysis

An analysis of variance (ANOVA) test was performed to compare the classification performance of the proposed model to that of two pre-trained models to identify any significant statistical differences. Normal distribution and variance homogeneity are expected in an ANOVA test. However, these conditions cannot be guaranteed for the performance analysis of deep learning and machine learning models [60,61]. As a result, the non-parametric Friedman test [61] was utilized in this investigation. The Wilcoxon signed-rank test with Holm’s step-down correction [62] was used for pair-wise comparisons [63,64] between the proposed classifier and the other two pre-trained classifiers. Because of this, we were able to investigate whether or not the performance outcomes obtained by the proposed model, MobileNet, and Inception-v3 differed significantly from one another statistically. Every set of average data came with a confidence interval (CI) that spanned 95%.

4. Results and Discussion

With the help of the model presented in this article, AFS and ischemic DFS images were efficiently categorized. The grid search methods were used to fine-tune the various hyperparameters of the proposed model, such as the learning rate, the epochs, and the batch size. A batch size of 32 was used throughout the training process for the suggested model, which was run for a maximum of 150 epochs. Using a “stochastic gradient descent” (SGD) optimizer with a momentum of 0.8, the starting learning rate for each layer of the proposed model and the other two pre-trained models was set to 0.05. This was realized to ensure that the models would learn as quickly as possible.
Additionally, this rate was utilized in the implementation of the other two pre-trained models. After completing 10 iterations, we decreased the learning rate by 0.1 to avoid overfitting the model [65]. The classification performance of the proposed model, Inception-v3, and MobileNet were tested and compared in terms of many performance evaluation metrics.

4.1. Experimental Setup

In this investigation, Google Collab served as the environment for deploying MobileNet and the proposed model, Inception-v3. Google Collab is a cloud-based service mostly employed for activities connected to deep learning [65,66]. Python is a programming language for implementing algorithms using Keras.

4.2. Result Analysis

Figure 7 depicts the training and validation accuracy of the proposed model for 150 epochs used in this study. It was noted that the highest level of accuracy attained through training was 99.90%, whereas the highest level obtained during validation was 99.01%. The suggested model had a training loss of 0.029; its validation loss was 0.059. These findings revealed that the proposed model was properly trained, and it accurately classified foot disorders such as ischemic DFS and AFS. Several metrics were applied to identifying AFS and ischemia DFS images to assess the performance of the proposed model, Inception-v3, and MobileNet in classification. In this study, the dataset was divided into 70 percent for training, 20 percent for validation, and 10 percent for testing. Therefore, 8478 images, including 4239 ischemia DFS and 4239 AFS images, were utilized to calculate the classification accuracy of the suggested model, Inception-v3, and MobileNet classifiers. Figure 7 illustrates the confusion matrix that resulted from applying these different classifiers.
As shown in Figure 8, the proposed model correctly recognized 418 instances of AFS out of a total of 424 AFS sample images. However, it incorrectly identified 6 instances of ischemia DFS. In identifying images diagnosed with ischemia DFS, our proposed model correctly detected 419 instances of ischemic DFS but misclassified 5 cases as having AFS. Inception-v3 properly predicted 404 cases of ischemia DFS but misclassified 20 cases as AFS. In contrast, 406 photos were correctly classified as AFS, while the remaining images were misclassified as ischemic DFS. In addition, MobileNet diagnosed 412 AFS images and 410 ischemic DFS images out of a total of 424 cases. Table 3 presents the results calculated based on performance evaluation metrics for the proposed model and the other two pre-trained classifiers.
According to Table 3, the proposed model achieved excellent results for classifying AFS and ischemia DFS images. The results obtained by the proposed model were 98.70% accuracy, 98.81% recall, 98.58% precision, 98.69% f1-score, 0.9740 MCC, and 0.9953 AUC, whereas the results obtained by the proposed model using UNet++ achieved an accuracy of 99.05%, precision of 98.99%, recall of 99.01%, MCC of 0.9801, an f1 score of 99.04%, and 0.9967 AUC. An accuracy of 95.52%, precision of 95.75%, recall of 95.31%, 0.9501 MCC, 0.9305 AUC, and a 95.53% f1-score were attained with the Inception-v3 model. The results that the MobileNet achieved are as follows: 96.73% accuracy, 97.1% recall, 96.4% precision, a 0.9612% f1-score, and 0.9907% area under the curve (AUC). It has also been observed that the results provided by Inception-v3 were subpar compared to those produced by the suggested model and MobileNet. The classification accuracy of all of these pre-trained classifiers suffered because the spatial resolution of the feature map used to generate their final convolutional layer results was greatly altered. This is because all of these pre-trained classifiers used deep neural networks. In addition, the filter size of these classifiers was not appropriate for the type of problem being addressed, because it overlooked crucial aspects and generated a significant amount of information regarding the receptive fields of the neurons.
As a consequence, the model that was provided offers a solution to these issues due to its ability to reduce the size of the filters, increase the rate at which convergence occurs, reduce the adverse influence of structured noise, and improve classification performance. If the model could attain the highest possible value of AUC, then it would be considered significant and effective. Calculating the ROC curve of the model requires considering both the true positive rate (TPR) and the false positive rate (FPR). The AUC for the proposed model and the two baseline pre-trained classifiers are shown in Figure 8. An AUC score of 0.9953 was attained by the model that was proposed. The AUCs for Inception-v3 and MobileNet were 0.9305 and 0.9907, respectively. The results of the AUC indicate that the proposed model performed better than the other two classifiers.
We employed ANOVA and Friedman tests to investigate the statistical inconsistencies in the overall classification performance of the CNN-based models investigated for this work. The ANOVA and Friedman tests were carried out with the help of the SciPy stats models module [67] written in Python. As seen in Table 4, the findings of the ANOVA test revealed statistically significant differences between the various classifiers that were put through their paces in terms of accuracy.
It was observed that (see Table 4) the ANOVA test revealed statistically significant differences; as discussed in [64,67], the Friedman test was better suited for assessing the performance of the CNN models. The Friedman test showed statistically significant performance differences between the proposed model, MobileNet, and Inception-v3 with p < 0.001 for accuracy. The p-value calculated after applying the Friedman test yielded a result of 0.00009405, indicating that the data did not support the null hypothesis. A post hoc pairwise analysis was carried out using the Wilcoxon signed-rank test with Holm’s correction [63,68], and a significant p-value of 0.05 was utilized. Figure 8 provides a graphical depiction of the outcomes generated by the pairwise comparison. According to Figure 9, the proposed model had a much lower p-value (p = 0.01) in terms of accuracy parameters than the baseline MobileNet (p = 0.03) and Inception-v3 (p = 0.04). Table 5 contains an in-depth presentation of the findings obtained from conducting the Wilcoxon signed-rank test with Holm’s adjustment.

4.3. Comparison with Other SOTA Models

Table 6 compares the proposed model to various SOTA classifiers in terms of accuracy, precision, recall rates, and f1 scores.

4.4. Discussion

The detection and classification of foot sores was the focus of several other studies [23,30,35] that made use of machine learning approaches. This study applied a recently proposed unique technique to fulfill the challenge of recognizing images of ischemic DFS and AFS. Most research studies [29,58] used their datasets to conduct their analyses. On the other hand, only a small number of studies [36,43,48] made use of datasets that were accessible to the public via DFUC2020 or DFU Kaggle [30]. The vast majority of them did not implement any data balancing or augmentation strategies, which may have caused the model’s performance to suffer as a result. Because of this, another benchmark dataset [31] was utilized in this study to bring the DFU dataset into better proportion. In addition, to expand the overall size of the dataset that was produced, three data augmentation strategies known as “zoom”, “horizontal flip”, and “vertical flip” were utilized. The size of the dataset was increased with the help of these various methods. The results of the experiments show that the proposed model was trained successfully on AFS and ischemia DFS infections that occurred on feet and that our model correctly categorized foot sores. This assertion is supported by the evidence that was provided and by the fact that the model was trained using these infections. Our proposed model obtained a superb accuracy of 98.70% for classifying AFS and ischemic DFS.
Regarding classification, the outcomes of the two pre-trained classifiers, Inception-v3 and MobileNet, were significantly distinct. The proposed model, along with other pre-trained classifiers such as Inception-v3 and MobileNet, were all trained on datasets with a fixed image resolution of 224 × 224 × 3, and these datasets were used to train the models. The suggested model was also used to train the pre-trained classifiers. In addition to that, during the entirety of the training procedure for the model that was suggested, the cross-entropy loss function was applied. The results of a comparative classification performance analysis between the proposed model and the transfer-learning classifiers that were assessed for this study can be seen in Table 3. This analysis takes into consideration several different factors. It was reported that the proposed model achieved an amazing performance, with a maximum accuracy of 98.70%, recall of 98.81%, a precision of 98.58%, an AUC of 0.9953, MCC of 0.9740, and an f1-score of 98.69%, whereas the results obtained by the proposed model using UNet++ achieved an accuracy of 99.05%, precision of 98.99%, recall of 99.01%, MCC of 0.9801, an f1 score of 99.04%, and AUC of 0.9967. When applying transfer-learning methods with pre-trained weights, there was a small decrease in performance for categorization. The MobileNet model obtained a significant AUC score of 0.9907, in addition to a recall of 96.71%, a precision of 97.17%, an f1-score of 96.94%, and an accuracy of 96.73% when compared to Inception-v3. The CNN-based pre-trained model had no impact whatsoever on the binary classification tasks being carried out. These pre-trained classifiers were superior in terms of their ability to diagnose diseases from a wide variety of categories [69]. In addition to more contemporary problems such as segmentation, this ability was also one of their advantages [60,61,62,63,64,66,67,68,69,70]. In addition to not requiring a significant amount of computer power, the model that was supplied was built on a straightforward framework that generated results in a limited amount of time. Because pre-trained models were trained on vast datasets comprising millions of images, such as the ImageNet database, a comparison between the generalization capabilities of the proposed model and those of pre-trained models is not a fair one to make. Table 3 illustrates that our method was more capable of detecting patterns of anomalies and extracting discriminative sequences in categorizing AFS and ischemic DFS, with a result of 98.70% accuracy. Table 3 outlines the results of the various pre-trained classifiers.
Deep neural networks [3,23,24,25,26,27,28,29,30,31,32,33,34,35,36,37,38,39,40,41,42,43,44,45,46,47,48,49,50,51,52,53,54,55,56,57,58,59,60,61,62,63,64,65,66,67,68,69,70,71,72,73] were a part of the pre-trained image classifier; however, the final convolutional layers of these networks resulted in a loss of the spatial resolution of the feature maps, which in turn restricted the classification capabilities of these models. In addition, the large number of neurons coupled to the input resulted in an insufficiently large filter size for these networks [51,52,53,54,55,56,57,58,59,60,61,62,63,64,65,66,67,68,69,70,73,74]. Because of this, the network could overlook significant traits as soon as they were discovered, which is a problem in how the network was designed. We believe that by utilizing the model that we have proposed, it will be feasible to overcome these obstacles. We suggest a new model based on deep learning from the beginning. In this particular model, features were first collected with the assistance of Vgg-19, and then these features were transmitted to six layers of CNN to differentiate between photos of AFS and images of ischemia DFS. The classification performance of our model was improved by hastening the process of convergence while significantly lowering the detrimental influence of structured noise. In addition, we applied a filter to the proposed model with an adequate size of 3 × 3 and employed the use of that. The proposed model for classifying ischemia DFS and AFS based on images of the foot has added a sizeable and appropriate output quantity to support medical professionals.
In Table 6, we also examine the proposed model in terms of its accuracy in classification when compared to other classifiers considered to be state-of-the-art. This comparison revealed that the proposed method of identifying AFS and ischemia DFS images added significant output in assisting medical experts. Alzubaidi [30] designed the DFU QUTNet model, which had a precision of 95.4%, a recall of 93.6%, and an f1 score of 94.5%. The CTREE approach presented by [35] achieved 88% (AUC), 80.6% (precision), 78.3% (recall), and 78.9% accuracy. Yap et al. [17], Wang et al. [37], Cui et al. [38], and work presented by Sudarvizhi et al. [43] gained the overall classification performance of deep learning methods on AFS and ischemic DFS images of 72.30% (Faster R-CNN), 76.3% (SVM), 92.30% (CNN) and 94.60% (Load Cell), respectively. Adam et al. [46] used machine learning approaches (such as QDA, KNN, SVM, LDA, decision trees, and neural networks) to predict neuropathic ulcers and found that the KNN model performed the best when compared to other models, with an accuracy of 93.1%, precision of 98.0%, and recall of 90.9%. Our proposed model achieved an accuracy of 98.70%, precision of 98.58%, recall of 98.81%, MCC of 0.9740, and an f1 score of 98.69%, which is superior to the state-of-the-art classifiers, as well as MobileNet and Inception-v3.

5. Limitation of the Research

There are a few limitations that make the research challenging. In order to achieve high classification accuracy deep networks, a large dataset of high-quality images of ischemic DFS and AFS are needed. To serve as a benchmark, the database needs professional annotation, which helps in training data. The problem of overfitting occurs often when neural networks learn excess information from their training data. As a result, DL cannot be used in situations when people of a different race or outside the training group are involved.

6. Conclusions

In this work, we developed a novel model for classifying foot sore diseases. This model was capable of accurately detecting AFS and ischemia DFS from pictures of feet. AFS and ischemia DFS were the two categories that may be found in the dataset used for this research. A range of data augmentation strategies were utilized to prevent the model from becoming extremely particular to the input. The segmentation of images was performed using UNet. The suggested model was capable of recognizing the primary characteristics of the images of the feet. An extensive experiment shows that the proposed model has the best classification performance compared to two pre-trained models and SOTA classifiers. This work concludes that the proposed model can be of significant use to medical professionals in recognizing foot ulcers. For future research, we intend to look into more DFS datasets and use vision transformers to extract the features included within these datasets.

Author Contributions

Conceptualization, M.K., A.N. and R.A.N.; methodology, A.N. and M.K.; validation, R.A.N., K.Z., S.A.M. and S.-W.L.; formal analysis, K.Z. and S.-W.L.; investigation, A.N. and R.A.N.; resources, A.N., M.K. and K.Z.; data curation, R.A.N.; writing—original draft preparation, A.N. and K.Z.; writing—review and editing, K.Z., S.A.M. and M.K.; visualization, M.K. and A.N.; supervision, S.A.M., R.A.N. and S.-W.L.; funding acquisition, S.-W.L. All authors have read and agreed to the published version of the manuscript.

Funding

This work was supported by a National Research Foundation (NRF) grant funded by the Ministry of Science and ICT (MSIT), Republic of Korea, through the Development Research Program (NRF2022R1G1A1010226) and (NRF2021R1I1A2059735).

Institutional Review Board Statement

Not applicable.

Informed Consent Statement

Not applicable.

Data Availability Statement

Not applicable.

Conflicts of Interest

The authors declare no conflict of interest.

References

  1. Naeem, A.; Farooq, M.S.; Khelifi, A.; Abid, A. Malignant melanoma classification using deep learning: Datasets, performance measurements, challenges and opportunities. IEEE Access 2020, 8, 110575–110597. [Google Scholar] [CrossRef]
  2. Li, Y.; Wei, X. Pantograph slide plate abrasion detection based on deep learning network. In Proceedings of the International Conference on Electrical and Information Technologies for Rail Transportation, Changsha, China, 20–22 October 2017; Springer: Singapore, 2018; pp. 215–224. [Google Scholar]
  3. Goyal, M.; Reeves, N.D.; Rajbhandari, S.; Ahmad, N.; Wang, C.; Yap, M.H. Recognition of ischaemia and infection in diabetic foot ulcers: Dataset and techniques. Comput. Biol. Med. 2020, 117, 103616. [Google Scholar] [CrossRef] [PubMed]
  4. Gonçalves, W.G.; Dos Santos, M.H.D.P.; Lobato, F.M.F.; Ribeiro-dos-Santos, Â.; de Araújo, G.S. Deep learning in gastric tissue diseases: A systematic review. BMJ Open Gastroenterol. 2020, 7, e000371. [Google Scholar] [CrossRef]
  5. Maghanoy, J.A.W.; Guzman, D.G.; Paz, J.S.D.; Policarpio, D.R.; Yanga, A.D.; Ambat, S. E-Aid: Open Wound Identifier and Analyzer Using Smartphone Through Captured Image. In ICT Analysis and Applications; Springer: Singapore, 2022; pp. 691–697. [Google Scholar]
  6. Malik, H.; Farooq, M.S.; Khelifi, A.; Abid, A.; Qureshi, J.N.; Hussain, M. A Comparison of Transfer Learning Performance Versus Health Experts in Disease Diagnosis from Medical Imaging. IEEE Access 2020, 8, 139367–139386. [Google Scholar] [CrossRef]
  7. Lefrancois, T.; Mehta, K.; Sullivan, V.; Lin, S.; Glazebrook, M. Evidence based review of literature on detriments to healing of diabetic foot ulcers. Foot Ankle Surg. 2017, 23, 215–224. [Google Scholar] [CrossRef] [PubMed]
  8. Idf.org. Diabetic Foot Ulcer. Available online: https://idf.org/our-activities/care-prevention/diabetic-foot.html (accessed on 30 June 2023).
  9. Saeedi, P.; Petersohn, I.; Salpea, P.; Malanda, B.; Karuranga, S.; Unwin, N.; Colagiuri, S.; Guariguata, L.; Motala, A.A.; Ogurtsova, K.; et al. Global and regional diabetes prevalence estimates for 2019 and projections for 2030 and 2045: Results from the International Diabetes Federation Diabetes Atlas. Diabetes Res. Clin. Pract. 2019, 157, 107843. [Google Scholar] [CrossRef] [PubMed]
  10. Cavanagh, P.; Attinger, C.; Abbas, Z.; Bal, A.; Rojas, N.; Xu, Z.R. Cost of treating diabetic foot ulcers in five different countries. Diabetes/Metab. Res. Rev. 2012, 28, 107–111. [Google Scholar] [CrossRef]
  11. Fathimaa, M.R.; Rekha, A. CT Scan of the Foot in Patients with Chronic Non-Healing Diabetic Foot Ulcer. Case Rep. Clin. Med. 2020, 9, 335. [Google Scholar] [CrossRef]
  12. Eren, M.A.; Karakaş, E.; Torun, A.N.; Sabuncu, T. The Clinical Value of Diffusion-Weighted Magnetic Resonance Imaging in Diabetic Foot Infection. J. Am. Podiatr. Med. Assoc. 2019, 109, 277–281. [Google Scholar] [CrossRef]
  13. Goyal, M.; Reeves, N.D.; Davison, A.K.; Rajbhandari, S.; Spragg, J.; Yap, M.H. Dfunet: Convolutional neural networks for diabetic foot ulcer classification. IEEE Trans. Emerg. Top. Comput. Intell. 2018, 4, 728–739. [Google Scholar] [CrossRef]
  14. Goyal, M.; Reeves, N.D.; Rajbhandari, S.; Yap, M.H. Robust methods for real-time diabetic foot ulcer detection and localization on mobile devices. IEEE J. Biomed. Health Inform. 2018, 23, 1730–1741. [Google Scholar] [CrossRef] [PubMed]
  15. Litjens, G.; Kooi, T.; Bejnordi, B.E.; Setio, A.A.A.; Ciompi, F.; Ghafoorian, M.; van der Laak, J.A.W.M.; van Ginneken, B.; Sánchez, C.I. A survey on deep learning in medical image analysis. Med. Image Anal. 2017, 42, 60–88. [Google Scholar] [CrossRef] [PubMed]
  16. Rastgarpour, M.; Shanbehzadeh, J. Application of AI techniques in medical image segmentation and novel categorization of available methods and tools. In Proceedings of the IMECS 2011—International Multi Conference of Engineers and Computer Scientists, Hong Kong, 16–18 March 2011; Volume 1, pp. 519–523. [Google Scholar]
  17. Yap, M.H.; Hachiuma, R.; Alavi, A.; Brüngel, R.; Cassidy, B.; Goyal, M.; Zhu, H.; Ruckert, J.; Olshansky, M.; Huang, X.; et al. Deep learning in diabetic foot ulcers detection: A comprehensive evaluation. Comput. Biol. Med. 2021, 135, 104596. [Google Scholar] [CrossRef] [PubMed]
  18. Naeem, A.; Anees, T.; Naqvi, R.A.; Loh, W.K. A Comprehensive Analysis of Recent Deep and Federated-Learning-Based Methodologies for Brain Tumor Diagnosis. J. Pers. Med. 2022, 12, 275. [Google Scholar] [CrossRef]
  19. Saeed, H.; Malik, H.; Bashir, U.; Ahmad, A.; Riaz, S.; Ilyas, M.; Zhu, H.; Ruckert, J.; Olshanksy, M.; Huang, X.; et al. Blockchain technology in healthcare: A systematic review. PLoS ONE 2022, 17, e0266462. [Google Scholar] [CrossRef]
  20. Cireşan, D.C.; Giusti, A.; Gambardella, L.M.; Schmidhuber, J. Mitosis detection in breast cancer histology images with deep neural networks. Lect. Notes Comput. Sci. 2013, 8150, 411–418. [Google Scholar] [CrossRef]
  21. Mohsen, H.; El-Dahshan, E.-S.A.; El-Horbaty, E.-S.M.; Salem, A.-B.M. Classification using deep learning neural networks for brain tumors. Futur. Comput. Inform. J. 2018, 3, 68–71. [Google Scholar] [CrossRef]
  22. Naeem, A.; Anees, T.; Fiza, M.; Naqvi, R.A.; Lee, S.W. SCDNet: A Deep Learning-Based Framework for the Multiclassification of Skin Cancer Using Dermoscopy Images. Sensors 2022, 22, 5652. [Google Scholar] [CrossRef]
  23. Quang, D.; Xie, X. DanQ: A hybrid convolutional and recurrent deep neural network for quantifying the function of DNA sequences. Nucleic Acids Res. 2016, 44, e107. [Google Scholar] [CrossRef]
  24. Gururajarao, S.B.; Venkatappa, U.; Shivaram, J.M.; Sikkandar, M.Y.; Al Amoudi, A. Infrared thermography and soft computing for diabetic foot assessment. In Machine Learning in Bio-Signal Analysis and Diagnostic Imaging; Academic Press: Cambridge, MA, USA, 2019; pp. 73–97. [Google Scholar]
  25. Guo, S.; Liu, X.; Zhang, H.; Lin, Q.; Xu, L.; Shi, C.; Gao, Z.; Guzzo, A.; Fortino, G. Causal knowledge fusion for 3D cross-modality cardiac image segmentation. Inf. Fusion 2023, 99, 101864. [Google Scholar] [CrossRef]
  26. Chen, Y.; Han, G.; Lin, T.; Liu, X. CAFS: An Attention-Based Co-Segmentation Semi-Supervised Method for Nasopharyngeal Carcinoma Segmentation. Sensors 2022, 22, 5053. [Google Scholar] [CrossRef]
  27. Zhi, Y.; Hau, W.K.; Zhang, H.; Gao, Z. Vessel Contour Detection in Intracoronary Images via Bilateral Cross-Domain Adaptation. IEEE J. Biomed. Health Inform. 2023, 27, 3314–3325. [Google Scholar] [CrossRef] [PubMed]
  28. Zhuang, S.; Li, F.; Raj, A.N.J.; Ding, W.; Zhou, W.; Zhuang, Z. Automatic segmentation for ultrasound image of carotid intimal-media based on improved superpixel generation algorithm and fractal theory. Comput. Methods Programs Biomed. 2021, 205, 106084. [Google Scholar] [CrossRef] [PubMed]
  29. Vilcahuaman, L.; Harba, R.; Canals, R.; Zequera, M.; Wilches, C.; Arista, M.T.; Torres, L.; Arbañil, H. Automatic analysis of plantar foot thermal images in at-risk type II diabetes by using an infrared camera. In Proceedings of the World Congress on Medical Physics and Biomedical Engineering, Toronto, ON, Canada, 7–12 June 2015; Springer: Cham, Switzerland, 2015; pp. 228–231. [Google Scholar]
  30. Alzubaidi, L.; Fadhel, M.A.; Oleiwi, S.R.; Al-Shamma, O.; Zhang, J. DFU_QUTNet: Diabetic foot ulcer classification using novel deep convolutional neural network. Multimed. Tools Appl. 2020, 79, 15655–15677. [Google Scholar] [CrossRef]
  31. Ulcer Classification Dataset. Kaggle. 2021. Available online: https://www.kaggle.com/shlokmohanty/ulcer-classification (accessed on 30 June 2023).
  32. Al-Garaawi, N.; Ebsim, R.; Alharan, A.F.; Yap, M.H. Diabetic foot ulcer classification using mapped binary patterns and convolutional neural networks. Comput. Biol. Med. 2022, 140, 105055. [Google Scholar] [CrossRef]
  33. Das, S.K.; Roy, P.; Mishra, A.K. DFU_SPNet: A stacked parallel convolution layers based CNN to improve Diabetic Foot Ulcer classification. ICT Express 2021, 8, 271–275. [Google Scholar] [CrossRef]
  34. Thotad, P.N.; Bharamagoudar, G.R.; Anami, B.S. Diabetic foot ulcer detection using deep learning approaches. Sens. Int. 2023, 4, 100210. [Google Scholar] [CrossRef]
  35. Stefanopoulos, S.; Ayoub, S.; Qiu, Q.; Ren, G.; Osman, M.; Nazzal, M.; Ahmed, A. Machine learning prediction of diabetic foot ulcers in the inpatient population. Vascular 2021, 30, 17085381211040984. [Google Scholar] [CrossRef]
  36. Costa Oliveira, A.L.; de Carvalho, A.B.; Dantas, D.O. Faster R-CNN Approach for Diabetic Foot Ulcer Detection. In VISIGRAPP; Federal University of Sergipe: São Cristóvão, Brazil, 2021; Volume 4, pp. 677–684. [Google Scholar]
  37. Wang, C.; Yan, X.; Smith, M.; Kochhar, K.; Rubin, M.; Warren, S.M.; Wrobel, J.; Lee, H. A unified framework for automatic wound segmentation and analysis with deep convolutional neural networks. In Proceedings of the 2015 37th Annual International Conference of the IEEE Engineering in Medicine and Biology Society (EMBC), Milan, Italy, 25–29 August 2015; pp. 2415–2418. [Google Scholar]
  38. Cui, C.; Thurnhofer-Hemsi, K.; Soroushmehr, R.; Mishra, A.; Gryak, J.; Domínguez, E.; Najarian, K.; López-Rubio, E. Diabetic wound segmentation using convolutional neural networks. In Proceedings of the 2019 41st Annual International Conference of the IEEE Engineering in Medicine and Biology Society (EMBC), Berlin, Germany, 23–27 July 2019; pp. 1002–1005. [Google Scholar]
  39. Botros, F.S.; Taher, M.F.; ElSayed, N.M.; Fahmy, A.S. Prediction of diabetic foot ulceration using spatial and temporal dynamic plantar pressure. In Proceedings of the 2016 8th Cairo International Biomedical Engineering Conference (CIBEC), Cairo, Egypt, 15–17 December 2016; pp. 43–47. [Google Scholar]
  40. Keerthika, A.; Sangeetha, G.; JayaBharathi, C.; Pavithra, S. Prediction of Diabetic Foot Ulcer based on Region growth segmentation. Int. J. Pure Appl. Math. 2018, 119, 643–651. [Google Scholar]
  41. Pushpaleela, R.C.; Padmajavalli, R. Prediction of Type-2 Diabetes Foot Ulcer-A Comparative Study with Classification Algorithm. Int. J. Pure Appl. Math. 2017, 117, 219–230. [Google Scholar]
  42. Veredas, F.; Mesa, H.; Morente, L. Binary tissue classification on wound images with neural networks and bayesian classifiers. IEEE Trans. Med. Imaging 2009, 29, 410–427. [Google Scholar] [PubMed]
  43. Sudarvizhi, M.D.; Nivetha, M.; Priyadharshini, P.; Swetha, J.R. Identification and analysis of foot ulceration using load cell technique. IRJET 2019, 6, 7792–7797. [Google Scholar]
  44. Patel, S.; Patel, R.; Desai, D. Diabetic foot ulcer wound tissue detection and classification. In Proceedings of the 2017 International Conference on Innovations in Information, Embedded and Communication Systems (ICIIECS), Coimbatore, India, 17–18 March 2017; pp. 1–5. [Google Scholar]
  45. Liu, Z.; John, J.; Agu, E. Diabetic Foot Ulcer Ischemia and Infection Classification Using EfficientNet Deep Learning Models. IEEE Open J. Eng. Med. Biol. 2022, 3, 189–201. [Google Scholar] [CrossRef] [PubMed]
  46. Adam, M.; Ng, E.Y.; Oh, S.L.; Heng, M.L.; Hagiwara, Y.; Tan, J.H.; Tong, J.W.; Acharya, U.R. Automated detection of diabetic foot with and without neuropathy using double density-dual tree-complex wavelet transform on foot thermograms. Infrared Phys. Technol. 2018, 92, 270–279. [Google Scholar]
  47. Shorten, C.; Khoshgoftaar, T.M. A survey on image data augmentation for deep learning. J. Big Data 2019, 6, 1–48. [Google Scholar]
  48. Ho, D.; Liang, E.; Liaw, R. 1000x Faster Data Augmentation, Berkeley Artificial Intelligence Research; University of California Berkley: Berkley, CA, USA, 2019. [Google Scholar]
  49. Zhou, Z.; Rahman Siddiquee, M.M.; Tajbakhsh, N.; Liang, J. Unet++: A nested u-net architecture for medical image segmentation. In Deep Learning in Medical Image Analysis and Multimodal Learning for Clinical Decision Support: 4th International Workshop, DLMIA 2018, and 8th International Workshop, ML-CDS 2018, Held in Conjunction with MICCAI 2018, Granada, Spain, 20 September 2018; Springer International Publishing: Cham, Switzerland, 2018; pp. 3–11. [Google Scholar]
  50. Simonyan, K.; Zisserman, A. Very deep convolutional networks for large-scale image recognition. arXiv 2014, arXiv:1409.1556. [Google Scholar]
  51. He, K.; Zhang, X.; Ren, S.; Sun, J. Deep residual learning for image recognition. In Proceedings of the IEEE Computer Society Conference on Computer Vision and Pattern Recognition, Honolulu, HI, USA, 21–26 July 2016; pp. 770–778. [Google Scholar]
  52. Naeem, A.; Anees, T.; Ahmed, K.T.; Naqvi, R.A.; Ahmad, S.; Whangbo, T. Deep learned vectors’ formation using auto-correlation, scaling, and derivations with CNN for complex and huge image retrieval. Complex Intell. Syst. 2022, 9, 1729–1751. [Google Scholar] [CrossRef]
  53. Mane, D.T.; Kulkarni, U.V. A survey on supervised convolutional neural network and its major applications. In Deep Learning and Neural Networks: Concepts, Methodologies, Tools, and Applications; IGI Global: Hershey, PA, USA, 2020; pp. 1058–1071. [Google Scholar]
  54. Malik, H.; Anees, T.; Din, M.; Naeem, A. CDC_Net: Multi-classification convolutional neural network model for detection of COVID-19, pneumothorax, pneumonia, lung Cancer, and tuberculosis using chest X-rays. Multimed. Tools Appl. 2022, 82, 13855–13880. [Google Scholar] [CrossRef]
  55. Reshi, A.A.; Rustam, F.; Mehmood, A.; Alhossan, A.; Alrabiah, Z.; Ahmad, A.; Alsuwailem, H.; Choi, G.S. An Efficient CNN Model for COVID-19 Disease Detection Based on X-Ray Image Classification. Complexity 2021, 2021, 6621607. [Google Scholar] [CrossRef]
  56. Ibrahim, D.M.; Elshennawy, N.M.; Sarhan, A.M. Deep-chest: Multi-classification deep learning model for diagnosing COVID-19, pneumonia, and lung cancer chest diseases. Comput. Biol. Med. 2021, 132, 104348. [Google Scholar] [CrossRef]
  57. Manski, C.F. Bounding the Predictive Values of COVID-19 Antibody Tests; Technical Report No. w27226; National Bureau of Economic Research: Cambridge, MA, USA, 2020. [Google Scholar]
  58. Malik, H.; Anees, T. BDCNet: Multi-classification convolutional neural network model for classification of COVID-19, pneumonia, and lung cancer from chest radiographs. Multimed. Syst. 2022, 28, 815–829. [Google Scholar] [CrossRef] [PubMed]
  59. Ruuska, S.; Hämäläinen, W.; Kajava, S.; Mughal, M.; Matilainen, P.; Mononen, J. Mononen, Evaluation of the confusion matrix method in the validation of an automated system for measuring feeding behaviour of cattle. Behav. Process. 2018, 148, 56–62. [Google Scholar] [CrossRef] [PubMed]
  60. Han, J.; Pei, J.; Kamber, M. Data Mining: Concepts and Techniques; Elsevier: Amsterdam, The Netherlands, 2011. [Google Scholar]
  61. Japkowicz, N.; Shah, M. Evaluating Learning Algorithms: A Classification Perspective; Cambridge University Press: Cambridge, UK, 2011. [Google Scholar]
  62. Demšar, J. Statistical comparisons of classifiers over multiple data sets. J. Mach. Learn. Res. 2006, 7, 1–30. [Google Scholar]
  63. Benavoli, A.; Corani, G.; Mangili, F. Should we really use post-hoc tests based on mean-ranks? J. Mach. Learn. Res. 2016, 17, 152–161. [Google Scholar]
  64. Garcia, S.; Herrera, F. An Extension on “Statistical Comparisons of Classifiers over Multiple Data Sets” for all Pairwise Comparisons. J. Mach. Learn. Res. 2008, 9, 2677–2694. [Google Scholar]
  65. Bisong, E. Building Machine Learning and Deep Learning Models on Google Cloud Platform; Apress: Berkeley, CA, USA, 2019; pp. 7–10. [Google Scholar]
  66. Dubey, A.K.; Jain, V. Automatic facial recognition using VGG16 based transfer learning model. J. Inf. Optim. Sci. 2020, 41, 1589–1596. [Google Scholar] [CrossRef]
  67. Seabold, S.; Perktold, J. Statsmodels: Statsmodels: Econometric and Statistical Modeling with Python. In Proceedings of the 9th Python in Science Conference, Austin, TX, USA, 28 June–3 July 2010; Volume 57. [Google Scholar]
  68. Pedregosa, F.; Varoquaux, G.; Gramfort, A.; Michel, V.; Thirion, B.; Grisel, O.; Blondel, M.; Prettenhofer, P.; Weiss, R.; Dubourg, V.; et al. Scikit-learn: Machine Learning in Python. J. Mach. Learn. Res. 2011, 12, 2825–2830. [Google Scholar]
  69. Saha, P.; Sadi, M.S.; Islam, M.M. EMCNet: Automated COVID-19 diagnosis from X-ray images using convolutional neural network and ensemble of machine learning classifiers. Inform. Med. Unlocked 2021, 22, 100505. [Google Scholar] [CrossRef]
  70. Wang, X.; Peng, Y.; Lu, L.; Lu, Z.; Bagheri, M.; Summers, R.M. ChestX-ray8: Hospital-scale Chest X- ray Database and Benchmarks on Weakly-Supervised Classification and Localization of Common Thorax Diseases. In Proceedings of the 2017 IEEE Conference on Computer Vision and Pattern Recognition (CVPR), Honolulu, HI, USA, 21–26 July 2017; pp. 3462–3471. [Google Scholar] [CrossRef]
  71. Liu, C.; van Netten, J.J.; Van Baal, J.G.; Bus, S.A.; van Der Heijden, F. Automatic detection of diabetic foot complications with infrared thermography by asymmetric analysis. J. Biomed. Opt. 2015, 20, 026003. [Google Scholar] [CrossRef]
  72. Jegede, O.; Ferens, K.; Griffith, B.; Podaima, B. A smart shoe to prevent and manage diabetic foot diseases. In Proceedings of the International Conference on Health Informatics and Medical Systems, Iasi, Romania, 19–21 November 2015; pp. 47–54. [Google Scholar]
  73. Malik, H.; Bashir, U.; Ahmad, A. Multi-classification neural network model for detection of abnormal heartbeat audio signals. Biomed. Eng. Adv. 2022, 4, 100048. [Google Scholar] [CrossRef]
  74. Malik, H.; Naeem, A.; Naqvi, R.A.; Loh, W.K. DMFL_Net: A Federated Learning-Based Framework for the Classification of COVID-19 from Multiple Chest Diseases Using X-rays. Sensors 2023, 23, 743. [Google Scholar] [CrossRef] [PubMed]
Figure 1. Block diagram of a proposed classification model.
Mathematics 11 03793 g001
Figure 2. Sample images of the datasets.
Mathematics 11 03793 g002
Figure 3. Original image samples of skin cancer extracted from three datasets.
Mathematics 11 03793 g003
Figure 4. Image Segmentation using UNet++.
Mathematics 11 03793 g004
Figure 5. Proposed Model for the Classification of Ischemic DFS and AFS.
Mathematics 11 03793 g005
Figure 6. Confusion matrix for the classification of disease.
Mathematics 11 03793 g006
Figure 7. Training and validation accuracy and training and validation loss; (a) proposed model, (b) Inception-v3, and (c) MobileNet.
Mathematics 11 03793 g007
Figure 8. Confusion matrix; (a) proposed model, (b) Inception-v3, and (c) MobileNet.
Mathematics 11 03793 g008
Figure 9. Results of the post hoc pairwise comparison using the Wilcoxon signed-rank test with Holm’s correction.
Mathematics 11 03793 g009
Table 1. The number of dataset samples used for the proposed model.
Dataset SamplesIschemic DFSAFSTotal Samples
Original 141314132826
Data Augmentation423942398478
Training 296729675934
Testing 424424848
Validation 8488481696
Table 2. Model parameter summary for the Classification of Ischemic DFS and AFS.
No. of LayersLayer (Type)Output ShapeParameters
1VGG19-vgg19 (Functional)(None, 11, 11, 512)35,987,564
2reshape_layer(None, 11, 11, 512)0
3conv2d_16 (Conv2D)(None, 11, 11, 256)1,658,974
4activation_function_16 (Activation)(None, 11, 11, 256)0
5global_pooling2d_layer_01 (GAP)(None, 5, 5, 128)0
6droupout_layer_16 (Dropout)(None, 5, 5, 128)0
7flatten_layer_11 (Flatten)(None, 512)0
8dense_layer_12 (DenseLayer)(None, 512)289,658
9droupout_layer_17 (Dropout)(None, 512)0
10dense_layer_13 (DenseLayer)(None, 2)2155
Total Trainable Parameters: 37,938,351
Trainable Parameters: 37,938,000
Non-Trainable Parameters: 351
Table 3. A performance comparison of the proposed model with two pre-trained classifiers.
ClassifiersAccuracyPrecisionRecallF1-ScoreMccAUC
InceptionV395.52%95.31%95.75%95.53%0.95010.9305
Mobile Net96.73%96.71%97.17%96.94%0.96120.9907
Proposed Model98.70%98.81%98.58%98.69%0.97400.9953
Proposed Model with UNet++99.05%98.99%98.58%99.01%0.98010.9967
Table 4. ANOVA Test Results for Proposed Model.
TypesSum of SquaresDegrees of FreedomFp-Value
C (treatments)0.176632416.7127361.69 × 10−11
Residual0.327389120--
Table 5. Comparison of pairwise Wilcoxon signed-rank test p values and Holm’s corrected alpha.
Pairp-ValueHolm’s Corrected AlphaNull Hypothesis (NH)
Proposed Model vs. MobileNet0.00140.005Reject
Proposed Model vs. Inception-v30.00120.00556Reject
Table 6. Comparison of the proposed model with the state-of-the-art classifiers.
RefModel NameAccuracy (%)Precision (%)Recall (%)F1 Score (%)
[30]DFU_QUTNet92.595.493.694.5
[35]CTREE8878.380.6-
[17]Faster R-CNN72.3074.5-74.30
[38]CNN framework93.472.294.793.9
[43]Load Cell94.695.2-93.2
[46]KNN93.198.090.992.2
[37]SVM76.373.394.6-
Proposed ModelVgg-19 + CNN98.7098.5898.8198.69
Proposed Model with UNet++Proposed Model99.0598.9999.0199.04
Disclaimer/Publisher’s Note: The statements, opinions and data contained in all publications are solely those of the individual author(s) and contributor(s) and not of MDPI and/or the editor(s). MDPI and/or the editor(s) disclaim responsibility for any injury to people or property resulting from any ideas, methods, instructions or products referred to in the content.

