
Analyzing the Critical Parameters for Implementing Sustainable AI Cloud System in an IT Industry Using AHP-ISM-MICMAC Integrated Hybrid MCDM Model

 , , and
Abstract
:1. Introduction
1.1. Significance of Implementing AI-Enabled Cloud System
- (1)
- Which are the most significant and least sustainable AI factors that highly affect an IT environment?
- (2)
- How are the chosen AI factors interrelated to each other?
- (3)
- How are the chosen factors performed in terms of interdependency?
- (1)
- To identify the most critical sustainable AI parameters that highly affect the cloud environment within the IT industry.
- (2)
- To study the interrelationship bonding that exists among the selected factors.
- (3)
- To examine the driver and driving performance of the chosen factors.
1.2. Importance of Sustainability in Cloud Computing
- Cost Savings: Sustainable practices in cloud computing can result in cost savings for cloud providers and end-users. For example, energy-efficient hardware and cooling systems can reduce energy consumption and lower operating costs, while recycling and reusing hardware can reduce electronic waste and lower replacement costs [15].
- Social Responsibility: Promoting sustainability in cloud computing is a social responsibility for cloud providers, as it shows their commitment to reducing their environmental impact and contributing to a more sustainable future. This can improve their reputation and brand image among environmentally conscious customers [17].
- Regulatory Compliance: Many countries and regions have regulations and standards related to environmental sustainability. By promoting sustainability in cloud computing, cloud providers can comply with these regulations and avoid potential legal or financial penalties [15].
1.3. Role of AHP-ISM-MICMAC for Evaluation of Crucial Parameters
2. Literature Review
2.1. Related Published Works
2.1.1. MCDM Applications in Diverse Areas for Examining Critical Parameters
2.1.2. Role of MCDM for Promoting Sustainability in Cloud Computing
2.1.3. Research Gaps and Novelty
2.2. Brainstorming Sessions with the Panel Board Members
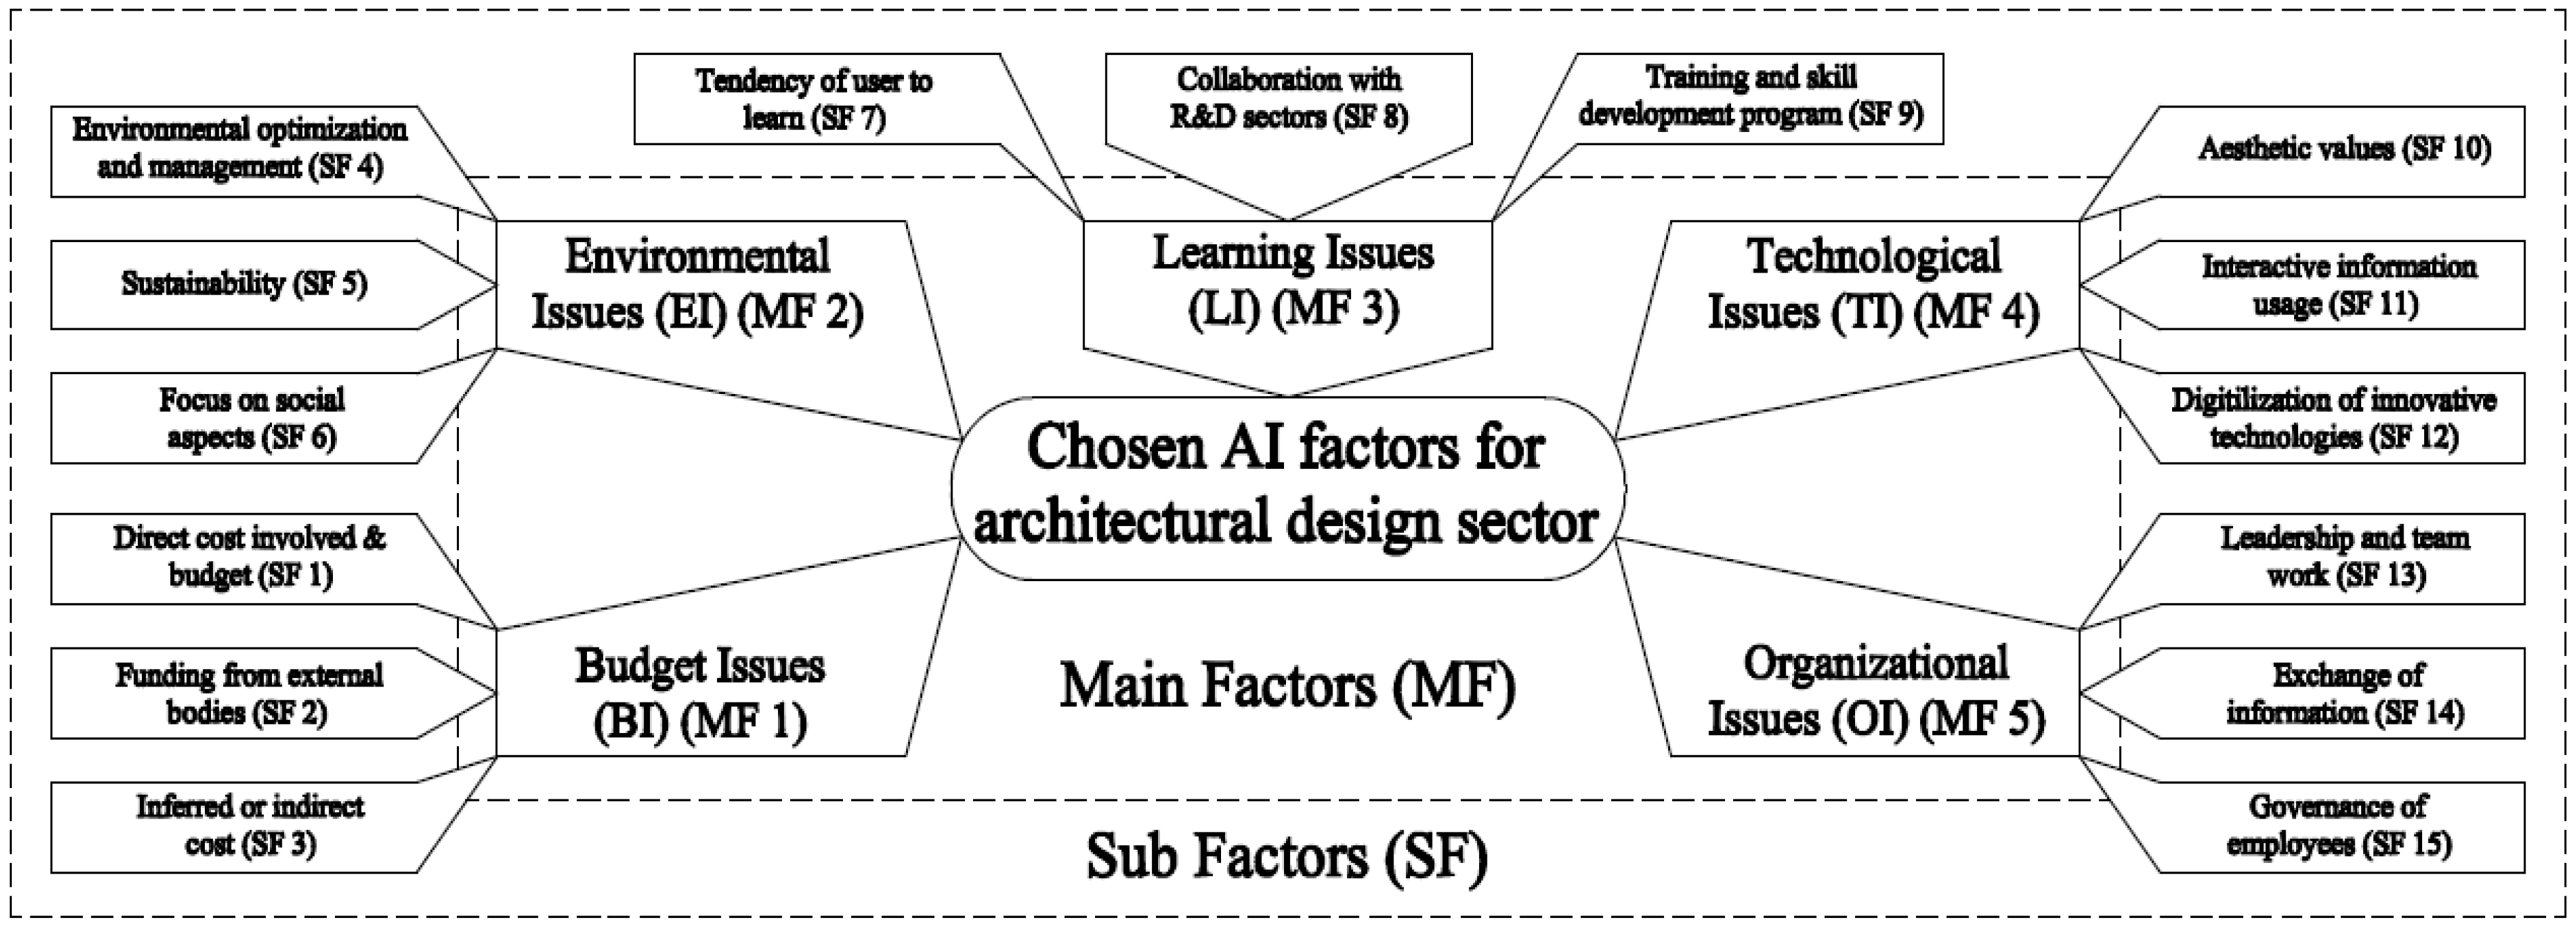
- Environmental optimization and management (SF 4): Environmental optimization and management refers to the process of improving and managing the environmental performance of a company or organization. This can involve reducing the environmental impact of operations, minimizing waste, reducing carbon emissions, and ensuring compliance with environmental regulations [49,50].
- Sustainability (SF 5): Sustainability has become an increasingly important issue in recent years, as people have become more aware of the environmental and social impacts of economic development. Governments, businesses, and individuals are now working to incorporate sustainability into their decision-making processes, and to create more sustainable systems and practices [42,45,51,52].
- Focus on social aspects (SF 6): Social sustainability involves promoting cultural diversity and heritage and preserving traditional knowledge and practices. This helps to create a sense of identity and belonging for communities and promotes a rich and diverse cultural heritage for future generations [12,13,14,15].
- Tendency of user to learn (SF 7): Implementing the CC system requires knowledgeable and skilled staff that can manage and coordinate the whole system. The employees need to continuously learn new things and stay updated with the technology’s growth and gradation [53].
- Collaboration with R&D sectors (SF 8): Collaboration between the R&D sector and the cloud computing industry is crucial for advancing cloud technology and driving innovation. It can lead to new breakthroughs, drive innovation, and ensure that cloud technology is meeting the needs of customers and industries [54,55].
- Training and skill development program (SF 9): Employees and staff should be given proper training to operate and manage a cloud system. Companies should organize skill development programs for the employees to keep them updated with the technology advancements and share proper knowledge about new inventions [51,56].
- Aesthetic values (SF 10): Aesthetic values in cloud computing can refer to several aspects of the technology, including its design, user interface, and overall user experience. Aesthetic values in cloud computing can play a significant role in how users perceive and interact with the technology, as well as in promoting values such as sustainability and user-centered design [42,57,58].
- Interactive information usage (SF 11): Interactive information usage in cloud computing refers to the ability of users to access, manipulate, and share information stored in the cloud in a collaborative and interactive manner. Interactive information usage in cloud computing can significantly enhance collaboration, productivity, and decision-making, enabling users to access, manipulate and share information more effectively and efficiently [59,60].
- Digitalization of innovative technologies (SF 12): Digitalization of innovative technologies in cloud computing refers to the integration of cutting-edge technologies into cloud computing platforms and services. Digitalization of innovative technologies in cloud computing can significantly enhance the performance and functionality of cloud computing platforms and services. This integration can also lead to the development of new applications and services that were not possible before [61,62].
- Exchange of information (SF 14): Exchange of information is a critical component of cloud computing. Cloud computing enables users to store and access data from anywhere, making it possible to exchange information with others quickly and efficiently. The information exchange in cloud computing enables users to collaborate and share data very easily. By leveraging the capabilities of cloud computing platforms, users can exchange information in real time, making it possible to work together more effectively [36,63].
- Governance of employees (SF 15): Governance of employees in cloud computing refers to the policies, procedures, and controls that organizations put in place to ensure that their employees use cloud computing services in a secure and compliant manner. Governance is essential in cloud computing to mitigate risks such as data breaches, compliance violations, and unauthorized access [64,65].
3. Theoretical Framework
3.1. Analytic Hierarchy Process (AHP)
3.2. Interpretive Structural Modeling (ISM)
- Letter “V” in a cell denotes that ith criteria help to achieve the jth criteria, therefore 1 is allotted in the upper triangular cell ij, and simultaneously lower triangular cell ji will be 0.
- Letter “A” represents that ith criteria will be achieved by jth criteria. In easy words, the jth criteria help to achieve ith criteria, hence cell ij on the upper side will be 0, and cell ji on the lower side will be 1.
- Letter “X” signifies that both ith criteria and jth criteria will help to achieve each other, therefore both the cells, i.e., ij and ji in the upper and lower triangular side will be 1.
- Letter “O” indicates that the ith criteria and the jth criteria are not related to each other, hence in this case, 0 will be allotted in ij and ji cells on both triangular sides.
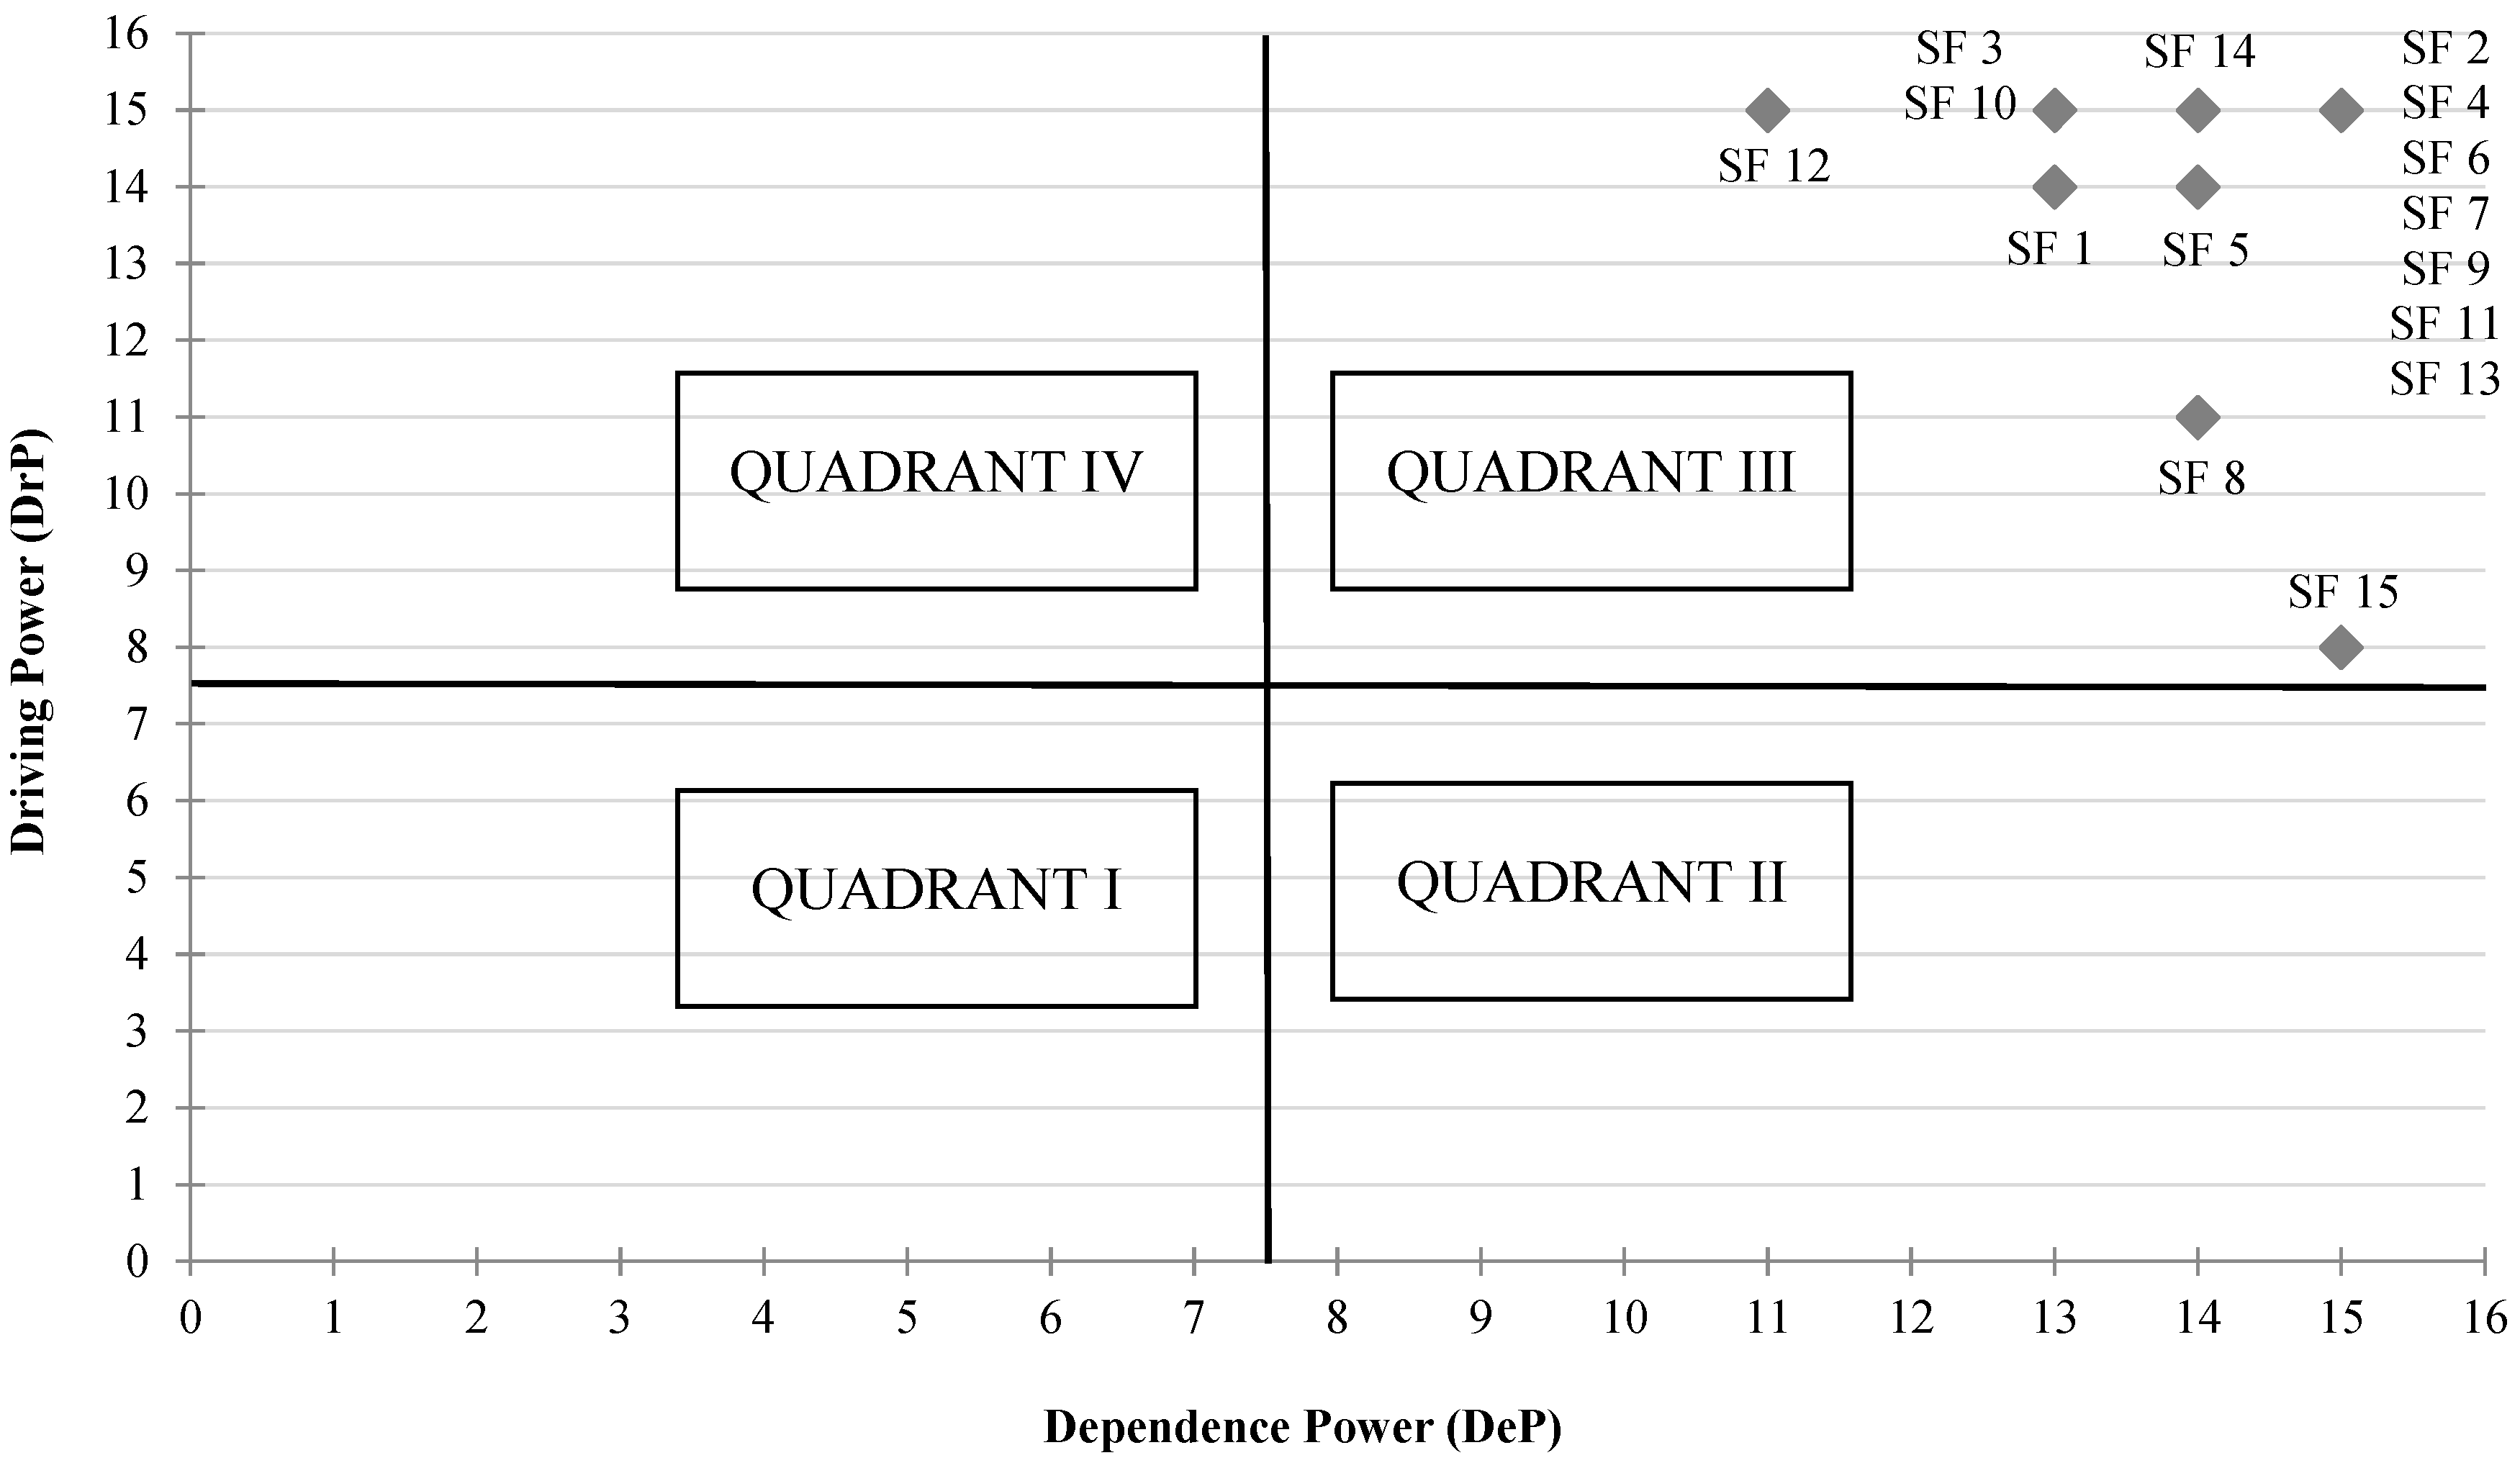
3.3. Cross-Impact Matrix Multiplication Applied to Classification (MICMAC)
- Autonomous: The factors occupying the first quadrant space are termed autonomous enablers. These are mainly isolated from the system. Autonomous enablers are basically weak drivers, and they also have weak dependence power.
- Dependent: Dependent factors lie in the second quadrant and are basically highly dependent on the lower-level factors. These factors occupy the top-most level in the ISM hierarchy. These have weak driving power and high dependence power.
- Linkage: These factors act as linkage enablers connecting the ISM levels among each other. These enablers lie in the third quadrant of the scatter plot diagram and have high driving and dependence power.
- Driving or independent: These are the lowest level factors in the ISM hierarchy used to drive all the parameters above their levels. These mainly lie in the fourth quadrant and have strong driving power. These enablers are mainly independent in nature.
4. Research Methodology
4.1. Data Analysis of AHP
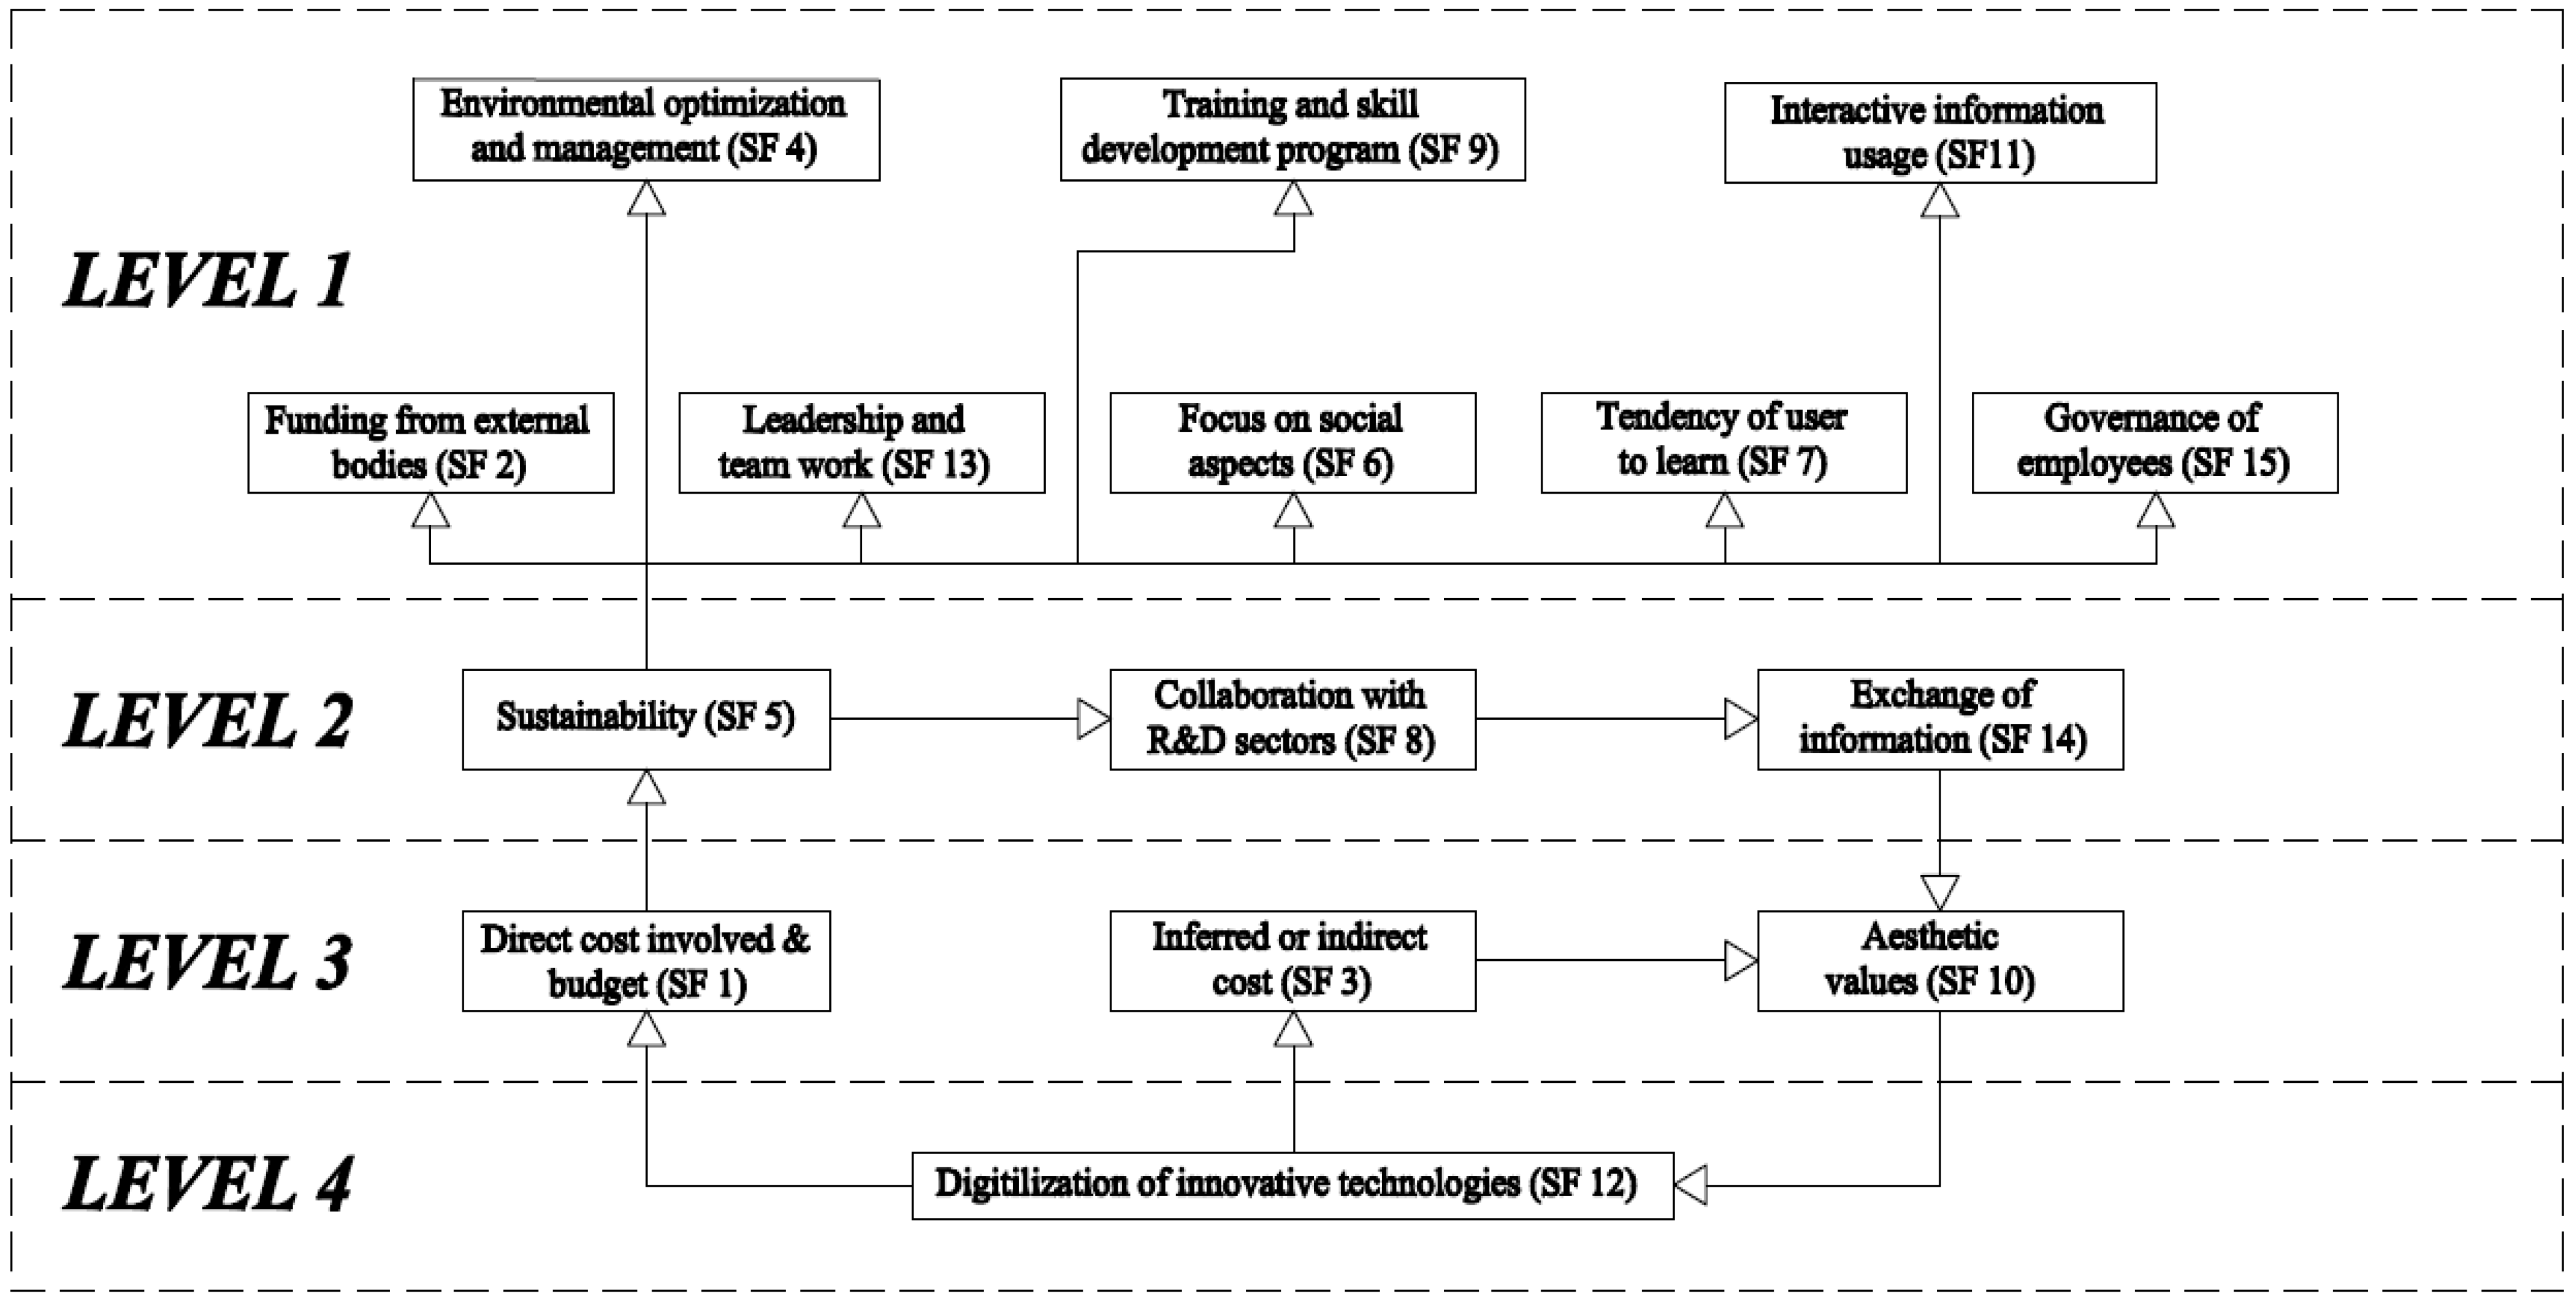
4.2. Data Analysis of ISM
4.3. Data Analysis of MICMAC
5. Results and Discussions
- AHP can be used to determine the relative importance of different criteria that are used to evaluate cloud computing options. For example, when deciding between different cloud providers, AHP can help managers determine which criteria are most important, such as security, cost, and scalability. By using AHP, managers can make more informed decisions and ensure that the most important criteria are given appropriate consideration.
- ISM can be used to understand the relationships between different factors that impact cloud computing. This can help managers identify key drivers of cloud computing success or failure, as well as potential roadblocks. By using ISM, managers can develop a better understanding of how different factors interact and affect each other and make more informed decisions as a result.
- MICMAC can be used to identify the most influential factors impacting cloud computing, and how they are interconnected. It can help managers identify critical factors that need to be addressed in order to improve cloud computing performance. By using MICMAC, managers can gain insights into the underlying factors that affect cloud computing success or failure and develop strategies to address them.
- Paying the highest effort and conducting several intense brainstorming sessions, the expert members narrowed down 15 crucial factors that act as barriers against the implementation of sustainable cloud computing systems in the IT industry.
- Firstly, the most important factors among 15 sustainable AI parameters have been identified using AHP that highly affect the cloud environment within the IT industry.
- Secondly, ISM helps in establishing the interrelationship among the 15 factors and defining their hierarchical levels.
- Finally, the dependence and driving performance of all 15 parameters are determined using MICMAC analysis.
6. Conclusions
6.1. Managerial Implications
- The integrated model can assist in identifying and prioritizing crucial parameters that have a substantial impact on the successful implementation of a long-term AI cloud system. These data are critical for managers in directing their resources and efforts toward the most influential factors.
- The output results can help managers allocate resources more efficiently. Organizations can allocate cash, time, and people to address the most crucial factors first by understanding the interrelationships and dependencies between parameters.
- Implementing long-term AI cloud systems entails inherent risks. The model can help evaluate potential risks linked with various parameters and their effects on the overall system. This enables managers to establish risk-mitigation strategies in advance.
- The model sheds light on the cause-and-effect interactions that exist between various parameters. This data can help in developing comprehensive and effective strategic plans for the implementation of long-term AI cloud systems.
- As the AI cloud system deployment progresses toward advancement, the model’s findings can be used to compare the system’s performance to projected outcomes. Managers can take corrective actions if certain parameters do not behave as intended.
- The integrated model can help managers make decisions by giving a structured way to consider many criteria and their interconnections. It assists in making educated and impartial decisions based on the model’s outcomes.
- Collaboration with diverse stakeholders is required for the implementation of sustainable AI cloud systems. The model can help in understanding the concerns and interests of many stakeholders, which can lead to better participation and consensus-building.
- The model encourages businesses to seek novel solutions by understanding the complicated interactions between factors. It has the potential to encourage research and development activities to overcome fundamental issues in building long-term AI cloud systems.
- Organizations can obtain a competitive edge by prioritizing crucial factors that differentiate them from competitors in terms of sustainability, efficiency, and performance.
- The integrated model prioritizes sustainability as a critical decision-making factor. Managers may assure the long-term viability and profitability of their AI cloud system implementations by taking environmental, social, and economic considerations into account.
6.2. Limitations
- The model primarily relies on data for parameter evaluation and interrelationship analysis. The precision and validity of the model’s results can be limited by a lack of trustworthy and comprehensive data.
- AHP relies on expert assessments during pairwise comparisons, which can induce biases and variations in the results. The experts’ viewpoints and comprehension of the parameters influence the model’s conclusions.
- The model is complex and time-consuming due to the incorporation of different approaches. Data collection, analysis, and interpretation can be time-consuming and expensive.
- While the model aims to describe parameter interdependencies, real-world interactions among parameters may be more complex and difficult to correctly express in a model.
- The IT industry, including AI and cloud technologies, is fast evolving. The model’s validity may be reduced over time as technology, industry standards, and best practices evolve.
- Despite its ability to identify crucial factors, the model may not provide a deeper knowledge of the underlying causes of interrelationships and consequences. Additional qualitative analysis may be required for comprehensive interaction.
- During pairwise comparisons, AHP implies independence between criteria, which may not always be true. Some criteria may be dependent on others, affecting the ultimate outcomes.
- Some crucial parameters may have complex interactions that the model is unable to fully capture. This may result in oversimplification of some components of the analysis.
- The usefulness of the model may vary across different geographical areas or organizational contexts, and the generalization of outcomes may be limited.
- While the model seeks to assess sustainable characteristics, it may not address all aspects of sustainability, such as ethical issues, social impact, or long-term environmental implications.
- The model may not fully encompass all key stakeholders’ perspectives, thus leading to the omission of some critical aspects or opportunities.
6.3. Scope of Future Work
Author Contributions
Funding
Data Availability Statement
Acknowledgments
Conflicts of Interest
References
- Guo, X. Multi-objective task scheduling optimization in cloud computing based on fuzzy self-defense algorithm. Alex. Eng. J. 2021, 60, 5603–5609. [Google Scholar] [CrossRef]
- Karar, M.E.; Alsunaydi, F.; Albusaymi, S.; Alotaibi, S. A New Mobile Application of Agricultural Pests Recognition Using Deep Learning Iin Cloud Computing System. Alex. Eng. J. 2021, 60, 4423–4432. [Google Scholar] [CrossRef]
- Markets and Markets. Cloud Computing Market (November, 2022). Available online: https://www.marketsandmarkets.com/Market-Reports/cloud-computing-market-234.html (accessed on 2 March 2023).
- Gartner. Accelerating Shift to the Cloud Means the Market Opportunity for Providers is Narrowing (February, 2022). Available online: https://www.gartner.com/en/newsroom/press-releases/2022-02-09-gartner-says-more-than-half-of-enterprise-it-spending (accessed on 2 March 2023).
- Goswami, S.S.; Behera, D.K. An Analysis for Selecting Best Smartphone Model by AHP-TOPSIS Decision-Making Methodology. Int. J. Serv. Sci. Manag. Eng. Technol. 2021, 12, 116–137. [Google Scholar] [CrossRef]
- Gupta, P.; Rawat, P.S.; Saini, D.K.; Vidyarthi, A.; Alharbi, M. Neural network inspired differential evolution based task scheduling for cloud infrastructure. Alex. Eng. J. 2023, 73, 217–230. [Google Scholar] [CrossRef]
- Liu, C. Risk Prediction of Digital Transformation of Manufacturing Supply Chain Based on Principal Component Analysis and Backpropagation Artificial Neural Network. Alex. Eng. J. 2021, 61, 775–784. [Google Scholar] [CrossRef]
- Kumari, A.; Gupta, R.; Tanwar, S.; Kumar, N. Blockchain and AI amalgamation for energy cloud management: Challenges, solutions, and future directions. J. Parallel Distrib. Comput. 2020, 143, 148–166. [Google Scholar] [CrossRef]
- Wang, Y.; Zhuang, J.; Zhou, G.; Wang, S. Research on unbalanced mining of highway project key data based on knowledge graph and cloud model. Alex. Eng. J. 2023, 68, 67–81. [Google Scholar] [CrossRef]
- Abel, E.E.; Latiff, M.S.A. The utilization of algorithms for cloud internet of things application domains: A review. Front. Comput. Sci. 2021, 15, 153502. [Google Scholar] [CrossRef]
- Algarni, F. A novel quality-based computation offloading framework for edge cloud-supported internet of things. Alex. Eng. J. 2023, 70, 585–599. [Google Scholar] [CrossRef]
- El-Aziz, R.M.A.; Taloba, A.I.; Alghamdi, F.A. Quantum Computing Optimization Technique for IoT Platform using Modified Deep Residual Approach. Alex. Eng. J. 2022, 61, 12497–12509. [Google Scholar] [CrossRef]
- Oztemel, E.; Gursev, S. Literature review of Industry 4.0 and related technologies. J. Intell. Manuf. 2018, 31, 127–182. [Google Scholar] [CrossRef]
- Kumar, R.; Khan, F.; Kadry, S.; Rho, S. A Survey on blockchain for industrial Internet of Things. Alex. Eng. J. 2021, 61, 6001–6022. [Google Scholar] [CrossRef]
- Sharma, R.; Villányi, B. A sustainable Ethereum merge-based Big-Data gathering and dissemination in IIoT System. Alex. Eng. J. 2023, 69, 109–119. [Google Scholar] [CrossRef]
- Goswami, S.S.; Mohanty, S.K.; Behera, D.K. Selection of a green renewable energy source in India with the help of MEREC integrated PIV MCDM tool. Mater. Today: Proc. 2022, 52, 1153–1160. [Google Scholar] [CrossRef]
- Wang, L.; Wang, Y. Supply chain financial service management system based on block chain IoT data sharing and edge computing. Alex. Eng. J. 2021, 61, 147–158. [Google Scholar] [CrossRef]
- Schaefer, J.L.; Siluk, J.C.M.; de Carvalho, P.S. An MCDM-based approach to evaluate the performance objectives for strategic management and development of Energy Cloud. J. Clean. Prod. 2021, 320, 128853. [Google Scholar] [CrossRef]
- Saheed, Y.K.; Abiodun, A.I.; Misra, S.; Holone, M.K.; Colomo-Palacios, R. A machine learning-based intrusion detection for detecting internet of things network attacks. Alex. Eng. J. 2022, 61, 9395–9409. [Google Scholar] [CrossRef]
- Vishwakarma, A.; Dangayach, G.; Meena, M.; Gupta, S. Analysing barriers of sustainable supply chain in apparel & textile sector: A hybrid ISM-MICMAC and DEMATEL approach. Clean. Logist. Supply Chain 2022, 5, 100073. [Google Scholar]
- Jena, A.; Patel, S.K. Analysis and evaluation of Indian industrial system requirements and barriers affect during implementation of Industry 4.0 technologies. Int. J. Adv. Manuf. Technol. 2022, 120, 2109–2133. [Google Scholar] [CrossRef]
- Saaty, T.L. The Analytic Hierarchy Process; McGraw-Hill: New York, NY, USA, 1980. [Google Scholar]
- Kumar, R.R.; Mishra, S.; Kumar, C. Prioritizing the solution of cloud service selection using integrated MCDM methods under Fuzzy environment. J. Supercomput. 2017, 73, 4652–4682. [Google Scholar] [CrossRef]
- Gadekar, R.; Sarkar, B.; Gadekar, A. Model development for assessing inhibitors impacting Industry 4.0 implementation in Indian manufacturing industries: An integrated ISM-Fuzzy MICMAC approach. Int. J. Syst. Assur. Eng. Manag. 2022, 1–26. [Google Scholar] [CrossRef]
- Goswami, S.S.; Behera, D.K. Solving Material Handling Equipment Selection Problems in an Industry with the Help of Entropy Integrated COPRAS and ARAS MCDM techniques. Process. Integr. Optim. Sustain. 2021, 5, 947–973. [Google Scholar] [CrossRef]
- Anyaeche, C.; Ighravwe, D.; Asokeji, T. Project portfolio selection of banking services using COPRAS and Fuzzy-TOPSIS. J. Proj. Manag. 2017, 2, 51–62. [Google Scholar] [CrossRef]
- Chang, S.-C.; Lu, M.-T.; Pan, T.-H.; Chen, C.-S. Evaluating the E-Health Cloud Computing Systems Adoption in Taiwan’s Healthcare Industry. Life 2021, 11, 310. [Google Scholar] [CrossRef] [PubMed]
- Goswami, S.S.; Jena, S.; Behera, D.K. Selecting the best AISI steel grades and their proper heat treatment process by integrated entropy-TOPSIS decision making techniques. Mater. Today Proc. 2022, 60, 1130–1139. [Google Scholar] [CrossRef]
- Goswami, S.S.; Behera, D.K. Evaluation of the best smartphone model in the market by integrating fuzzy-AHP and PROMETHEE decision-making approach. Decision 2021, 48, 71–96. [Google Scholar] [CrossRef]
- Goswami, S.S.; Behera, D.K.; Mitra, S. A comprehensive study of Weighted Product Model for selecting the best laptop model available in the market. Braz. J. Oper. Prod. Manag. 2020, 17, 1–18. [Google Scholar] [CrossRef]
- Kumar, V.; Vrat, P.; Shankar, R. Factors Influencing the Implementation of Industry 4.0 for Sustainability in Manufacturing. Glob. J. Flex. Syst. Manag. 2022, 23, 453–478. [Google Scholar] [CrossRef]
- Sharma, M.; Gupta, R.; Acharya, P. Prioritizing the Critical Factors of Cloud Computing Adoption Using Multi-criteria Decision-making Techniques. Glob. Bus. Rev. 2017, 21, 142–161. [Google Scholar] [CrossRef]
- Sharma, H.; Sohani, N.; Yadav, A. Structural modeling of lean supply chain enablers: A hybrid AHP and ISM-MICMAC based approach. J. Eng. Des. Technol. 2021. ahead of print. [Google Scholar] [CrossRef]
- Kumar, D.; Rahman, Z. Analyzing enablers of sustainable supply chain: ISM and fuzzy AHP approach. J. Model. Manag. 2017, 12, 498–524. [Google Scholar] [CrossRef]
- Singh, C.; Singh, D.; Khamba, J.S. Developing a conceptual model to implement green lean practices in Indian manufacturing industries using ISM-MICMAC approach. J. Sci. Technol. Policy Manag. 2020, 12, 587–608. [Google Scholar] [CrossRef]
- Singh, R.; Bhanot, N. An integrated DEMATEL-MMDE-ISM based approach for analysing the barriers of IoT implementation in the manufacturing industry. Int. J. Prod. Res. 2019, 58, 2454–2476. [Google Scholar] [CrossRef]
- Khaba, S.; Bhar, C. Analysing the barriers of lean in Indian coal mining industry using integrated ISM-MICMAC and SEM. Benchmarking Int. J. 2018, 25, 2145–2168. [Google Scholar] [CrossRef]
- Khaba, S.; Bhar, C.; Ray, A. A study on key lean enablers of the coal mining sector using ISM, MICMAC and SEM. TQM J. 2020, 33, 1281–1305. [Google Scholar] [CrossRef]
- Sharma, M.; Sehrawat, R.; Daim, T.; Shaygan, A. Technology assessment: Enabling Blockchain in hospitality and tourism sectors. Technol. Forecast. Soc. Chang. 2021, 169, 120810. [Google Scholar] [CrossRef]
- Duleba, S.; Shimazaki, Y.; Mishina, T. An analysis on the connections of factors in a public transport system by AHP-ISM. Transport 2013, 28, 404–412. [Google Scholar] [CrossRef]
- Song, L.; Li, Q.; List, G.F.; Deng, Y.; Lu, P. Using an AHP-ISM Based Method to Study the Vulnerability Factors of Urban Rail Transit System. Sustainability 2017, 9, 1065. [Google Scholar] [CrossRef] [Green Version]
- Zhang, Q.; Yang, S. Evaluating the sustainability of big data centers using the analytic network process and fuzzy TOPSIS. Environ. Sci. Pollut. Res. 2021, 28, 17913–17927. [Google Scholar] [CrossRef]
- Rajput, S.; Singh, S.P. Identifying Industry 4.0 IoT enablers by integrated PCA-ISM-DEMATEL approach. Manag. Decis. 2019, 57, 1784–1817. [Google Scholar] [CrossRef]
- Yang, M.-H.; Su, C.-H.; Wang, W.-C. Use of hybrid MCDM model in evaluation for cloud service application improvement. EURASIP J. Wirel. Commun. Netw. 2018, 2018, 98. [Google Scholar] [CrossRef]
- Oke, A.E.; Kineber, A.F.; Abdel-Tawab, M.; Abubakar, A.S.; Albukhari, I.; Kingsley, C. Barriers to the implementation of cloud computing for sustainable construction in a developing economy. Int. J. Build. Pathol. Adapt. 2021. ahead of print. [Google Scholar] [CrossRef]
- Omer, M.M.; Kineber, A.F.; Oke, A.E.; Kingsley, C.; Alyanbaawi, A.; Rached, E.F.; Elmansoury, A. Barriers to Using Cloud Computing in Sustainable Construction in Nigeria: A Fuzzy Synthetic Evaluation. Mathematics 2023, 11, 1037. [Google Scholar] [CrossRef]
- Garg, R. MCDM-Based Parametric Selection of Cloud Deployment Models for an Academic Organization. IEEE Trans. Cloud Comput. 2020, 10, 863–871. [Google Scholar] [CrossRef]
- Yoo, S.-K.; Kim, B.-Y. A Decision-Making Model for Adopting a Cloud Computing System. Sustainability 2018, 10, 2952. [Google Scholar] [CrossRef] [Green Version]
- Khattar, N.; Sidhu, J.; Singh, J. Toward energy-efficient cloud computing: A survey of dynamic power management and heuristics-based optimization techniques. J. Supercomput. 2019, 75, 4750–4810. [Google Scholar] [CrossRef]
- Shi, S.; Liu, Y.; Wei, H.; Qiao, B.; Wang, G.; Xu, L. Research on cloud computing and services framework of marine environmental information management. Acta Oceanol. Sin. 2013, 32, 57–66. [Google Scholar] [CrossRef]
- Müller, G.; Sonehara, N.; Echizen, I.; Wohlgemuth, S. Sustainable Cloud Computing. Bus. Inf. Syst. Eng. 2011, 3, 129–131. [Google Scholar] [CrossRef] [Green Version]
- Park, J.H.; Jeong, H.Y. Cloud computing-based jam management for a manufacturing system in a Green IT environment. J. Supercomput. 2013, 69, 1054–1067. [Google Scholar] [CrossRef]
- Majumdar, A.; Garg, H.; Jain, R. Managing the barriers of Industry 4.0 adoption and implementation in textile and clothing industry: Interpretive structural model and triple helix framework. Comput. Ind. 2020, 125, 103372. [Google Scholar] [CrossRef]
- Fernandes, G.; Santos, J.M.; Ribeiro, P.; Ferreira, L.M.D.; O’Sullivan, D.; Barroso, D.; Pinto, E.B. Critical Success Factors of University-Industry R&D Collaborations. Procedia Comput. Sci. 2023, 219, 1650–1659. [Google Scholar] [CrossRef]
- AlMalki, H.A.; Durugbo, C.M. Evaluating critical institutional factors of Industry 4.0 for education reform. Technol. Forecast. Soc. Chang. 2023, 188, 122327. [Google Scholar] [CrossRef]
- Rad, F.F.; Oghazi, P.; Palmié, M.; Chirumalla, K.; Pashkevich, N.; Patel, P.C.; Sattari, S. Industry 4.0 and supply chain performance: A systematic literature review of the benefits, challenges, and critical success factors of 11 core technologies. Ind. Mark. Manag. 2022, 105, 268–293. [Google Scholar] [CrossRef]
- da Anunciação, P.F.; Dinis, V.M.d.L.; Peñalver, A.J.B.; Esteves, F.J.M. Functional Safety as a critical success factor to industry 4.0. Procedia Comput. Sci. 2022, 204, 45–53. [Google Scholar] [CrossRef]
- Oliva, F.L.; Teberga, P.M.F.; Testi, L.I.O.; Kotabe, M.; Del Giudice, M.; Kelle, P.; Cunha, M.P. Risks and critical success factors in the internationalization of born global startups of industry 4.0: A social, environmental, economic, and institutional analysis. Technol. Forecast. Soc. Chang. 2021, 175, 121346. [Google Scholar] [CrossRef]
- Chen, T.-Y.; Chang, H.-F. Critical success factors and architecture of innovation services models in data industry. Expert Syst. Appl. 2023, 213, 119014. [Google Scholar] [CrossRef]
- Sony, M.; Antony, J.; Mc Dermott, O.; Garza-Reyes, J.A. An empirical examination of benefits, challenges, and critical success factors of industry 4.0 in manufacturing and service sector. Technol. Soc. 2021, 67, 101754. [Google Scholar] [CrossRef]
- Demin, S.; Mikhaylova, A.; Pyankova, S. Digitalization and its impact on regional economy transformation mechanisms. Int. J. Syst. Assur. Eng. Manag. 2022, 14, 377–390. [Google Scholar] [CrossRef]
- Sherimova, N.; Isabekov, B.; Alkeev, M.; Yermekova, Z.; Ostryanina, T. An analytical assessment of industrial sector innovative management in the context of digitalization. J. Innov. Entrep. 2022, 11, 53. [Google Scholar] [CrossRef]
- Tabrizchi, H.; Rafsanjani, M.K. A survey on security challenges in cloud computing: Issues, threats, and solutions. J. Supercomput. 2020, 76, 9493–9532. [Google Scholar] [CrossRef]
- Battleson, D.A.; West, B.C.; Kim, J.; Ramesh, B.; Robinson, P.S. Achieving dynamic capabilities with cloud computing: An empirical investigation. Eur. J. Inf. Syst. 2016, 25, 209–230. [Google Scholar] [CrossRef]
- Al-Ruithe, M.; Benkhelifa, E.; Hameed, K. A systematic literature review of data governance and cloud data governance. Pers. Ubiquitous Comput. 2018, 23, 839–859. [Google Scholar] [CrossRef]
- Goswami, S.S. Outranking Methods: Promethee I and Promethee II. Found. Manag. 2020, 12, 93–110. [Google Scholar] [CrossRef]
- Warfield, J.N. Developing Subsystem Matrices in Structural Modeling. IEEE Trans. Syst. Man Cybern. 1974, SMC-4, 74–80. [Google Scholar] [CrossRef]
- Warfield, J.N. Developing Interconnection Matrices in Structural Modeling. IEEE Trans. Syst. Man Cybern. 1974, SMC-4, 81–87. [Google Scholar] [CrossRef] [Green Version]
- Stergiou, C.; Psannis, K.E.; Gupta, B.B.; Ishibashi, Y. Security, privacy & efficiency of sustainable Cloud Computing for Big Data & IoT. Sustain. Comput. Inform. Syst. 2018, 19, 174–184. [Google Scholar] [CrossRef]


| Reference | Tools used | No. of Critical Factors | Area of Application |
|---|---|---|---|
| Sharma et al. [33] | AHP–ISM–MICMAC | 28 | Supply chain management in manufacturing firm |
| Kumar and Rahman [34] | ISM–MICMAC–AHP | 15 | Supply chain management in Indian manufacturing industries |
| Singh et al. [35] | ISM–MICMAC | 12 | Green lean practices in Indian manufacturing industries |
| Singh and Bhanot [36] | DEMATEL–MMDE | 10 | IoT barriers |
| Khaba and Bhar [37] | AHP-ISM–SEM | 14 | Indian mining industry |
| Khaba et al. [38] | AHP-ISM–SEM | 10 | Indian mining industry |
| Sharma et al. [39] | AHP–DEMATEL–ISM | 21 | Blockchain technology in tourism and hospitality sectors |
| Duleba et al. [40] | AHP–ISM | 24 | Public transport systems |
| Song et al. [41] | AHP–ISM | 21 | Urban rail transit |
| Zhang and Yang [42] | ANP, F-TOPSIS | 5 | Environmental sustainability of big data centers |
| Rajput and Singh [43] | PCA–DEMATEL–ISM | 20 | IoT enablers for industry 4.0 |
| No of Expert Members | Professional Field | Designation | Experience |
|---|---|---|---|
| Decision team 1 | |||
| 1 | Manufacturing industry | General manager | 20 |
| 1 | Academician | Research project supervisor | 25 |
| 4 | IT professional | Cloud engineer | 15 |
| 4 | Research institute | Scientist | 25 |
| Decision team 2 | |||
| 1 | IT professional | Technical lead | 12 |
| 4 | University | Professor | 22 |
| 1 | Health sector | Chief medical officer | 25 |
| 2 | IT professional | Data analyst | 11 |
| 2 | IT professional | Project head | 20 |
| Decision team 3 | |||
| 2 | IT professional | Chief digital officer | 13 |
| 1 | Building construction sector | Manager | 15 |
| 1 | Transportation sector | Vice president | 18 |
| 2 | IT professional | Software developer | 12 |
| 3 | IT professional | Data scientist | 17 |
| 1 | IT professional | Senior programmer | 15 |
| Main Factor (MF) | Indicators | Sub Factor (SF) | Indicators |
|---|---|---|---|
| MF 1 Budget Issues | BI | Direct cost involved and budget | SF 1 |
| Funding from external bodies | SF 2 | ||
| Inferred or indirect cost | SF 3 | ||
| MF 2 Environmental Issues | EI | Environmental optimization and management | SF 4 |
| Sustainability | SF 5 | ||
| Focus on social aspects | SF 6 | ||
| MF 3 Learning Issues | LI | Tendency of user to learn | SF 7 |
| Collaboration with R&D sectors | SF 8 | ||
| Training and skill development program | SF 9 | ||
| MF 4 Technological Issues | TI | Aesthetic values | SF 10 |
| Interactive information usage | SF 11 | ||
| Digitalization of innovative technologies | SF 12 | ||
| MF 5 Organizational Issues | OI | Leadership and teamwork | SF 13 |
| Exchange of information | SF 14 | ||
| Governance of employees | SF 15 |
| RI Values | Linguistic Scale | |||||
|---|---|---|---|---|---|---|
| n | RI | n | RI | Qualitative Terms | Notations | Quantitative Scale |
| 1 | 0 | 8 | 1.41 | Same importance | SI | 1 |
| 2 | 0 | 9 | 1.45 | Moderate importance | MI | 2 |
| 3 | 0.58 | 10 | 1.49 | Adequate importance | AI | 3 |
| 4 | 0.9 | 11 | 1.51 | Importance | I | 5 |
| 5 | 1.12 | 12 | 1.58 | High importance | HI | 7 |
| 6 | 1.24 | 7 | 1.32 | Very high importance | VHI | 8 |
| Extreme importance | EI | 9 | ||||
| Decision Team 1 | Decision Team 2 | Decision Team 3 | |||||||||||||||
|---|---|---|---|---|---|---|---|---|---|---|---|---|---|---|---|---|---|
| BI | EI | LI | TI | OI | BI | EI | LI | TI | OI | BI | EI | LI | TI | OI | |||
| BI | SI | MI | I | AI | BI | SI | AI | HI | I | BI | SI | MI | VHI | AI | |||
| 1 | 2 | 5 | 3 | 1 | 3 | 7 | 5 | 1 | 2 | 8 | 3 | ||||||
| EI | SI | AI | MI | EI | SI | I | AI | EI | SI | AI | MI | ||||||
| 1 | 3 | 2 | 1 | 5 | 3 | 1 | 3 | 2 | |||||||||
| LI | SI | LI | SI | LI | SI | ||||||||||||
| 1 | 1 | 1 | |||||||||||||||
| TI | MI | AI | EI | SI | I | TI | MI | AI | EI | SI | HI | TI | MI | I | VHI | SI | HI |
| 2 | 3 | 9 | 1 | 5 | 2 | 3 | 9 | 1 | 7 | 2 | 5 | 8 | 1 | 7 | |||
| OI | MI | SI | OI | AI | SI | OI | MI | SI | |||||||||
| 2 | 1 | 3 | 1 | 2 | 1 | ||||||||||||
| Main Factors | BI | EI | LI | TI | OI |
|---|---|---|---|---|---|
| BI | 1 | 2.33333 | 6.66667 | 0.50000 | 3.66667 |
| EI | 0.42857 | 1 | 3.66667 | 0.27273 | 2.33333 |
| LI | 0.15000 | 0.27273 | 1 | 0.11538 | 0.42857 |
| TI | 2.00000 | 3.66667 | 8.66667 | 1 | 6.33333 |
| OI | 0.27273 | 0.42857 | 2.33333 | 0.15789 | 1 |
| Sum | 3.85130 | 7.70130 | 22.33333 | 2.04601 | 13.76190 |
| Main Factors | BI | EI | LI | TI | OI | Priority Vector (PV) |
|---|---|---|---|---|---|---|
| BI | 0.25965 | 0.30298 | 0.29851 | 0.24438 | 0.26644 | 0.27439 |
| EI | 0.11128 | 0.12985 | 0.16418 | 0.13330 | 0.16955 | 0.14163 |
| LI | 0.03895 | 0.03541 | 0.04478 | 0.05640 | 0.03114 | 0.04133 |
| TI | 0.51931 | 0.47611 | 0.38806 | 0.48876 | 0.46021 | 0.46649 |
| OI | 0.07081 | 0.05565 | 0.10448 | 0.07717 | 0.07266 | 0.07616 |
| Sum | 1.00000 | 1.00000 | 1.00000 | 1.00000 | 1.00000 | 1.00000 |
| Main Factors | Consistency of Each Factor | Consistency Terminologies | |
|---|---|---|---|
| BI | 5.07637 | No of comparisons (n) | 5 |
| EI | 5.05333 | Average consistency (λ max) | 5.05131 |
| LI | 5.02201 | CI | 0.01283 |
| TI | 5.09153 | RI | 1.12 |
| OI | 5.01332 | CR | 0.01145 or 1.145% ≤ 0.1 or 10% |
| Sum | 25.25656 | Consistent | yes |
| Budget Issues (BI) | |||||||||||
| Decision Team 1 | Decision Team 2 | Decision Team 3 | |||||||||
| SF 1 | SF 2 | SF 3 | SF 1 | SF 2 | SF 3 | SF 1 | SF 2 | SF 3 | |||
| SF 1 | SI | MI | SF 1 | SI | AI | SF 1 | SI | MI | |||
| SF 2 | I | SI | HI | SF 2 | I | SI | VHI | SF 2 | AI | SI | HI |
| SF 3 | SI | SF 3 | SI | SF 3 | SI | ||||||
| Environmental Issues (EI) | |||||||||||
| Decision Team 1 | Decision Team 2 | Decision Team 3 | |||||||||
| SF 4 | SF 5 | SF 6 | SF 4 | SF 5 | SF 6 | SF 4 | SF 5 | SF 6 | |||
| SF 4 | SI | AI | I | SF 4 | SI | MI | I | SF 4 | SI | MI | AI |
| SF 5 | SI | MI | SF 5 | SI | AI | SF 5 | SI | MI | |||
| SF 6 | SI | SF 6 | SI | SF 6 | SI | ||||||
| Learning Issues (LI) | |||||||||||
| Decision Team 1 | Decision Team 2 | Decision Team 3 | |||||||||
| SF 7 | SF 8 | SF 9 | SF 7 | SF 8 | SF 9 | SF 7 | SF 8 | SF 9 | |||
| SF 7 | SI | SF 7 | SI | SF 7 | SI | ||||||
| SF 8 | HI | SI | I | SF 8 | VHI | SI | I | SF 8 | VHI | SI | AI |
| SF 9 | MI | SI | SF 9 | AI | SI | SF 9 | MI | SI | |||
| Technological Issues (TI) | |||||||||||
| Decision Team 1 | Decision Team 2 | Decision Team 3 | |||||||||
| SF 10 | SF 11 | SF 12 | SF 10 | SF 11 | SF 12 | SF 10 | SF 11 | SF 12 | |||
| SF 10 | SI | SF 10 | SI | SF 10 | SI | ||||||
| SF 11 | MI | SI | SF 11 | MI | SI | SF 11 | MI | SI | |||
| SF 12 | EI | I | SI | SF 12 | EI | HI | SI | SF 12 | VHI | I | SI |
| Organizational Issues (OI) | |||||||||||
| Decision Team 1 | Decision Team 2 | Decision Team 3 | |||||||||
| SF 13 | SF 14 | SF 15 | SF 13 | SF 14 | SF 15 | SF 13 | SF 14 | SF 15 | |||
| SF 13 | SI | VHI | I | SF 13 | SI | EI | I | SF 13 | SI | HI | AI |
| SF 14 | SI | SF 14 | SI | SF 14 | SI | ||||||
| SF 15 | MI | SI | SF 15 | AI | SI | SF 15 | MI | SI | |||
| SF 1 | SF 2 | SF 3 | SF 4 | SF 5 | SF 6 | SF 7 | SF 8 | SF 9 | SF 10 | SF 11 | SF 12 | SF 13 | SF 14 | SF 15 | |
|---|---|---|---|---|---|---|---|---|---|---|---|---|---|---|---|
| SF 1 | 1 | V | A | V | A | O | A | V | X | A | O | A | V | A | O |
| SF 2 | 1 | V | A | O | A | X | O | V | A | A | O | A | O | X | |
| SF 3 | 1 | O | A | V | A | V | A | V | X | A | V | A | V | ||
| SF 4 | 1 | X | O | V | A | O | A | V | A | A | X | A | |||
| SF 5 | 1 | V | A | O | A | X | A | O | A | A | O | ||||
| SF 6 | 1 | V | X | V | A | O | A | V | A | X | |||||
| SF 7 | 1 | O | X | V | A | V | O | O | A | ||||||
| SF 8 | 1 | O | A | O | A | V | A | V | |||||||
| SF 9 | 1 | V | A | O | X | V | A | ||||||||
| SF 10 | 1 | V | A | V | A | O | |||||||||
| SF 11 | 1 | X | A | O | X | ||||||||||
| SF 12 | 1 | V | A | V | |||||||||||
| SF 13 | 1 | X | A | ||||||||||||
| SF 14 | 1 | V | |||||||||||||
| SF 15 | 1 |
| SF 1 | SF 2 | SF 3 | SF 4 | SF 5 | SF 6 | SF 7 | SF 8 | SF 9 | SF 10 | SF 11 | SF 12 | SF 13 | SF 14 | SF 15 | |
|---|---|---|---|---|---|---|---|---|---|---|---|---|---|---|---|
| SF 1 | 1 | 1 | 0 | 1 | 0 | 0 | 0 | 1 | 1 | 0 | 0 | 0 | 1 | 0 | 0 |
| SF 2 | 0 | 1 | 1 | 0 | 0 | 0 | 1 | 0 | 1 | 0 | 0 | 0 | 0 | 0 | 1 |
| SF 3 | 1 | 0 | 1 | 0 | 0 | 1 | 0 | 1 | 0 | 1 | 1 | 0 | 1 | 0 | 1 |
| SF 4 | 0 | 1 | 0 | 1 | 1 | 0 | 1 | 0 | 0 | 0 | 1 | 0 | 0 | 1 | 0 |
| SF 5 | 1 | 0 | 1 | 1 | 1 | 1 | 0 | 0 | 0 | 1 | 0 | 0 | 0 | 0 | 0 |
| SF 6 | 0 | 1 | 0 | 0 | 0 | 1 | 1 | 1 | 1 | 0 | 0 | 0 | 1 | 0 | 1 |
| SF 7 | 1 | 1 | 1 | 0 | 1 | 0 | 1 | 0 | 1 | 1 | 0 | 1 | 0 | 0 | 0 |
| SF 8 | 0 | 0 | 0 | 1 | 0 | 1 | 0 | 1 | 0 | 0 | 0 | 0 | 1 | 0 | 1 |
| SF 9 | 1 | 0 | 1 | 0 | 1 | 0 | 1 | 0 | 1 | 1 | 0 | 0 | 1 | 1 | 0 |
| SF 10 | 1 | 1 | 0 | 1 | 1 | 1 | 0 | 1 | 0 | 1 | 1 | 0 | 1 | 0 | 0 |
| SF 11 | 0 | 1 | 1 | 0 | 1 | 0 | 1 | 0 | 1 | 0 | 1 | 1 | 0 | 0 | 1 |
| SF 12 | 1 | 0 | 1 | 1 | 0 | 1 | 0 | 1 | 0 | 1 | 1 | 1 | 1 | 0 | 1 |
| SF 13 | 0 | 1 | 0 | 1 | 1 | 0 | 0 | 0 | 1 | 0 | 1 | 0 | 1 | 1 | 0 |
| SF 14 | 1 | 0 | 1 | 1 | 1 | 1 | 0 | 1 | 0 | 1 | 0 | 1 | 1 | 1 | 1 |
| SF 15 | 0 | 1 | 0 | 1 | 0 | 1 | 1 | 0 | 1 | 0 | 1 | 0 | 1 | 0 | 1 |
| SF 1 | SF 2 | SF 3 | SF 4 | SF 5 | SF 6 | SF 7 | SF 8 | SF 9 | SF 10 | SF 11 | SF 12 | SF 13 | SF 14 | SF 15 | DrP | Rank | |
|---|---|---|---|---|---|---|---|---|---|---|---|---|---|---|---|---|---|
| SF 1 | 1 | 1 | 1* | 1 | 1* | 1* | 1* | 1 | 1 | 1* | 1* | 0 | 1 | 1* | 1* | 14 | 12 |
| SF 2 | 1* | 1 | 1 | 1* | 1* | 1* | 1 | 1* | 1 | 1* | 1* | 1* | 1* | 1* | 1 | 15 | 1 |
| SF 3 | 1 | 1* | 1 | 1* | 1* | 1 | 1* | 1 | 1* | 1 | 1 | 1* | 1 | 1* | 1 | 15 | 1 |
| SF 4 | 1* | 1 | 1* | 1 | 1 | 1* | 1 | 1* | 1* | 1* | 1 | 1* | 1* | 1 | 1* | 15 | 1 |
| SF 5 | 1 | 1* | 1 | 1 | 1 | 1 | 1* | 1* | 1* | 1 | 1* | 0 | 1* | 1* | 1* | 14 | 12 |
| SF 6 | 1* | 1 | 1* | 1* | 1* | 1 | 1 | 1 | 1 | 1* | 1* | 1* | 1 | 1* | 1 | 15 | 1 |
| SF 7 | 1 | 1 | 1 | 1* | 1 | 1* | 1 | 1* | 1 | 1 | 1* | 1 | 1* | 1* | 1* | 15 | 1 |
| SF 8 | 0 | 1* | 0 | 1 | 1* | 1 | 1* | 1 | 1* | 0 | 1* | 0 | 1 | 1* | 1 | 11 | 14 |
| SF 9 | 1 | 1* | 1 | 1* | 1 | 1* | 1 | 1* | 1 | 1 | 1* | 1* | 1 | 1 | 1* | 15 | 1 |
| SF 10 | 1 | 1 | 1* | 1 | 1 | 1 | 1* | 1 | 1* | 1 | 1 | 1* | 1 | 1* | 1* | 15 | 1 |
| SF 11 | 1* | 1 | 1 | 1* | 1 | 1* | 1 | 1* | 1 | 1* | 1 | 1 | 1* | 1* | 1 | 15 | 1 |
| SF 12 | 1 | 1* | 1 | 1 | 1* | 1 | 1* | 1 | 1* | 1 | 1 | 1 | 1 | 1* | 1 | 15 | 1 |
| SF 13 | 1* | 1 | 1* | 1 | 1 | 1* | 1* | 1* | 1 | 1* | 1 | 1* | 1 | 1 | 1* | 15 | 1 |
| SF 14 | 1 | 1* | 1 | 1 | 1 | 1 | 1* | 1 | 1* | 1 | 1* | 1 | 1 | 1 | 1 | 15 | 1 |
| SF 15 | 0 | 1 | 0 | 1 | 0 | 1 | 1 | 0 | 1 | 0 | 1 | 0 | 1 | 0 | 1 | 8 | 15 |
| DeP | 13 | 15 | 13 | 15 | 14 | 15 | 15 | 14 | 15 | 13 | 15 | 11 | 15 | 14 | 15 | ||
| Rank | 12 | 1 | 12 | 1 | 9 | 1 | 1 | 9 | 1 | 12 | 1 | 15 | 1 | 9 | 1 | ||
| Factor | Reachability | Antecedent | Intersection | Level |
|---|---|---|---|---|
| 1st iteration | ||||
| SF 1 | 1,2,3,4,5,6,7,8,9,10,11,13,14,15 | 1,2,3,4,5,6,7,9,10,11,12,13,14 | 1,2,3,4,5,6,7,9,10,11,13,14 | |
| SF 2 | 1,2,3,4,5,6,7,8,9,10,11,12,13,14,15 | 1,2,3,4,5,6,7,8,9,10,11,12,13,14,15 | 1,2,3,4,5,6,7,8,9,10,11,12,13,14,15 | Level 1 |
| SF 3 | 1,2,3,4,5,6,7,8,9,10,11,12,13,14,15 | 1,2,3,4,5,6,7,9,10,11,12,13,14 | 1,2,3,4,5,6,7,9,10,11,12,13,14 | |
| SF 4 | 1,2,3,4,5,6,7,8,9,10,11,12,13,14,15 | 1,2,3,4,5,6,7,8,9,10,11,12,13,14,15 | 1,2,3,4,5,6,7,8,9,10,11,12,13,14,15 | Level 1 |
| SF 5 | 1,2,3,4,5,6,7,8,9,10,11,13,14,15 | 1,2,3,4,5,6,7,8,9,10,11,12,13,14 | 1,2,3,4,5,6,7,8,9,10,11,13,14 | |
| SF 6 | 1,2,3,4,5,6,7,8,9,10,11,12,13,14,15 | 1,2,3,4,5,6,7,8,9,10,11,12,13,14,15 | 1,2,3,4,5,6,7,8,9,10,11,12,13,14,15 | Level 1 |
| SF 7 | 1,2,3,4,5,6,7,8,9,10,11,12,13,14,15 | 1,2,3,4,5,6,7,8,9,10,11,12,13,14,15 | 1,2,3,4,5,6,7,8,9,10,11,12,13,14,15 | Level 1 |
| SF 8 | 2,4,5,6,7,8,9,11,13,14,15 | 1,2,3,4,5,6,7,8,9,10,11,12,13,14 | 2,4,5,6,7,8,9,11,13,14,15 | |
| SF 9 | 1,2,3,4,5,6,7,8,9,10,11,12,13,14,15 | 1,2,3,4,5,6,7,8,9,10,11,12,13,14,15 | 1,2,3,4,5,6,7,8,9,10,11,12,13,14,15 | Level 1 |
| SF 10 | 1,2,3,4,5,6,7,8,9,10,11,12,13,14,15 | 1,2,3,4,5,6,7,9,10,11,12,13,14 | 1,2,3,4,5,6,7,9,10,11,12,13,14 | |
| SF 11 | 1,2,3,4,5,6,7,8,9,10,11,12,13,14,15 | 1,2,3,4,5,6,7,8,9,10,11,12,13,14,15 | 1,2,3,4,5,6,7,8,9,10,11,12,13,14,15 | Level 1 |
| SF 12 | 1,2,3,4,5,6,7,8,9,10,11,12,13,14,15 | 2,3,4,6,7,9,10,11,12,13,14 | 2,3,4,6,7,9,10,11,12,13,14 | |
| SF 13 | 1,2,3,4,5,6,7,8,9,10,11,12,13,14,15 | 1,2,3,4,5,6,7,8,9,10,11,12,13,14,15 | 1,2,3,4,5,6,7,8,9,10,11,12,13,14,15 | Level 1 |
| SF 14 | 1,2,3,4,5,6,7,8,9,10,11,12,13,14,15 | 1,2,3,4,5,6,7,8,9,10,11,12,13,14 | 1,2,3,4,5,6,7,8,9,10,11,12,13,14 | |
| SF 15 | 2,4,6,7,9,11,13,15 | 1,2,3,4,5,6,7,8,9,10,11,12,13,14,15 | 2,4,6,7,9,11,13,15 | Level 1 |
| 2nd iteration | ||||
| SF 1 | 1,3,5,8,10,14 | 1,3,5,10,12,14 | 1,3,5,10,14 | |
| SF 3 | 1,3,5,8,10,12,14 | 1,3,5,10,12,14 | 1,3,5,10,12,14 | |
| SF 5 | 1,3,5,8,10,14 | 1,3,5,8,10,12,14 | 1,3,5,8,10,14 | Level 2 |
| SF 8 | 5,8,14 | 1,3,5,8,10,12,14 | 5,8,14 | Level 2 |
| SF 10 | 1,3,5,8,10,12,14 | 1,3,5,10,12,14 | 1,3,5,10,12,14 | |
| SF 12 | 1,3,5,8,10,12,14 | 3,10,12,14 | 3,10,12,14 | |
| SF 14 | 1,3,5,8,10,12,14 | 1,3,5,8,10,12,14 | 1,3,5,8,10,12,14 | Level 2 |
| 3rd iteration | ||||
| SF 1 | 1,3,10 | 1,3,10,12 | 1,3,10 | Level 3 |
| SF 3 | 1,3,10,12 | 1,3,10,12 | 1,3,10,12 | Level 3 |
| SF 10 | 1,3,10,12 | 1,3,10,12 | 1,3,10,12 | Level 3 |
| SF 12 | 1,3,10,12 | 3,10,12 | 3,10,12 | |
| 4th iteration | ||||
| SF 12 | 12 | 12 | 12 | Level 4 |
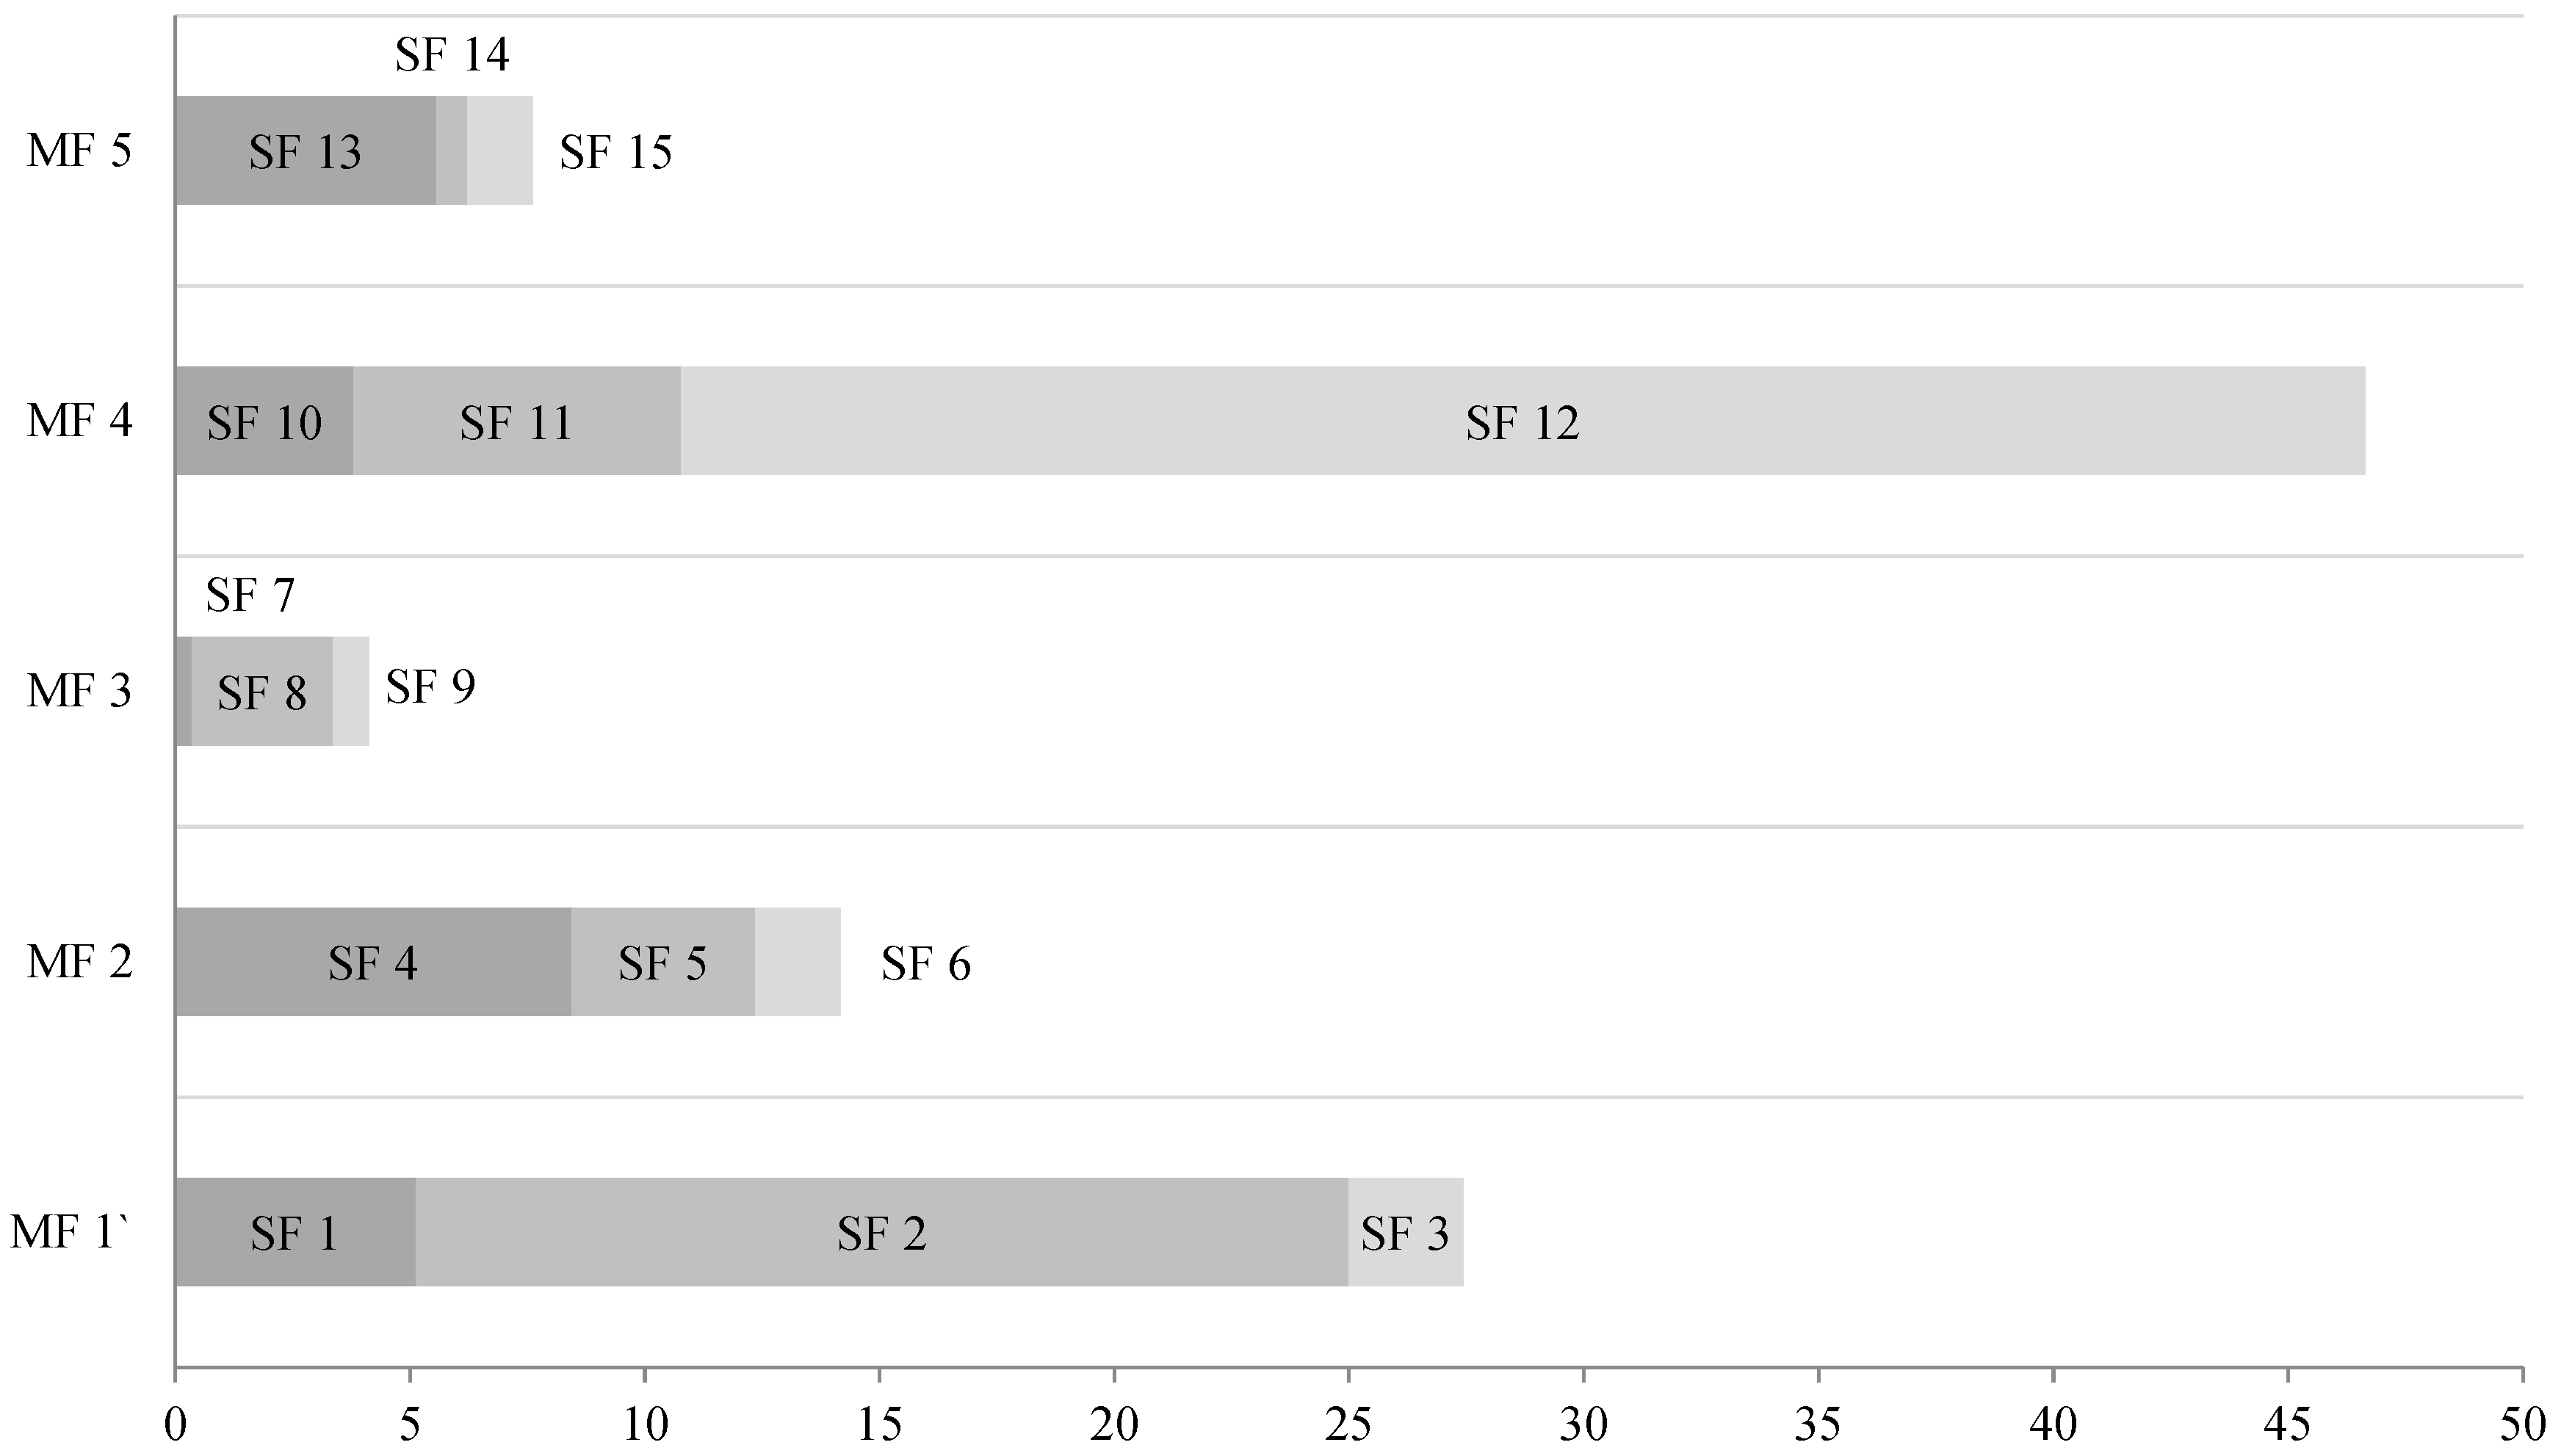
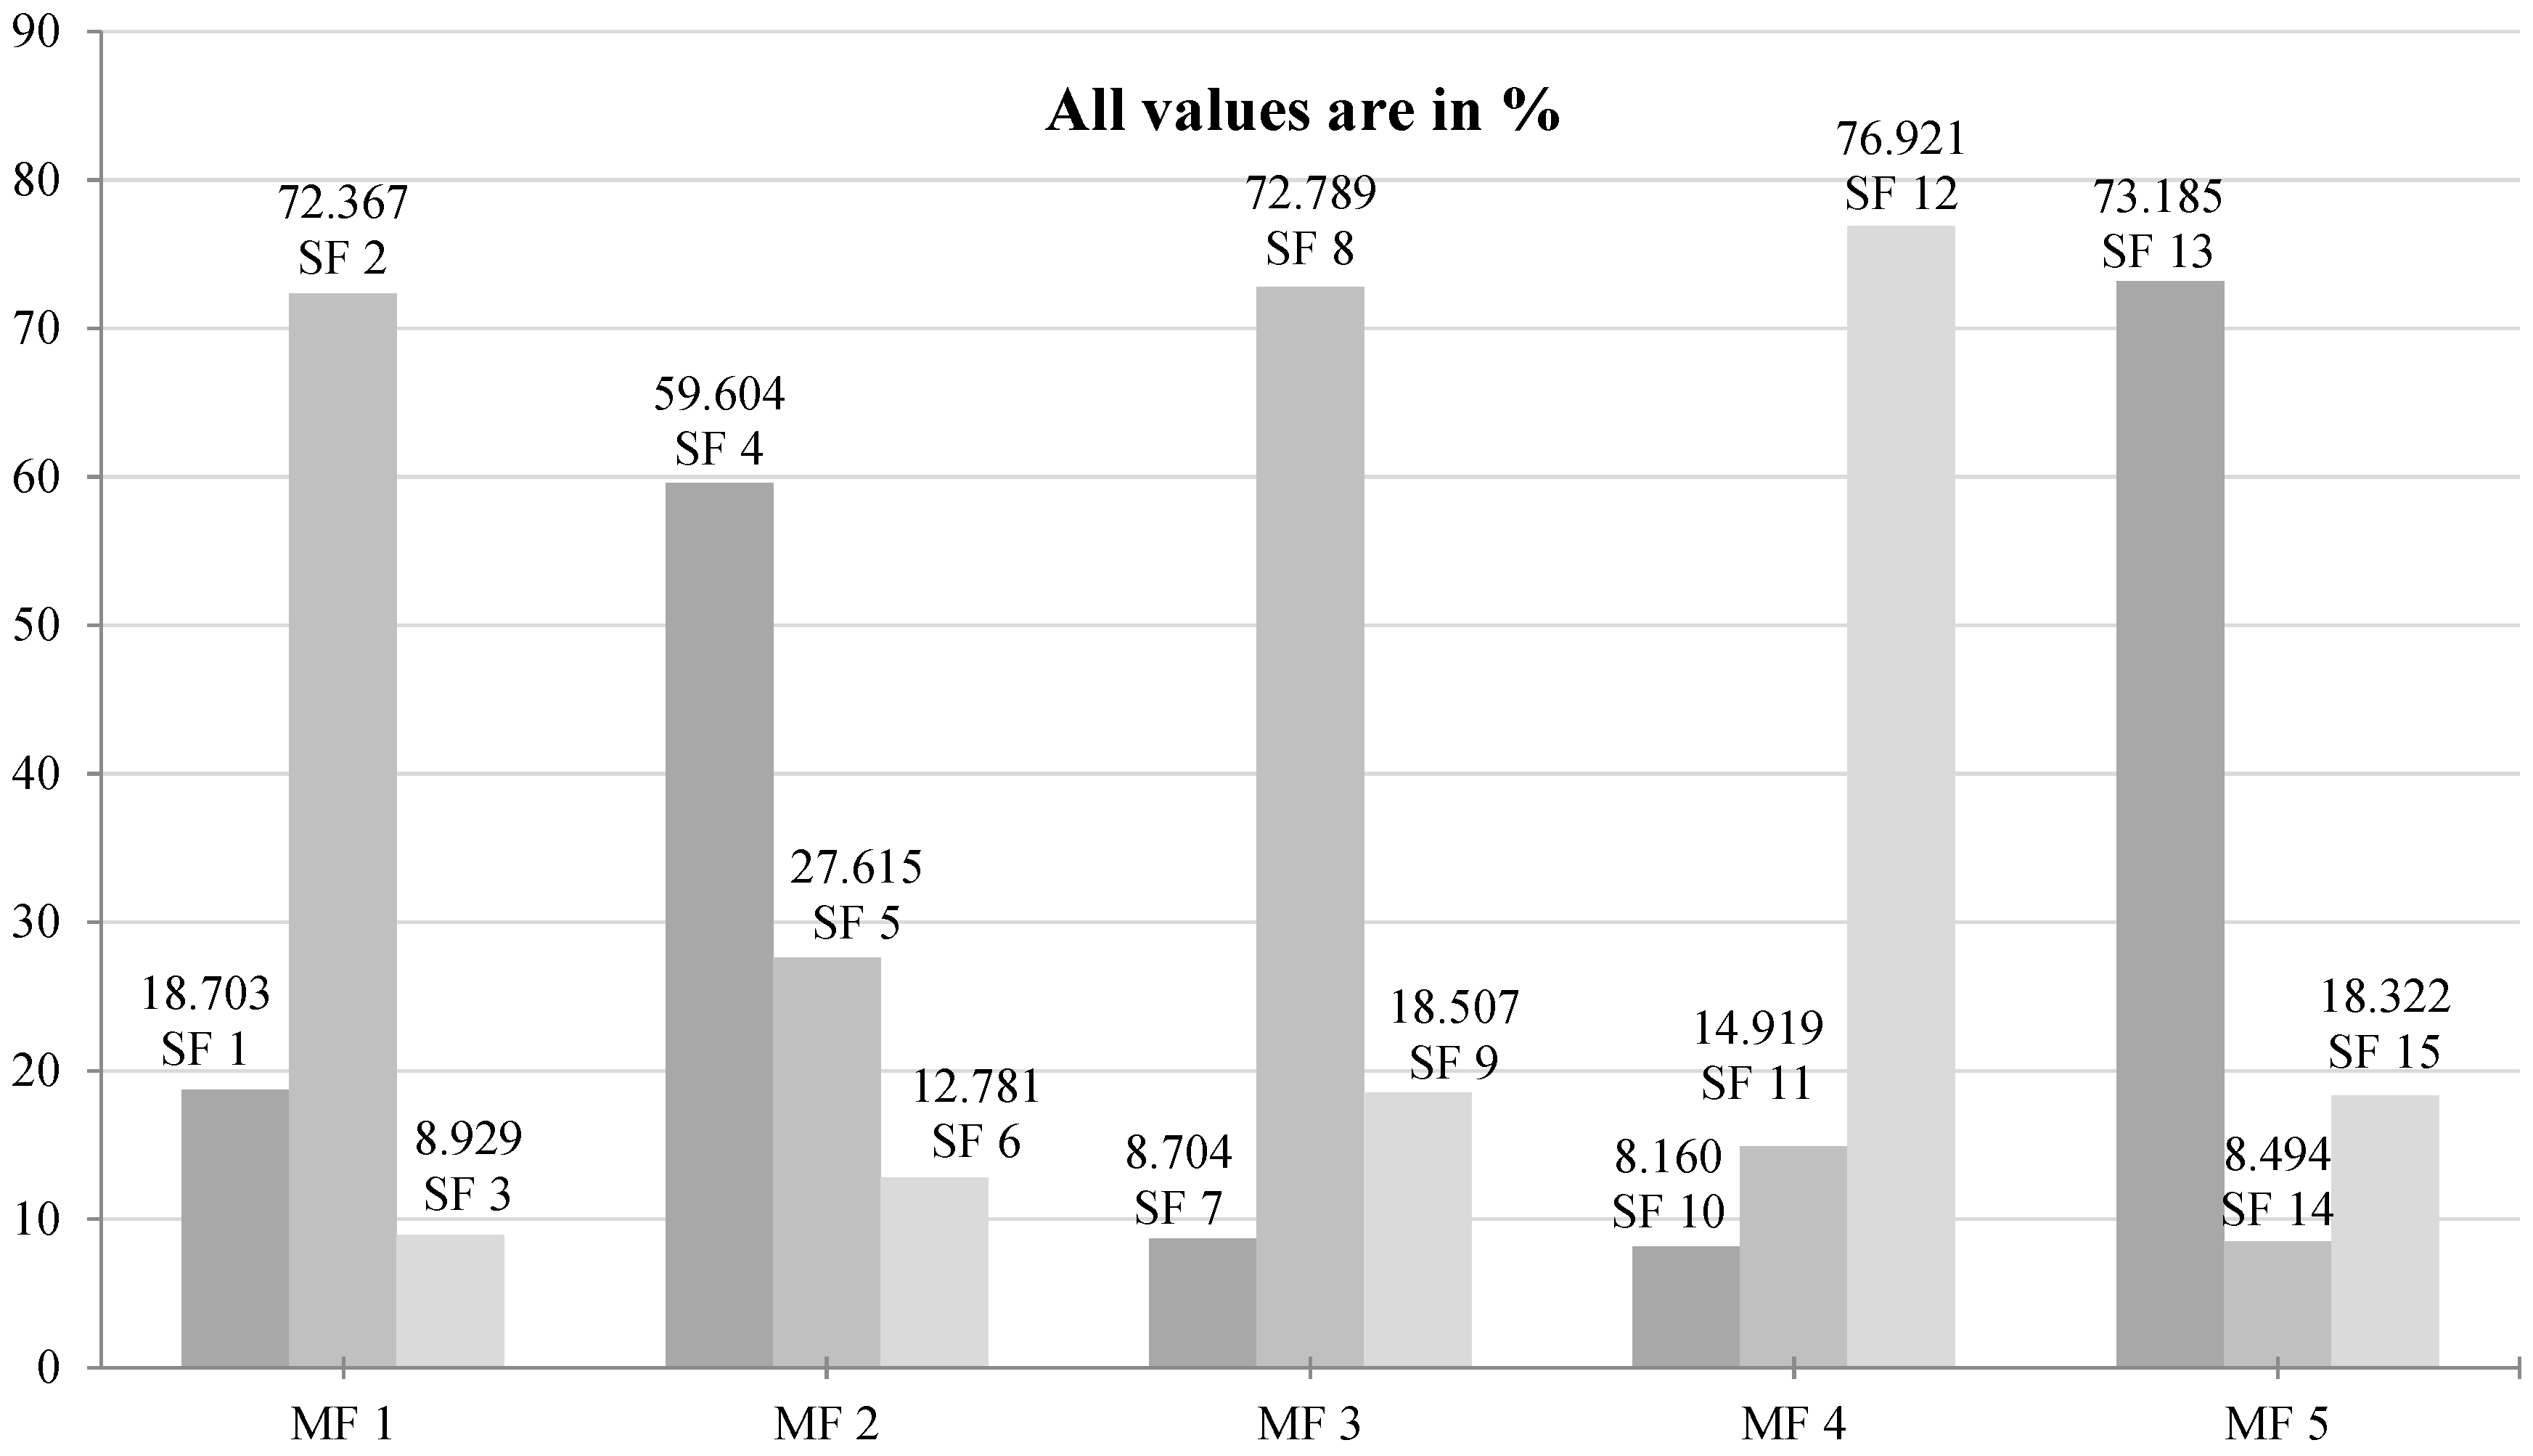
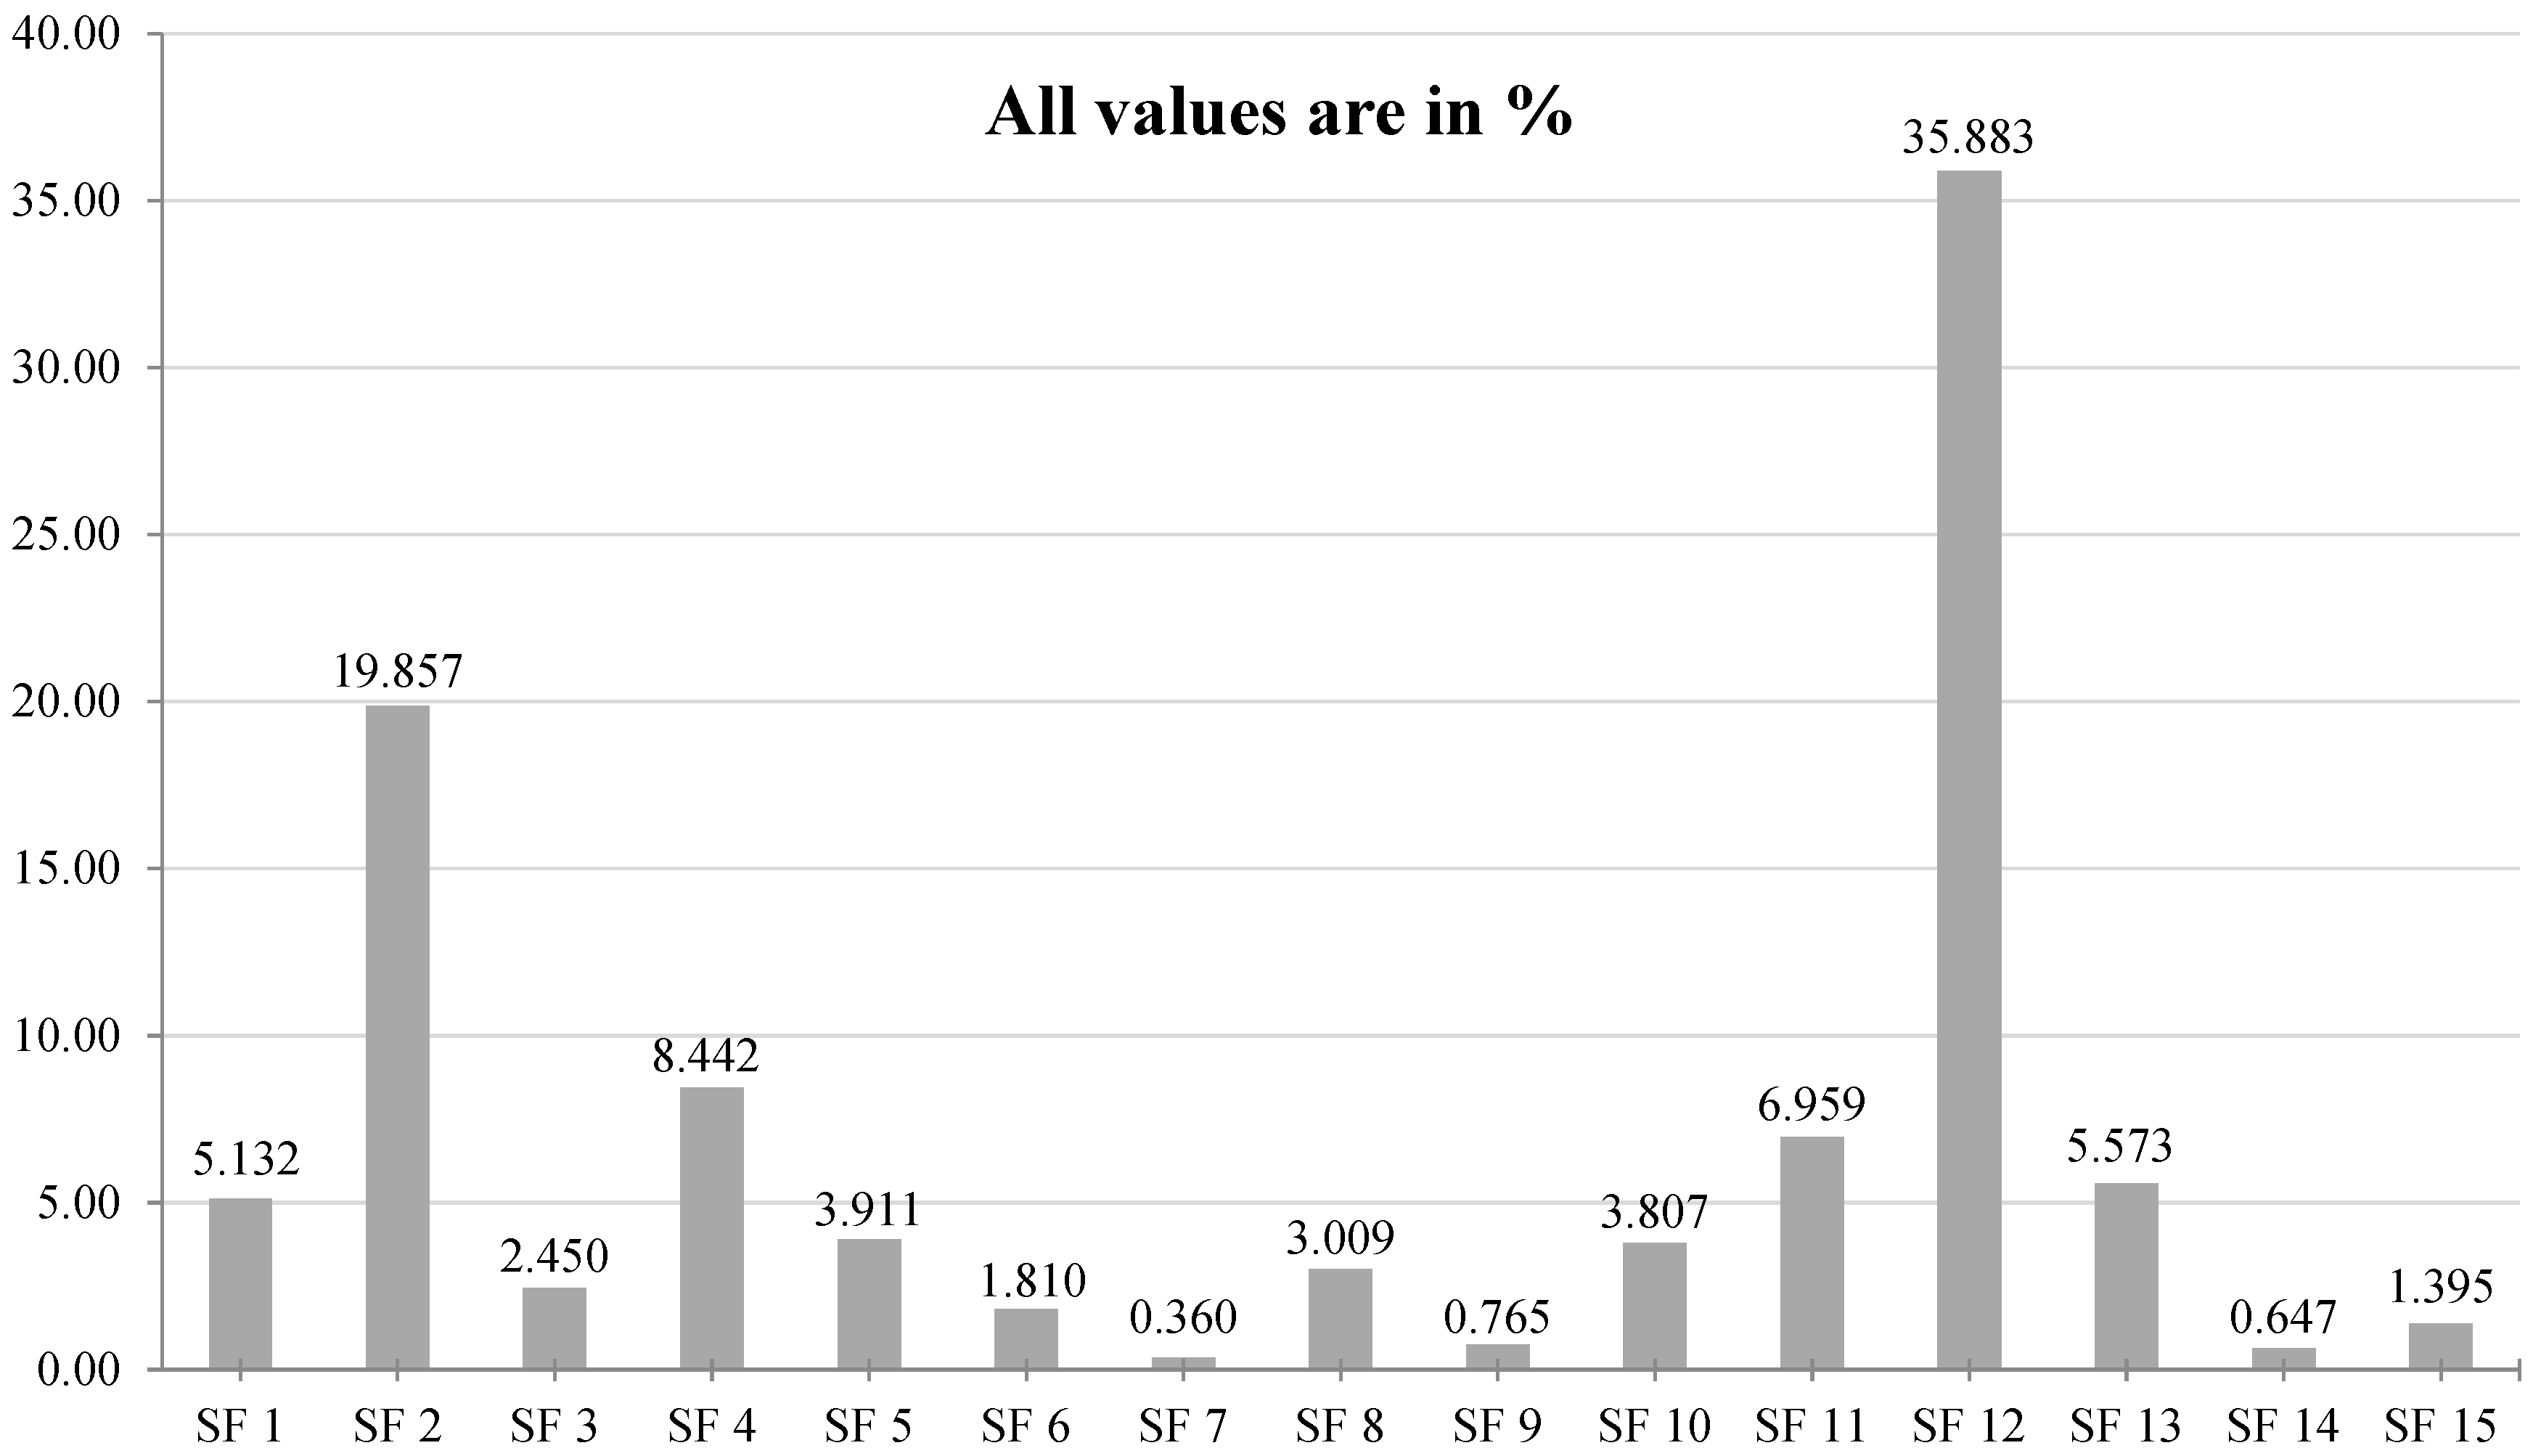
| MF | Weights | Rank | CR (MF) | SF | Local Weights | Local Rank | CR (SF) | Global Weights | Global Rank |
|---|---|---|---|---|---|---|---|---|---|
| BI | 0.27439 | 2 | 0.01145 | SF 1 | 0.18703 | 2 | 0.00992 | 0.05132 | 6 |
| SF 2 | 0.72367 | 1 | 0.19857 | 2 | |||||
| SF 3 | 0.08929 | 3 | 0.02450 | 10 | |||||
| Sum | 1 | Sum | 0.27439 | ||||||
| EI | 0.14163 | 3 | SF 4 | 0.59604 | 1 | 0.00500 | 0.08442 | 3 | |
| SF 5 | 0.27615 | 2 | 0.03911 | 7 | |||||
| SF 6 | 0.12781 | 3 | 0.01810 | 11 | |||||
| Sum | 1 | Sum | 0.14163 | ||||||
| LI | 0.04133 | 5 | SF 7 | 0.08704 | 3 | 0.00736 | 0.00360 | 15 | |
| SF 8 | 0.72789 | 1 | 0.03009 | 9 | |||||
| SF 9 | 0.18507 | 2 | 0.00765 | 13 | |||||
| Sum | 1 | Sum | 0.04133 | ||||||
| TI | 0.46649 | 1 | SF 10 | 0.08160 | 3 | 0.00691 | 0.03807 | 8 | |
| SF 11 | 0.14919 | 2 | 0.06959 | 4 | |||||
| SF 12 | 0.76921 | 1 | 0.35883 | 1 | |||||
| Sum | 1 | Sum | 0.46649 | ||||||
| OI | 0.07616 | 4 | SF 13 | 0.73185 | 1 | 0.00526 | 0.05573 | 5 | |
| SF 14 | 0.08494 | 3 | 0.00647 | 14 | |||||
| SF 15 | 0.18322 | 2 | 0.01395 | 12 | |||||
| Sum | 1 | Sum | 1 | Sum | 0.07616 | ||||
Disclaimer/Publisher’s Note: The statements, opinions and data contained in all publications are solely those of the individual author(s) and contributor(s) and not of MDPI and/or the editor(s). MDPI and/or the editor(s) disclaim responsibility for any injury to people or property resulting from any ideas, methods, instructions or products referred to in the content. |
© 2023 by the authors. Licensee MDPI, Basel, Switzerland. This article is an open access article distributed under the terms and conditions of the Creative Commons Attribution (CC BY) license (https://creativecommons.org/licenses/by/4.0/).
Share and Cite
Yenugula, M.; Goswami, S.S.; Kaliappan, S.; Saravanakumar, R.; Alasiry, A.; Marzougui, M.; AlMohimeed, A.; Elaraby, A. Analyzing the Critical Parameters for Implementing Sustainable AI Cloud System in an IT Industry Using AHP-ISM-MICMAC Integrated Hybrid MCDM Model. Mathematics 2023, 11, 3367. https://doi.org/10.3390/math11153367
Yenugula M, Goswami SS, Kaliappan S, Saravanakumar R, Alasiry A, Marzougui M, AlMohimeed A, Elaraby A. Analyzing the Critical Parameters for Implementing Sustainable AI Cloud System in an IT Industry Using AHP-ISM-MICMAC Integrated Hybrid MCDM Model. Mathematics. 2023; 11(15):3367. https://doi.org/10.3390/math11153367
Chicago/Turabian StyleYenugula, Manideep, Shankha Shubhra Goswami, Subramaniam Kaliappan, Rengaraj Saravanakumar, Areej Alasiry, Mehrez Marzougui, Abdulaziz AlMohimeed, and Ahmed Elaraby. 2023. "Analyzing the Critical Parameters for Implementing Sustainable AI Cloud System in an IT Industry Using AHP-ISM-MICMAC Integrated Hybrid MCDM Model" Mathematics 11, no. 15: 3367. https://doi.org/10.3390/math11153367