1. Introduction
Mathematical modeling and computer simulation have become indispensable components of research in microbial evolutionary dynamics and in silico studies. The progress in mathematical techniques and the introduction of personal computers with increased processing power and increasing availability of software have resulted in the development of mathematical models in a wide spectrum of applied problems. Mathematical modeling and computer simulation are natural languages to examine biological systems that demonstrate complex nonlinear space-time behavior. Most in silico models focus on complementing (and not replacing) conventional experimental studies as well as research with in vitro models. Experimental data are needed for parameterization, calibration, and validation of in silico models. The development of in silico models is facilitated by rapidly advancing experimental and analytical tools that generate high-throughput biological and medicine data [
1,
2,
3].
Bacteria are some of the most crucial objects of mathematical biology and in silico studies. In nature, most bacteria live within biofilms, because they provide a structured and protective environment for microbial growth, survival, and adaptation. Bacterial biofilms can be found in diverse environments, including water, soil, industrial piping, medical implants, and dental plaque [
4], especially on surfaces. Control and utilization of these tiny, ubiquitous organisms can generate huge leaps to advance human society. Bacteria play a crucial role in human microbiota and they are responsible for many infectious diseases; bacteria are an imperative part of fertile soil, and even tools in biological warfare and bioterrorism [
5].
It should be pointed out why biofilms are so vital for bacteria: protection from environmental stress such as temperature fluctuations, pH changes, and UV radiation; nutrient availability by means of the extracellular polymeric matrix; antibiotic resistance due to such factors as decreased antibiotic penetration and increased genetic exchange; adaptation to changing conditions due to the close proximity and exchange of genetic material, and persistence in devices or in the human body causing hospital infections [
6,
7,
8].
Bacteria in biofilms adhere to surfaces and are embedded in an extracellular polymeric matrix. Biofilms can either have positive or negative effects on their environment. The undesirable effects of biofilm activity lead to biofouling of industrial systems, promoting the growth of harmful bacteria, and contributing to the formation of dental plaque. For many bacterial species, the formation of biofilms is caused by the activation of bacterial communication mechanisms, in particular, quorum sensing. Quorum sensing is realized via special chemical signals called autoinducers. These signaling molecules are produced by bacterial cells and diffuse through the surrounding environment. As the bacterial population grows and the concentration of autoinducers increases, the cells are able to sense the presence of other cells and coordinate their behavior accordingly. In other words, quorum sensing allows bacteria to “count” the number of cells in their immediate vicinity and respond in a collective manner to changes in population density. This coordinated behavior is often critical for the survival and success of bacterial communities, such as biofilms, which rely on the collective actions of individual cells for their growth and maintenance [
9,
10].
Controlling the evolution of bacterial biofilms is one of the most important problems in the biotech industry and medicine. In biological experiments, an environment for biofilm formation is created to control and monitor its growth and architecture [
11]. As noted by many studies, most bacterial biofilms are formed as complex self-similar structures. The geometric configurations of specific bacterial species are characterized by a certain set of patterns, the density of which is largely determined by the conditions for maintaining vital activity: the level of nutrition, oxygen, the removal of metabolic products, etc. [
12,
13].
Taking into consideration the importance of controlling bacterial biofilms, they have become the objects of interdisciplinary research. The most important areas are presented by the modeling of biomass growth (density and rate of progress) [
14,
15,
16,
17,
18,
19,
20], the mechanisms of regulation of key chemical compounds related to the quorum sensing [
21,
22,
23,
24,
25,
26,
27,
28], and the study of the geometric characteristics of the complex morphology of the observed structures [
29,
30,
31].
Modeling of bacterial biomass evolution refers to the process of developing mathematical models to describe the behavior of microorganisms, including growth, metabolism, and interactions with the environment. There are various methods used for microbial modeling including deterministic, stochastic, and agent-based approaches [
32].
Mostly, deterministic models describe the behavior of microorganisms with the use of differential and integral calculus. Differential models are often applied to simulate the growth of microorganisms under different conditions, such as temperature, pH, and nutrient availability. For example, the fundamental Monod approach describes the growth of microorganisms based on their nutrient uptake rates [
33]. The model of biofilm growth supplemented by the Navier–Stokes equations describing the motion of fluids has been reported in [
34] to account for the growth and decay of microbial populations in response to nutrient availability and other environmental factors. Mathematical models formalized by partial differential equations have been used to simulate the surface growth of biofilms [
35] and the influence of antimicrobial agents [
36].
Stochastic models describe the behavior of microorganisms using probabilistic methods. These models are useful for studying the variability and randomness in microbial behavior, such as the probability of mutations or the distribution of metabolic pathways in a population. Examples of stochastic models include the Gillespie algorithm and the Markov chain Monte-Carlo method [
37].
Individual-based models allow us to simulate the behavior of individual microorganisms and their interactions with each other and their environment. These models can be applied to explore the emergent behavior of microbial populations, such as the formation of biofilms or the spread of infectious diseases. Individual-based and cellular automaton models are typical representatives of this research direction [
38]. In particular, cellular automata have been proposed to simulate the growth of biofilms on a surface [
39], evolution, and antibiotic resistance of bacterial populations in heterogeneous environments [
40]. In such a class of models, interactions between agents and the environment are defined by a set of rules and parameters. Hybrid models are based on a combination of various approaches [
41]. The stochastic particle-based model has been formalized in combination with the partial differential equations to describe the distribution of cell density and activity within the biofilm [
42].
Nevertheless, developing a general framework for modeling the evolution of biological films has not been completed yet. This is explained by the fact that the simulated systems are difficult to formalize and differ in the heterogeneity of the biochemical composition, the diversity of the genetic material, and the impact of self-organization, which is promoted due to the packed and dense structure. For this reason, modifications to current approaches continue to be developed to create the most appropriate models describing the dynamics of biofilm formation, with self-similar complex geometries and growth characteristics observed in biological experiments.
The classical cellular automaton was proposed in [
39] for modeling the formation of a bacterial film from the point of view of formalizing the rules of “life” of a discrete structure. The authors formalized numerous processes that accompany the formation of bacterial structures (birth, division, erosion, death) to give realistic scenarios for the evolution of the biosystem. In this case, the effect of nutrients is taken into account solely depending on the distance to the surface of the biofilm (biofilm front) and the complex formalization of the algorithm involves the consideration of rather small lattices.
Computational fluid dynamics has been considered to describe the flow and transport of substances in the liquid phase [
43,
44]. Furthermore, a particle-based method has been applied to model biofilm structuring and evolution. The original algorithm can be interpreted as a numerical solution of a differential problem for a discrete region, each element of which represents a fragment of the biofilm structure. Using the introduced discrete-dynamic structure (classified as a cellular automaton), both the behavior of biomass and the evolution of nutrients have been investigated. The control parameters of the biosystem are introduced, which determine the adequacy of the model to actually observed processes. In this model, only one component of the nutrient has been considered and a mechanism for calculating the diffusing substance has been based on a numerical approach, which significantly complicates the calculations and deprives the model of the advantages of parallelizing cellular automata. In addition, the porosity of the structure has not been examined.
Hence, there is previous evidence for mechanisms underlying mathematical models in the aspect of specification of nutrient and biomass concentrations. However, no studies intended for this field of study have yielded rather simple rules for cellular automation for elementary cells with complex geometry that can provide realistically visualized structures.
The present study is dedicated to creating the research framework of mathematical modeling of the bacterial communication process, which, in turn, results in the formation of dense self-similar biofilm structures. In our previous works [
24,
25,
26,
27,
28] various modifications of the bacterial communication model were proposed with the use of a simplified formalization of the spatio-temporal dynamics of bacterial populations based on approximating dependencies. In this field of study, the formalization of the spatial evolution of bacterial populations is an important subproblem. One of the promising directions in this area is to use a cellular automaton with an optimal set of control parameters that provides realistic simulations but stays focused on the the main phases of bacterial growth to be controlled. Moreover, a challenging problem that arises in this domain is to exploit biofilms with desired porosity. The latter requires finding out the crossover from fractal aggregates at low density to homogeneous ones at high density. Hence, the aim of the current study was to develop an effective cellular automaton algorithm based on simple rules for realistic scenario modeling of the spatial evolution of biofilm-forming bacterial populations and specifying geometric characteristics of visualized self-similar biofilm bacterial structures. The contributions of this work are the following: the algorithm design and software development for the operation of a cellular automaton were proposed to simulate the spatial self-similar evolution in bacterial biofilm populations with numerical assessments of porosity for visualized fractal aggregates. The main improvement of the novel approach concerns the hybrid modeling of self-similar evolution in bacterial biofilms based on the combination of rather simple rules for the cellular automaton, the computation of the diffusion characteristics of biomass and nutrients. The truncated octahedron cells used here allow one to simulate the growth reflecting more realistically the fractal geometry of the boundaries.
The main part of the paper is organized as follows. The concise conceptualization of the problem, the geometry of the grid, and cellular automation rules are presented in
Section 2.
Section 3 focuses on the programming algorithm. Finally, the results of the simulation of biofilm evolution and fractal analysis of the complex structure of biofilm are discussed in
Section 4.
2. Cellular Automaton Model: Problem Formalization and Computational Techniques
As a first step, we aim at designing a three-dimensional cellular automaton to model the self-similar evolution in biofilm-forming bacterial populations. Let us formalize the main principles of how the cellular automaton operates, which include model conceptualization, initialization of the lattice geometry, and setting transition rules.
2.1. The Brief Biological Setup
In general, most free-living bacteria can attach to biotic or abiotic surfaces. This leads to the formation of organized complex three-dimensional multicellular communities of aggregated cells encased into an extracellular polymeric matrix (EPS), known as biofilms. Biofilms are formed by specific substances: organic microbial polymers implicated in the association of bacterial cells with their environment. Its formation includes several stages [
45], the most important ones are shown in
Figure 1.
In the first stage, individual planktonic cells migrate and attach to a substrate. Provided vital conditions, many co-adhered bacteria form microcolonies and then induce biofilm production by physical appendages and EPS. In the next stage, the growth of bacterial populations is accompanied by immersion in EPS secreted by the cells themselves, providing the necessary conditions for biofilm maturation and progress. Finally, the fully mature biofilm reaches its maximum cell density and can release microcolonies or single cells which can freely migrate and adhere to new locations.
The production of EPS plays a crucial role for the survival of biofilms. In addition to water, the EPS consists of different concentrations of lipids, proteins, minerals, extracellular-DNA, and polysaccharides. Apart from providing surface attachment, it plays an integral role in structural support, nutrition delivery, protection against the host immune system, and antimicrobial treatment. EPS may also support cell-to-cell bacterial communication, in particular by quorum sensing [
46].
Modulation of quorum sensing allows bacteria to respond to external exposure, coordinate virulence phenotypes, and provide optimal population density in biofilm.
The development and maturation of biofilms occur under physiologically relevant living conditions, including the type of strain, chemical-physical properties of the surface, temperature, nutrient availability (nutrient-rich or nutrient-limited media), water flow rate, removal of metabolic products, oxygen concentrations (for aerobic bacteria), growth media and the presence of other microorganisms, etc. (a more detailed discussion of the conditions and biological processes related to biofilm growth can be found in [
47] and references therein).
In order to model the evolution of biofilms, in particular cases, concepts related to death and living conditions need to be defined and formalized. In the present study, we assume biofilm development under the following conditions: biofilm development is considered in a limited computation domain corresponding to the media supplemented by a nutrient. In the beginning, individual bacterial cells can be randomly inoculated. The chemical composition of the nutrient solution is assumed to be represented by oxygen (in short notation
), a carbon-containing component (named as the
C-component), and a nitrogen-containing component (named as the
N-component) (here we consider most relevant nutrient components according to [
48]). During the evolution of the biofilm, all nutrient components diffuse at different rates. In addition,
,
C-component, and
N-component underlie different absorption rates by bacteria.
The total nutrient concentration is limited and controlled. Here, we assume to consider the growth phase due to nutrient consumption (the lifetime of bacteria is longer than the time the evolutionary process is considered). Bacteria can divide provided the sufficient consumption of
,
C-component, and
N-component. Moreover, we included a simplest quorum sensing-regulated mechanism for optimal nutrient redistribution. If a bacterial cell cannot divide due to lack of free space for bacteria to grow, it can share its nutrients with neighboring cells. There are no inhibitory factors (such as high temperatures, radiation, antibiotic treatment, etc.) In the process of modeling, it is also required to control the porosity and geometric structure of the visualized biofilm. The scenario for culturing the biosystem is depicted in
Figure 2.
2.2. Grid Geometry
Generally, a cellular automaton model can be classified as a discrete spatio-temporal mathematical model that allows to describe many complex systems with discrete dynamics, approximating continuous processes. In the cellular automaton approach, each discrete element can be characterized by a state and all possible states are finite and discrete. A cellular automaton features a grid of cells that change their state handled by the rules of local evolution.
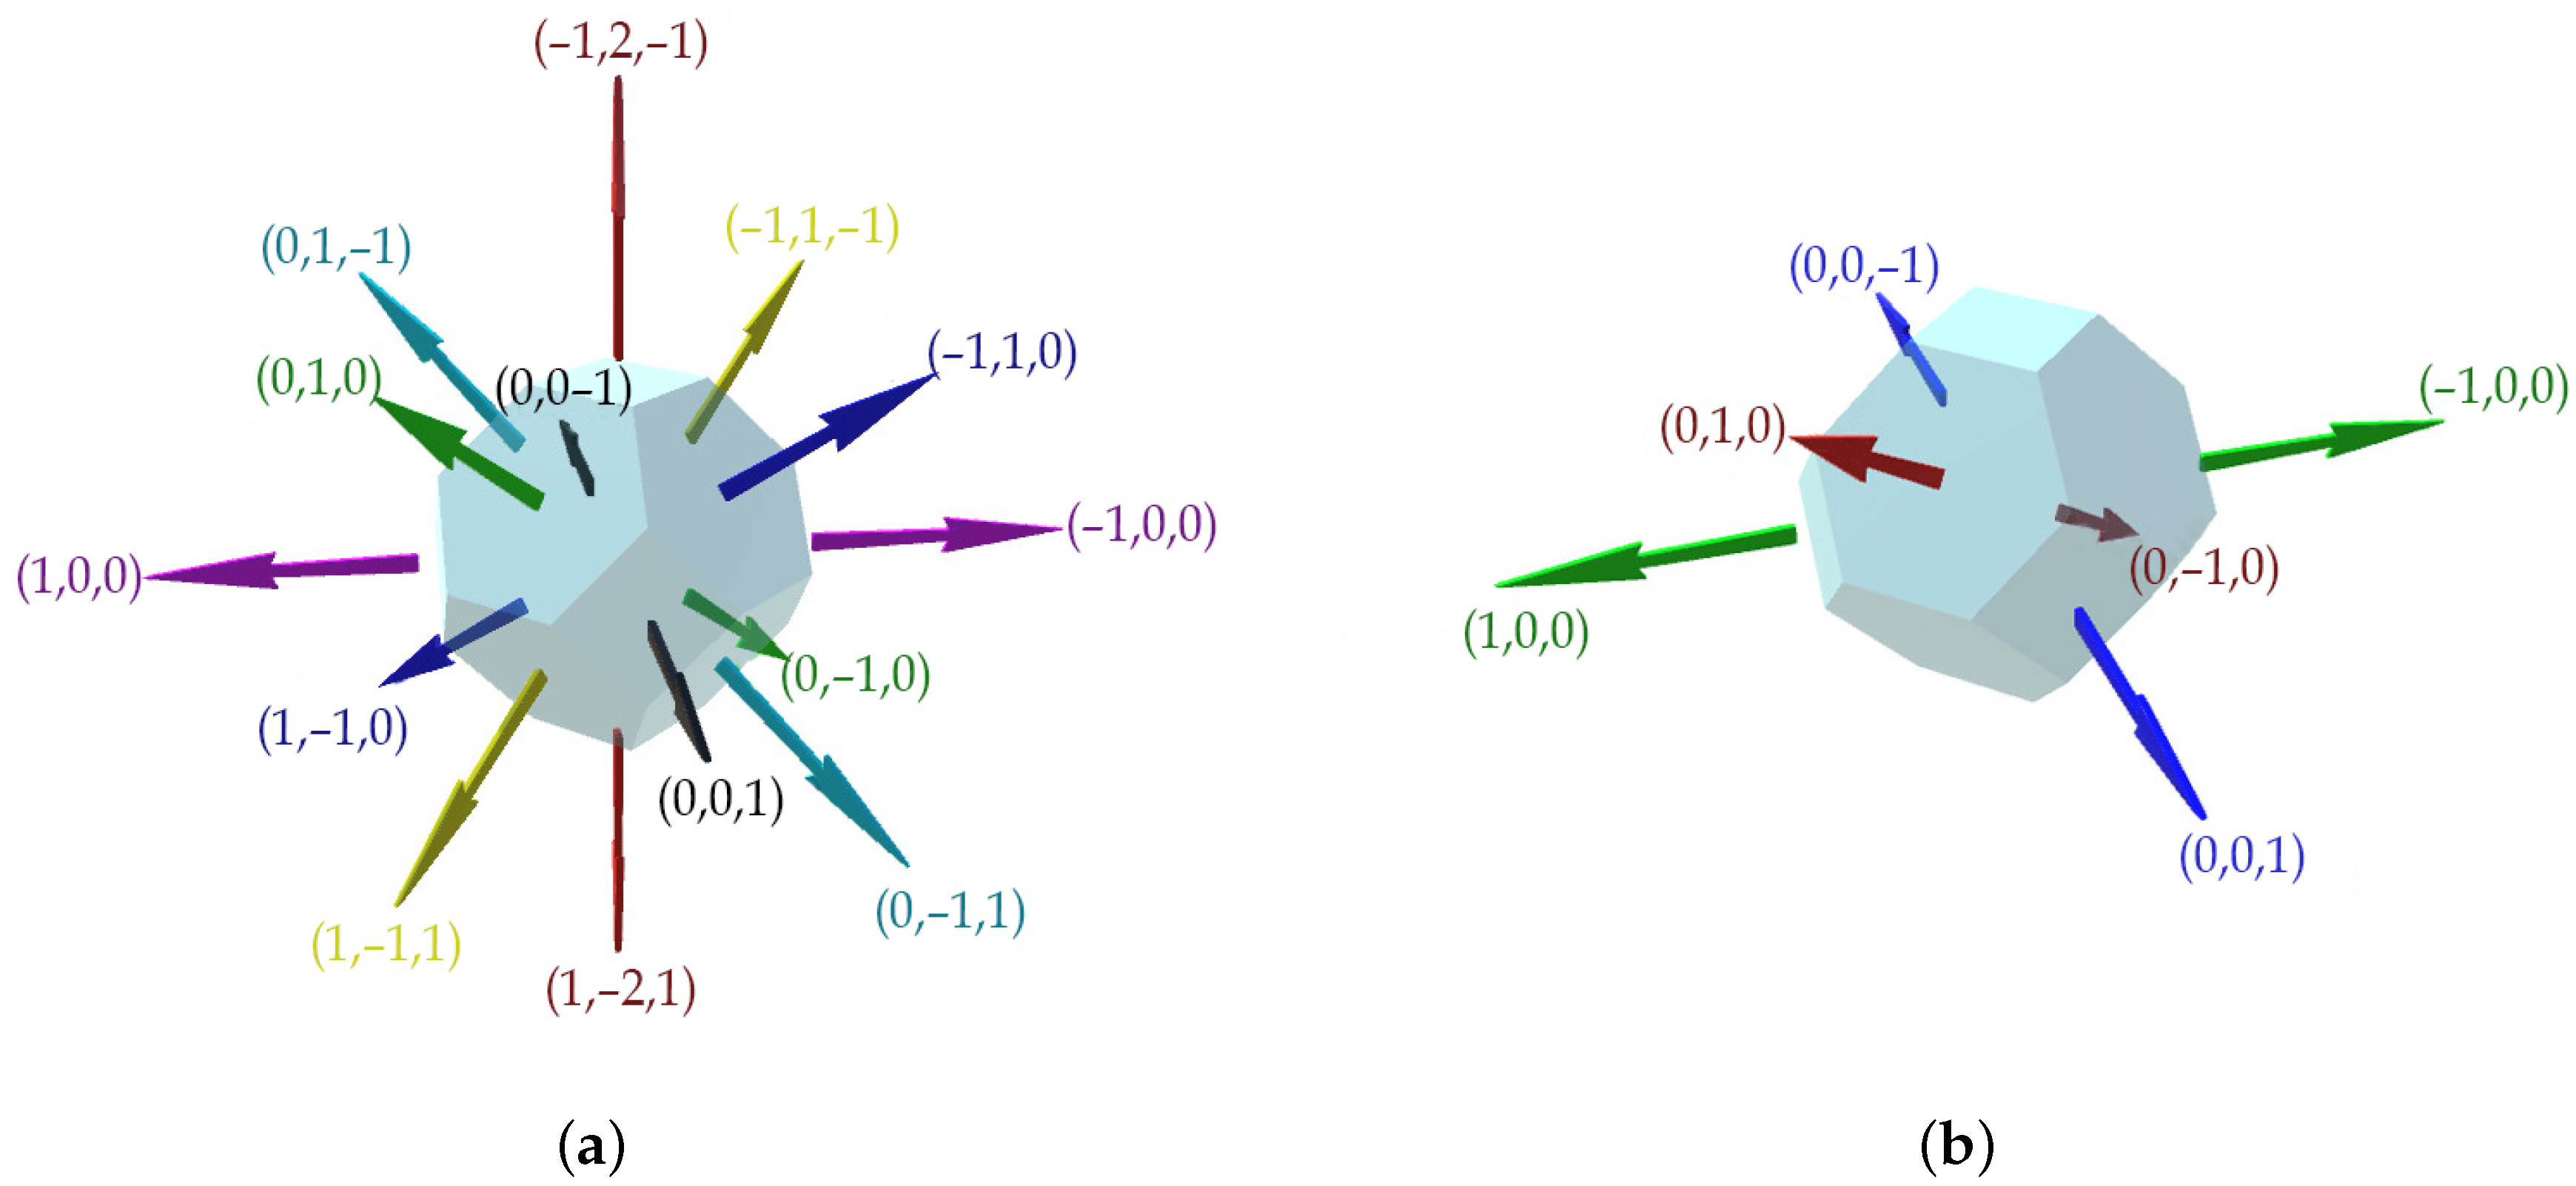
To define the shape of the basic cells of the constructed 3D cellular automaton, we use truncated octahedrons. A truncated octahedron, unlike a cube with just six faces in its vicinity, offers 14 neighboring faces, allowing for more accurate modeling of processes at a discrete level. The truncated octahedron cell possesses symmetry with respect to the center. This type of cell provides a complete covering of the 3D space. In addition, the increase in neighbors for each cell allows us to more accurately model the behavior of the discrete system. Basically, this cell obtains a total of 14 faces, six squares, and eight hexagons. Hence, each cell has 14 neighbors, including eight diagonal and six orthogonal neighbors. We take four horizontal and two diagonal vectors as basis vectors,
as schematically illustrated in
Figure 3. We define the rules for transitioning from an element with an index [
i,
j,
k] to Cartesian space.
2.3. Cellular Automaton, State Changing Rules, and Boundary Conditions
According to the biological context, the term “cell” has a double meaning. In this way, we use the term “unit” instead of specifying the nodes in the grid of a cellular automaton. Additionally, the term “cell” is going to be associated with bacterial cells (concretely, “cell” is related to the populated “unit”). In the model being discussed, we have not specifically accounted for the inclusion of the EPS matrix to simplify the whole setup and its analysis. We assume that bacterial cells are already embedded in it and we do not consider its secretion beyond this assumption. We will assume that a unit of a cellular automaton corresponds to a certain amount of biomass and corresponds to a set of bacterial cells. Let us consider the dynamic finite cellular automaton, which is formalized by the triple of objects:
where
X is the set of units of the automaton;
A is a finite set of unit states;
is a set of transition operators between different unit states, depending on the configuration of the units.
We define the set of units
X as follows:
Therefore, the set of units is indexed along the basis axes.
l denotes the length of the computational domain,
w the width, and
h is the height. The finite set of unit states is specified as:
Each unit of the grid is characterized by a bacterial biomass concentration and a nutrient concentration. Here, we denote the oxygen concentration as , the concentration of carbon-containing component as , and the concentration of nitrogen-containing component as . At the initialization phase, the values of , and are set to the initial values , and , respectively, for each unit. At the start, values of the bacterial biomass concentration are equal to zero for each unit of the grid apart from randomly defined units at the bottom of the computation domain, for which we inoculated bacterial cells with the initial value . Due to the presence of shared faces with each neighboring element (unlike the diagonal neighbors of a cube), we have made the assumption of a uniform diffusion in all directions, regardless of the specific direction. However, it is important to note that recalculating diffusion based on the presence of bacterial biomass within cells complicates the calculation process. Nevertheless, this adjustment does not result in a qualitative change in the model’s behavior. For simplicity, this factor was not incorporated into consideration.
The set of transition operators between different unit states can be defined as follows:
where
,
,
are the transition operators related to mass-balance operators to define corresponding nutrient concentrations;
is the transition operator for nutrient consumption by a bacterial cell;
is the transition operator to specify biomass division.
In order to keep the mass balance of nutrients, Fick’s law can be applied to express a spatial-temporal distribution of the nutrient concentration. For specific nutrient components, we can use the following general diffusion equation:
where the general notation
is related to the
concentration
,
C-component concentration
or the
N-component concentration
;
D is the diffusion coefficient defined as
,
,
, respectively.
Further, we use Equation (
6) to estimate the concentrations of nutrient components by the following rules for the cellular automaton:
where
is a
m-th neighbor of the unit at the iteration which corresponds to the time
t;
M is the total number of neighbors around the unit.
The recalculation of biomass and nutrient concentrations is done using the following rules:
where
are the uptake rates of nutrient concentrations by bacteria;
(known as the Michaelis constant) is the maximum specific growth rate of the microorganism and
is the calculated growth rate of bacterial cell in considered unit.
The rule used to define the biomass division is followed by:
where
are coordinates for the new populated cell, which is neighboring the origin cell
(the position of a new cell is selected randomly from the available set of positions).
This rule is implemented only for cells, which fits the following conditions:
This implementation is possible for cells with a sufficiently high biomass concentration and if it has a free neighbor .
Further, we apply the Monod equation to calculate the uptake concentration of nutrients for each cell. In order to consider multiple types of nutrients, we rewrite the Monod equation in a suitable form according to [
49]. Here, for
the form of equation remains the same, but on the other hand, it becomes a valuable multiplier for nitrogen and carbon concentrations. This effect could be explained by the importance of oxygen in almost all kinds of reactions within the considered nutrients.
where
,
and
are the saturation constants for each type of substrate, respectively;
is the growth rate for the considered cell.
By model construction, we suppose here that boundaries are considerably distant from the active area and do not affect the processes in the computational domain. Therefore, their influence was not taken into account. During the calculation process, all grid units are updated synchronously.
3. Programming Algorithm
Following the previous statement, let us formalize the developed algorithm and determine the control parameters of the model. The process flow diagram illustrates the life-cycle stages and unit processes as shown in
Figure 4.
The algorithm consists of two blocks: the main program block and the calculation loop for the corresponding cell. The main program block begins with grid generation and setting initial nutrient values. Then, bacterial cells are inoculated at the bottom of the computational domain. After that, the loop through all cells executes and for each unit, the diffusion of nutrients and consumption of nutrients are estimated. For populated units, we calculate consumed nutrients and specify the possibility of division. Then, the nutrient level is examined to make a decision to continue computing. If the average value of nutrients reaches a certain threshold, the program terminates itself.
The calculation loop for each unit includes the following steps. We skip the unit if it has not been yet populated with bacterial cells. For a populated unit, we calculate the concentration value of consumed nutrients of each type. Further, the amount of biomass in the cell is increased. If this value reaches the required level and there is free space adjacent to the cell, the specified cell divides in a direction which is randomly selected from the available ones. If there is no free space around the cell, excess nutrients are redistributed among neighbors of the cell. The process of redistribution occurs in all directions, proportional to the concentration of bacteria in neighboring cells, where the biomass concentration is lower than the current concentration.
We executed the proposed algorithm using the C # language on the Unity platform. Unity is a real-time 3D development platform for building 2D and 3D applications, such as games and simulations with the use of .NET and the C # programming language. The 3D model involves a large amount of data and its processing. However, cellular automata can be parallelized due to their independent computational units (each cell depends solely on its nearest neighbors). In the context of the C # language, built-in parallelization features such as Parallel. For and Parallel. For Each can be utilized. However, to avoid simultaneous access, the use of lock objects is also recommended. This approach allows us to improve the algorithm performance, specifically, to simulate diffusion processes. This results in a speedup of approximately 30–40% in execution time.
To store information about all cells containing biomass, a Generic.List structure was used. In a loop iteration, each cell, upon reaching a sufficient biomass concentration level, searches for an available neighbor for division. If multiple neighbors are available, it randomly selects one, increases the biomass concentration in the designated cell, and adds the new cell to the list of new cells. After iterating through all cells, the new cells are rendered and added to the master list, while the list of new cells is cleared. This approach helps to avoid the issue of continuous calculation of new cells and prevents program looping. The simulation system efficiently supports the forecasting of space-time distributions of bacterial populations in biofilms and evaluating geometrical characteristics of surface roughness. The functionality of the software implementation was enhanced with a user interface.
4. Computational Experiments and Discussion
In this section, we will focus on conducting computational experiments to explore the dependence of the geometrical complexity of the structures forming a biofilm on the parameters of the cellular automaton model. In these terms, we specify a set of parameters that affect the spatial-temporal distributions of bacterial biomass. To solve the diffusion problems (modeling of nutrient distribution and consumption), dimensional parameters are used, while for a computer simulation of growth, relative units are applied. The time unit corresponds to the iteration number and the space unit is associated with the specific cellular automaton non-dimensional normalized unit (called “CA unit”). The issue of correlating real-time with a computer iterative process requires additional investigations because the rates of successive stages of biofilm development may differ.
The model parameters are listed in
Table 1. It should be noted that most of these parameters are not fixed and strongly depend on the conditions of the considered environment, such as temperature, liquid viscosity, bacterial species, etc. We will assume that the growth of the bacterial film is carried out in the aquatic environment. The values of the absorption parameters for the considered nutrients are defined using the data reported in detail in [
50]. Note also that carbon and nitrogen nutrients are not free agents. These nutrients are components of more complex compounds, such as nitrate (NO
-N), ammonium (NH
-N), dissolved organic carbon, particulate organic matter, methane (CH
), and other molecules. Diffusion coefficients for these nutrients have been extensively discussed [
51,
52,
53]. The initial level of nutrients in the environment is the primary control parameter of the model. For convenience in calculations, all control parameters are normalized, with the normal value represented in the table as the unit. Subsequently, nutrient levels were both decreased (0.25 of the normal value) and increased to explore different situations concerning growth possibilities and bacterial colony behavior.
The cellular automaton model allows us to simulate the spatial self-similar evolution in bacterial biofilm populations.
Figure 5 shows the computer simulation results of bacterial biofilm formation at fixed time moments. Computations are performed using the defined above parameters. Notably, the numerical experiment was conducted under the conditions of moderately saturated nutrients (here we assume a 70 percent level of all nutrient components related to the initial data). The simulated biofilm can be characterized by a porous fractal structure and, after 4000 iterations, it occupies the entire area of the computational domain.
In order to qualitatively compare the results of simulation based on a cellular automaton with experimental data, we simulated the bacterial population dynamics during the observation time of biofilm growth to the saturation stage.
Figure 6 illustrates the calculation result of the population dynamics curve in qualitative comparison with a typical curve of population dynamics reported in [
54] for aerobic bacterium
Pseudomonas aeruginosa. The simulation parameters are adjusted to provide logistic growth under continuous cultural conditions (nutrients are sufficient during the observation time). These data suggest that the model adequately reflects the main periods of development of the bacterial population, corresponding to the phases of population dynamics: the lag-phase of slow growth at the beginning of the process, the log-phase of rapid growth, and the stationary phase (during flow cultivation, the degradation phase is absent on the evolutionary curve). The conducted comparative analysis yields agreeable simulation data and experimental data, which is in favor of the adequacy of the designed algorithm.
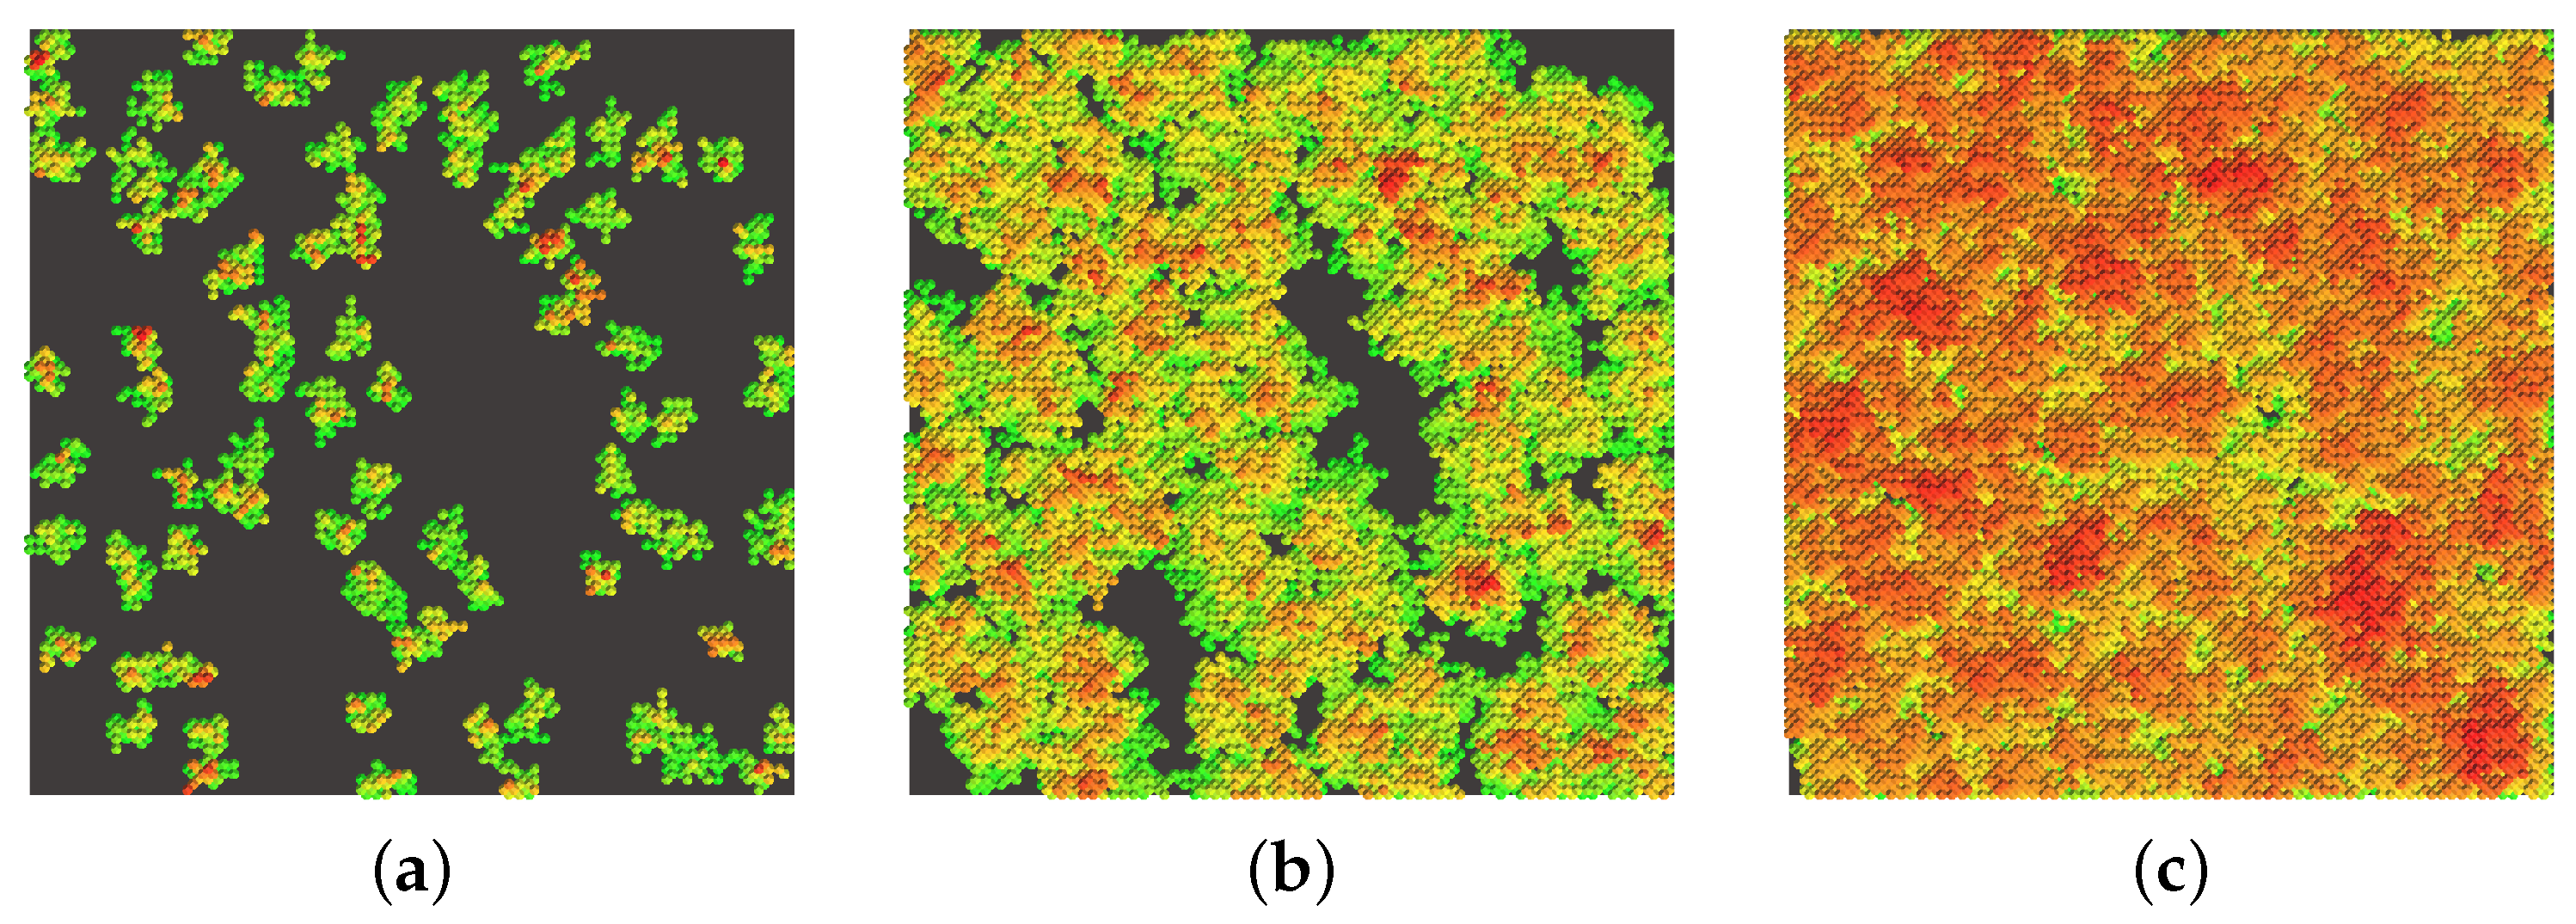
In general, the developed algorithm allows us to visualize complex bacterial structures by varying the input parameters of nutrient levels as shown in
Figure 7. All images are referred to the final time moment (
= 19,000) corresponding to the stationary mode.
To be more concrete, here we can detect geometric features of visualized self-similar bacterial biofilm structures related to the percent level of nutrients. The parameters listed in
Table 1 are associated with the 100 percent level of nutrients, while for simulations represented in
Figure 7 we varied the percent level under the range of 25–150% related to the initial value. The images on the left are 3D renderings of the results, and on the right are slices with a width of 5 CA units along the entire length of the computational domain. The observations indicate that at the low level of nutrients, the biofilm takes on an extremely sparse and discharged structure due to nutrient deficiencies. At the same time, at the high level of nutrients, porosity decreases significantly.
The main control parameters of the model responsible for the shaping the structure’s flatness are the power components. We conducted a comprehensive study to investigate the influence of each nutritional component on the geometrical plane of structures. Initially, with sufficient nutrition, the bacterial film completely covers the space. However, as the nutritional components decrease, a dendrite-like structure appears, characterized by a more complex surface geometry. In case of lower initial nutrient values, the biofilm develops less densely, displaying either dendrite growth for small grid sizes or the formation of small clusters within it. These findings are consistent with the data presented in the study [
43,
44].
To mathematically characterize the complexity of the geometric configurations, we used the Hausdorff fractal dimension. For instance, to estimate the fractal dimensions of simulated biofilm structures, we applied the box-counting method. As the most important advantage of this methodology, we note the comparative simplicity of the implementation of the algorithm and the sufficient level of approbation in practice of such assessments by independent researchers. In general, there are many variations in the application of the box-counting method. We calculated the fractal dimension of the biofilm surface area, including the pore surface area. The entire boundary surface was covered with a spatial grid consisting of cells of a certain size , and the number of coating elements N was counted. The dependence constructed on a double logarithmic scale lnln allows one to calculate the fractal dimension .
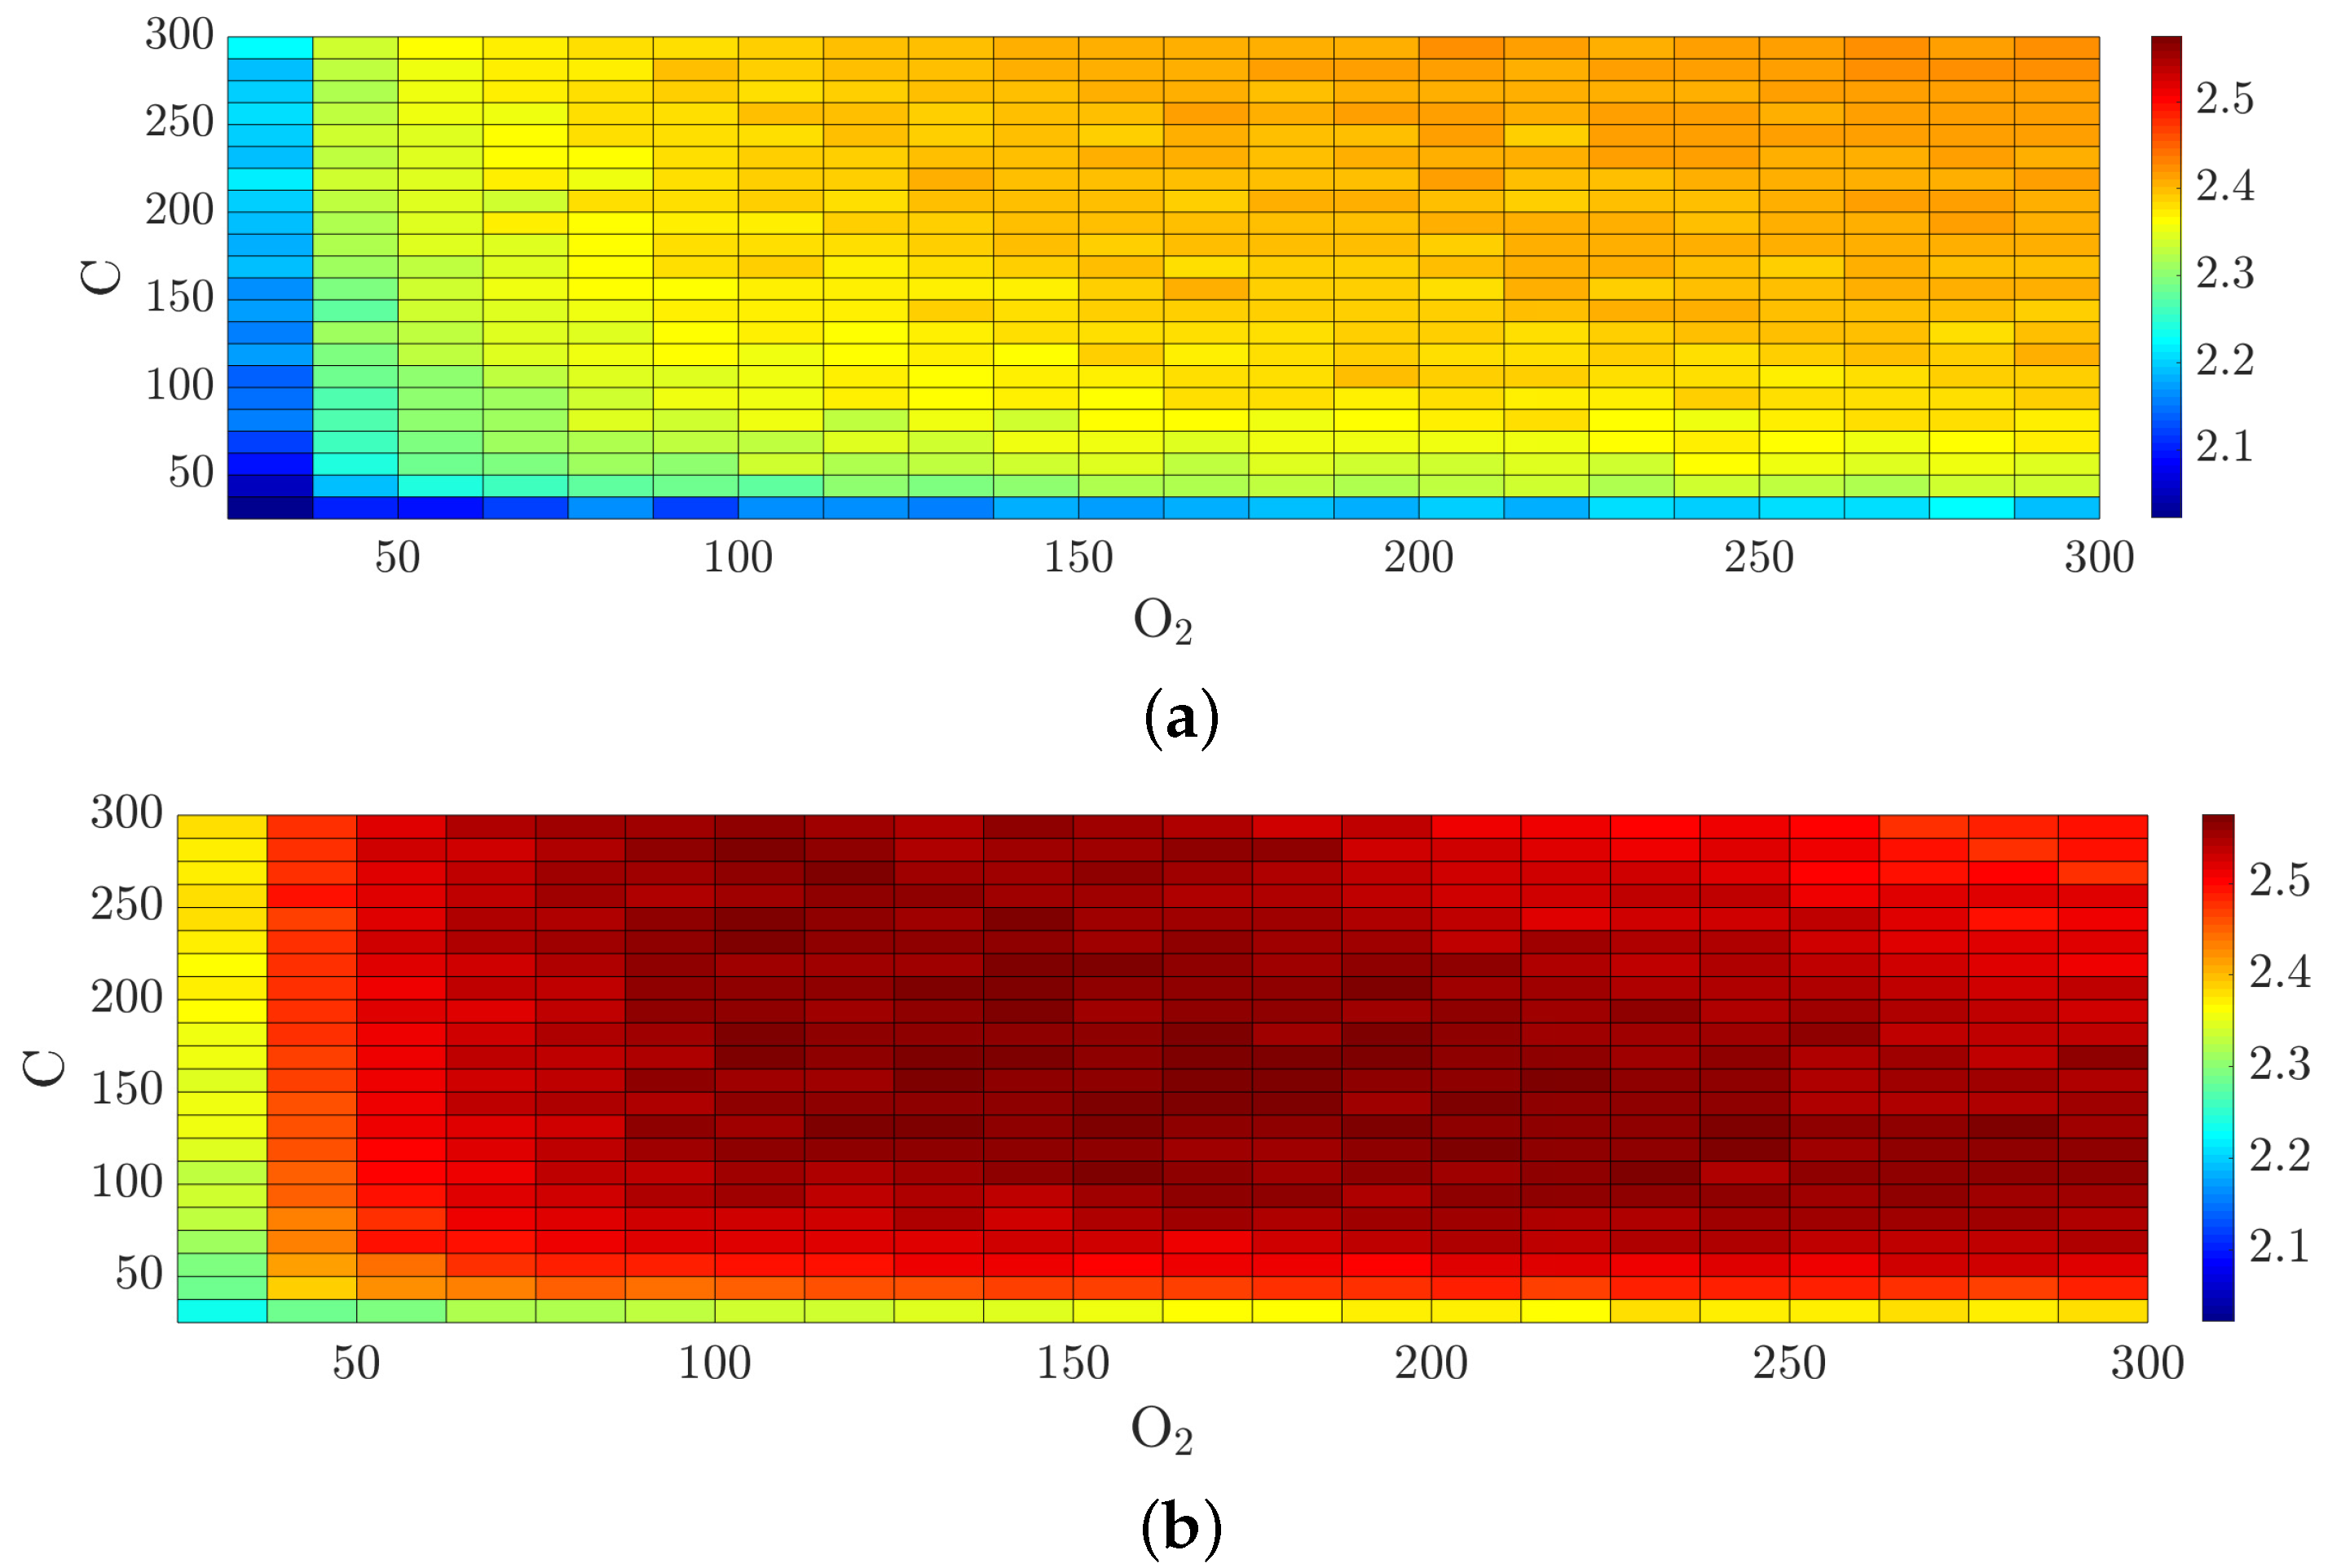
To assess changes in the irregularity and roughness of the simulated biofilm structures, we calculated the fractal dimension under the variation of the level of nutrients. Due to the fact that the parameters of carbon and nitrogen are not fundamentally different in the equations considered, the variation is performed for oxygen and carbon, while the nitrogen value remains either too high or too low. The computing results are visualized in
Figure 8.
Our observations suggest that surfaces of biofilm structures can be characterized by rather uncomplicated geometry at very low and very high values of nutrients, compared to the standard setting. It is clear that underdeveloped small-scale “island” structures are formed at a low level of nutrient. On the other hand, the conditions of high values of nutrients lead to filling the entire space provided and the degeneration of the structure, in which the number of pores is small and the surface is practically uniform.
It should be noted that our simulation data are in qualitative agreement with the data obtained by [
41] for a certain set of parameters. The visualized shape of the geometry of the biofilm configurations coincides. Notably, in [
41] a complex parameter has been introduced which includes several biological parameters at once (the overall change is not transparent to establish the control parameters responsible for the complexity of the structure). In our case, we can vary the parameters separately and we have focused on studying the dependence of complexity of biofilm geometry on nutrient levels. In addition, visualized two-dimensional slices allow us to clearly demonstrate the fractality of the biofilm structure.
The complex geometric configurations of biofilms occur at a certain nutrient deficiency. At the 500 percent nutrient level of the N-component, each cut for fixed oxygen- or carbon-contained components has a pronounced maximum. For example, for 162.5 percent nutrient levels of the O-component as well as the C-component. Increasing the percent level for the C-component to 300 gives only while increasing the percent level for the O-component to 300 yields . A further increase in the value of nutrients will not lead to a complication of the structure. The rise of the fractal dimension is related to the development of dendrite structures with increased porosity. The biofilm surface as well as the structure of pours are characterized by inhomogeneity and roughness of boundaries. Bacterial colonies, trying to get additional nutrients, tend to increase their surface area. The designed algorithm provides accurate simulations of self-similar biofilm structures due to the introduced mechanism of “motivation” of bacterial colonies to obtain the maximum value of nutrients at the current population density.
Since any model is incomplete by definition, let us point out some limitations of the developed approach. The model contains a large number of parameters, which limits the possibility of their simultaneous variation. With limited nutrition, growth retardation occurs, which leads to an increase in simulation time or the need to stop simulation. In addition, for perspective, the algorithm for solving diffusion problems for already occupied cells can be improved by taking into account the cell state, the list of considered processes can also be expanded, and gratings of different sizes can be used for near and far zones to speed up computational processes.
5. Conclusions
In summary, we have developed a cellular automaton algorithm to model the self-similar evolution in biofilm-forming bacterial populations. The cellular automaton grid was constructed using truncated octahedron cells to provide a realistic scenario for the simulations, incorporating increased inner cell relations. The algorithm design included natural-based rules such as nutrient diffusion, biomass consumption of nutrients, and bacterial cell division. The algorithms was implemented using C # on the Unity platform. Three typical phases of the bacterial population evolution could be observed: a slow growth phase (lag phase), a fast growth phase (log phase), and a stationary phase.
The nutrient components and their values played the role as key control model parameters. The simulation results indicated that biofilm structures exhibit a rather uncomplicated geometry at both too low and too high too-low nutrient values. Furthermore, dendrite-like structures with increased porosity were observed under certain nutrient deficiency conditions.
For self-organizing structures, such as evolving biofilms, it is important to know not only the area and volume of overgrowth but also the scaling characteristics of fractal aggregates. Therefore, computer-assisted modeling allows us to establish a numerical relationship between the geometric characteristics of structures and nutrient levels, which is essential for controlling growth phenomena in biofilms, particularly concerning pathogenic bacteria. The main advantage of our study compared to previous findings in applied mathematics in microbiology lies in the developed hybrid 3D model suitable for aerobic bacteria capable of forming complex biofilm structures with different porosity at different levels of nutrients due to self-regulation processes. The mathematical foundation of the proposed model comprises the cellular automaton with a truncated octahedron cell, modified rules for calculating local diffusion characteristics, and the procedure to redistribute nutrients among bacterial cells.
Furthermore, it is worth noting that the cellular automaton model was supplemented by only one simple mechanism to formalize the relation to bacterial quorum sensing, here concretely the optimal nutrient and oxygen redistribution. The prospect for further research involves the development of a hybrid approach incorporating more complex laws governing bacterial cell-to-cell communication in the algorithm.


