Article

Predictive Suspension Algorithm for Land Vehicles over Deterministic Topography

Department of Mechanical Engineering, Universidad Carlos III de Madrid, 28911 Leganes, Spain
*
Author to whom correspondence should be addressed.
Mathematics 2022, 10(9), 1467; https://doi.org/10.3390/math10091467
Submission received: 28 March 2022 / Revised: 22 April 2022 / Accepted: 25 April 2022 / Published: 27 April 2022
(This article belongs to the Special Issue Applied Mathematics to Mechanisms and Machines)

Abstract

:
A good suspension system is mandatory for ensuring stability, comfort and safety in land vehicles; therefore, advanced semi and fully active suspension systems have been developed along with their associated management strategies to overcome the limitations of passive suspensions. This paper presents a suspension algorithm for land vehicles traveling through a deterministic topography. The kinematics of a half-vehicle model and the algorithm are implemented in Simulink. The algorithm’s inputs are the measurements provided by a position scanner located on the front wheel of the vehicle. Based on this input, the algorithm reconstructs the topography in real-time and sends the corresponding command to an actuator located on the rear wheel to compensate for the irregularities of the terrain. The actuation is governed by the parameter “D”, which represents the distance over which the algorithm averages the height of the terrain. Two ground profiles were tested and sensitivity analysis of the parameter “D” was performed. Results show that larger values of “D” usually yield less vibration on the actuated mass, but this value also depends on the irregularities of the terrain.

1. Introduction

Suspension is an essential system for land vehicles to ensure their stability, comfort and safety; however, increasing the vehicle stability usually results in a worsening of comfort and vice versa [1,2]. In an attempt to improve both stability and comfort, semi-active and active suspensions and their corresponding management strategies have been developed in recent years.
Suspension systems can be classified into three types according to their operation: passive, semi-active and active.
The fundamental elements of passive suspensions are springs, dampers and the required rigid links to connect the sprung and unsprung masses. In this kind of suspension, the parameters of springs and dampers are fixed; therefore, the dynamic response of the system is fixed too. The design of these suspensions must achieve a trade-off solution for different conditions due to the different surfaces the vehicle travels through; however, non-linear springs [3,4], non-linear dampers [5] and hydro–gas rotary suspension systems [6] have been used in land vehicles to obtain better response over the widest possible range of conditions.
Semi-active suspensions can adjust the parameters of passive suspensions, but the generated forces will always be dependent on the speed of the damper [7]. Hence, semi-active suspensions are not able to control ride height, roll or pitch angles. Nonetheless, their simplicity requires less power consumption than fully active suspensions and can be implemented easily:
  • The stiffness of semi-active suspensions is modified by using magnetorheological dampers within a specific mechanism [8] or by governing smart air springs [9].
  • Variable damping is the most common strategy in the development of semi-active suspensions, having different solutions:
    Hydraulic dampers with electrically controlled valves for adjusting the fluid flow rate from one chamber to the other [10].
    Magnetorheological [11] and electrorheological [12,13] dampers are similar to hydraulic dampers but they contain a magnetorheological or electrorheological fluid. This fluid, usually non-Newtonian, reacts to the application of magnetic or electrical fields and changes the properties of the damper. The use of these devices is widely spread in road and rail vehicles [14,15,16].
    Electromagnetic dampers take advantage of the known interaction between a moving coil and the magnetic field generated by a permanent magnet or electromagnet to generate a damping effect [17]. Karnopp studies the use of permanent magnet linear motors as variable mechanical dampers for vehicle suspensions [18].
  • The third component of suspension systems, inertia, is modified through a variable inerter. The inerter is a mechanical device in which the force applied is proportional to the relative accelerations between the two terminals of the device [19]. These systems have been proposed to improve the comfort of rail vehicles [20].
Active suspensions allow full management of the suspension motion, as the actuator force is independent of the speed direction. On the other hand, the main disadvantage of these suspension types is the high energy consumption that they require. The devices used in these suspension systems are, typically:
  • Electromechanical actuators can use an electric motor attached to a mechanism that converts rotary motion into linear motion [21] or can use linear motors [22].
  • Hydraulic actuators require the installation of pumps, valves and all the devices needed for the proper operation of the system. These actuators have been applied to improve the quality of the ride on both road [23] and railway vehicles [24].
Regarding railway vehicles, their own nature allows the development of tilting technology, which rolls the car body in curves with the aim of reducing the lateral acceleration perceived by the passengers. Usually, the movement of the car body is achieved by using hydraulic or electromechanical actuators [25]; however, Talgo introduced in the 1980s a passive natural tilting system in its trains [26].
The management of active and semi-active suspension systems is performed through different strategies. Several concepts are found in the literature: classic control [27,28], Model Predictive Control [29], fuzzy logic [30], skyhook control [31] and H2 and H∞ control [32]. All of them have proved an ability to achieve a reasonable trade-off between stability and comfort with the appropriate tuning conditions.
Another approach for managing the suspension system of light vehicles is proposed. This new approach is based on mechanical principles and relies on the measurements acquired by a position scanner installed at the front end of the vehicle to actuate on the following suspension systems; therefore, the unevenness of the terrain can be counteracted. This paper presents a predictive suspension algorithm for land vehicles traveling through a deterministic topography. The kinematics of a half vehicle model is posed and then implemented in Simulink, including the suspension algorithm. Our algorithm “reads” the surface the vehicle is traveling through thanks to a sensor installed in the front wheel of the vehicle and acts over a device installed in the rear wheel to compensate for the irregularities of the terrain. The actuation is governed by the parameter “D”, which represents the distance over which the algorithm averages the height of the terrain. Two ground profiles were tested and sensitivity analysis of the parameter “D” was performed.
The structure of the paper is as follows: Section 2 describes the equations that define the vehicle model and the suspension algorithm. Section 3 shows the results obtained after simulating the vehicle and the response of the algorithm in two types of terrain. The fourth and last section presents the conclusions of this work.

2. Materials and Methods

The predictive suspension algorithm is implemented on a two-axle vehicle, whose kinematics must be solved first. For simplicity, only 1/2 vehicle is modeled and symmetry action on both wheels of the same axle is assumed, so the problem becomes bi-dimensional. The vehicle will travel through a deterministic topography. Hence, the vertical position of any wheel can be established from the horizontal position by the function that relates both variables.
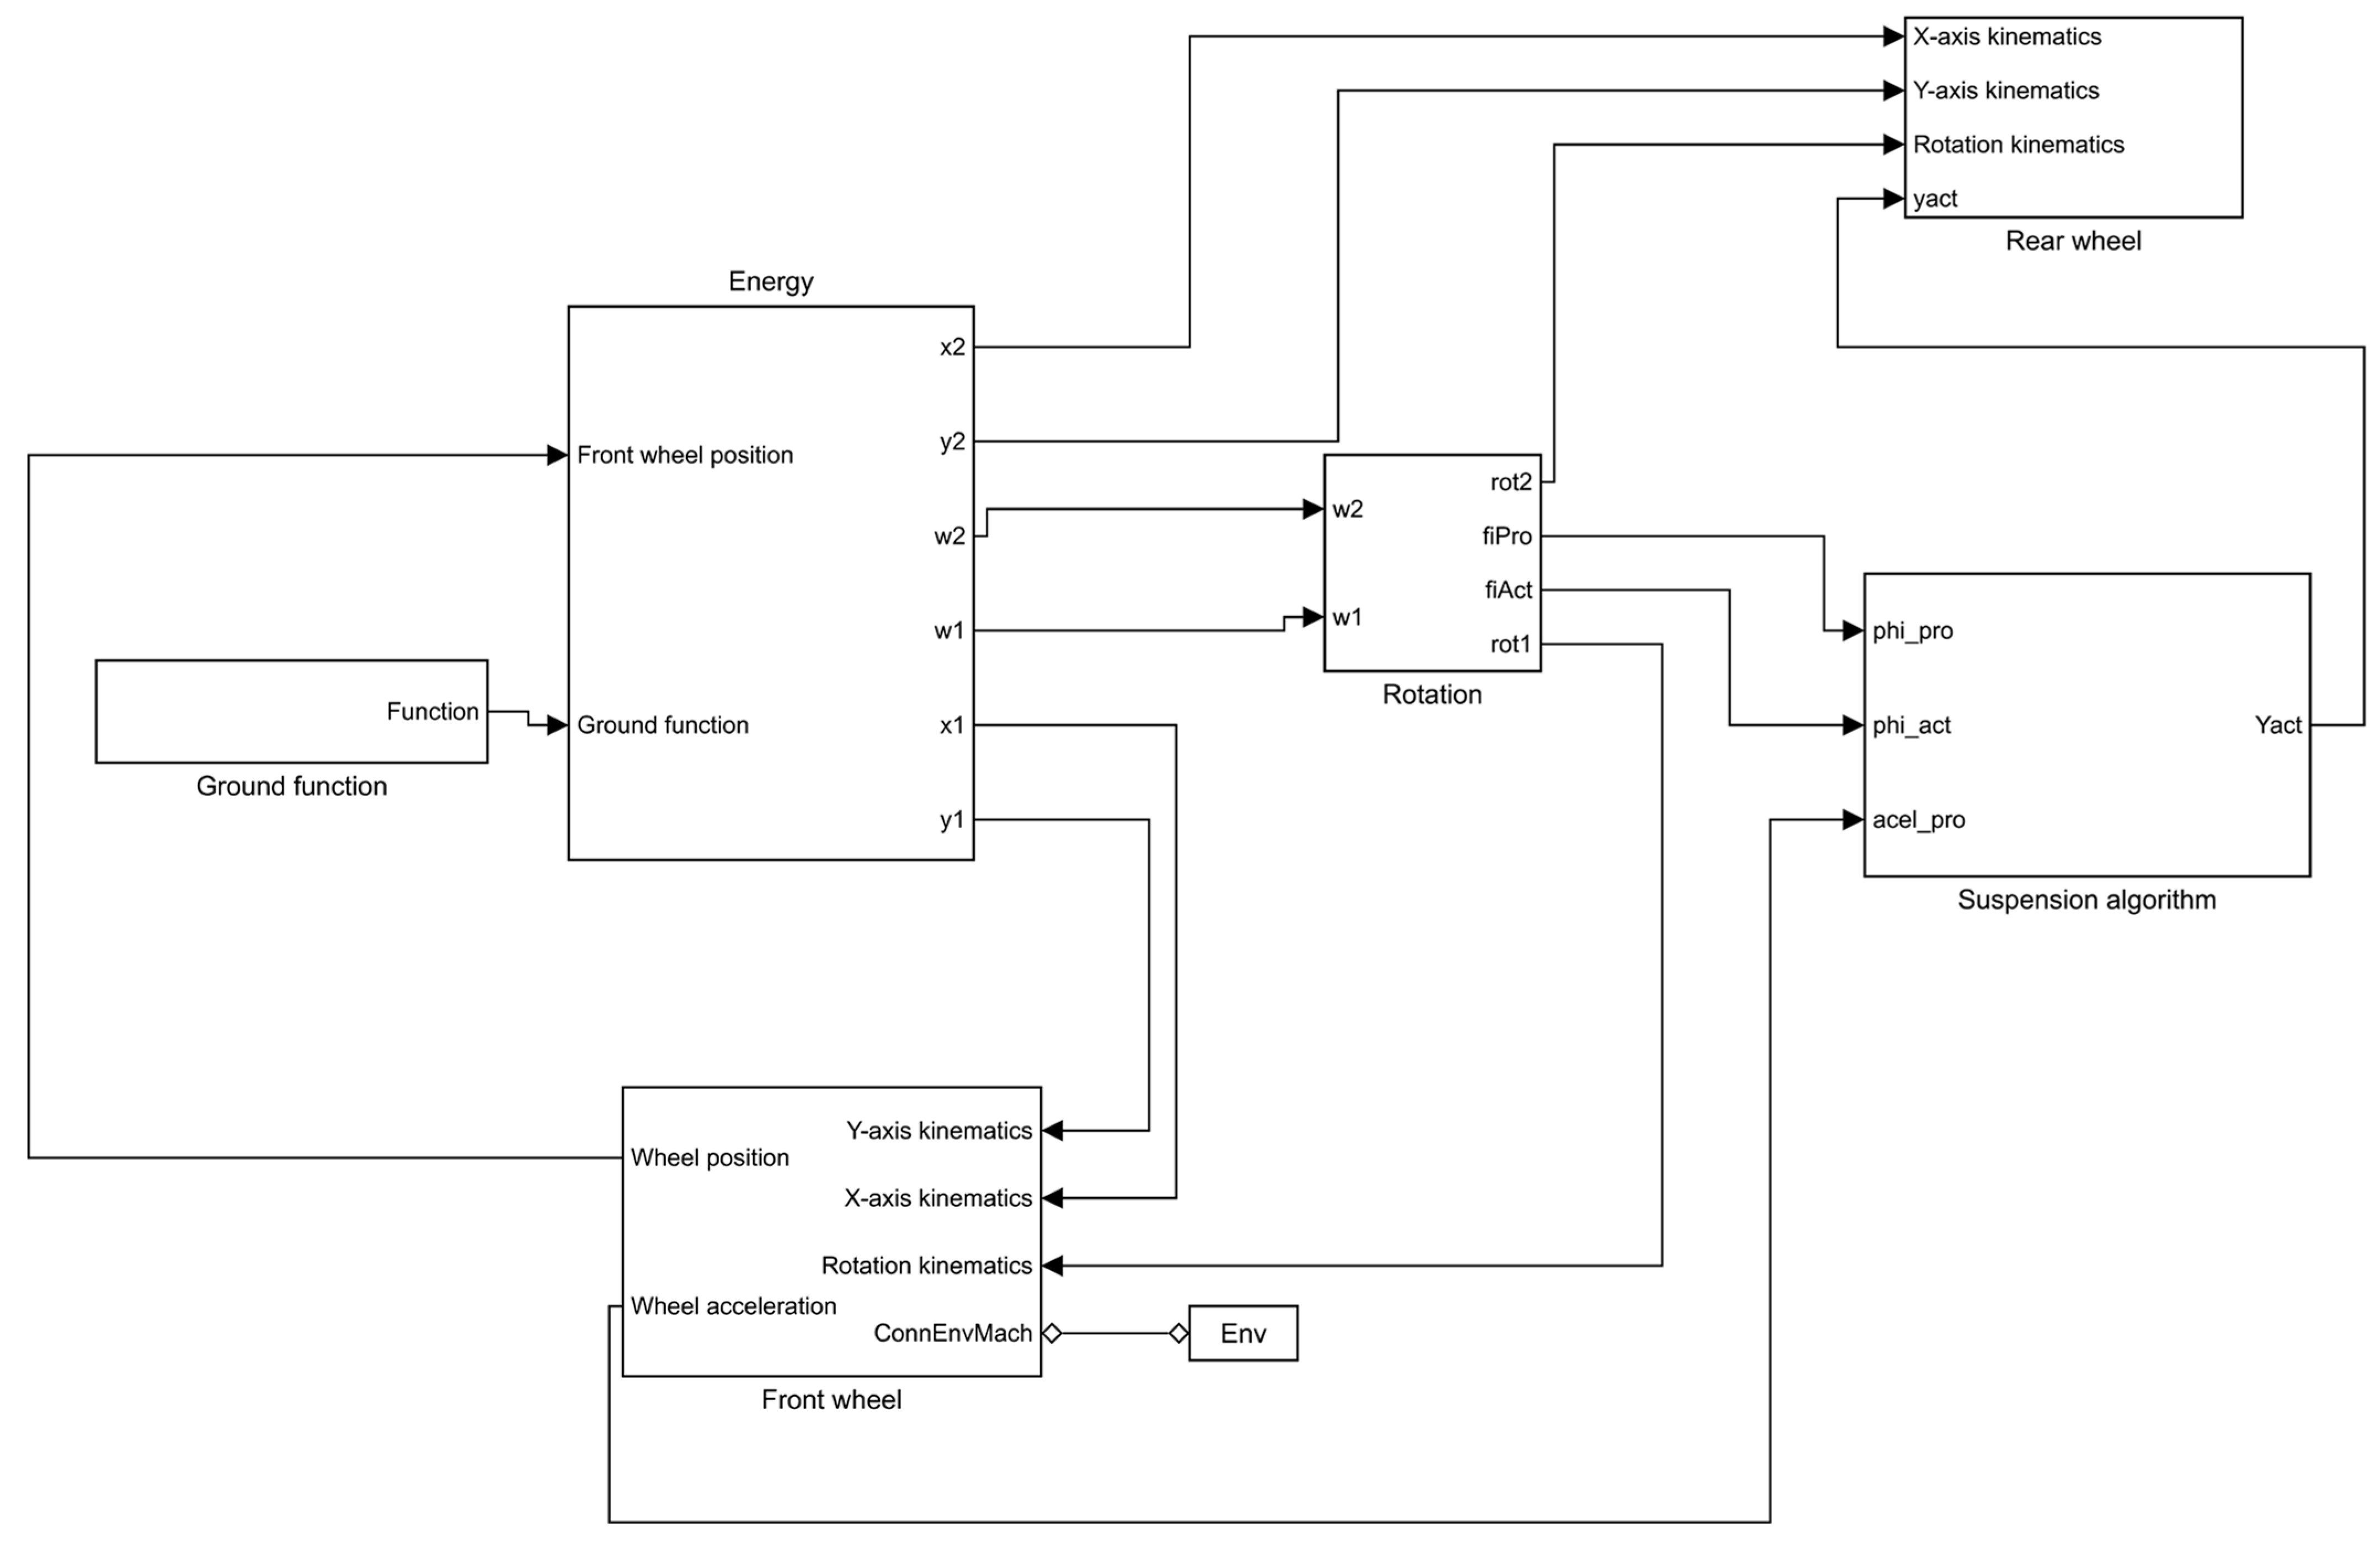
The vehicle model also assumes that the mechanical energy remains constant, only wheels have mass and pure rolling (no sliding) is considered as it is a condition for the good performance of the suspension algorithm. This model and the algorithm were implemented in Simulink.

2.1. Vehicle Model

The mechanical energy of the vehicle is given by Equation (1)
E = 1 2 m 1 v 1 2 + 1 2 I 1 ω 1 2 + m 1 g y 1 + 1 2 m 2 v 2 2 + 1 2 I 2 ω 2 2 + m 2 g y 2
where E is the mechanical energy, m1 and m2 are the masses of both wheels, I1 and I2 are the inertias of both wheels, v1 and v2 are the linear velocities of the wheels, ω1 and ω2 are the angular speeds of the wheels, y1 and y2 are the vertical positions of the wheels and g is the gravity.
By assuming pure rolling motion and the wheels as solid disks, Equation (1) can be simplified; therefore, the initial energy of the system is obtained from Equation (2), where the subscript 0 means “initial conditions”.
E 0 = 1 2 2 · m · v 0 2 + 1 4 2 · m · v 0 2 + 2 · m · g y 0 = 3 2 · m · v 0 2 + 2 · m · g y 0
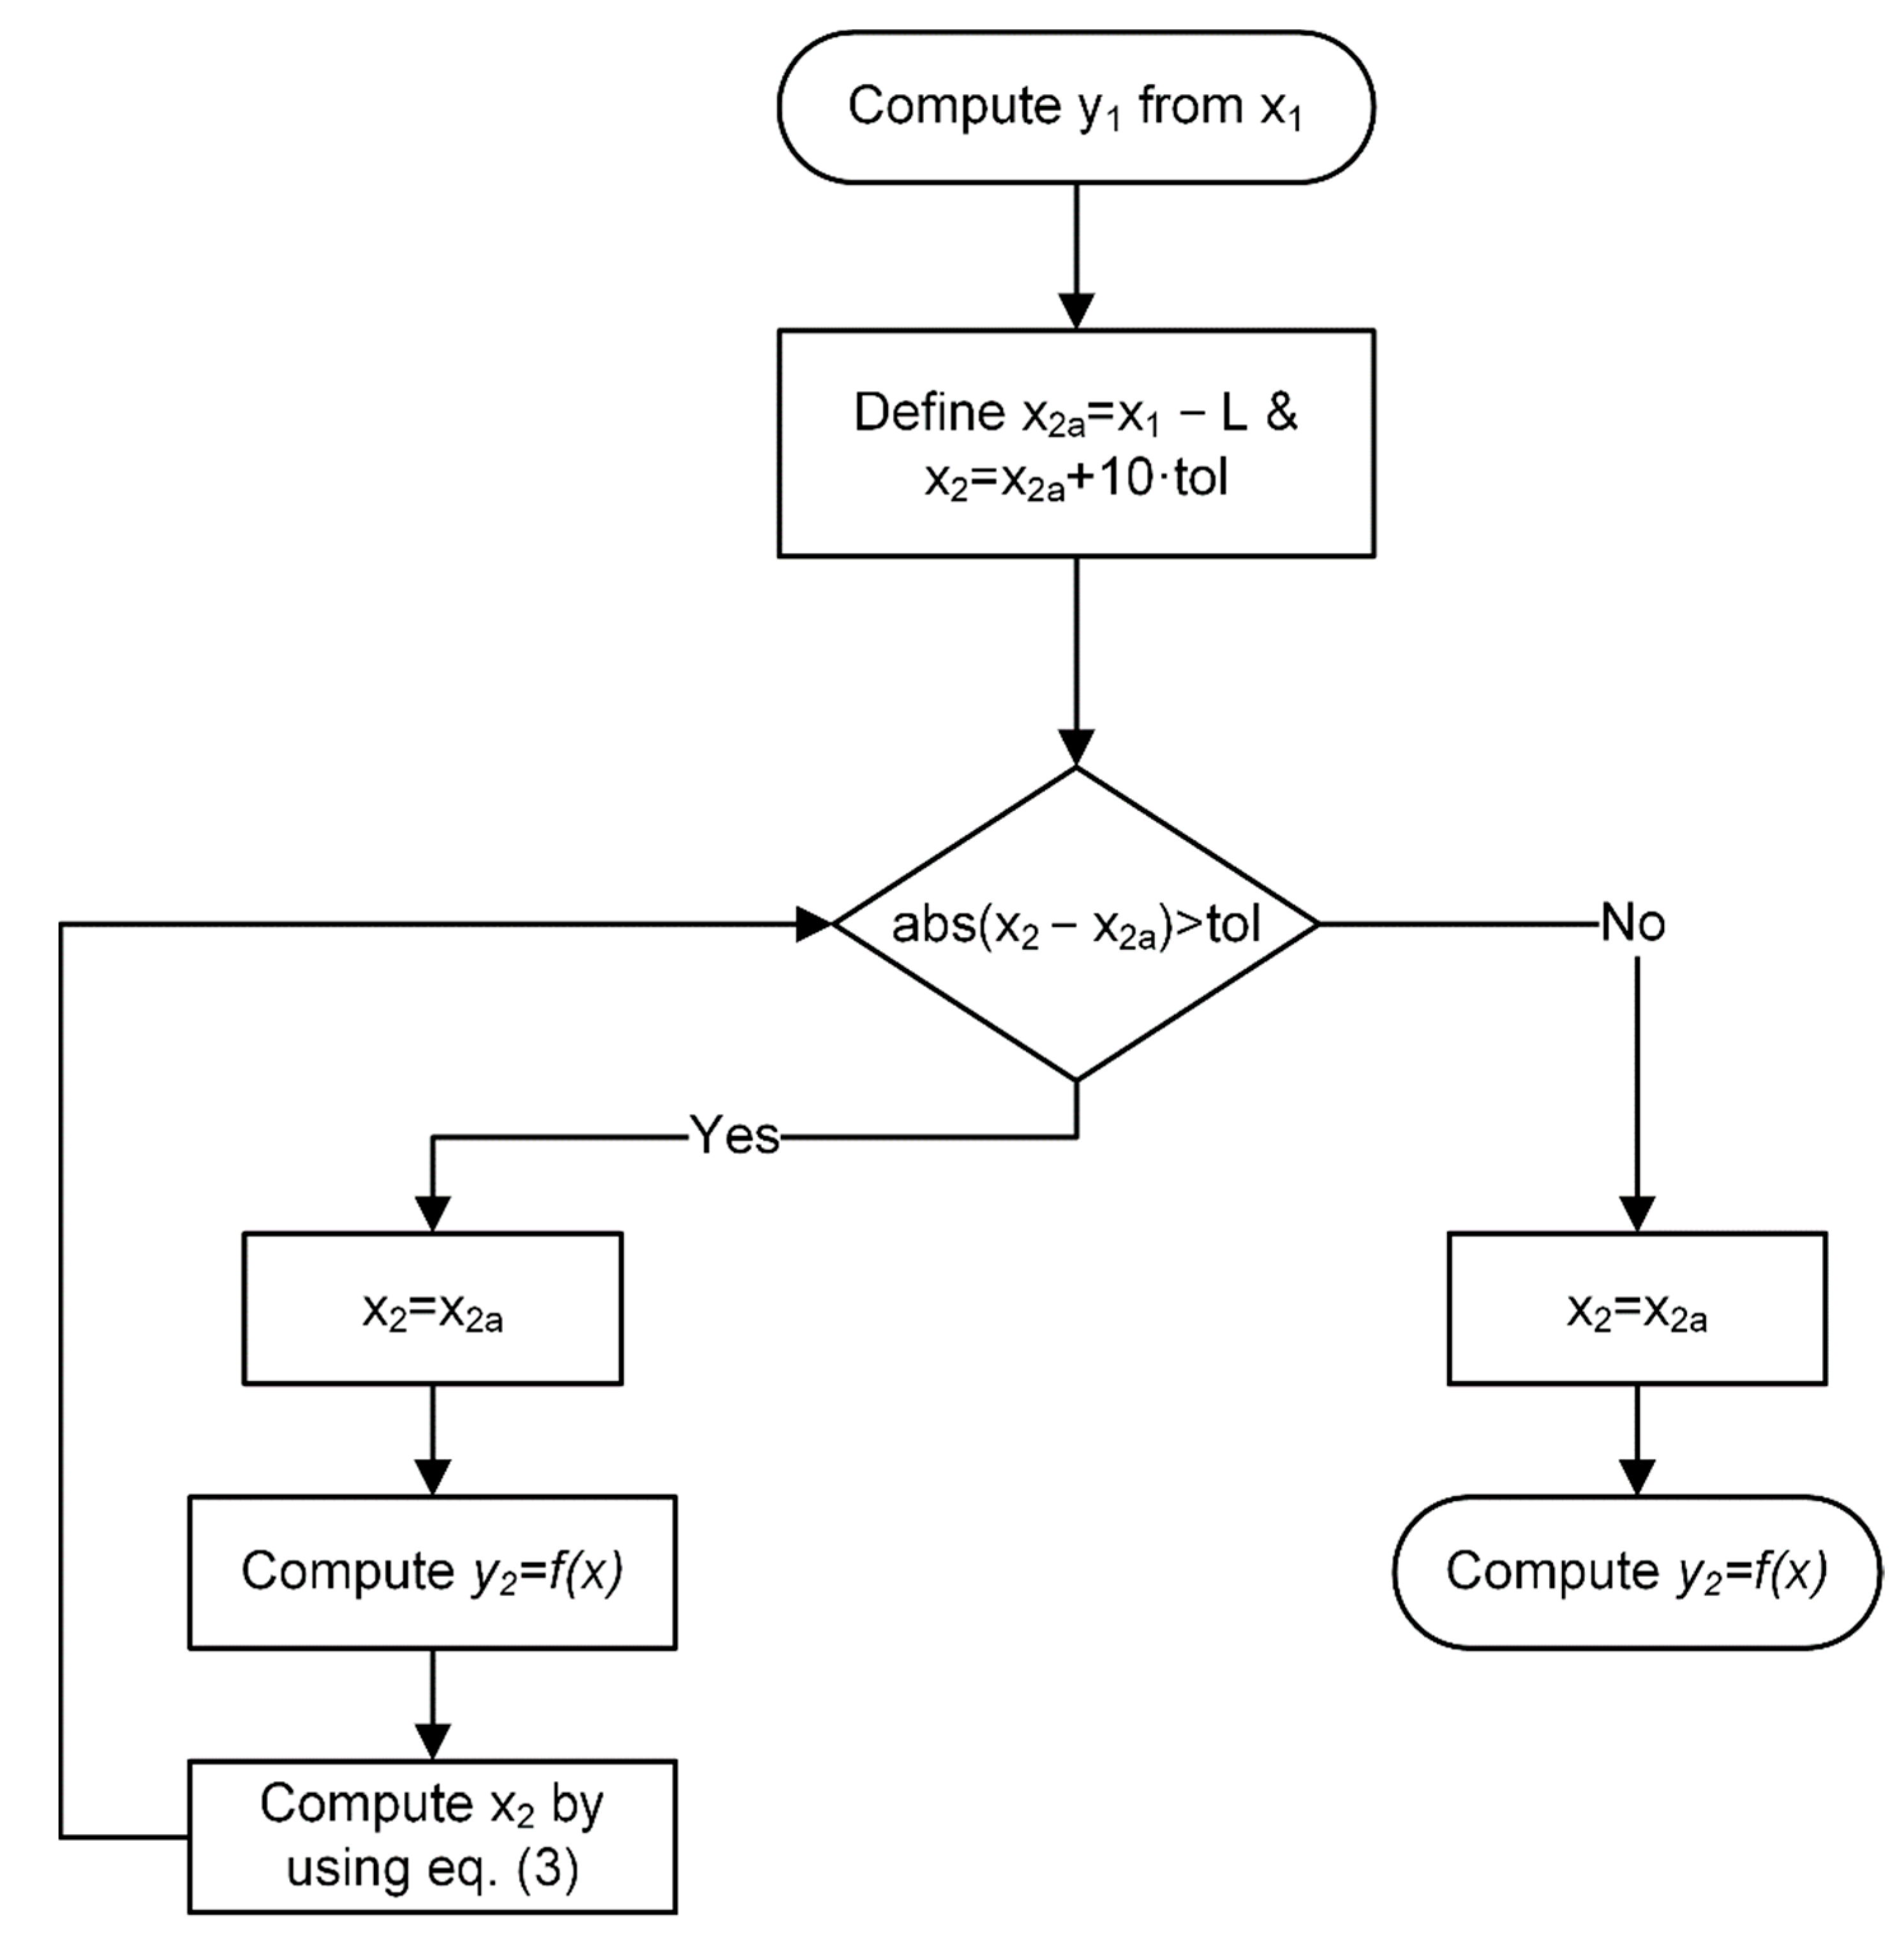
The distance between the front and rear wheels (that is, the wheelbase) L is known and can be described mathematically as a circumference centered on the front wheel and radius L. The position of the rear wheel is obtained by computing the intersection of this circumference with the trajectory described by the ground function y = f(x). Hence, the solution of the equation system given by Equation (3) yields the position of the rear wheel.
( x 2 x 1 ) 2 + ( y 2 y 1 ) 2 = L 2 y = f ( x )
This system of equations is solved by iteration, as the ground function can be any type of function, even not analytical. The flowchart describing the iteration process is shown in Figure 1.
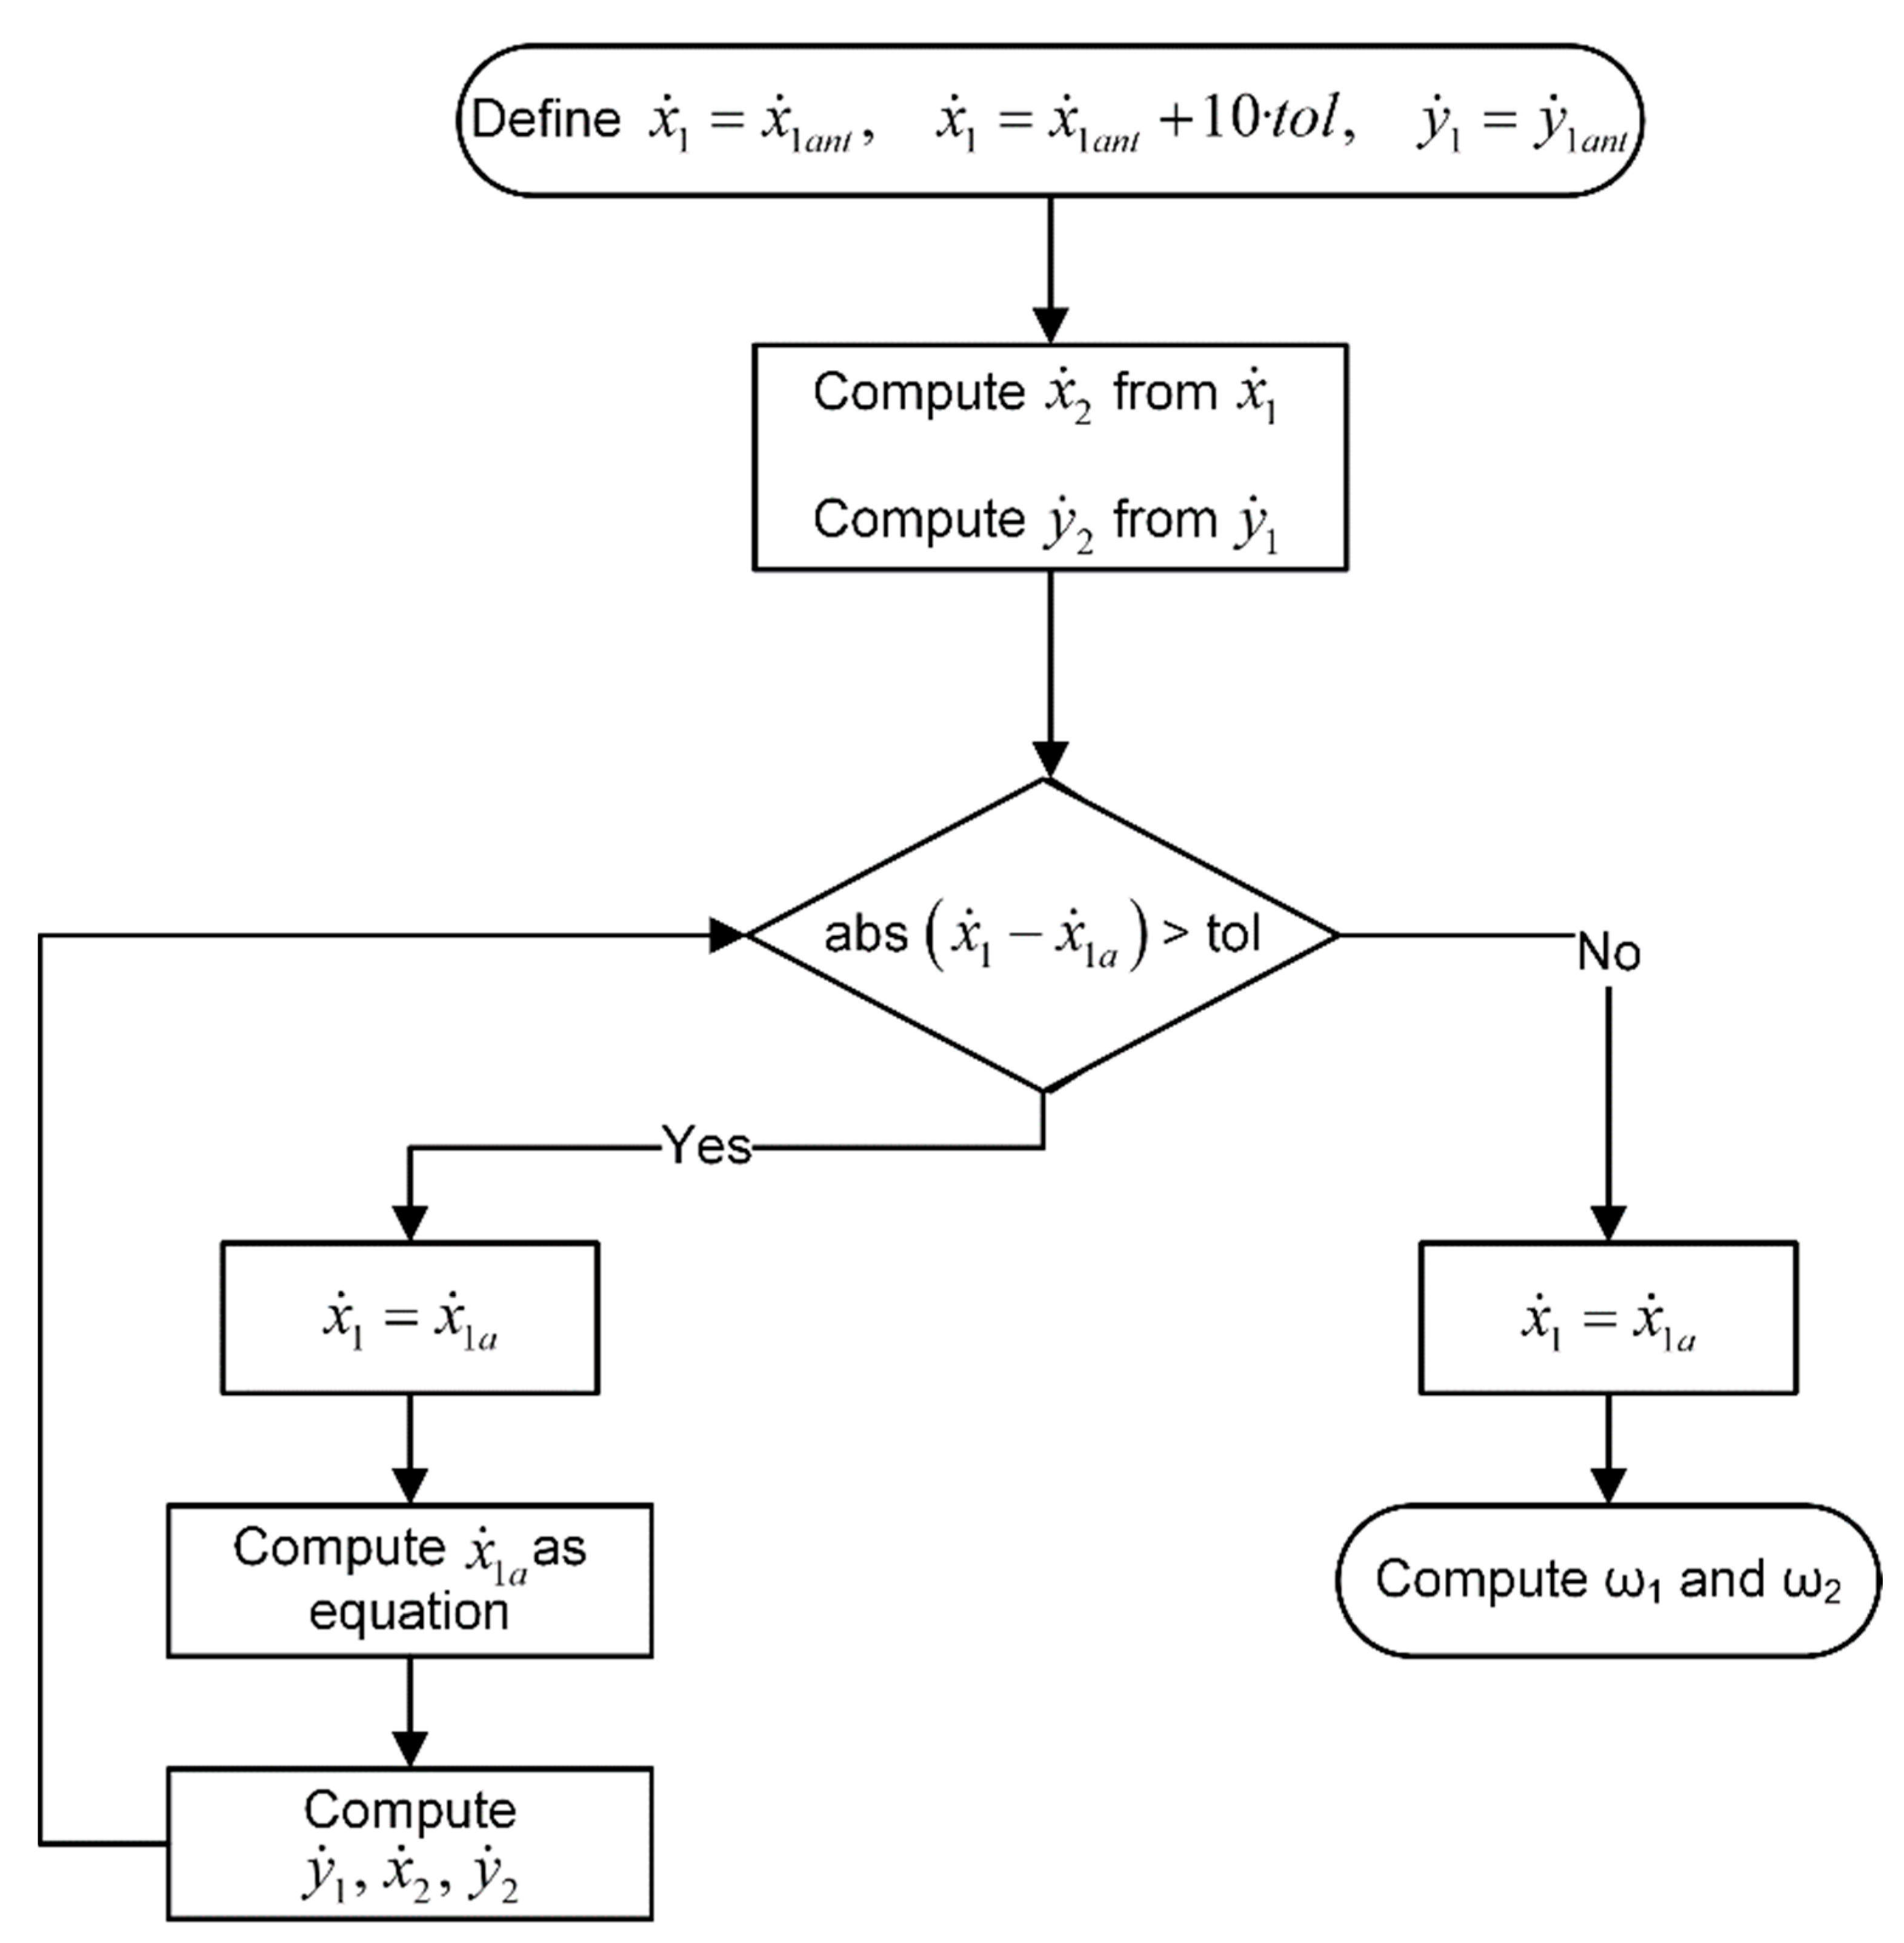
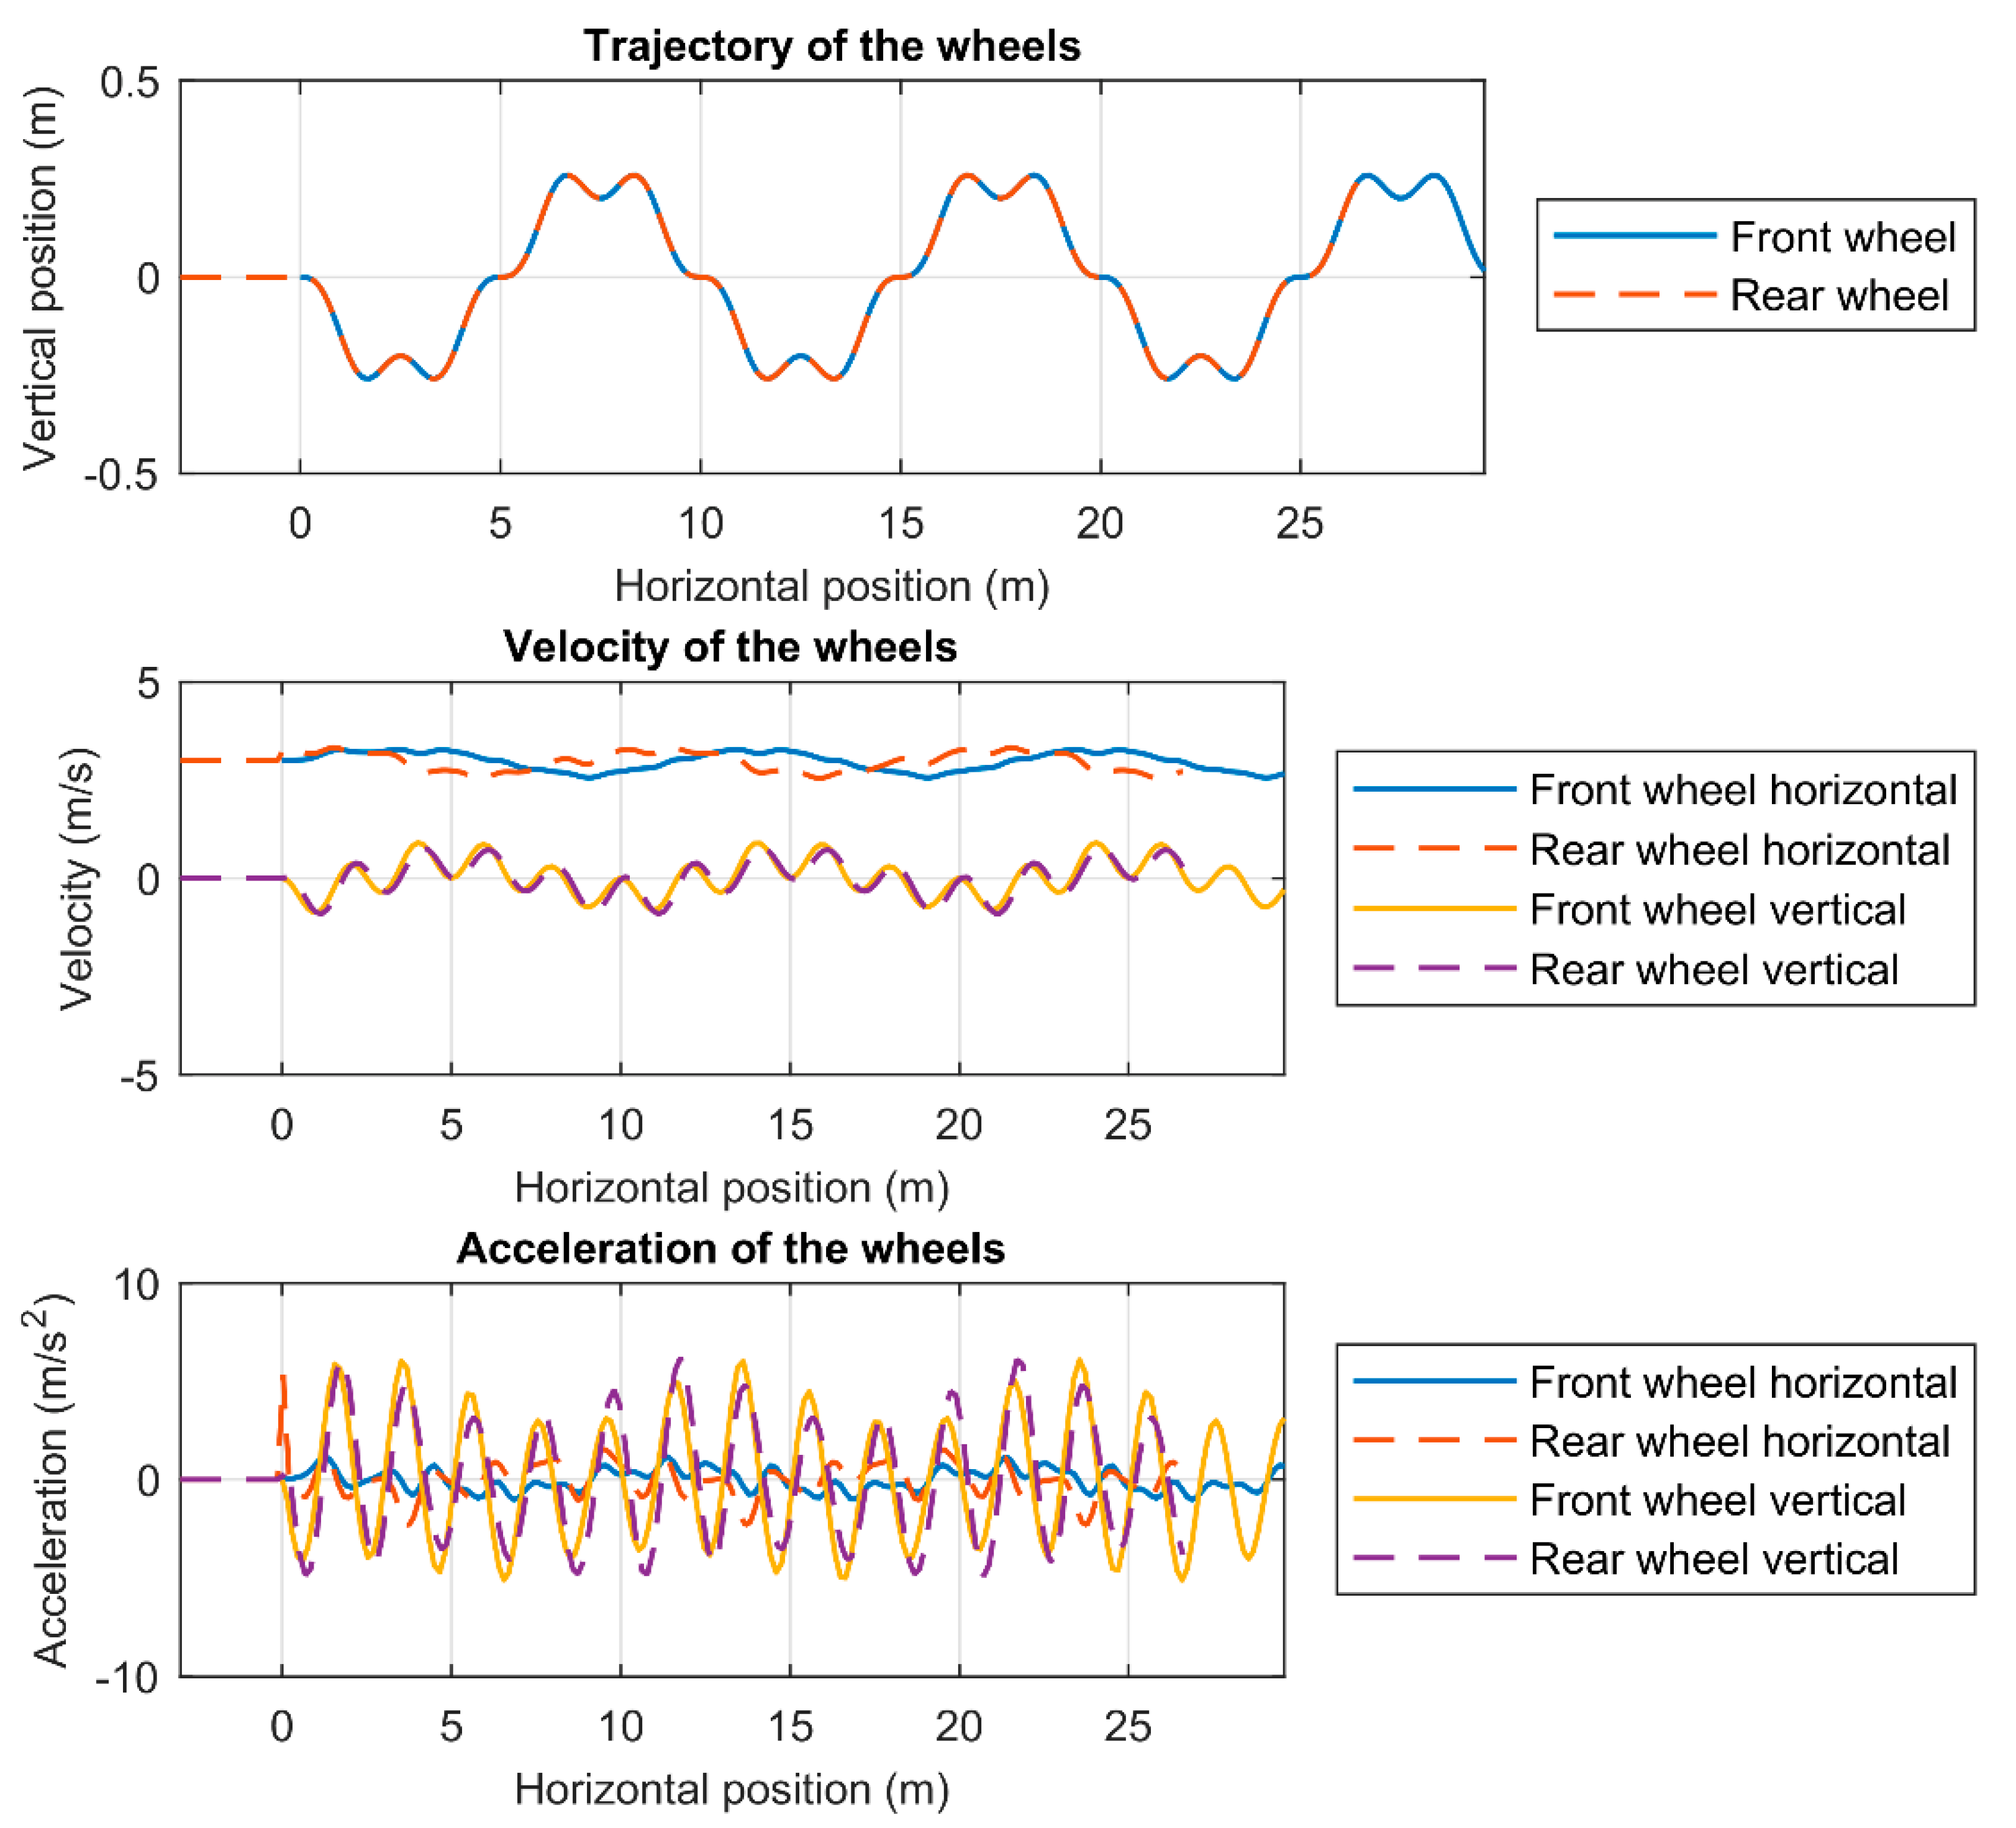
The velocity of both wheels is computed from the conservation of energy, the time derivative of the constraint equation and the ground function, obtaining the equation system built up by Equations (4)–(6).
E 0 m 1 g y 1 + m 2 g y 2 = 3 4 m 1 v 1 2 + 3 4 m 2 v 2 2
2 x ˙ 2 x ˙ 1 x 2 x 1 + 2 y ˙ 2 y ˙ 1 y 2 y 1 = 0
y ˙ = d   f ( x ) d t
In order to solve this system more efficiently, polar coordinates are used. This implies defining the pitch angle θ as Equation (7).
θ = π + a r c t g y 1 y 2 x 1 x 2
Therefore, the constraint Equation (3) is rewritten as Equation (8).
x 2 = x 1 + L cos θ y 2 = y 1 + L s i n θ
The combination of the conservation of energy with the time derivatives of the ground function and the constraint equation in polar coordinates yields Equations (9)–(12), which allows computing all the components of the speed of both wheels.
As previously, this system of equations is solved by iteration following the flowchart in Figure 2.
E 0 m 1 g y 1 + m 2 g y 2 = 3 4 m 1 v 1 2 + 3 4 m 2 v 2 2 = 3 4 m 1 ( x ˙ 1 2 + y ˙ 1 2 ) + 3 4 m 2 ( x ˙ 2 2 + y ˙ 2 2 )
y ˙ 1 = d   f ( x 1 ) d t
x ˙ 2 = x ˙ 1 L · θ ˙ · s e n θ
y ˙ 2 = y ˙ 1 + L · θ ˙ · cos θ
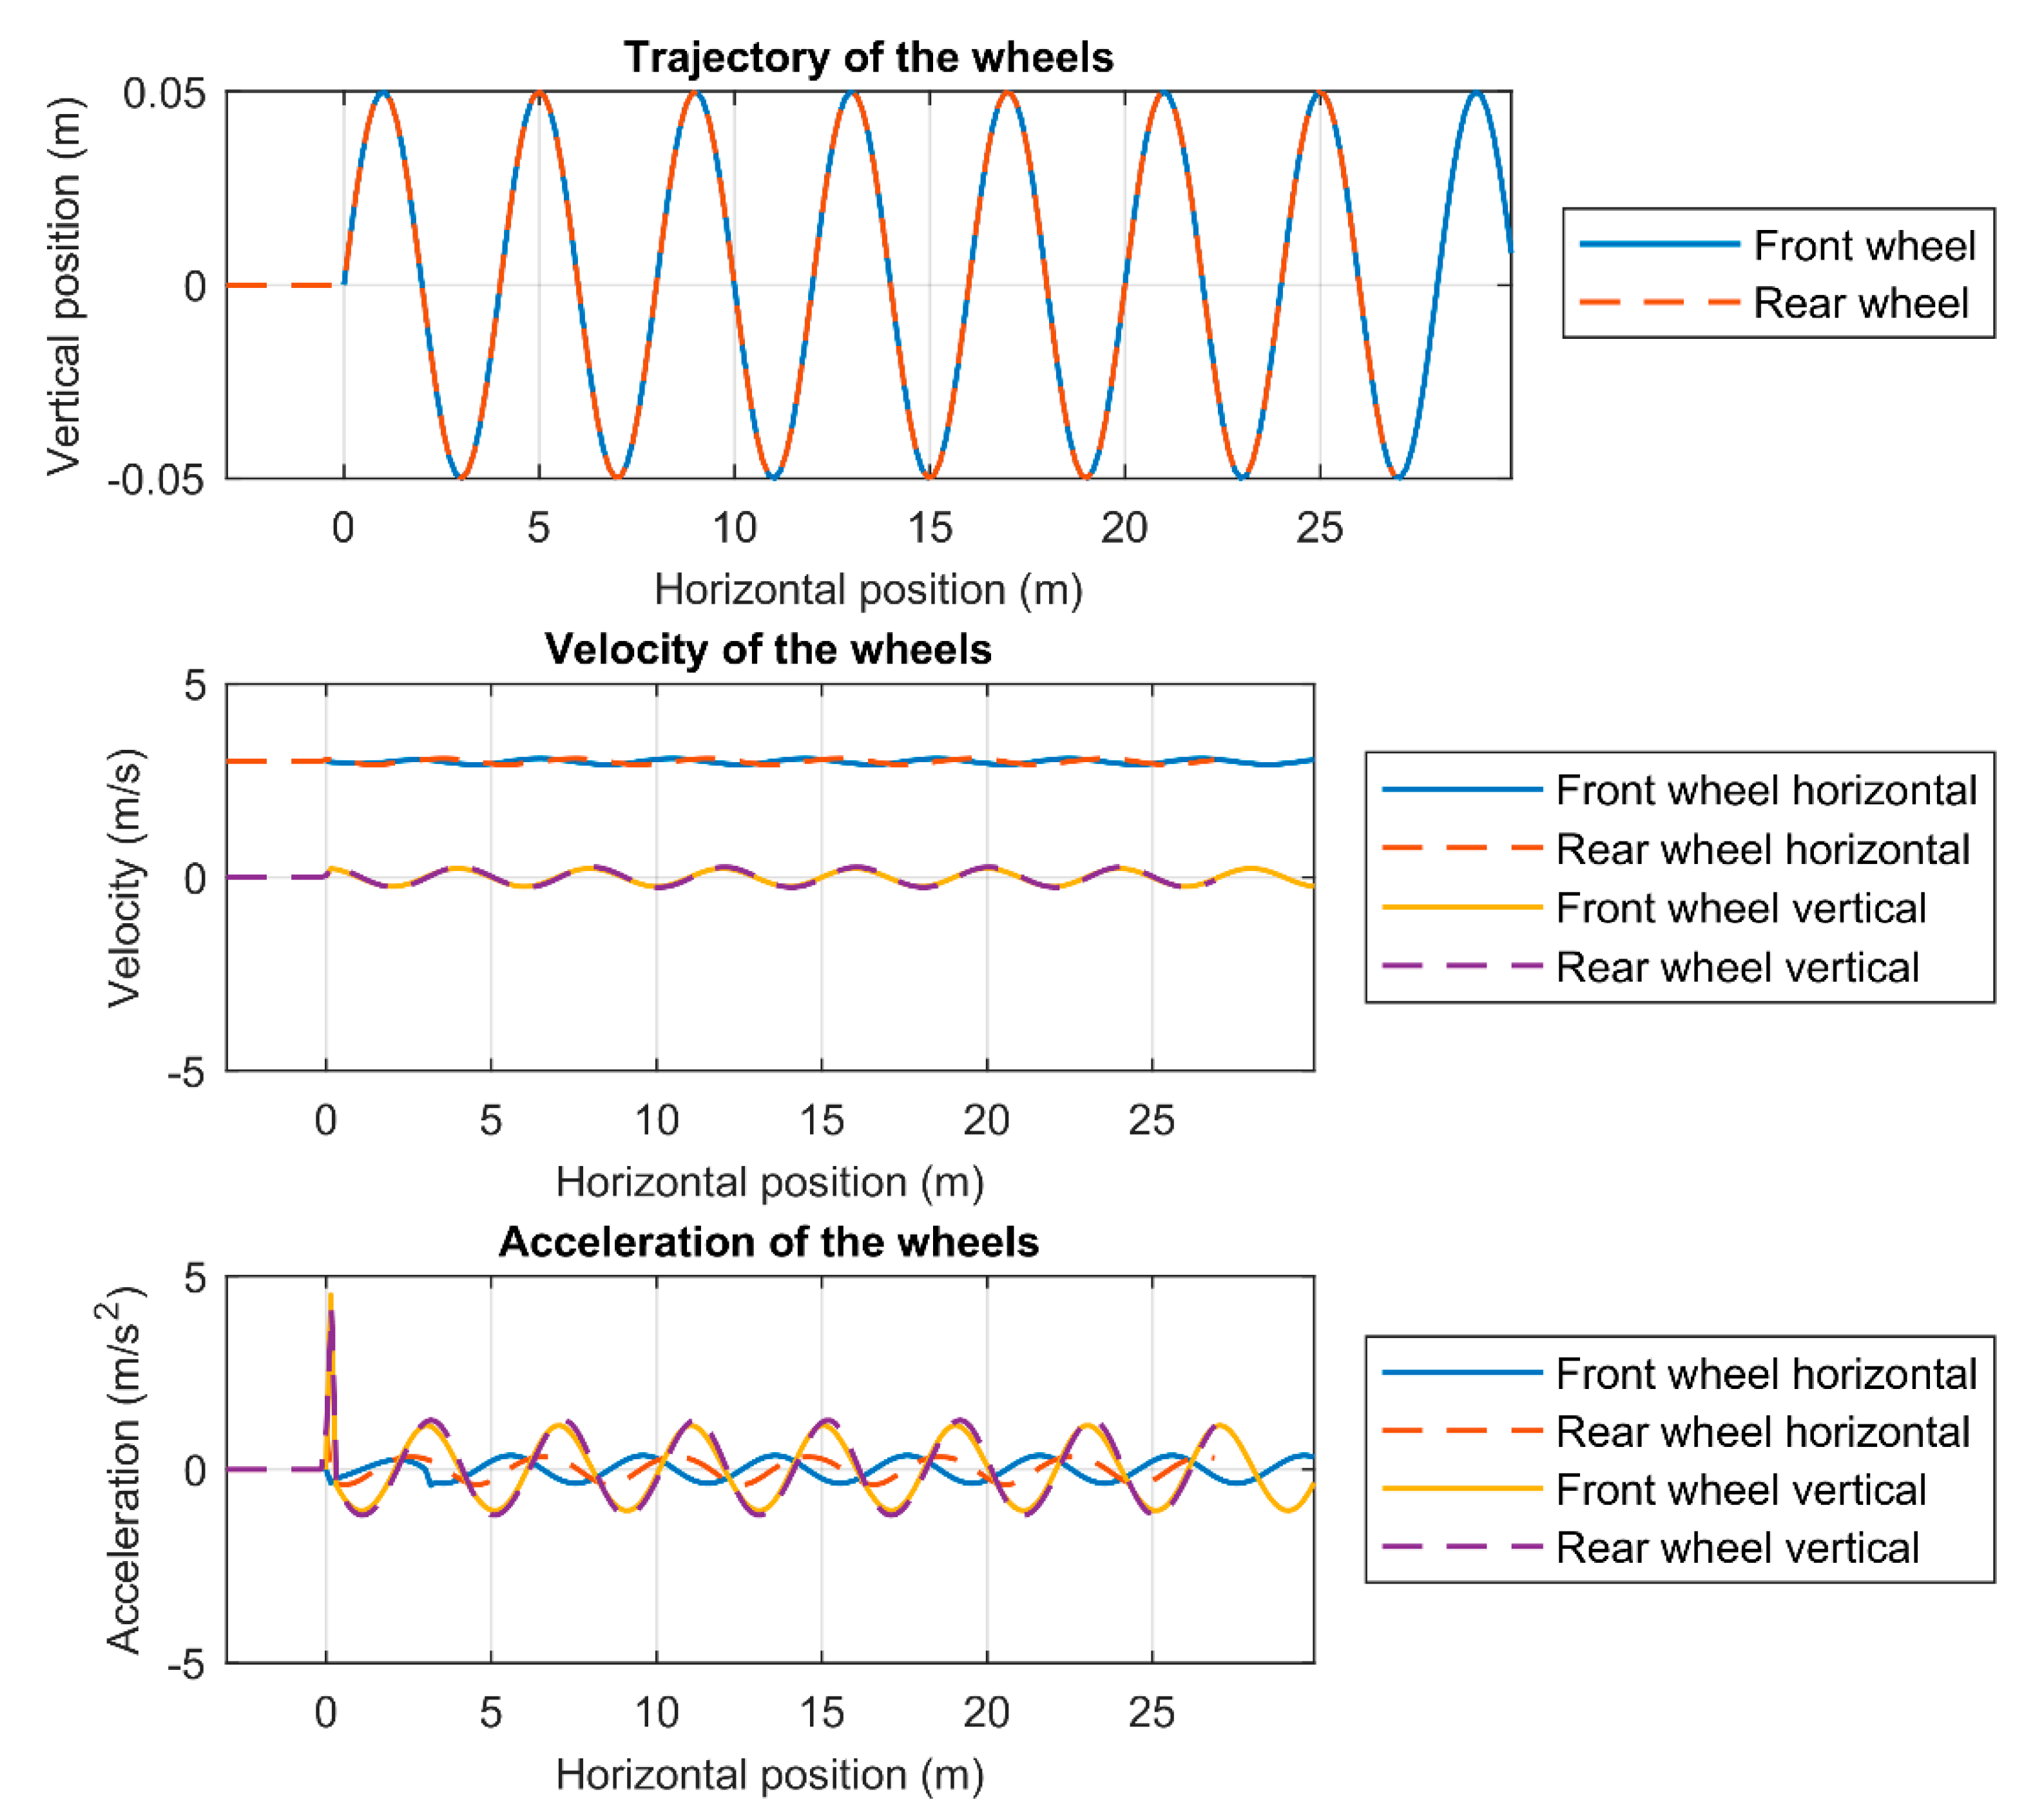
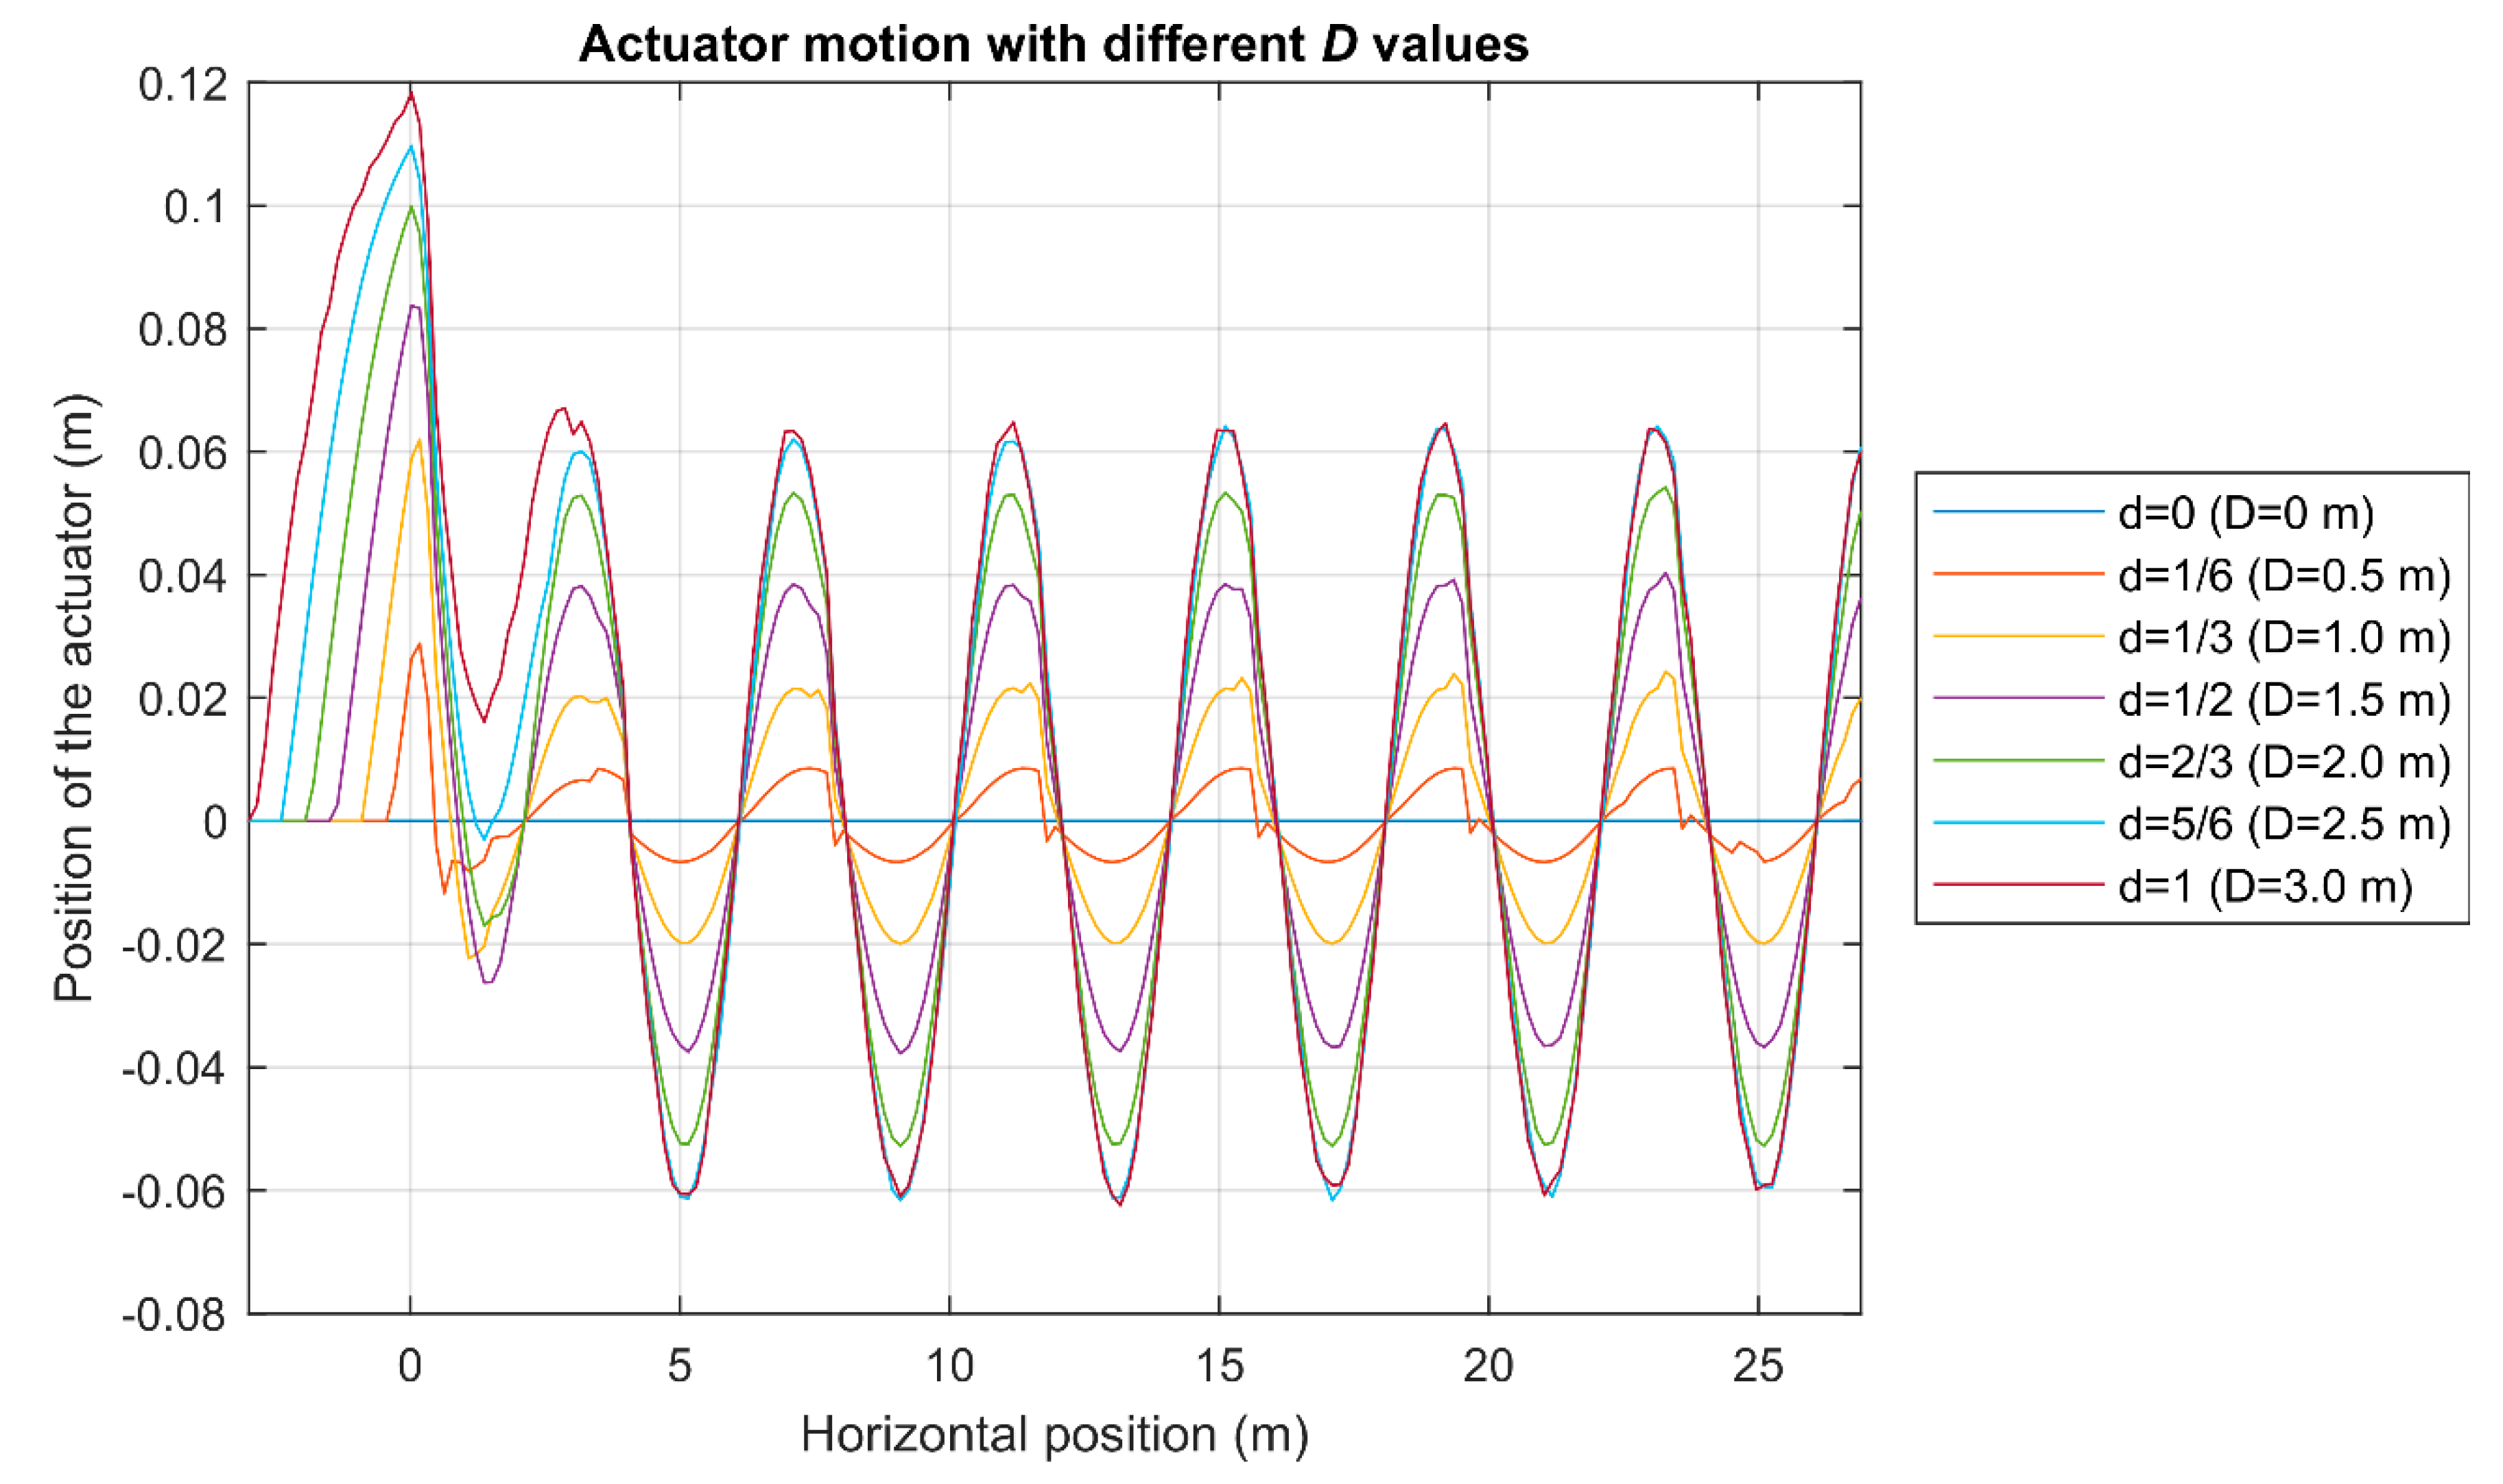
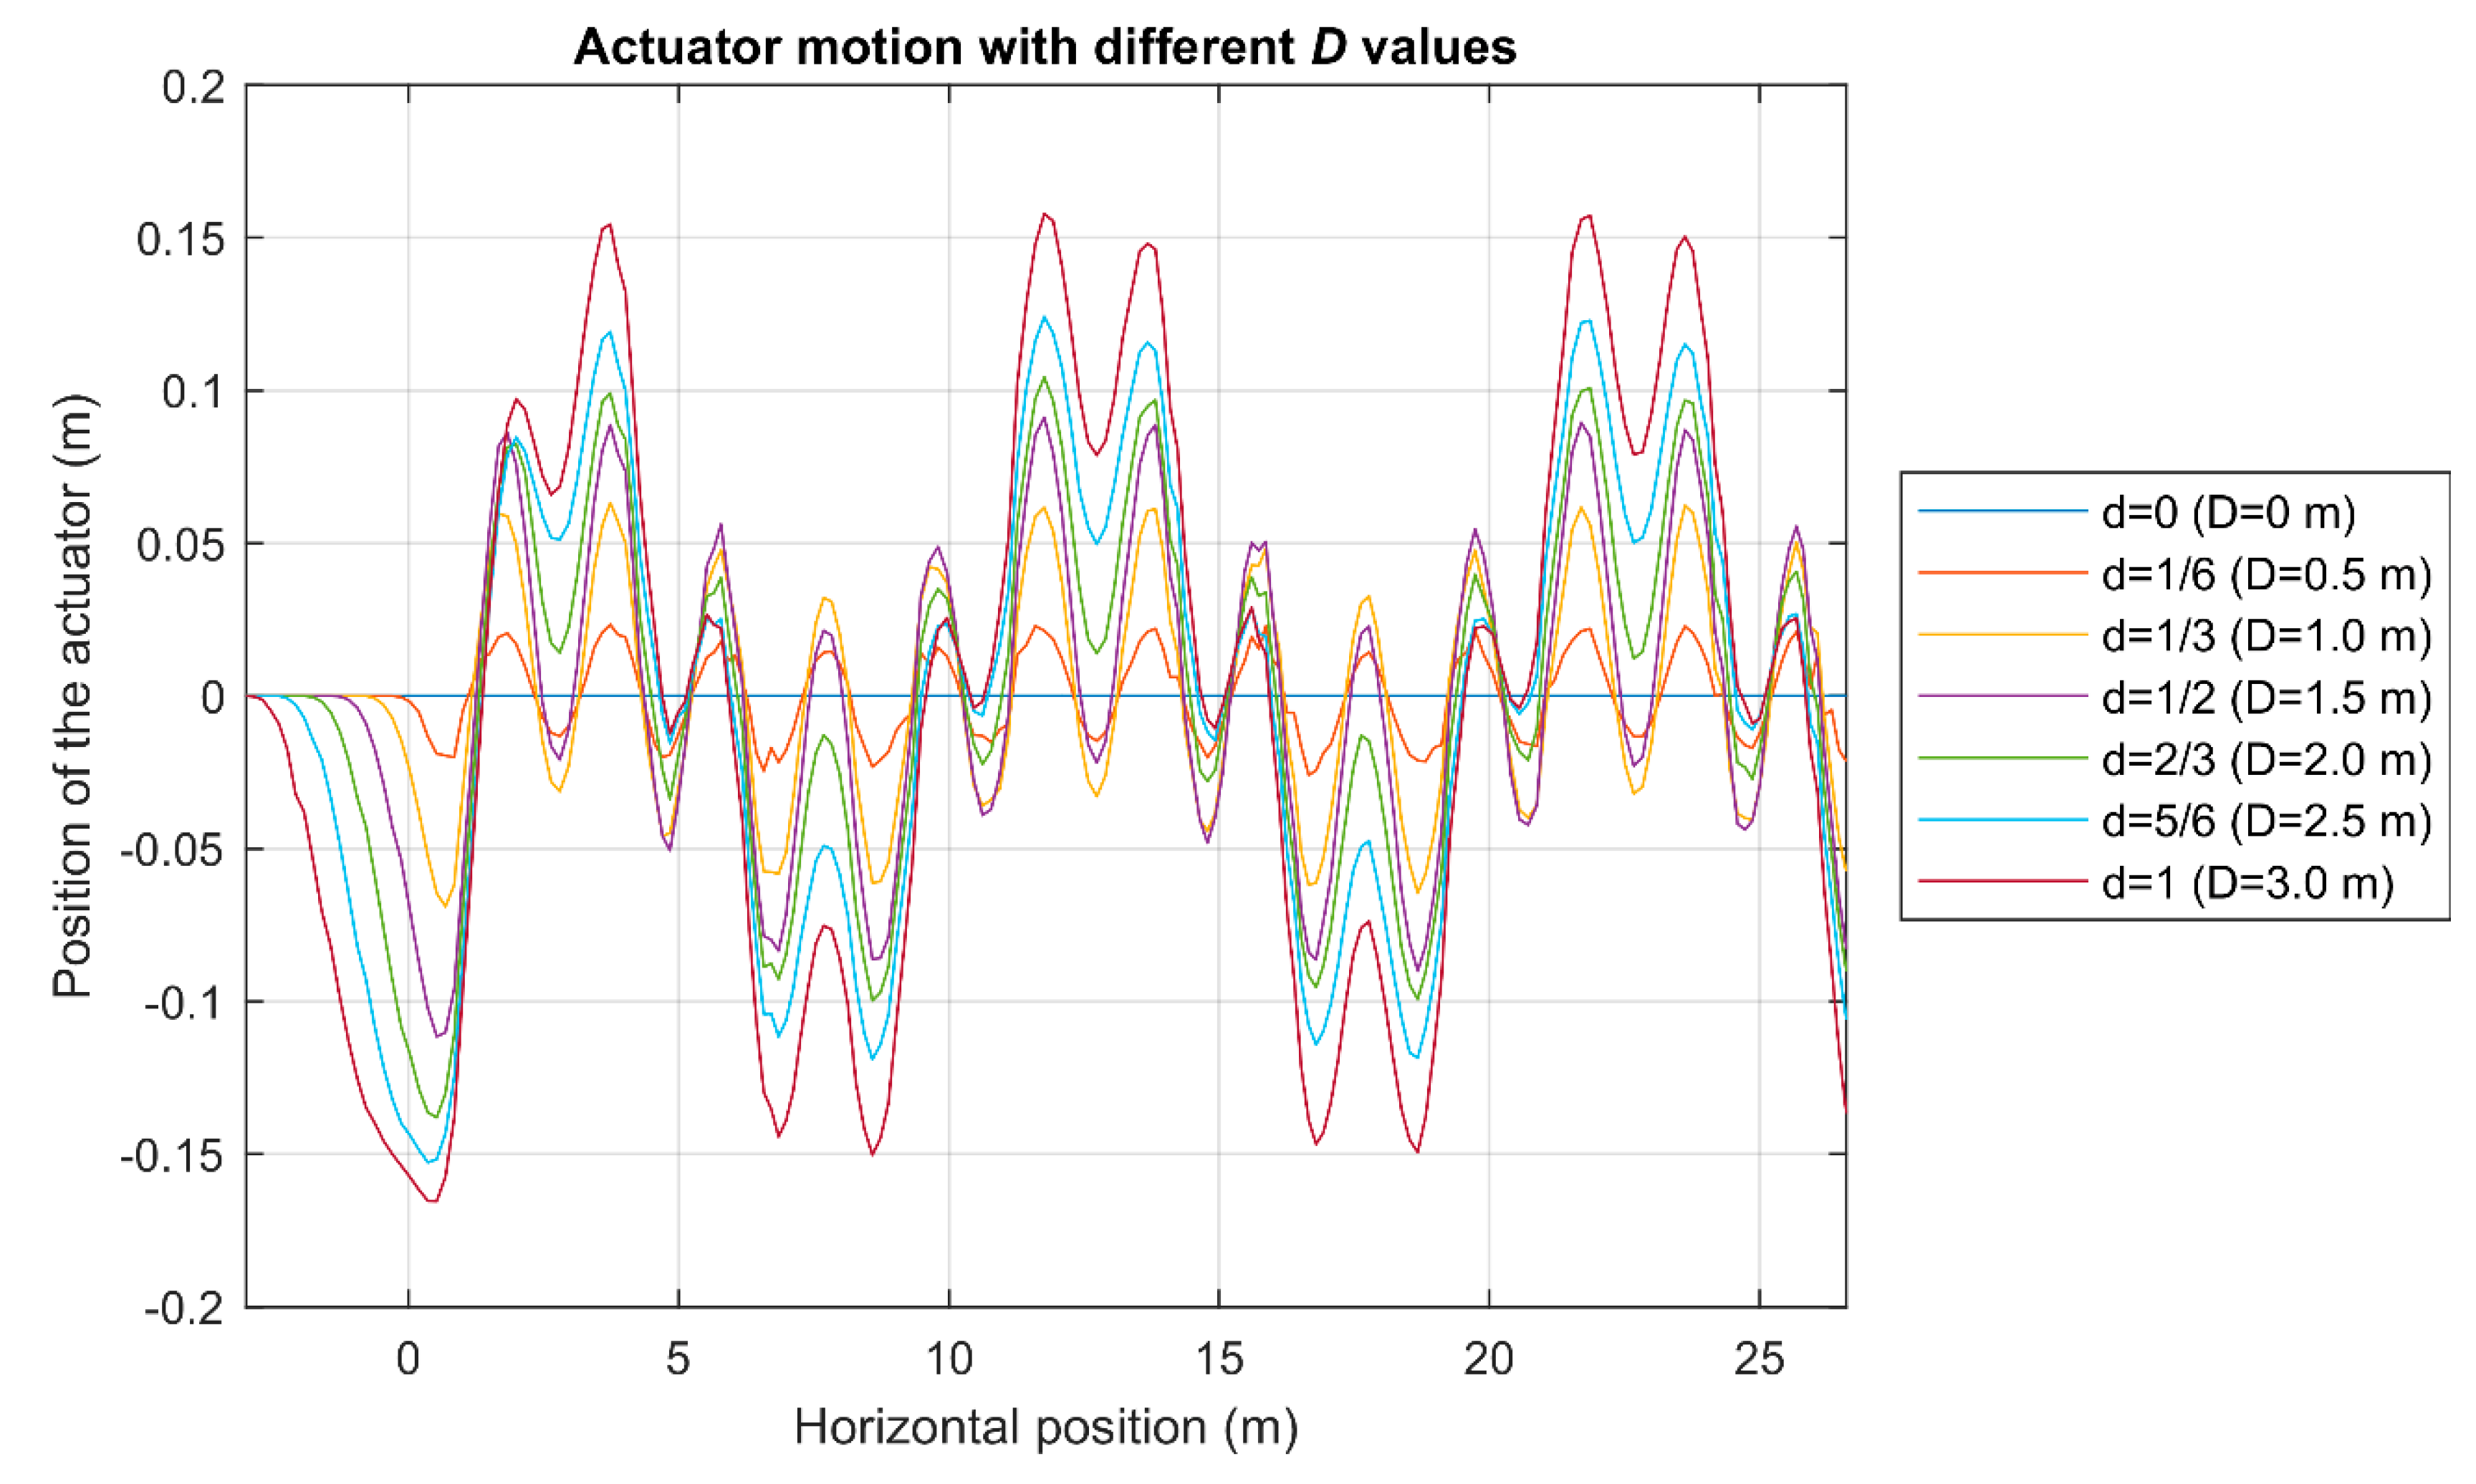
Two different ground topographies and several values of the parameter D were proposed for testing the algorithm. The first topography (profile 1) simulates a wiggly surface and is defined by Equation (13)—where A1 is the amplitude of the wave and λ1 is the wavelength, both in meters.
y = A 1 s i n 2 π λ 1 x
The second profile is a combination of two sinusoidal irregularities according to Equation (14):
y = A 0 + A 1 s e n 2 π λ 1 x a + A 2 s e n 2 π λ 2 x
A1 and A2 are the amplitudes of both sines, λ1 and λ2 are the wavelengths, A0 is the reference height and a is a parameter to guarantee continuity in the first derivative; therefore, A0 and a are such that:
a = 1 2 λ 1 1 1 π a r c c o s A 2 λ 1 A 1 λ 2
A 0 = A 1 s e n 2 π a λ 1
The model parameters and initial conditions used in the simulations of both topography profiles are summarized in Table 1. The input values of both topography profiles are depicted in Table 2, as well as the computed values of variables A0 and a.

2.2. Suspension Algorithm

The suspension algorithm is applied to the 1/2 vehicle model described in the previous subsection. The frontwheel acts as a probe wheel, whereas the rear wheel is the actuated wheel. The probe wheel is instrumented with a vertical accelerometer and both wheels should be equipped with an accurate system for measuring their angular positions.
In Figure 3, two kinds of terrain defects (peak and corrugated) are sketched, as well as the trajectories described by the wheel centers and the trajectory that the sprung mass should follow (a straight line).
Let Δt be the sampling time interval of the accelerometer and y ¨ n = y ¨ ( n Δ t ) the vertical acceleration registered at time t = nΔt. Assuming a constant vertical jerk along the interval [(n-1)Δt, nΔt] yields Equation (17).
y n = y ¨ n y ¨ n 1 Δ t = c t e
Then the expressions for the vertical velocity and position of the wheel center are, respectively:
y ˙ n = y ˙ n 1 + y ¨ n 1 Δ t + 1 2 y n Δ t 2 = y ˙ n 1 + 1 2 y ¨ n 1 + y ¨ n Δ t
y n = y n 1 + y ˙ n 1 Δ t + 1 2 y ¨ n 1 Δ t 2 + 1 6 y n Δ t 3 = y n 1 + y ˙ n 1 Δ t + 1 6 2 y ¨ n 1 + y ¨ n Δ t 2
Although the corresponding velocity and position errors grow with time, nΔt, and time squared, (nΔt)2, respectively, (easy to show); this is not too much of a problem since the algorithm does not include the absolute height, but its variation over a certain distance, “D”. In other words, the database of values obtained in Equations (18) and (19), will be dynamically refreshed, so that n, and therefore the temporal interval nΔt, does not increase indefinitely.
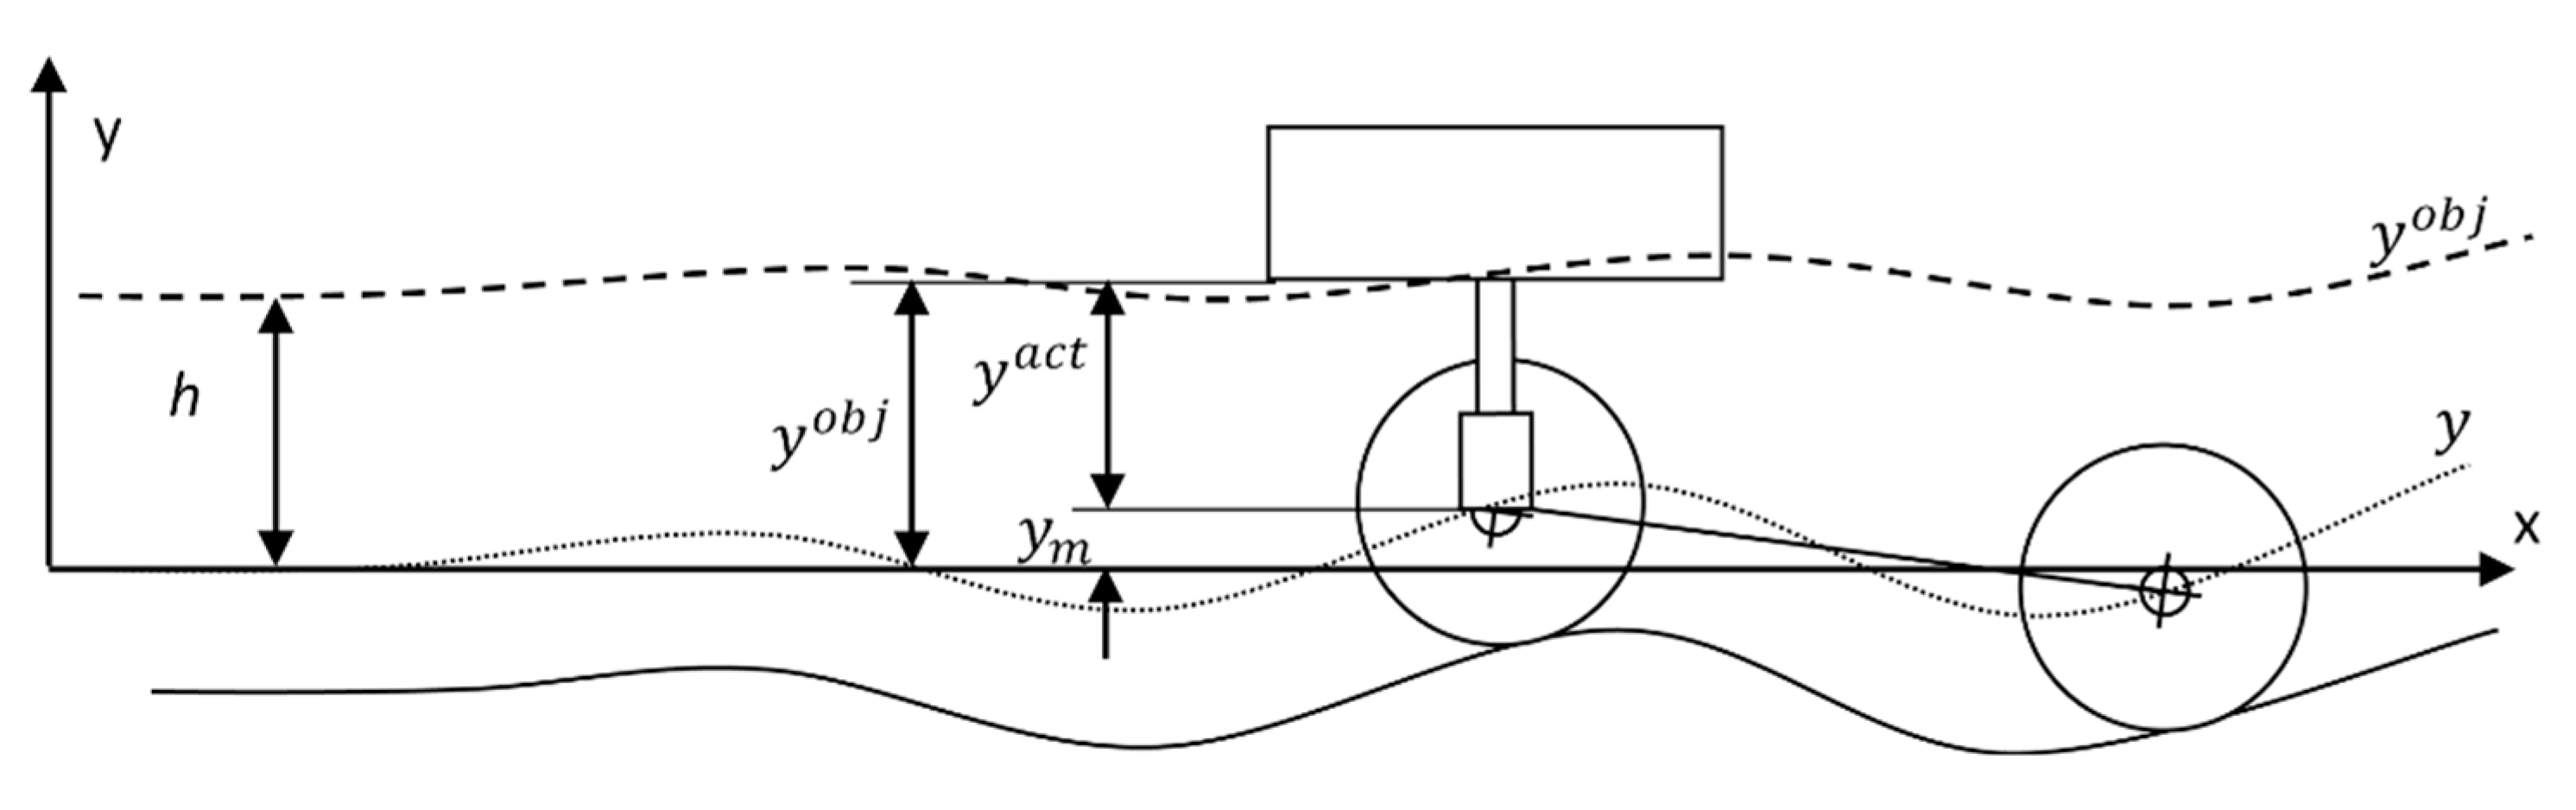
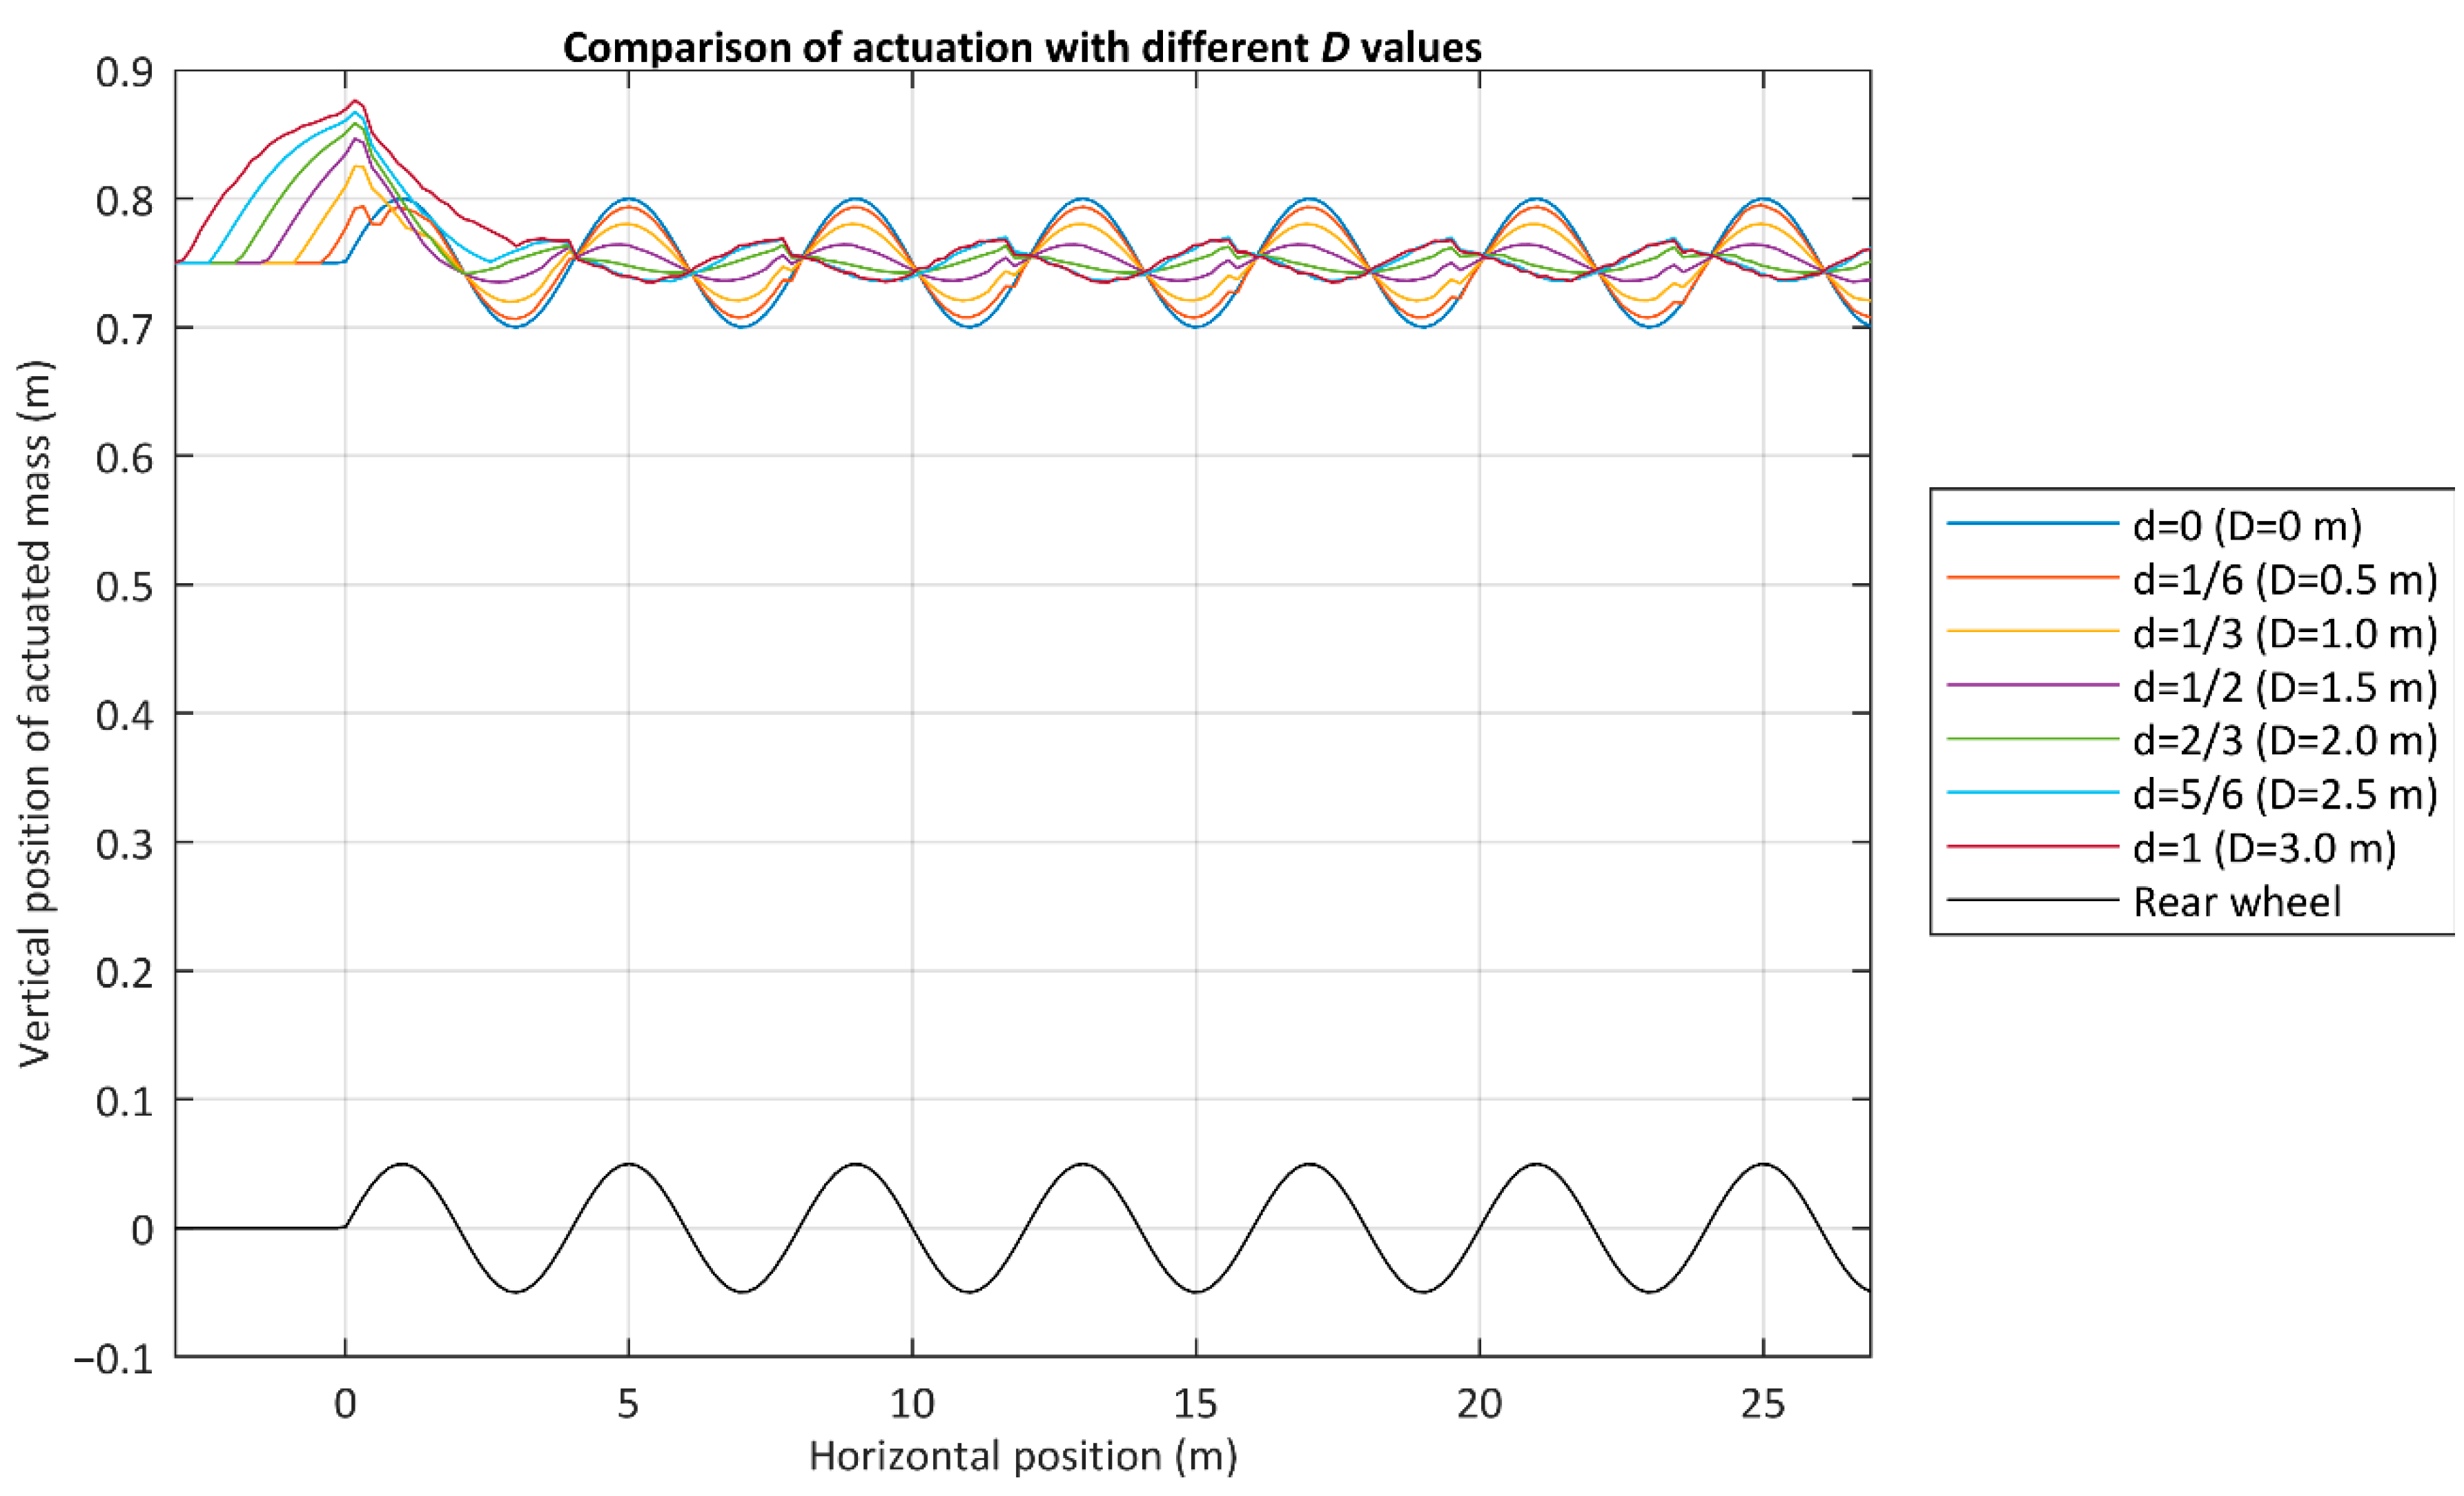
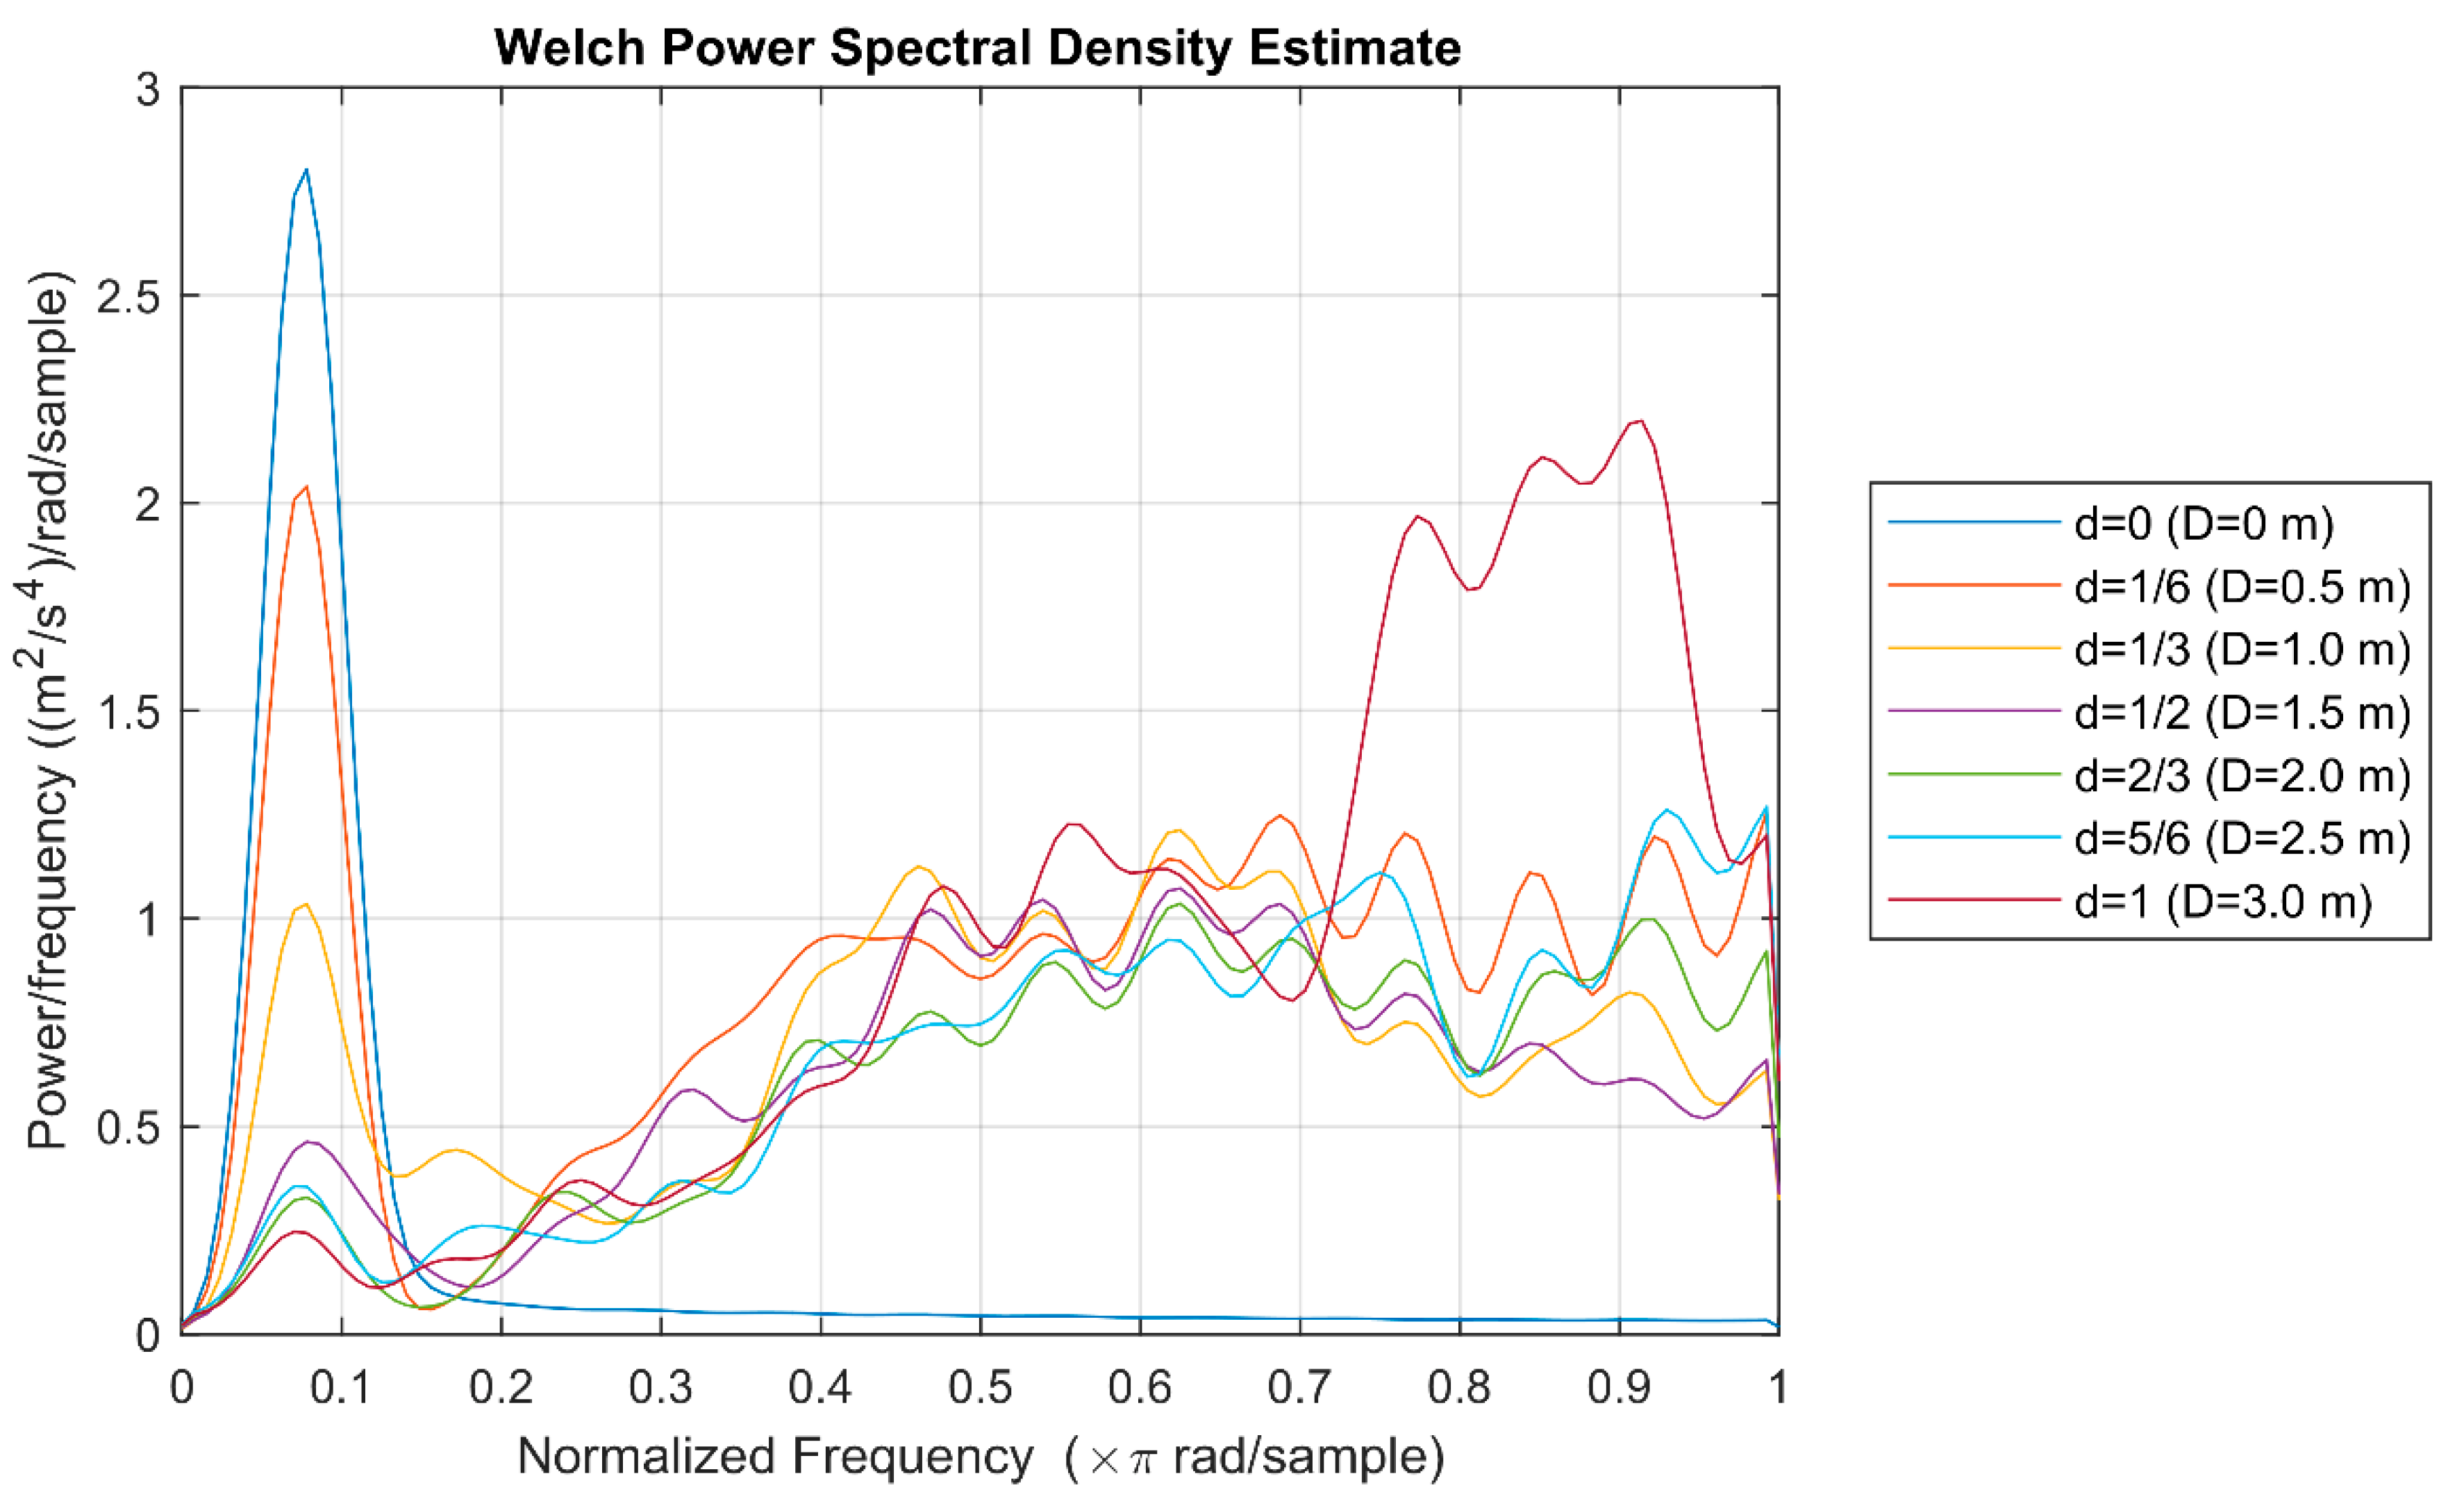
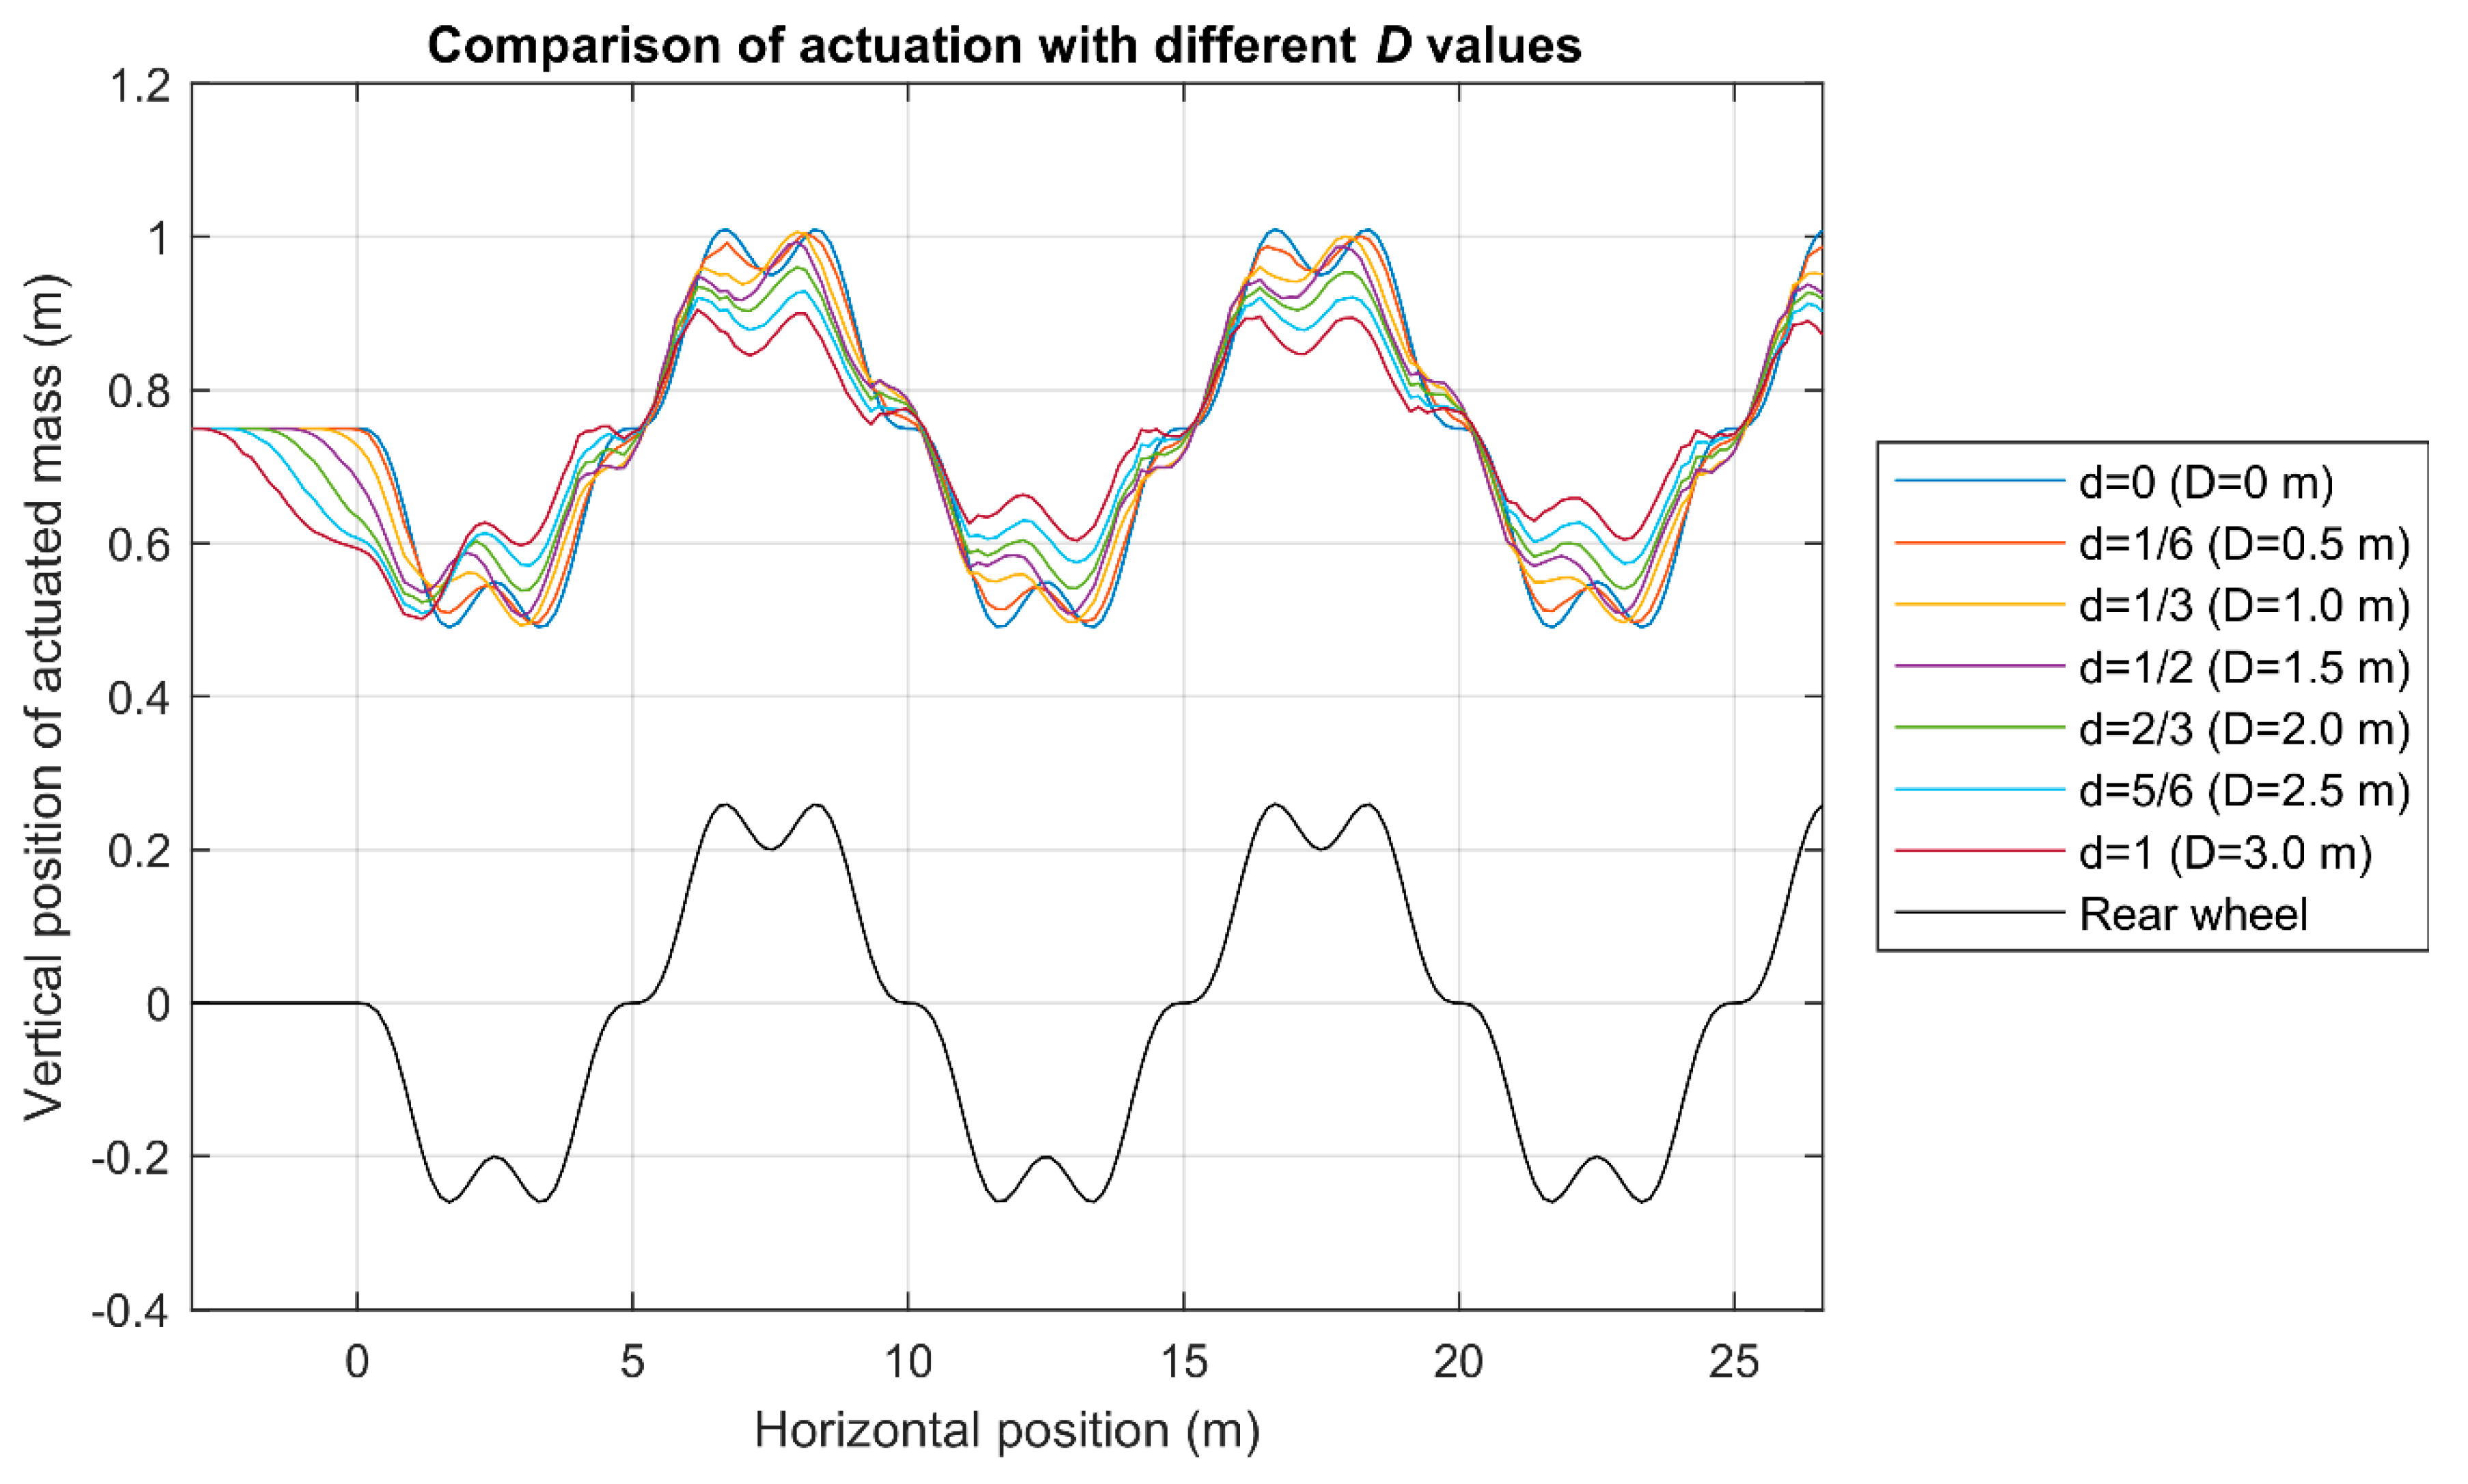
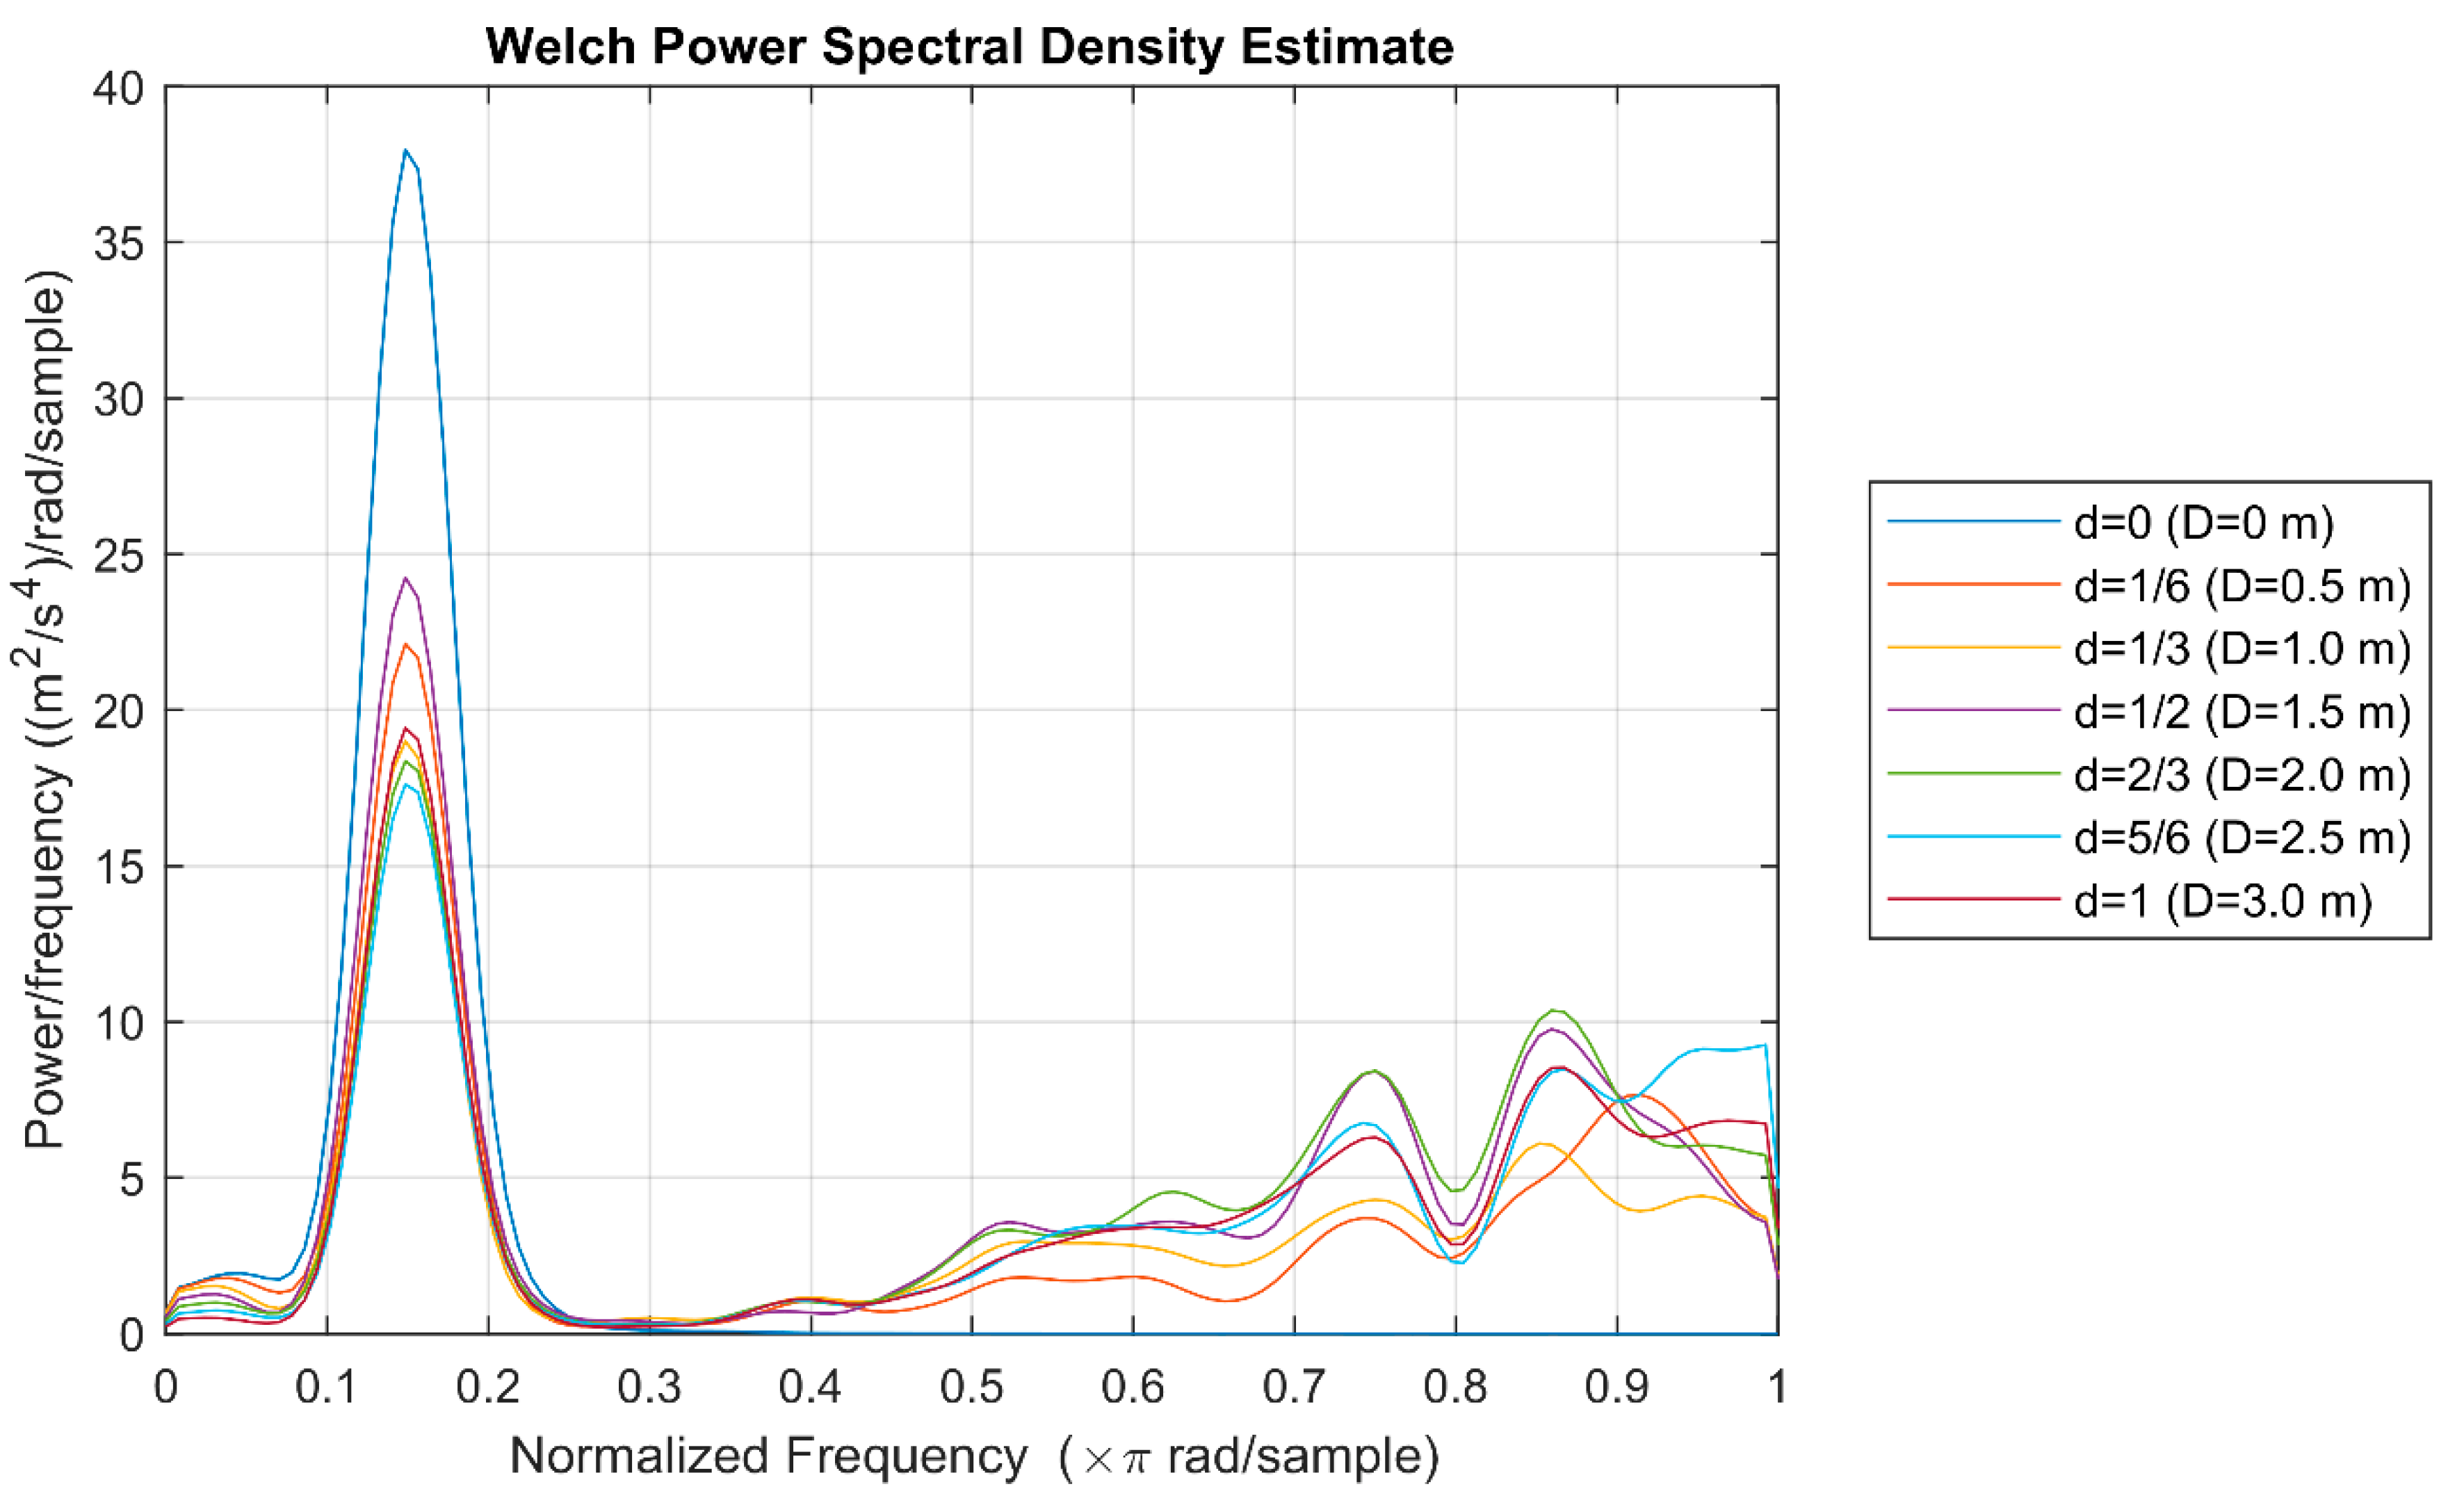
The vertical actuator (between the actuated or rear wheel and the sprung mass) has to maintain the latter at the objective height. In this approach, the objective height is the result of the moving average of the calculated height over the rolling distance 2D. Actually, the larger this distance, the softer the objective function, but also the bigger error is accumulated in calculating the height from the accelerometer reading. Thus, parameter “D” should be adjusted according to the kind of roughness the topography has (with the sole requirement not to exceed the distance between wheels).
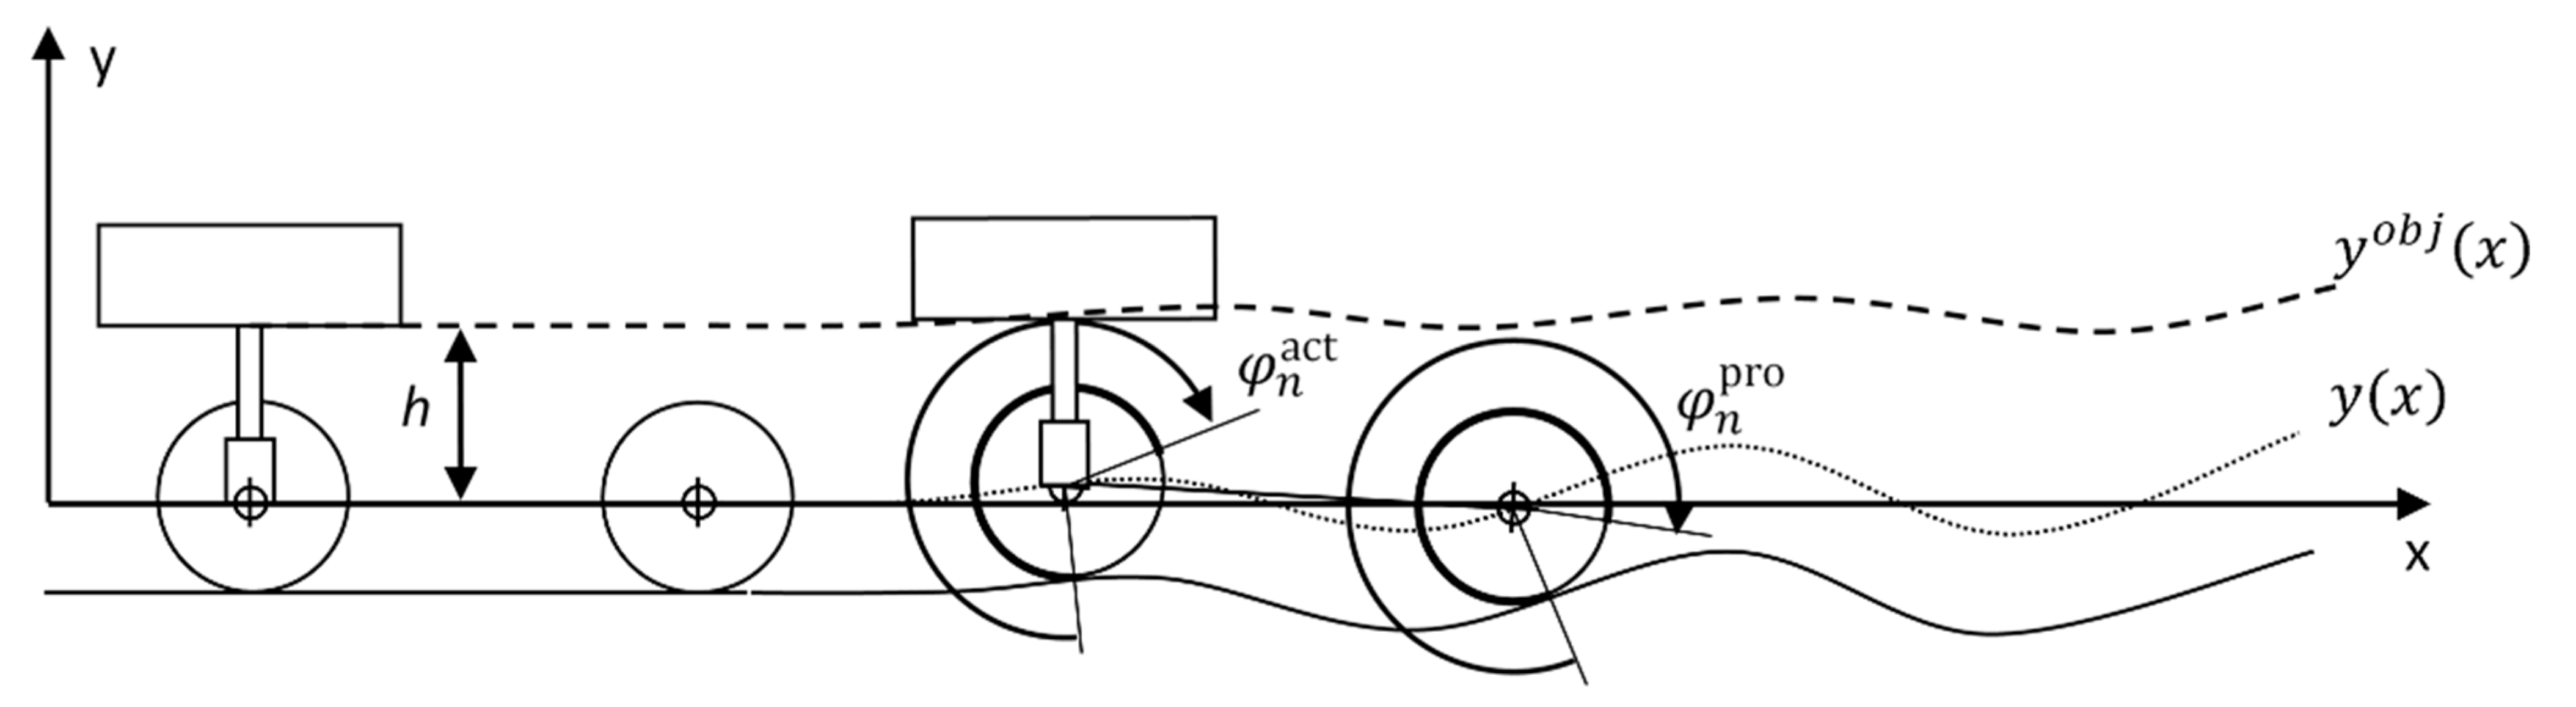
For the proposed algorithm, it is important to know exactly the position of both wheels (which are supposed to roll without slipping) on the ground. This is achieved by recording the corresponding angles, φ n p r o , φ n a c t (angle turned by the probe wheel, and actuated wheel, respectively), having set both to zero at the initial position (n = 0). The model is sketched in Figure 4 at the initial position and at the time t = nΔt. The actual trajectories followed by the center of the wheels and the trajectory the end of the actuator should follow are also represented.
At time t = nΔt, the vertical acceleration of the probe wheel, y ¨ n , and the angles turned by the wheels, are measured. Then, the velocity, y ˙ n , and vertical position, y n , are calculated by using Equations (18) and (19), respectively. All these values are recorded in a database in the way indicated in Table 3.
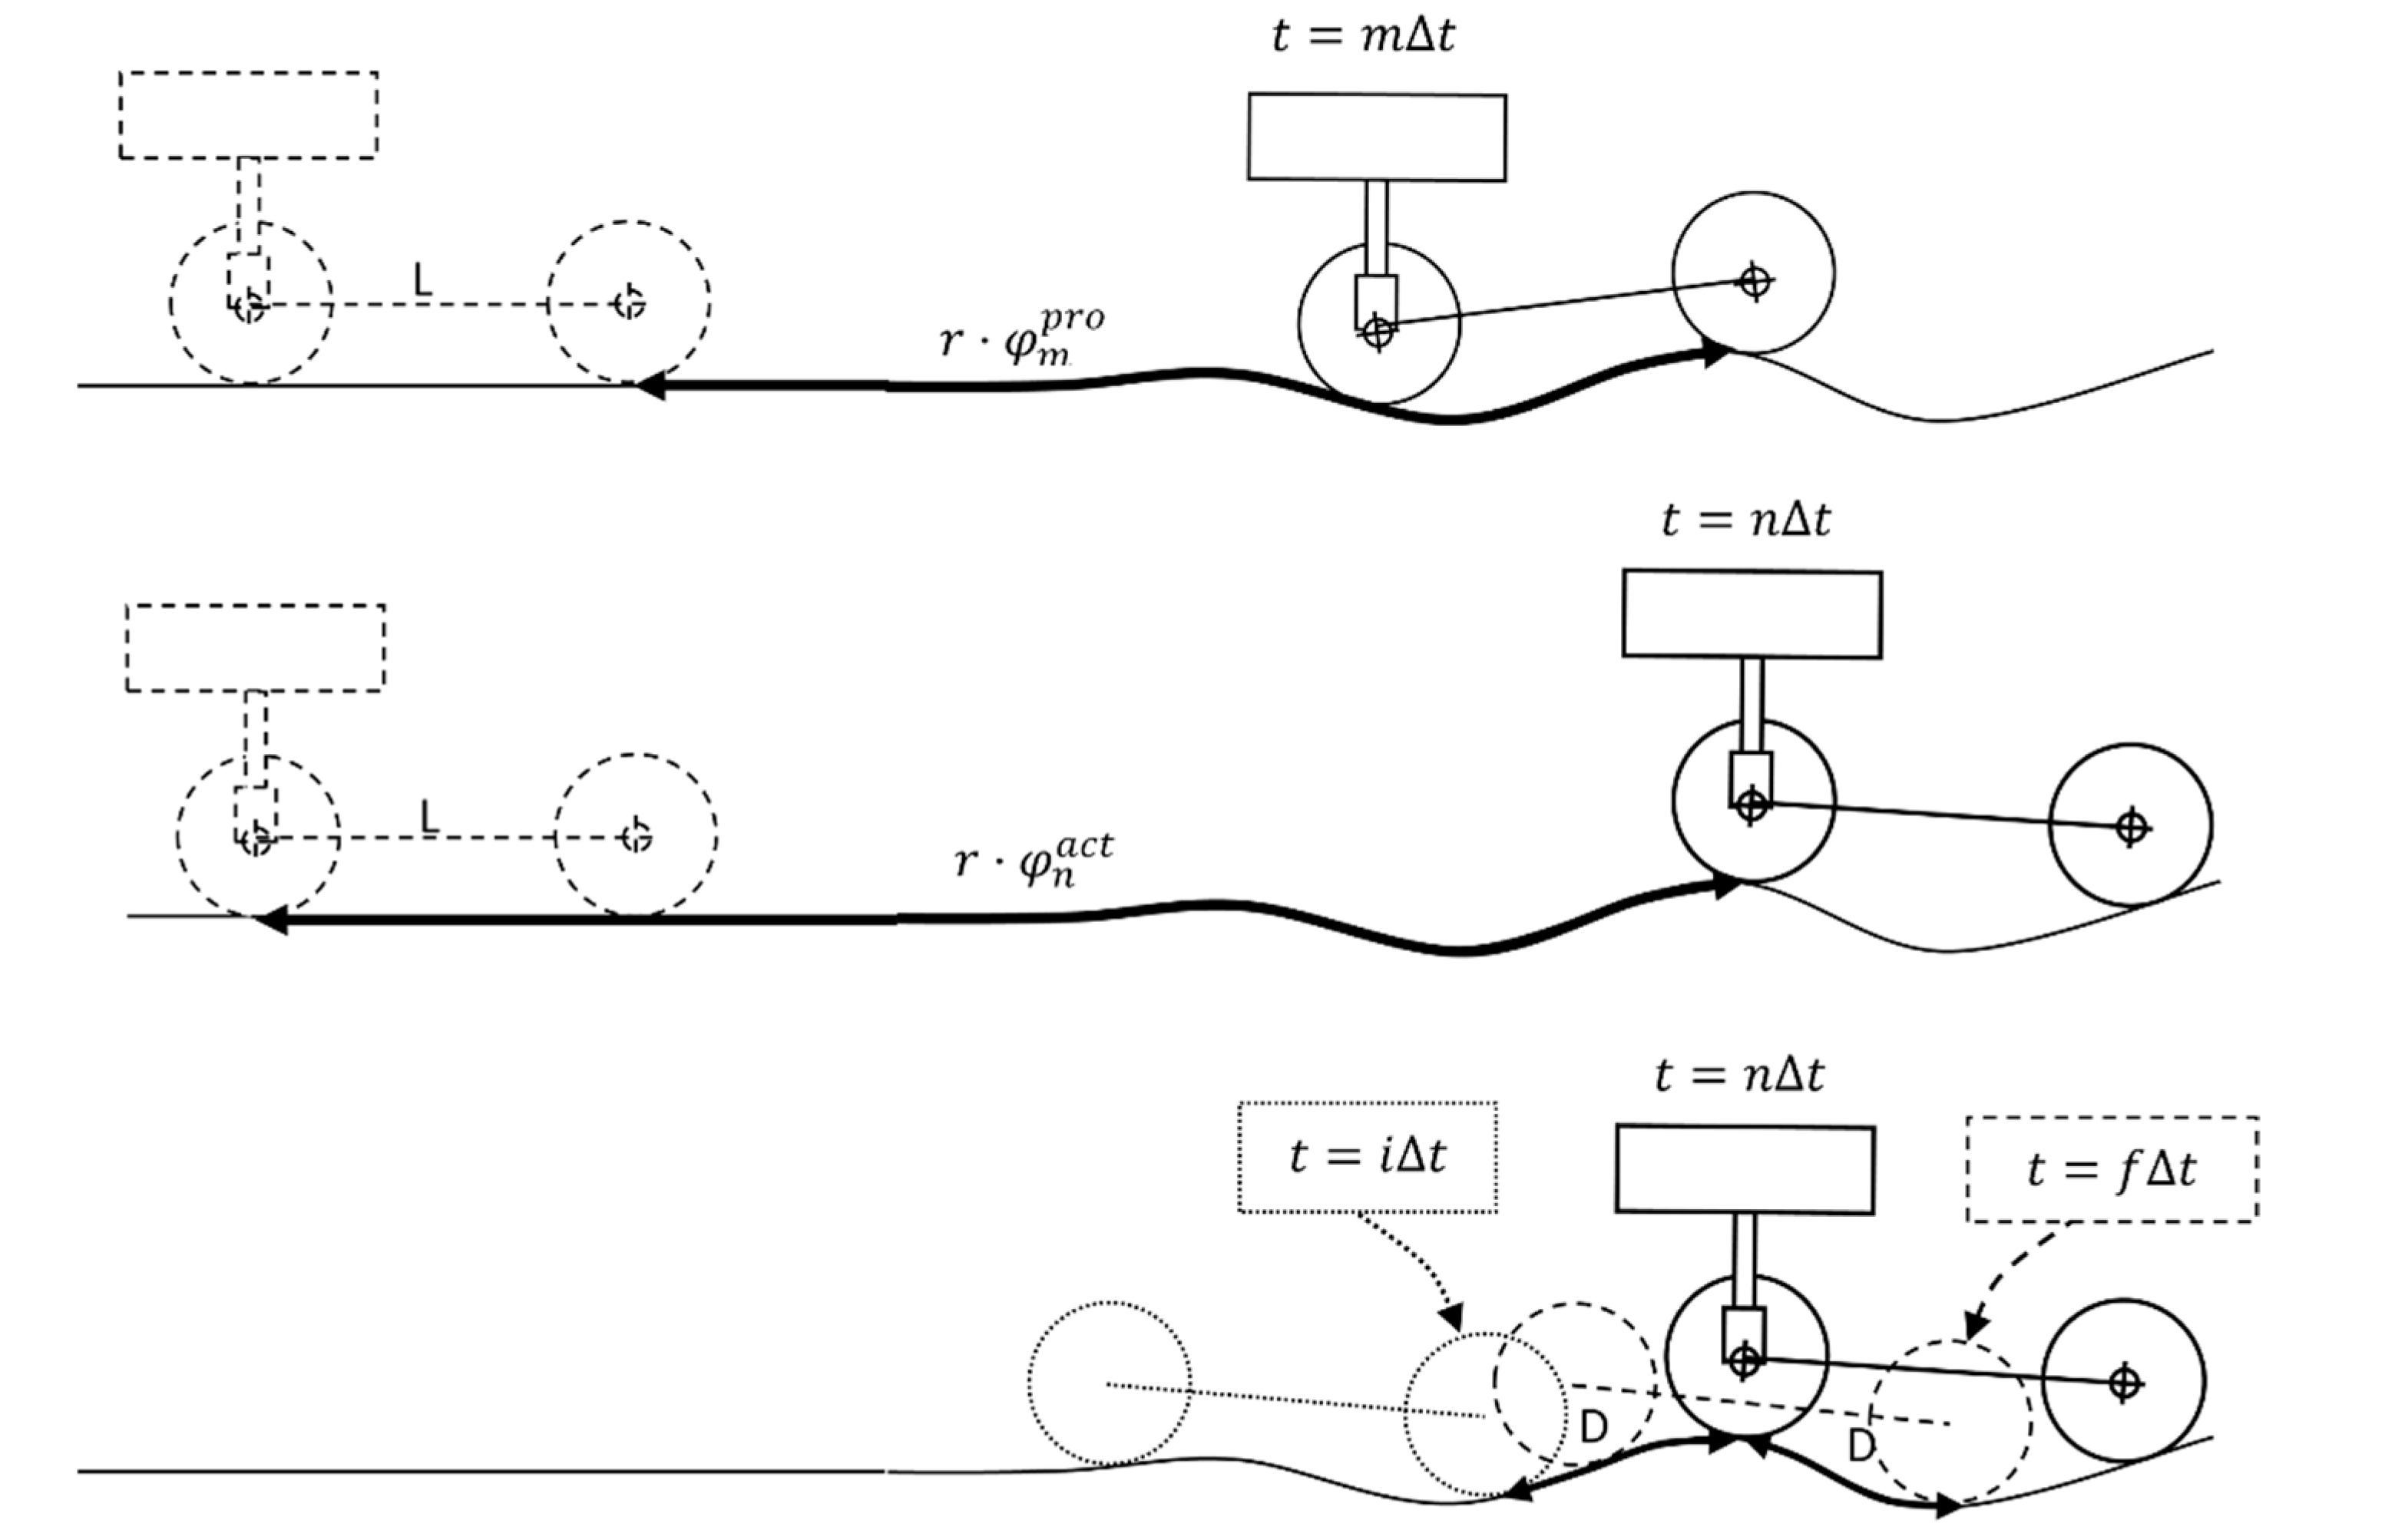
Once enough records have been acquired, the algorithm is ready to provide the current length to be taken by the actuator. The objective height is calculated as the moving average centered on the record corresponding to the actuated wheel and over a sufficient number of records; speaking in terms of rolling distances, the moving average is calculated over a rolling distance of 2D. This is achieved by identifying the records m, i and f that, respectively, define the current position for the actuated wheel and the first and last of the records to average over. In other words, at t = mΔt the probe wheel was just on the same point of the trajectory that the actuated wheel is at t = nΔt (i.e., at present). In Figure 5, the model at moments corresponding to records m, n, i and f is sketched.
On seeing Figure 5, if we consider both wheels have the same radius, r, the following rules for identifying the numbers m, i and f are deduced:
m is such that:
φ m p r o φ n a c t L r
i is such that:
φ i p r o φ m p r o D r φ n a c t L + D r
f is such that:
φ f p r o φ m p r o + D r φ n a c t + L + D r
With “≈” we mean “is the nearest value to” (note that φ j p r o is a discrete set of values, so in general, none of the last equalities could be exactly satisfied). We have also considered that the first section of the trajectory is flat and horizontal, with a minimum distance that is equal to the wheelbase, L.
Once the records i, m and f have been identified, the algorithm calculates the objective height (see Figure 6) as:
y o b j = 1 f i + 1 j = i f y j + h
and the actuated distance results:
y a c t = y o b j y m = 1 f i + 1 j = i f y j + h y m
where h is the initial objective height (i.e., the actuator initial length, see Figure 4 and Figure 6).
Finally, the database is refreshed by deleting the records with subscripts less than i, and decreasing the remainder subscripts in i units:
if j < i:, delete record
if j ≥ i, j = j − i
In this way, the database does not grow indefinitely, and only the records to be used by the algorithm at the current time of calculation remain.
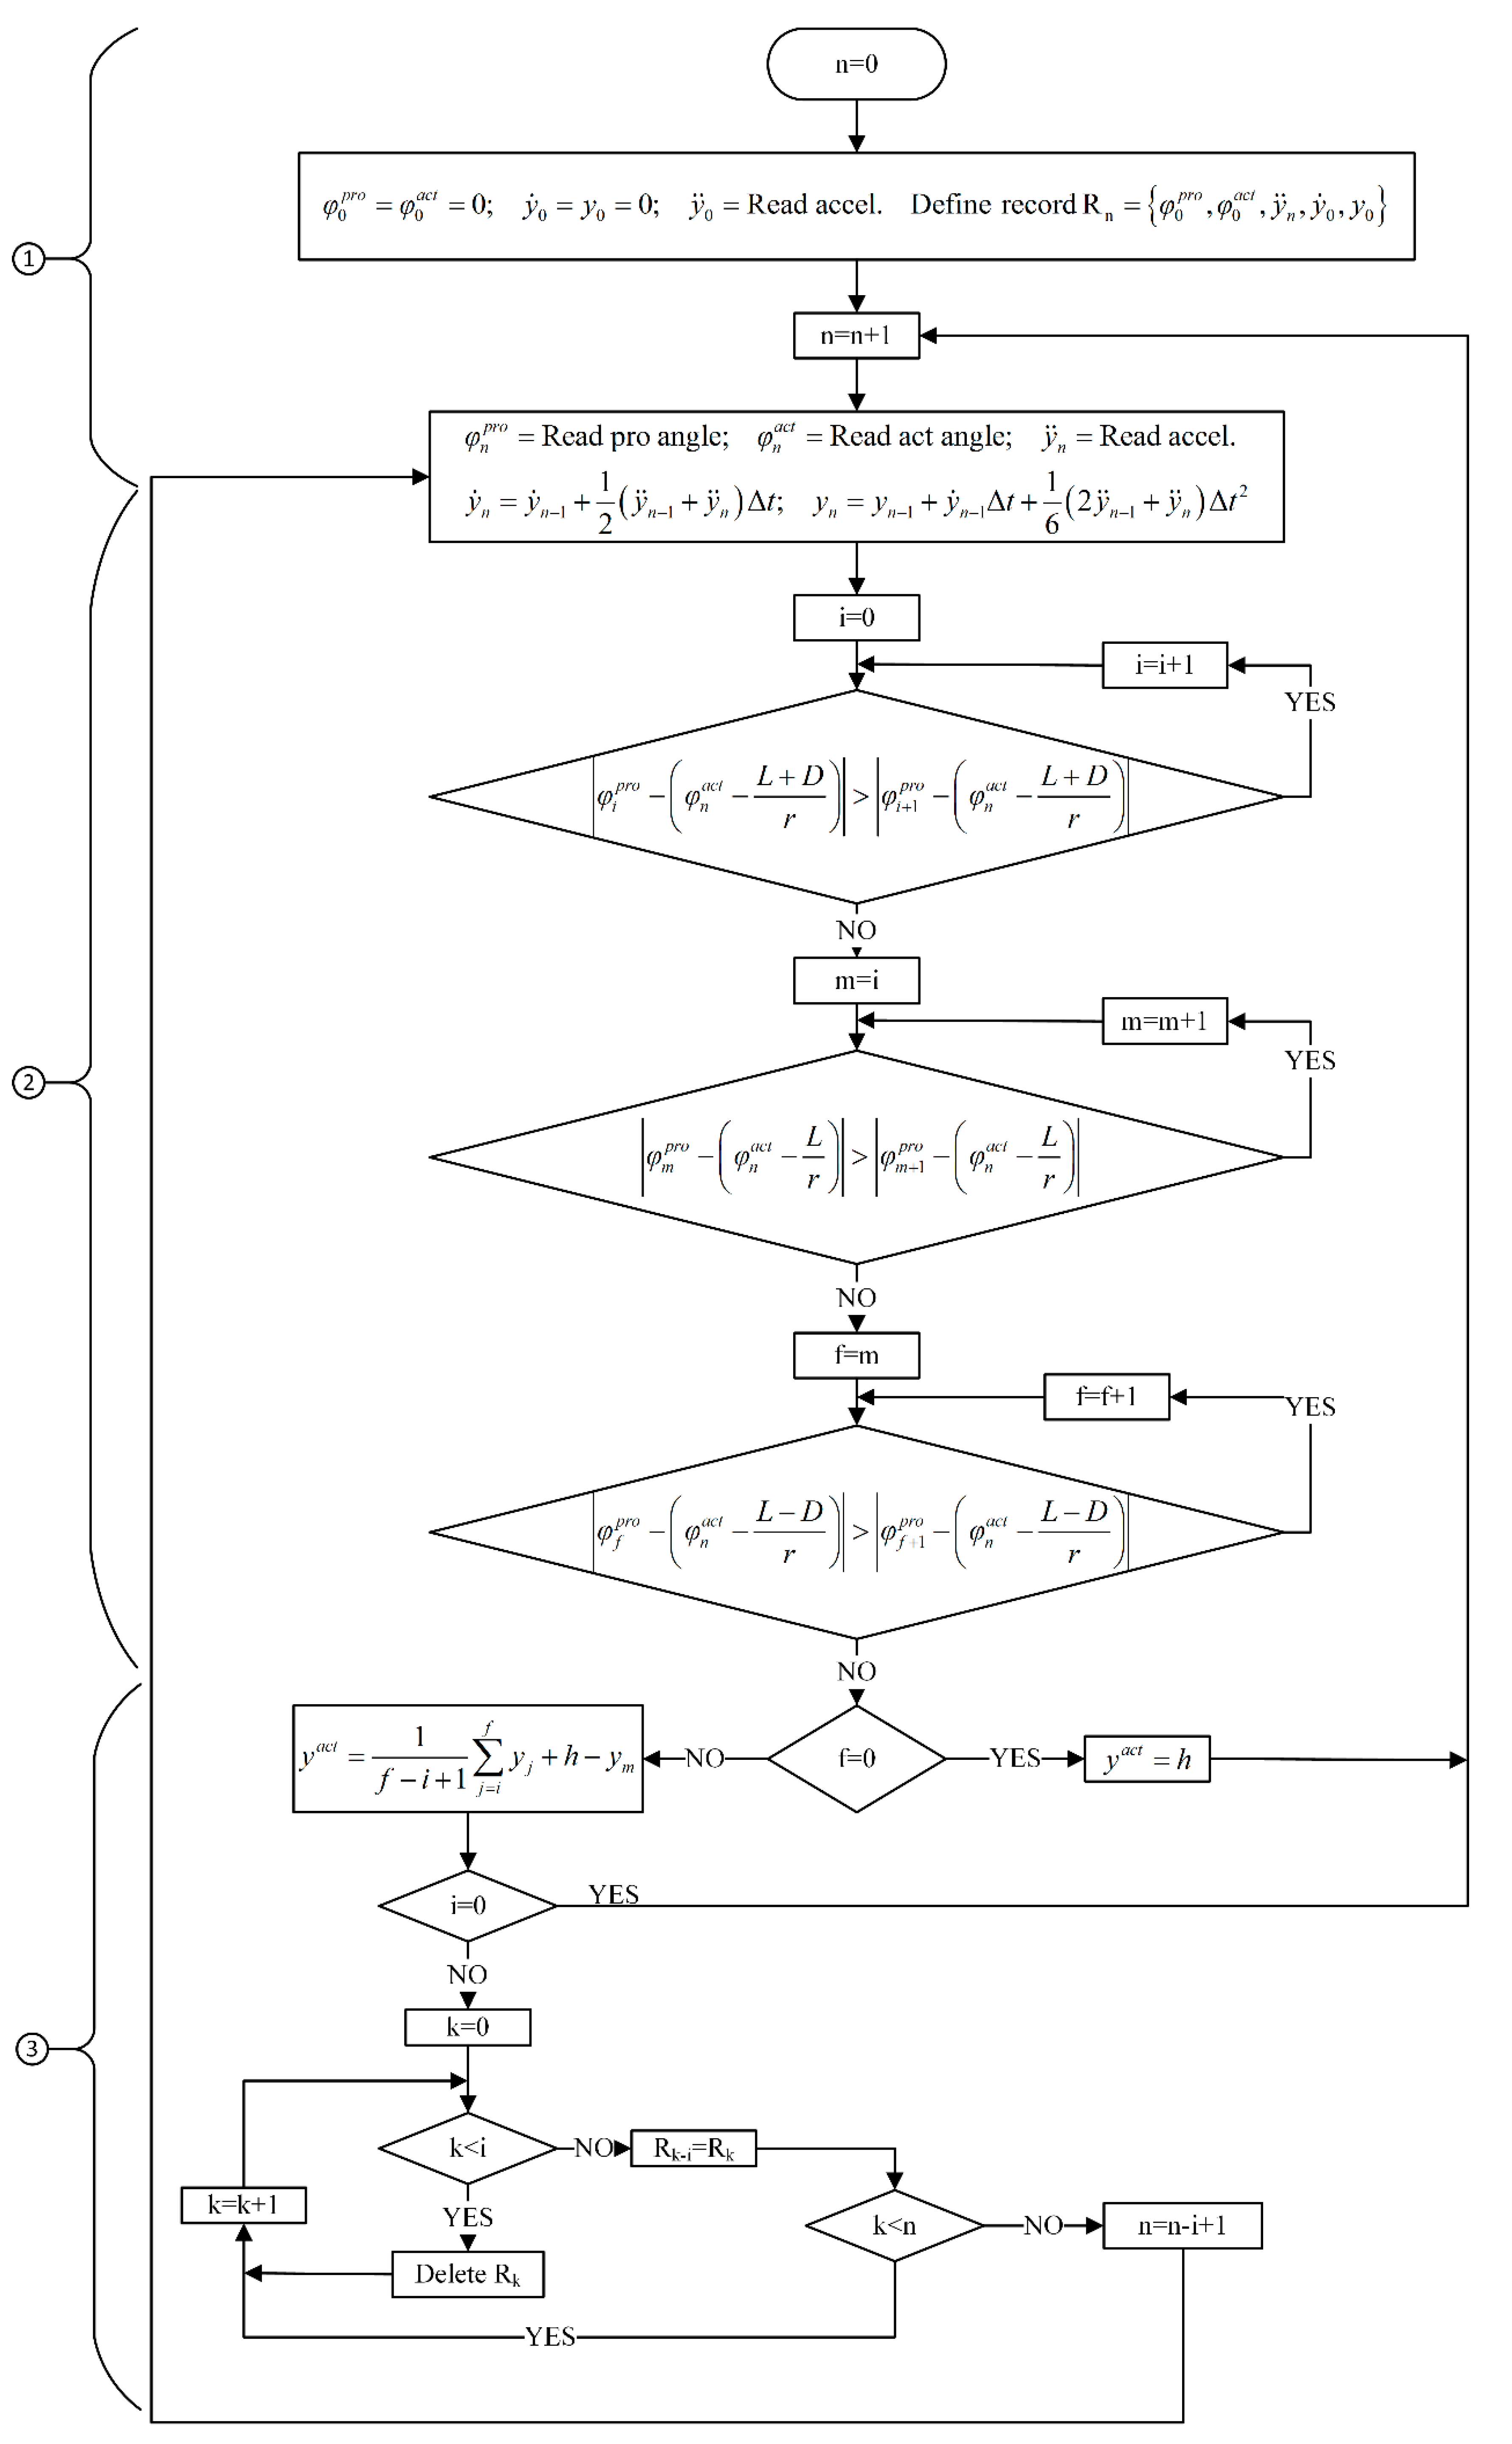
In summary, the algorithm can be considered as consisting of three tasks:
  • Reading (angles and vertical acceleration) and computing vertical velocity and position.
  • Identifying the indexes i, m and f.
  • Obtaining the actuated distance and refreshing the database.
To understand how the algorithm performs the second task, suppose the database at time nΔt is as shown in Table 4. For a given angle turned by the actuated wheel φ n a c t , the algorithm computes the theoretical angle turned by the probe wheel at the three key moments iΔt, mΔt and fΔt ( φ n a c t L + D r , φ n a c t L r and φ n a c t + L + D r , respectively), using Equations (20)–(22).Then, it searches the closest actual angles recorded in the database to those computed and determines the indexes i, m and f. As the probe wheel angle turned does not decrease with n (hence i ≤ m ≤ f), the search can be performed sequentially.
The whole algorithm flowchart is represented in Figure 7.

2.3. Implementation in Simulink

The models described above to define the kinematics of the 1/2 vehicle and the suspension algorithm are implemented in Simulink, and more specifically, in Simscape. The main diagram is shown in Figure 8 and is composed of six big blocks. The input block is the “Ground function” block, which defines the parameters of the trajectory that the vehicle must follow. The “Energy” block performs all the calculations (Equations (1)–(13)) to compute the kinematics of the half vehicle model. Front and rear wheel blocks contain the relationships between the wheel bodies and the main reference frame of Simscape. The rear wheel block also has the actuator to move the sprung mass according to the commands given by the suspension algorithm. The computation of the rotation angles turned by both wheels is carried out within the rotation block. Finally, the block “Suspension algorithm” performs all the calculations (Equations (14)–(21)) to actuate the sprung mass.
The ”Energy” block is composed of another block called “Calculations”, which is the block that actually computes the kinematics of the model. The inputs of this block are the ground profile, the wheel properties and the position of the front wheel. The outputs of this block are the kinematics of both wheels. Within this block, an S-function is responsible for executing the algorithms that compute the kinematics. To perform this action, this function is feedbacked with the positions and velocities computed in the previous integration step.

3. Results

This section presents the results obtained after testing the predictive suspension algorithm over the two ground topographies defined in Section 2.1. The first topography (profile 1) simulates a wiggly surface; the second topography is a combination of two sinusoidal irregularities. The parameters of both topographies are summarized in Table 2.
As is described in Section 2.2, the algorithm’s key parameter to define the motion of the sprung or actuated mass is the distance “D”. This parameter is set from D = 0 m (no actuation over the sprung mass) to D = 3 m (the vehicle’s wheelbase) in steps of 0.5 m. Hence, seven values of “D” were tested.
Additionally, the parameter “D” is normalized to the wheelbase of the vehicle by defining a new variable d = D/L, where L is the wheelbase. As the value of the “D” is limited by the wheelbase (it is not possible to obtain information on positions not yet traveled by the front wheel), the value of “d” will always be between 0 and 1.

3.1. Profile Type 1

The results of the simulation of the first ground profile are shown in Figure 9, Figure 10, Figure 11 and Figure 12. Figure - illustrates the kinematics of both wheels of the 1/2 vehicle. The trajectory of both wheels follows the input ground profile as expected. The velocity in both axes varies according to the topography of the ground profile and the energy conservation. Similar behavior is noticed in the accelerations. The significant acceleration peak at the horizontal position equal to 0 is due to the sudden transition from flat terrain to an irregular surface.
The displacement of the actuator placed between the rear wheel and the sprung mass is plotted in Figure 10. As it can be seen, the actuator does not move when the value of the normalized parameter “d” is 0. When increasing the value of this parameter, the actuator moves to compensate for the irregularities of the ground, which even leads to a wave out phased 180º to the ground profile. Lower values of parameter “d ”yield smaller displacements of the actuator, though it also generates some discontinuities. Larger values of parameter “d” depict better an out phased trajectory from the terrain, but the amplitude of the movement is larger too. The actuator always works in extension (positive displacement) at the beginning of these simulations due to the initial elevation of the front wheel.
Figure 11 shows the path followed by the center of the rear wheel and the position of the actuated mass for a better comparison of the followed trajectory and the actuation of the suspension system. It is observed that the movement of the sprung mass is the opposite of the rear wheel when the parameter “d” is larger than 2/3, that is, when the distance “D” over which the moving average is computed is larger than 2 m. In this situation, when the rear wheel moves upwards, the sprung mass is moved downwards, and vice versa. For values of parameter “D” below 2 m (d < 2/3), the sprung mass moves vertically in the same direction as the rear wheel, but this movement is limited.
In order to establish what is the best value of the normalized parameter “d” among all the tested and for ground profile 1, the spectra of the vertical accelerations experienced by the sprung mass are computed. The results obtained are plotted in Figure 12. The analysis of the graph shows that the largest values of the parameter “d” yield the lowest accelerations at low frequencies; however, it appears to be an undesirable vibration at high frequencies; therefore, according to this criterion, the best value will be one that obtains the best arrangement between low and high-frequency vibrations.
To make easier the search for the optimum value of parameter “d”, Table 5 summarizes the maximum amplitude and the RMS of the spectra shown in Figure 12. Combining the spectra and the data in the table, it can be concluded that the best value for parameter “d” in the conditions of this simulation is d = 2/3, which means the distance D = 2 m.

3.2. Profile Type 2

The results obtained from the simulation of the second ground profile are shown in Figure 13, Figure 14, Figure 15 and Figure 16. Figure 13 displays the kinematics of both wheels of the 1/2 vehicle. As in the previous case, the trajectory of both wheels follows the input ground profile as expected. The speed varies according to the topography of the ground profile and the energy conservation. Velocity variations are slower on the horizontal axis than on the vertical axis, where the velocity is more sensitive to profile variations. Similar behavior is noticed in the accelerations, being the vertical accelerations larger than the horizontal ones.
The displacement of the actuator is plotted in Figure 14. As it can be seen, the actuator does not move when the value of the parameter “d” is zero. Once the simulation begins, the actuator starts to move in compression (negative displacement) to compensate initial descent of the vehicle. As it happens in the first set of simulations, the larger the value of the parameter “d”, the larger the displacement of the actuator. The use of the largest values results in an actuation that clearly highlights the two harmonics that compose the second ground profile.
Figure 15 shows the path followed by the center of the rear wheel and the position of the actuated mass for a better comparison of the followed trajectory and the actuation of the suspension system. The movement of the mass follows the movement of the rear wheel, but the larger the value of “d”, the smoother the displacement of the actuated mass. In fact, the algorithm moves the mass in advance to the irregularity of the surface the vehicle will encounter to try to achieve a smoother ride.
The PSD of the vertical accelerations experienced by the sprung mass through the second ground profile is computed to establish what is the best value of the parameter “d” among all the tested values. The results obtained are plotted in Figure 16. As was seen in the previous subsection, there is a big peak at low frequencies and also some undesirable accelerations at high frequencies; however, in this set of simulations, a larger value of the parameter “d” does not mean lower acceleration amplitudes at low frequencies. In fact, larger acceleration amplitudes are achieved with d = 1 than with d = 5/6, which indicates that moving the sprung mass in advance to the terrain elevation is not as good as it can be expected.
Once again, to make easier the search for the optimum value of parameter “d”, the maximum amplitude and the RMS of the spectra are summarized in Table 6. Combining the spectra and the numbers in the table, it can be concluded that the best value for parameter “d” in the conditions of this simulation is d = 5/6, as it achieves the lowest maximum amplitude and RMS values. The normalized parameter d = 5/6 means that the distance “D” is equal to 2.5 m.

4. Conclusions

This paper presents a predictive suspension algorithm for land vehicles traveling through a deterministic topography. Prior to the virtual implementation of the algorithm, the kinematics of a two-wheel 2D (1/2) vehicle were proposed and solved. The algorithm inputs are the measurements given by a position scanner installed in the first wheel of the vehicle. From these inputs, the algorithm reconstructs the terrain and averages its height over a distance “D”. Then, it generates the command for moving the actuator installed in the rear wheel and connected to the sprung mass. Both the algorithm and the kinematic model of the 1/2 vehicle were implemented in Simulink.
The algorithm was tested on two terrains with different profiles. Furthermore, sensitivity analyses were carried out in order to establish the best value of the parameter “D” in each profile. The performance of the algorithm is quantified for several values of the parameter “D”, using the spectral analysis of the accelerations experienced by the sprung mass.
The results show that, in general, increasing the parameter “D” reduces the motion of the sprung/actuated mass and, hence, improves comfort; however, there is an optimum value of the parameter “D” for each ground profile, and this value does not coincide necessarily with the highest value of “D”. In fact, the optimum “D” value will depend on the terrain irregularities and their characteristic length. For the first ground profile, the optimum value of the parameter “D” is 2 m (d = 2/3), which is half the wavelength of the unevenness of the terrain. The optimum value for the second terrain is D = 2.5 m (d = 5/6).
The value of the “D” parameter is limited by the wheelbase since it is not possible to obtain information on positions not yet traveled by the front wheel. In fact, the maximum value of the “D” parameter must be slightly less than the wheelbase, as the data processing and calculation time of the algorithm must be taken into account. This is not of major significance in the current development status of the research as the Simulink implementation computes the algorithm in real-time, but it should be taken into account when developing the physical device to install in a light vehicle for real testing.
Finally, it can be concluded that the algorithm works correctly and decreases the movement of the sprung/actuated mass when the vehicle travels through a deterministic topography. The next steps in the research would be the development of a physical device that executes the proposed predictive algorithm and its implementation in a light vehicle.

Author Contributions

Individual contributions are as follows: original concept: J.M.; mathematical development: J.M. and A.B.; implementation, simulation and draft preparation: A.B.; review, editing, validation, and formal analysis: E.S.-H., H.R. and J.M. All authors have read and agreed to the published version of the manuscript.

Funding

The research work described in this paper is part of the R&D and Innovation projects MC4.0 PID2020-116984RB-C21 and MC4.0 PID2020-116984RB-C22 supported by the MCIN/AEI/10.13039/501100011033.

Institutional Review Board Statement

Not applicable.

Informed Consent Statement

Not applicable.

Data Availability Statement

Not applicable.

Conflicts of Interest

The authors declare no conflict of interest.

References

  1. Reimpell, J.; Stoll, H.; Betzler, J.W. The Automotive Chassis: Engineering Principles, 2nd ed.; Butterworth Heinemann: Oxford, UK, 2001; ISBN 978-0-7506-5054-0. [Google Scholar]
  2. Theunissen, J.; Tota, A.; Gruber, P.; Dhaens, M.; Sorniotti, A. Preview-Based Techniques for Vehicle Suspension Control: A State-of-the-Art Review. Annu. Rev. Control 2021, 51, 206–235. [Google Scholar] [CrossRef]
  3. Luo, R.; Shi, H.; Guo, J.; Huang, L.; Wang, J. A Nonlinear Rubber Spring Model for the Dynamics Simulation of a High-Speed Train. Veh. Syst. Dyn. 2020, 58, 1367–1384. [Google Scholar] [CrossRef]
  4. Anubi, O.M.; Patel, D.R.; Crane, C.D., III. A New Variable Stiffness Suspension System: Passive Case. Mech. Sci. 2013, 4, 139–151. [Google Scholar] [CrossRef] [Green Version]
  5. Kalyan Raj, A.H.; Padmanabhan, C. A New Passive Non-Linear Damper for Automobiles. Proc. Inst. Mech. Eng. Part J. Automob. Eng. 2009, 223, 1435–1443. [Google Scholar] [CrossRef]
  6. Solomon, U.; Padmanabhan, C. Hydro-Gas Suspension System for a Tracked Vehicle: Modeling and Analysis. J. Terramech. 2011, 48, 125–137. [Google Scholar] [CrossRef]
  7. Fu, B.; Giossi, R.L.; Persson, R.; Stichel, S.; Bruni, S.; Goodall, R. Active Suspension in Railway Vehicles: A Literature Survey. Railw. Eng. Sci. 2020, 28, 3–35. [Google Scholar] [CrossRef] [Green Version]
  8. Anubi, O.M.; Crane, C.A. New Semiactive Variable Stiffness Suspension System Using Combined Skyhook and Nonlinear Energy Sink-Based Controllers. IEEE Trans. Control Syst. Technol. 2015, 23, 937–947. [Google Scholar] [CrossRef]
  9. Sun, S.; Deng, H.; Li, W. Variable Stiffness and Damping Suspension System for Train. In Proceedings of the SPIE Volume 9057, Active and Passive Smart Structures and Integrated Systems 2014, San Diego, CA, USA, 9–13 March 2014; p. 90570P. [Google Scholar]
  10. Faraj, R.; Graczykowski, C.; Holnicki-Szulc, J. Adaptable Pneumatic Shock Absorber. J. Vib. Control 2019, 25, 711–721. [Google Scholar] [CrossRef]
  11. Spencer, B.F.; Dyke, S.J.; Sain, M.K.; Carlson, J.D. Phenomenological Model for Magnetorheological Dampers. J. Eng. Mech. 1997, 123, 230–238. [Google Scholar] [CrossRef]
  12. Gavin, H.P.; Hanson, R.D.; Filisko, F.E. Electrorheological Dampers, Part I: Analysis and Design. J. Appl. Mech. 1996, 63, 669–675. [Google Scholar] [CrossRef]
  13. Dixon, J. The Shock Absorber Handbook; John Wiley & Sons, Ltd.: Hoboken, NJ, USA, 2008; ISBN 978-0-470-51642-3. [Google Scholar]
  14. Mei, T.X.; Zaeim, A.; Li, H. Control of Railway Wheelsets—A Semi-Active Approach. In Advances in Dynamics of Vehicles on Roads and Tracks; Klomp, M., Bruzelius, F., Nielsen, J., Hillemyr, A., Eds.; Lecture Notes in Mechanical Engineering; Springer International Publishing: Cham, Swizerland, 2020; pp. 16–23. ISBN 978-3-030-38076-2. [Google Scholar]
  15. Yang, J.; Ning, D.; Sun, S.S.; Zheng, J.; Lu, H.; Nakano, M.; Zhang, S.; Du, H.; Li, W.H. A Semi-Active Suspension Using a Magnetorheological Damper with Nonlinear Negative-Stiffness Component. Mech. Syst. Signal Process. 2021, 147, 107071. [Google Scholar] [CrossRef]
  16. Tudon-Martinez, J.C.; Hernandez-Alcantara, D.; Amezquita-Brooks, L.; Morales-Menendez, R.; Lozoya-Santos, J.D.J.; Aquines, O. Magneto-Rheological Dampers—Model Influence on the Semi-Active Suspension Performance. Smart Mater. Struct. 2019, 28, 105030. [Google Scholar] [CrossRef] [Green Version]
  17. Soliman, A.; Kaldas, M. Semi-Active Suspension Systems from Research to Mass-Market—A Review. J. Low Freq. Noise Vib. Act. Control 2021, 40, 1005–1023. [Google Scholar] [CrossRef] [Green Version]
  18. Karnopp, D. Permanent Magnet Linear Motors Used as Variable Mechanical Dampers for Vehicle Suspensions. Veh. Syst. Dyn. 1989, 18, 187–200. [Google Scholar] [CrossRef]
  19. Smith, M.C. Synthesis of Mechanical Networks: The Inerter. IEEE Trans. Autom. Control 2002, 47, 1648–1662. [Google Scholar] [CrossRef] [Green Version]
  20. Lewis, T.D.; Jiang, J.Z.; Neild, S.A.; Gong, C.; Iwnicki, S.D. Using an Inerter-Based Suspension to Improve Both Passenger Comfort and Track Wear in Railway Vehicles. Veh. Syst. Dyn. 2019, 58, 472–493. [Google Scholar] [CrossRef]
  21. Kawamoto, Y.; Suda, Y.; Inoue, H.; Kondo, T. Electro-Mechanical Suspension System Considering Energy Consumption and Vehicle Manoeuvre. Veh. Syst. Dyn. 2008, 46, 1053–1063. [Google Scholar] [CrossRef]
  22. Klimenko, Y.I.; Batishchev, D.V.; Pavlenko, A.; Grinchenkov, V.P. Design of a Linear Electromechanical Actuator with an Active Vehicle Suspension System. Russ. Electr. Eng. 2015, 86, 588–593. [Google Scholar] [CrossRef]
  23. Kilicaslan, S. Control of Active Suspension System Considering Nonlinear Actuator Dynamics. Nonlinear Dyn. 2018, 91, 1383–1394. [Google Scholar] [CrossRef]
  24. Goodall, R.; Freudenthaler, G.; Dixon, R. Hydraulic Actuation Technology for Full- and Semi-Active Railway Suspensions. Veh. Syst. Dyn. 2014, 52, 1642–1657. [Google Scholar] [CrossRef] [Green Version]
  25. Goodall, R. Tilting Trains and Beyond-the Future for Active Railway Suspensions. 1. Improving Passenger Comfort. Comput. Control Eng. J. 1999, 10, 153–160. [Google Scholar] [CrossRef]
  26. Carballeira, J.; Baeza, L.; Rovira, A.; García, E. Technical Characteristics and Dynamic Modelling of Talgo Trains. Veh. Syst. Dyn. 2008, 46, 301–316. [Google Scholar] [CrossRef]
  27. Jamil, I.A.A.; Moghavvemi, M. Optimization of PID Controller Tuning Method Using Evolutionary Algorithms. In Proceedings of the 2021 Innovations in Power and Advanced Computing Technologies (i-PACT), Kuala Lumpur, Malaysia, 27–29 November 2021; pp. 1–7. [Google Scholar]
  28. Di Gialleonardo, E.; Facchinetti, A.; Bruni, S. Control of an Integrated Lateral and Roll Suspension for a High-Speed Railway Vehicle. Veh. Syst. Dyn. 2022, 1–27. [Google Scholar] [CrossRef]
  29. Rodriguez-Guevara, D.; Favela-Contreras, A.; Beltran-Carbajal, F.; Sotelo, D.; Sotelo, C. Active Suspension Control Using an MPC-LQR-LPV Controller with Attraction Sets and Quadratic Stability Conditions. Mathematics 2021, 9, 2533. [Google Scholar] [CrossRef]
  30. Palanisamy, S.; Karuppan, S. Fuzzy Control of Active Suspension System. J. Vibroeng. 2016, 18, 3197–3204. [Google Scholar] [CrossRef] [Green Version]
  31. Díaz-Choque, C.S.; Félix-Herrán, L.C.; Ramírez-Mendoza, R.A. Optimal Skyhook and Groundhook Control for Semiactive Suspension: A Comprehensive Methodology. Shock Vib. 2021, 2021, 8084343. [Google Scholar] [CrossRef]
  32. Boada, B.L.; Boada, M.J.L.; Vargas-Melendez, L.; Diaz, V. A Robust Observer Based on H ∞ Filtering with Parameter Uncertainties Combined with Neural Networks for Estimation of Vehicle Roll Angle. Mech. Syst. Signal Process. 2018, 99, 611–623. [Google Scholar] [CrossRef] [Green Version]
Figure 1. Flowchart for computing the position of the rear wheel.
Mathematics 10 01467 g001
Figure 2. Flowchart for computing the angular speeds.
Mathematics 10 01467 g002
Figure 3. Two kinds of terrain defects: (a) peak defects and (b) smooth or corrugated terrain.
Mathematics 10 01467 g003
Figure 4. Model of the vehicle sketched at the initial position (t = 0) and at the time t = nΔt, where the angles are indicated. Dotted and dashed curves represent respectively the actual trajectory followed by the center of the wheels and that the actuated mass should follow.
Mathematics 10 01467 g004
Figure 5. Sketch of the model at the key moments for the algorithm: at the initial position (dashed line in (up) and (middle) diagrams); when the record m is being registered (up); when the record n is being registered (middle); when the record i is being registered (dotted line, (down)); when the record f is being registered (dash line, (down)).
Mathematics 10 01467 g005
Figure 6. Heights that are involved in the calculus of the actuated distance.
Mathematics 10 01467 g006
Figure 7. Suspension algorithm flowchart.
Mathematics 10 01467 g007
Figure 8. Diagram of the Simulink implementation of the whole model.
Mathematics 10 01467 g008
Figure 9. Kinematics of the vehicle when traveling through the ground profile 1.
Mathematics 10 01467 g009
Figure 10. The motion of the actuator in the first ground profile.
Mathematics 10 01467 g010
Figure 11. Displacement of the actuated mass in the first ground profile.
Mathematics 10 01467 g011
Figure 12. Acceleration spectra of the actuated mass in the first ground profile tested.
Mathematics 10 01467 g012
Figure 13. Kinematics of the vehicle when traveling through the second ground profile.
Mathematics 10 01467 g013
Figure 14. The motion of the actuator in the first ground profile.
Mathematics 10 01467 g014
Figure 15. Displacement of the actuated mass in the second ground profile tested.
Mathematics 10 01467 g015
Figure 16. Acceleration spectra of the actuated mass in the second ground profile tested.
Mathematics 10 01467 g016
Table 1. Model parameters.
ParameterValue
Simulation time10 s
Horizontal velocity at t = 03 m/s
Vertical velocity at t = 00 m/s
Wheel diameter1 m
Wheel mass60 kg
Wheelbase3 m
Table 2. Ground function parameters.
Profile 1Profile 2
ParameterValueParameterValue
A10.05 mA10.05 m
λ14 mλ12 m
A2−0.25 m
λ210 m
A00 m
a0 m
Table 3. Database of recorded and computed values.
# RecordProbe Wheel Angle TurnedActuated Wheel Angle TurnedVertical AccelerationVertical VelocityVertical PositionTime
1 φ 1 p r o φ 1 a c t y ¨ 1 y ˙ 1 y 1 t 1
n φ n p r o φ n a c t y ¨ n y ˙ n y n t n
Table 4. Time “nΔt” database.
# RecordAngle Turned by Probe WheelAngle Turned by Actuated Wheel
Mathematics 10 01467 i001
Table 5. Characterization of the acceleration spectra in the first ground profile tested.
d = 0d = 1/6d = 1/3d = 1/2d = 2/3d = 5/6d = 1
Maximum2.80352.03971.21301.07281.03611.26952.1981
RMS0.60570.94220.75510.67720.67280.73631.1141
Table 6. Characterization of the acceleration spectra in the second ground profile tested.
d = 0d = 1/6d = 1/3d = 1/2d = 2/3d = 5/6d = 1
Maximum37.970322.125919.002124.249618.364317.615619.4286
RMS8.43175.67695.01296.74505.99225.70875.7104
Publisher’s Note: MDPI stays neutral with regard to jurisdictional claims in published maps and institutional affiliations.

