Article

Combinatorial and Proportional Task: Looking for Intuitive Strategies in Primary Education

Department of Mathematics, University of Lleida, 25001 Lleida, Spain
*
Author to whom correspondence should be addressed.
Mathematics 2022, 10(8), 1340; https://doi.org/10.3390/math10081340
Submission received: 13 March 2022 / Revised: 31 March 2022 / Accepted: 8 April 2022 / Published: 18 April 2022
(This article belongs to the Special Issue Statistics Education: An Immediate Need in a Changing World)

Abstract

:
The development of probabilistic thinking at school requires enhancing combinatorial and proportional reasoning. For this reason, 190 sixth-grade elementary school students (11–12-year-old), without previous instruction in the topic, solve a task consisting of five questions that address both types of reasoning. This study explores the problem-solving strategies used by schoolchildren. The results obtained indicate that, in general, the students do not show strategies in the answers to the combinatorial questions. In addition, it is observed that they have difficulties in understanding the proposed statements and arguing the issues that explicitly require a justification.

1. Introduction

In recent years, the global pandemic experienced has unquestionably forced both professionals and any ordinary citizen to make decisions constantly in a situation of uncertainty. Thus, people, to a greater or lesser degree, have been forced to think and reason probabilistically.
This fact has highlighted the need to teach and learn probability at school from early childhood education (5–6-year-old), even though, in several official documents, it is already considered very important mathematical content [1].
Probabilistic thinking is defined as the way of understanding probabilistic ideas, reasoning from them, and applying them in problem solving [2].
Randomness, sample space, combinatorial enumeration, conditional probability, convergence, independence sampling, simulation, and modelling are ideas and concepts that should be treated at different educational levels for the development of probabilistic thinking [3] and from all meanings of probability (classical, frequentist, propensity, logical, subjective, and axiomatic) [4].
Piaget and Inhelder [5] concluded that, to reach the understanding of chance and quantification of probability, in the second of the three stages of the development of probabilistic concepts, it is necessary for the child to construct combinatorial operations and understand proportionality.
In accordance with this theory, several authors [6,7,8,9,10] highlight combinatorial and proportional reasoning as key components of probabilistic thinking. In fact, Batanero et al. [6] go as far as to affirm that the notions of chance and probability cannot be fully understood without the development of both arguments.
Consequently, we believe that, in order to improve probabilistic thinking in school, it is necessary to promote both combinatorial and proportional reasoning and, above all, take into account that some authors consider proportional reasoning to hinder probabilistic thinking [11,12]. For all these reasons, this paper intends to explore how they solve problems of combinatorics and proportionality and, specifically, what strategies or heuristics are followed by sixth-grade primary school students (11–12-year-old) without prior instruction in combinatorics or calculus of probabilities.
The structure of this work is as follows: first, the theoretical references, on which it is based, are established; then, in method, the context is described, as well as the research methodology; in the following section, the qualitative and quantitative results are presented and discussed; finally, the conclusions are presented.

2. Theoretical Framework

In this section, the theoretical notions used to describe the data collection instrument and interpret the results of our research are presented.

2.1. Combinatorial Reasoning

Combinatorics is a part of discrete mathematics that aims to count [13]. Thus, combinatorial reasoning entails arguing and justifying what emerges in counting situations. Combinatorics plays a significant role in the acquisition of the classical meaning of probability and, specifically, is closely linked to the concept of sample space [14]. In fact, English [15] points to the difficulties with combinatorial operations as a cause of not being able to find a sample space completely.
Combinatoric problems are appropriate at any age [16], since they favor key aspects of mathematical reasoning, such as generalization, conjecture, or systematic thinking [17]. Furthermore, according to English [15], in school combinatorics, problems should be proposed to students without prior instruction; although, some authors, such as Fischbein [18], indicate that, without specific teaching on the subject, they will not be sufficiently capable to solve them.
Combinatorial problems can be classified in different ways. There are several categorizations of these types of problems, based on some characteristics inherent to them.
In the works of Batanero and collaborators [19,20,21], the classification of Dubois is followed [22], which groups the simple combinatorial configurations according to the type of modeling that can be made of the statement. Specifically, this gives rise to three types of problems: selection, in which there is a set of m objects, and k of them are chosen; placement, in which k objects must be allocated in m cells; and those of partition, in which it is intended to divide a set of k objects into m subsets.
These three types of problems are also included in the classification of English [15]. However, the author also includes problems that involve the fundamental principle of counting or combinatorial analysis; that is, those problems in which all possible combinations of objects, corresponding to their different categories, are requested.
By focusing on the existence and number of combinatorial configurations, as well as on the optimization of the solution or possibility of a systematic resolution of the problem, another typology of combinatorial problems is obtained: existence, counting, enumeration, and optimization [23], respectively.
Likewise, according to the number of combinatorial operations required to find the solution, problems are called simple if they are solved with only one operation and composite if at least two combinatorial operations are necessary to solve them [24].
An important aspect to consider, in solving problems of this type for the development of students’ combinatorial reasoning, is the different strategies they use to find solutions.
Although Piaget and Inhelder [5] indicated that it is not until the period of formal operations that the child is able to understand combinatorial operations, this does not mean that he cannot use other heuristics. Thus, in early childhood education or the first grades of elementary school (4- to 7-year-old), combinatorial problems can be solved empirically and, later, with enumeration procedures.
Below are the most common general strategies used by students of different ages when solving simple and composite combinatorial problems [15,19,21,24,25,26]. These are:
  • Translating the problem to another equivalent that is known to be solved, and it can be used as a model.
  • Decomposition strategy into sub problems; that is, the problem is divided into simple ones.
  • Enumeration or listing strategy. This is a strategy already observed in 4-year-old children. Enumeration can be systematic or a-systematic. The systematic, also known as the odometer strategy, consists in fixing an element, combining it with the others, and repeating the process successively with other elements; whereas the a-systematic is a list of combinations, without any order or logic.
  • Arithmetical strategies, such as addition, product, or quotient.
  • Application strategy of combinatorial formulas.
  • Graphical strategies. One of the most important is the tree diagram; although, its construction is somewhat difficult for students.
Another key point that must be considered, in order to evaluate and enhance the combinatorial reasoning of students, which is, in fact, of interest to researchers, is the identification of the errors that they can make when solving the problems. Below, we highlight some of the most typical errors linked to any type of combinatorics problem [19,21,25]:
  • Misunderstanding of the statement.
  • Non-systematic enumeration. Since there is no pattern in writing all the possible solutions, the student is not able to find all of them.
  • Wrong intuitive response. An erroneous numerical answer to the problem is presented without showing any strategy.
  • Incorrect use of the tree diagram. This type of graph is wrongly constructed or interpreted.
  • Incorrect use of the arithmetical operations. An improper arithmetical operation is used.
The onto-semiotic approach (OSA) theoretical framework defines the term semiotic cognitive conflict, in order to identify the differences between the institutional (teacher) and personal (student) meaning of mathematical expressions [27]. This notion allows students’ errors to be described, in terms of the mathematical objects that intervene in a mathematical practice (problem-situations, concepts, procedures, linguistic elements, arguments, and properties). Thus, there are the following types of semiotic cognitive conflicts: situational, conceptual, procedural, propositional, argumentative, and representational [28].

2.2. Proportional Reasoning

According to Lamon [29], proportional reasoning implies arguing from the identification of a multiplicative relationship between two quantities that can be extended to another pair of them. A characteristic of this type of mathematical reasoning is that it integrates two components: the meaning of the rational number (ratio, operator, part-whole, measure, and quotient), as well as the ways of reasoning with the different meanings (relational thinking, covariance, up and down, and unitizing) [30].
Llinares [31] considers that this reasoning is what is promoted from situations of proportionality, in which concepts such as ratio and proportion, fraction and rational number, decimal number, percentages, and probability are connected [32]. More specifically, proportions are linked to the classical meaning of probability [14]; in fact, the different levels of probabilistic thinking development models are characterized by quantitative and proportional thinking [33].
Regarding the study of proportionality in elementary school, it is considered essential to approach it from the connection between fractions, decimals, and percentages [34], which coincides with an arithmetical approach to proportionality (based on the ratio and proportion) [28].

3. Method

3.1. Participants and Context

The sample is composed of 190 Spanish students in the sixth-grade of primary education (11–12-year-old), from five similar public schools, that is, with a homogeneous profile of students. The sample is intentional, and the participants had not received previous training in combinatorics, but had worked with the fractions.
The data collection was respectful of ethical considerations, and the data collection permission was granted by the teachers of the children and directors of the schools. Likewise, the proposed activity also intended to introduce schoolchildren to the study of the probability and reinforce the students’ learning of mathematics.
In fact, this research arises within the GREEP working group (Grup de Recerca en Educació Estadística i Probabilitat) of the Instituto de Ciencias de la Educación of a Spanish university that includes both university professors in the field of mathematics education and in-service teachers with experience. The objective of the group is to improve the teaching and learning of statistics and probability in school. To do so, it is essential that the school–university binomial works as a team.

3.2. Instruments and Data Collect

For data collection, the participants solved a task individually in mathematics class. They had approximately one hour to solve it. This task was considered in the didactic sequence of the course, as an introductory activity to probability.
The task, composed of five items or questions, was designed by GREEP and validated by three external researchers and experts in statistics education. In addition, the reliability of the task was measured by the Cronbach’s alpha coefficient, A = 0.81.
Figure A1 presents the translated task from Catalan to English. Questions Q2–Q4 are based on the counting principle and correspond to a type of composite problem that can be modelled by simple selection problems. They are also problems with a multiplicative structure of a Cartesian product [35]. Questions Q1 and Q5 require the student to reason and present an argument. Q1 involves combinatorial reasoning, and it is closely linked to Q2. In addition, in it, the principle of Dirichlet underlies. As for Q5, it aims to develop proportional reasoning from the connection between fractions and percentages.

3.3. Data Analysis

To study the correction degree of the answers and, specifically, resolution strategies and semiotic conflicts, a qualitative analysis was carried out, based on an analysis of the content [36] of the answers to each question.
According to other studies [28,37], the answers were categorized depending on the degree of correction: correct, partially correct, incorrect, and no answer.
First, the analysis of each response was carried out independently by two different researchers; then, it was discussed and agreed between both.
Next, considering the results obtained in the qualitative analysis, a quantitative analysis was carried out [38] with the IBM SPSS Statistics 26.0 software program (IBM SPSS Inc. 2019, Armonk, NY; US), in order to study: (i) if there are statistically significant differences, regarding the degree of difficulty of the questions; and (ii) whether there are statistically significant differences in the answers to each question, depending on whether students show a resolution strategy or not.
To do this, a score was assigned to each degree of response: correct: 2, partially correct: 1, and incorrect or no answer: 0.
Therefore, we have the scalar variables Qi score (i = 1, …, 5) and dichotomous variables Qi strategy (i = 1, …, 5), with the categories “No strategy (strategy is not showed)” and “Strategy (strategy is showed)”. In this case, no-answer responses were excluded.
Since the sample size is considerably large (N = 190), the assumption of normality is assumed [39].
For studying whether there are statistically significant differences, regarding the degree of difficulty of the questions, we proceeded to identify whether there are statistically significant differences between the scores of the five questions, through a repeated measures ANOVA test, since each participant is subjected to different tests, i.e., problems, in this case [40].
Likewise, to determine if there are significant differences in the score of each question, depending on Qi strategy variables, the t-Student test was carried out [38,40].

4. Results

4.1. Correction Degree of Problems Answers

Table 1 shows the percentages regarding the degree of correctness of the students’ answers to each of the five questions or problems of the task.
In total, four degrees of correctness of the answers are considered: correct, partially correct, incorrect, and does not answer/justify, that is, does not answer or only answers yes or no.
Questions 2–4 have not given rise to partially correct answers; therefore, this category is not considered for them.
As can be seen, only the correct answers predominate in questions Q2 and Q4, although with nuances.
In question Q2, more than half of the students answered correctly; however, in Q4, the percentage of correct answers did not reach 50%. In fact, this percentage is lower than that of incorrect answers, and they do not answer together.
On the contrary, in question Q3, as well as in those that require an argument, that is, in Q1 and Q5, incorrect answers predominate. Moreover, in Q5, practically one in four students did not answer.
Therefore, Q2 has turned out to be the easiest question, with Q5 being the most difficult. It should also be noted that questions Q2 and Q3 ask the same type of qualitative question. However, as has been seen, the percentage of correct answers in Q3 is notably lower than in Q2.
In fact, thirty-two students who answered Q2 correctly answered Q3 incorrectly, and four more did not answer it directly.
We think that this is due to the way of stating the problems, since, in Q2, the statement makes explicit, one-by-one, all the elements to be combined, while, in Q3, these are implicit. Consequently, students have difficulty understanding the situation posed by question Q3; that is, they do not pass the first problem-solving phase of Polya [41].

4.2. Combinatorial Reasoning Resolutions

To calculate the number of menus requested by Q1–Q4the students, for the most part, have not shown the resolution strategy. Now, those who show it have followed the usual strategies for solving combinatorial problems [15,23,24,25,26,42]: graphical, which includes the tree diagram; enumeration, both systematic and a-systematic; and of arithmetic operations, such as the product or the sum, although the sum is not an adequate strategy to solve the types of problems raised. Likewise, other unusual strategies have been observed. In addition, as expected due to the age of the participants, no combinatorial operation was observed.
Table 2 shows the number of responses in which the strategy is not made explicit, as well as the number of responses in which a specific strategy is used. No-answer responses are not included.
As can be seen, in all the questions, the answers without strategy predominate; that is, answers in which the student only presents a numerical value as a solution.
As for resolutions with strategy, the procedure that predominates the most is arithmetic and, specifically, the product or multiplication rule. In other words, these students have recognized the multiplicative structure of problems. However, in some cases, as Mulligan and Mitchelmore warns [35], they get confused and interpret the multiplicative situation of the Cartesian product as an additive situation. Table 2 considers these strategies separately.
Likewise, in the line of Navarro-Pelayo et al. [17] and Roldán et al. [26], these results confirm that few students use the tree diagram to solve combinatorics problems; although, as observed in Q4, it has been the predominant technique.
Some aspects of the resolutions and strategies in Table 2 are described in more detail below; for example, it will be seen which strategies lead to a correct answer and which do not.
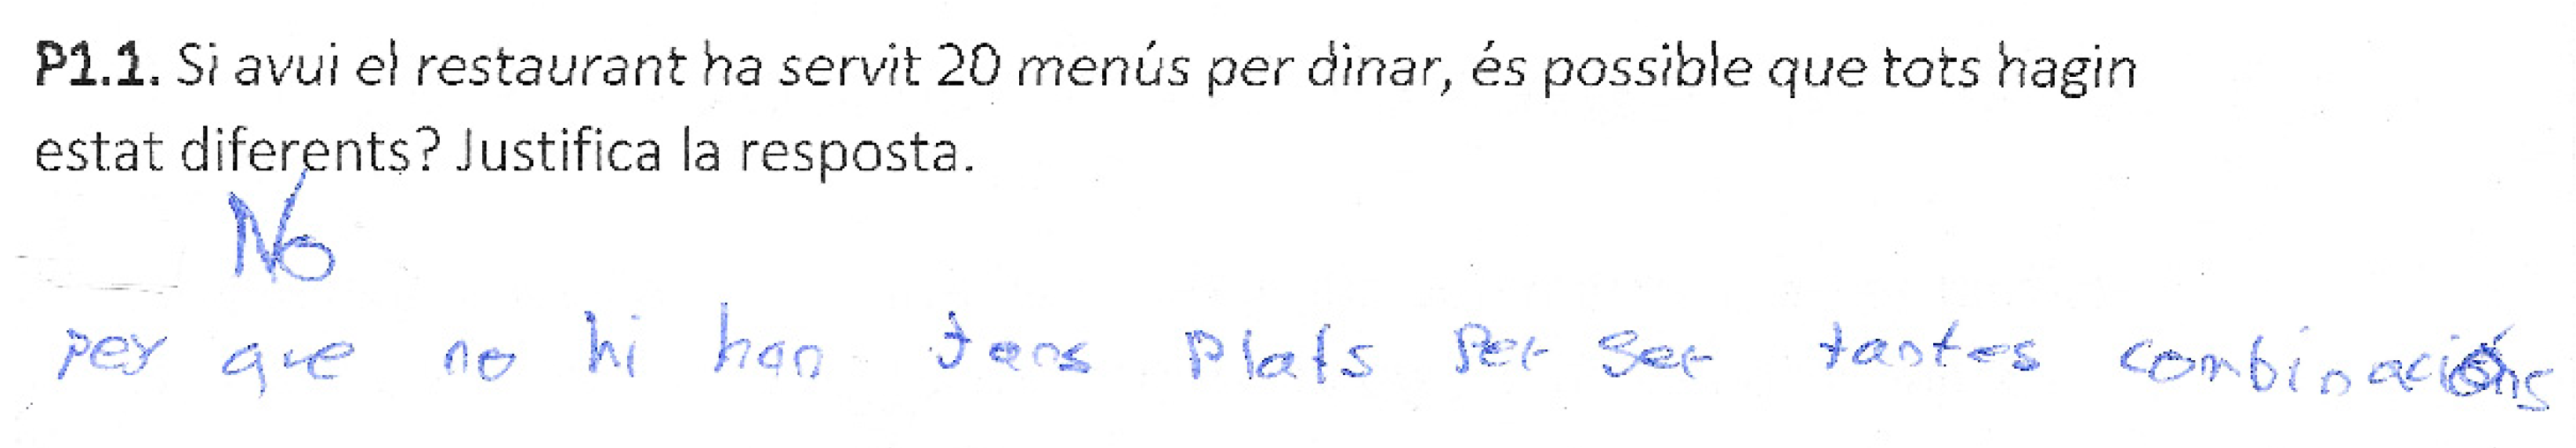
In question Q1, the correct answer has been classified as the one in which the student argues that it cannot be that all the menus have been different because there are only 18 different possible menus. The category of partially correct includes the answers in which it is stated that it is not possible that 20 different menus have been served. However, in its argument, it does not explicitly allude to the fact that there can only be 18 different menus; that is, in the answer only an implicit count is identified (Figure 1).
In Q2, the answer in which the student does not show a strategy, but answers 18 menus, has been considered valid.
The incorrect answers to the questions Q1 and Q2 are motivated by different cognitive conflicts of the students in some of the mathematical objects involved in the task. Thus, as in Burgos and Godino [28], conflicts are grouped into three types: conceptual, procedural, and argumentative.
  • Conceptual (inappropriate application of concepts)
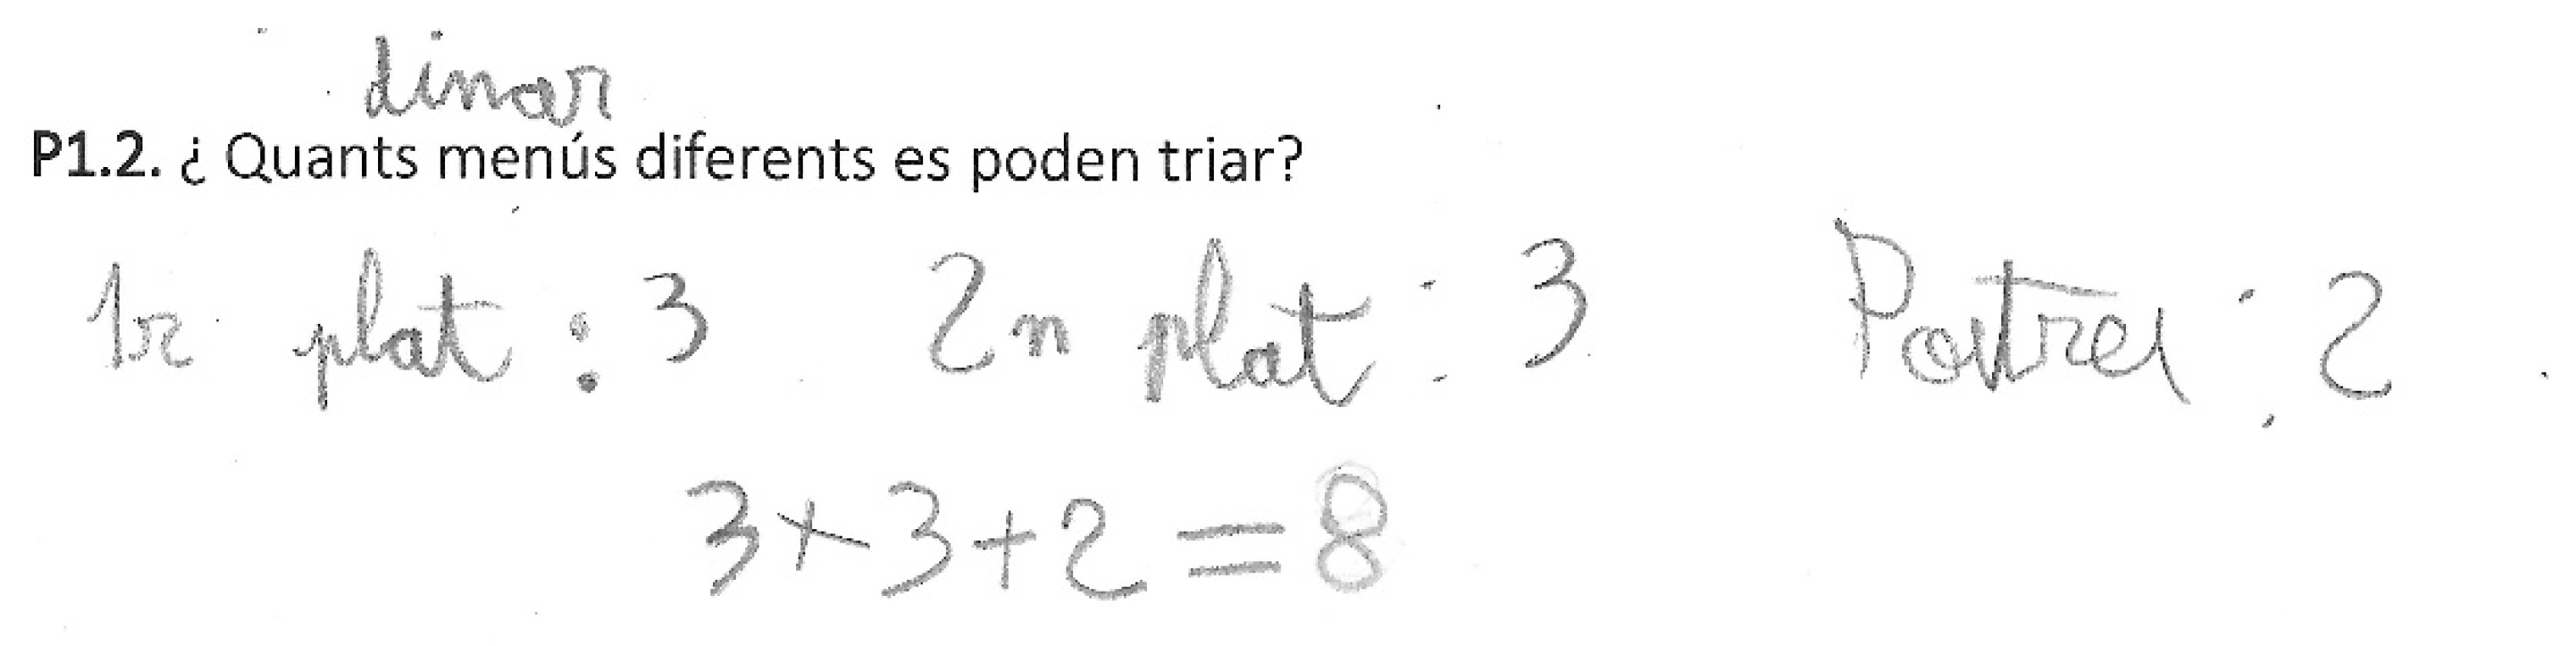
CC1: Student applies a wrong strategy to find the number of menus and, specifically, uses an additive strategy. Figure 2 shows that the student adds the options offered by each type of dish and obtains eight menus. This is an example of typical error in arithmetic operations [19], in which a multiplicative situation of Cartesian product is interpreted as an additive situation.
In another case, the student applies a wrong arithmetical strategy that combines product and addition (“Others” strategy in Table 2). He does not make mistakes when multiplying, but in what he must multiply. This leads to a misunderstanding of the Cartesian product (Figure 3).
  • Procedimental (misapplied strategy)
PC1: The strategy is valid, but it is not correctly applied. As in the investigations of Navarro-Pelayo et al. [17] and Gea et al. [21], the non-systematic enumeration error is detected. Unlike Lamana et al. [42], it is observed that, in most of the resolutions in which this technique is followed, not all possible solutions are found. It is supposed that the reason of this difference is the dimension of the number of solutions.
  • Argumentative (justifications not relevant)
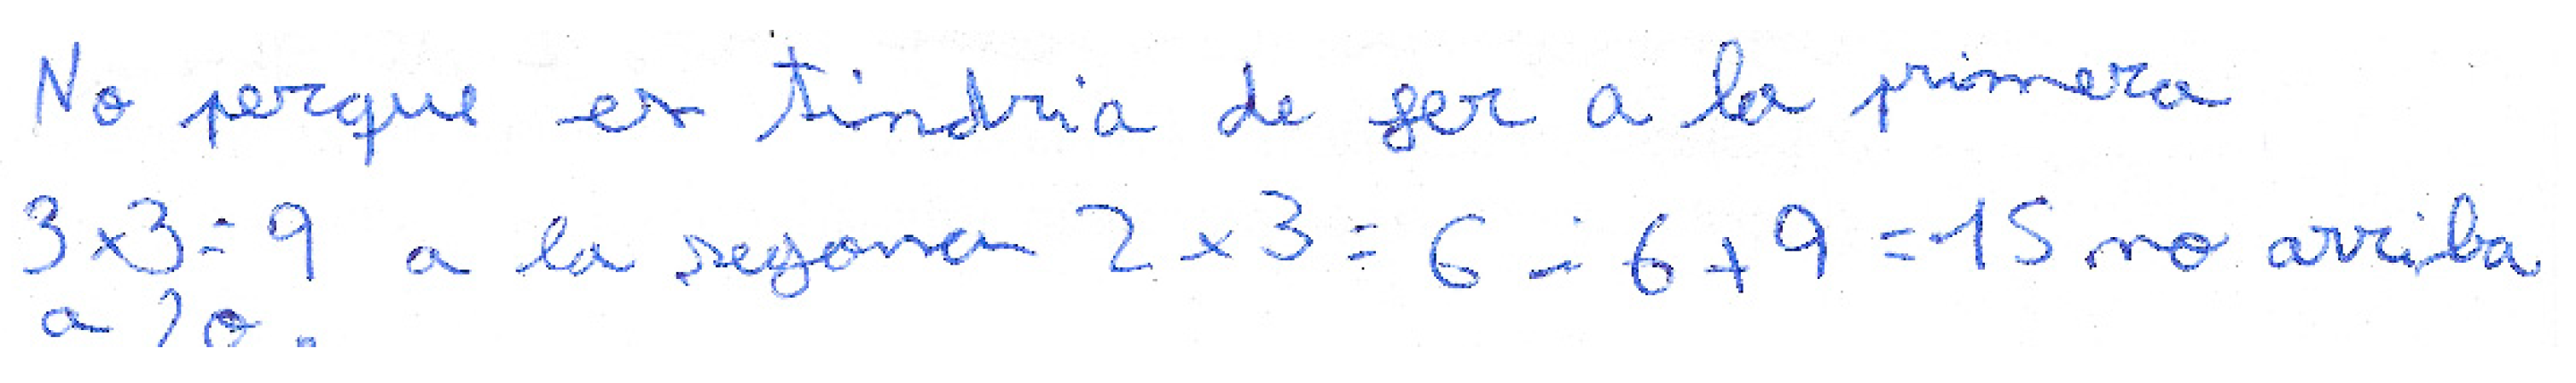
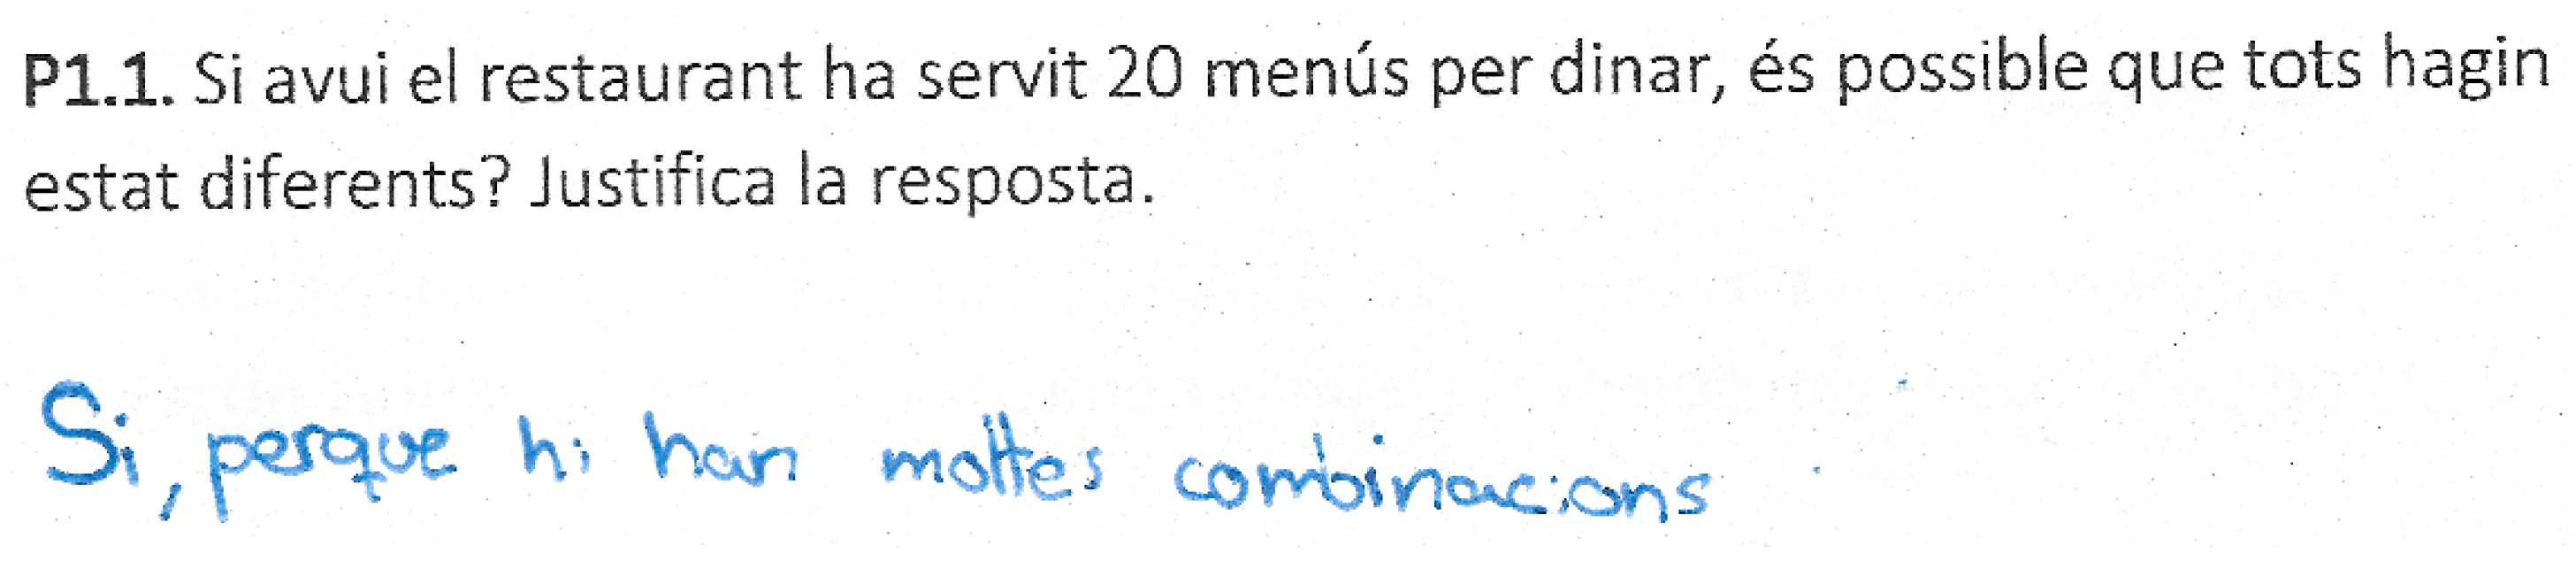
AC1: There are no signs of mathematical reasoning in the argumentation.
AC2: There are signs of combinatorial reasoning, but the proposition is not relevant (Figure 4).
It should be noted that, in most incorrect answers without a strategy, an error of erroneous intuitive response [17] is identified. In particular, many of them give eight menus as a solution. It is intuited that this result is motivated by the previously described CC1 conflict.
Table 3 shows the number of responses to questions Q1 and Q2, depending on the correction degree and strategy followed by the student. No-answer responses are not considered.
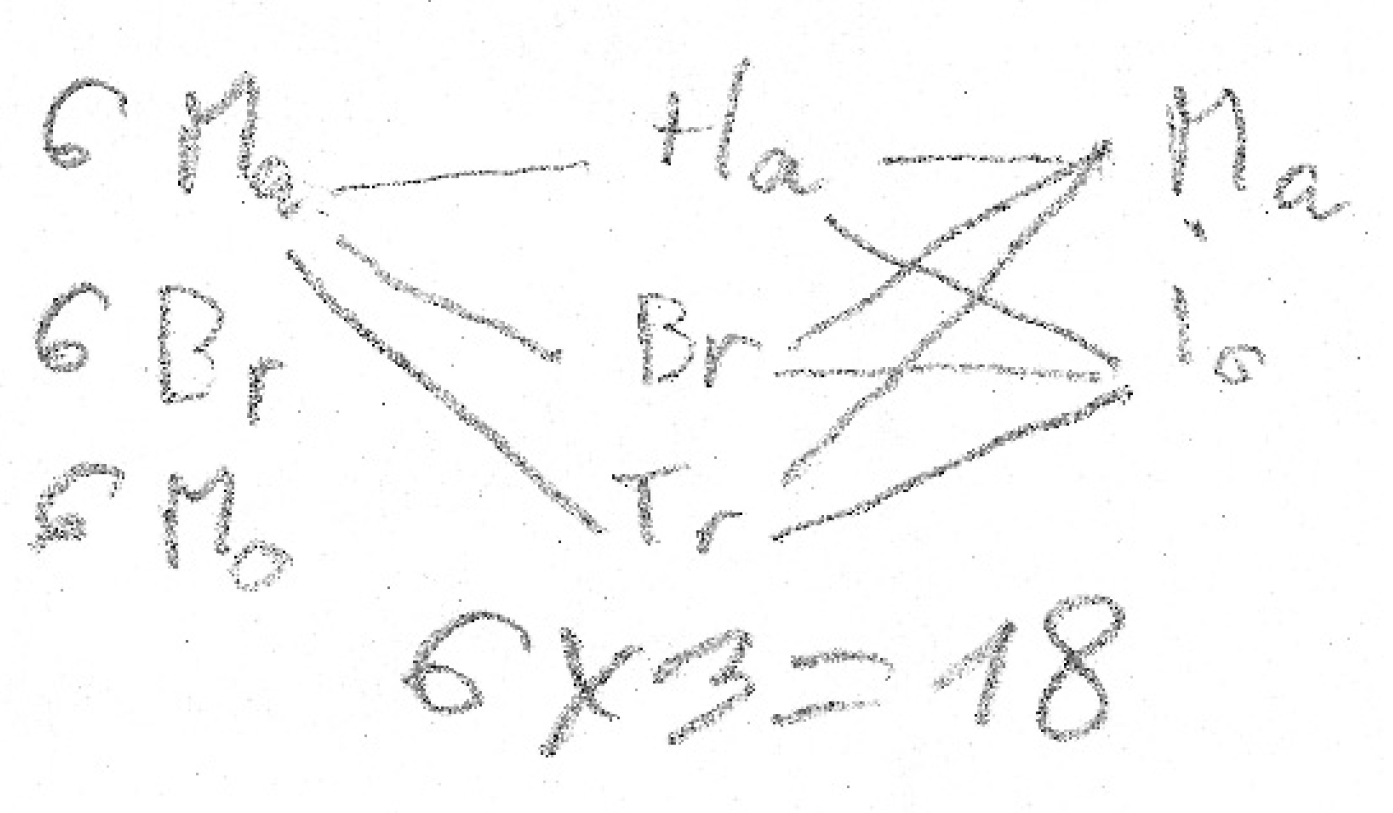
It is observed that the strategy that provides a greater number of correct answers in questions Q1 and Q2 is multiplication, and very few students have used enumeration or a graphical strategy to find the 18 menus. Likewise, a correct strategy (“Others” strategy) that combines tree diagram and multiplication has been identified (Figure 5).
In addition, it is observed that, in general, the students maintain the strategy when answering both questions.
Another remarkable aspect is that, in both Q1 and Q2, there are more correct answers without strategy than with strategy: 34 vs. 27 in Q1 and 75 vs. 28 in Q2. However, it is also true that, proportionally, more correct answers are observed in those resolutions with a strategy than in those that do not follow a strategy (Table 4).
Table 5 shows the number of responses to Q3, based on the correction degree and strategy followed, as well as Q2 to be able to compare, given that they pose the same type of problem. No-answer responses are not considered.
As can be seen in Table 5, no student has followed the enumeration strategy to solve Q3. However, the decomposition strategy is identified. As in the studies of Roa et al. [24] and Lamana et al. [42], this strategy is unusual.
In the same way as in the previous questions, it is observed that the percentage of students with a correct answer in Q3 is greater in the group that shows strategy than in the group that does not show it (Table 6).
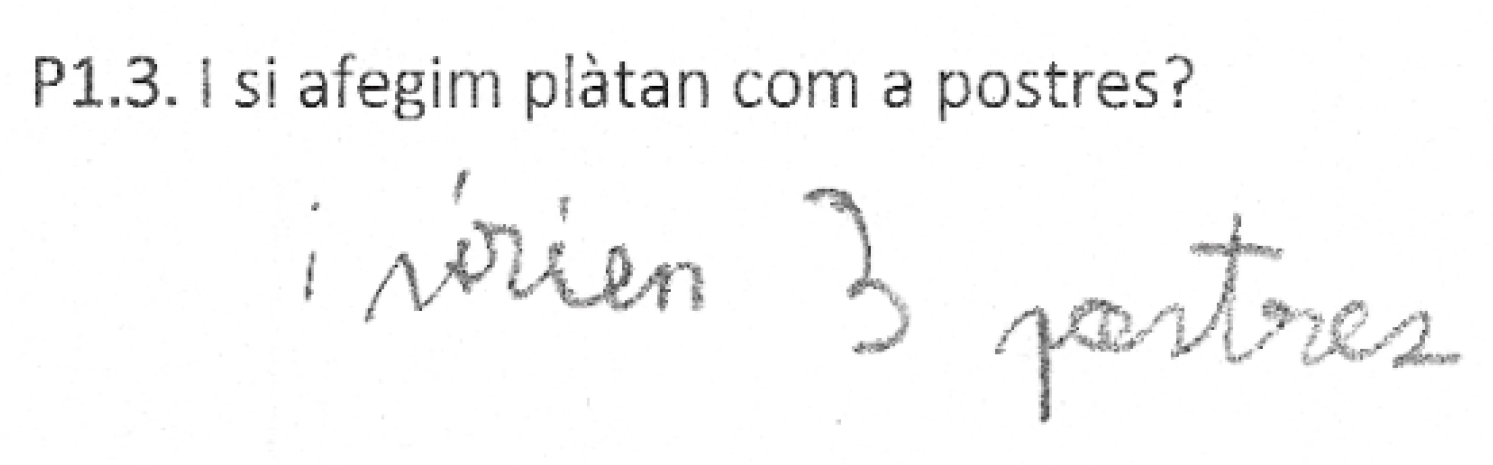
If we compare the resolution strategies of Q2 and Q3, it has been seen that, for the most part, the students who reach a correct answer, following the strategy in both questions, have applied the same strategy in both cases. However, there are two students who have used multiplication to find the different possible menus in Q2; however, in Q3, instead of using this operation, what they apply is the decomposition strategy into sub-problems (Figure 6). Specifically, to the 18 combinations that they already had, they add the 9 new combinations that can be made with banana for dessert.
On the other hand, the students who had an incorrect answer in Q2 and solved it with enumeration or with the product did not repeat the strategy to solve question Q3. It was only maintained by the one who had resolved it with a sum.
Regarding the cognitive errors that lead to an incorrect answer in Q3, only two have been identified.
On the one hand, an error referring to the situation–problem posed is detected, the SPC1, which consists in the misunderstanding of statement Q3 (Figure 7).
On the other hand, in the same way as in the previous questions, the CC1 error is explicitly observed or deduced in those answers that only show a number. Specifically, the students add a certain amount, which can be 1 or 3, to the number of possible menus they have found in Q2.
While the 1 refers exclusively to the banana dessert, the 3 is the cardinal of the dessert dishes that there would be when adding this third option.
It should be noted that this strategy has also been used in some cases in which the answer to Q2 is correct.
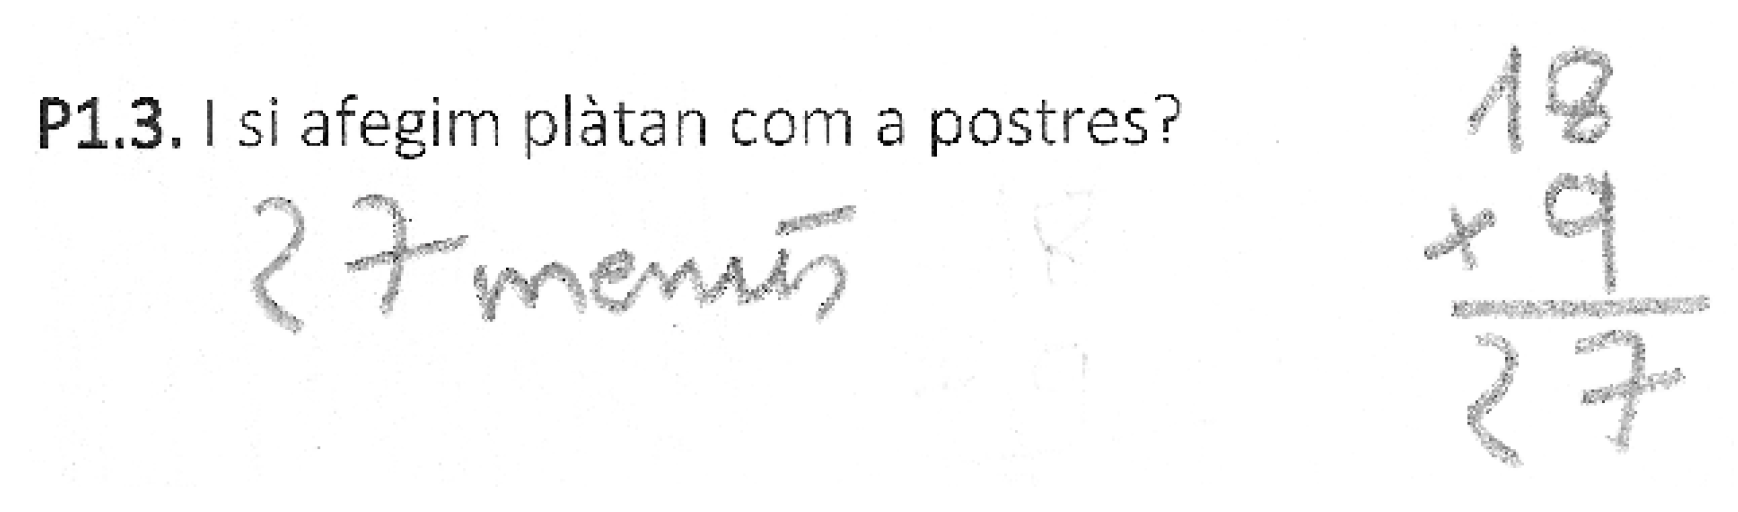
There are other incorrect numerical answers in which the strategy does not appear explicitly, but it is intuited that, behind it, there is an error of the type PC1, in which the student makes a mistake when multiplying and reaches 28 menus, instead of 27.
Table 7 shows the number of responses to question Q4, based on the correction degree and strategy followed, as well as Q3, given that both pose the same type of problem.
Unlike questions Q2 and Q3, which present the same combinatorial model as Q4, the strategy that has been followed the most in the correct answers to this question is the graphical. This aspect may be because the number of combinations to be made in Q4 is smaller than that of the previous ones. Consequently, they find it easier to represent the solutions with a tree diagram (Figure 8).
In the same way as in the other combinatoric questions, the percentage of correct answers is higher in the resolutions that show strategy than in those that do not (Table 8).
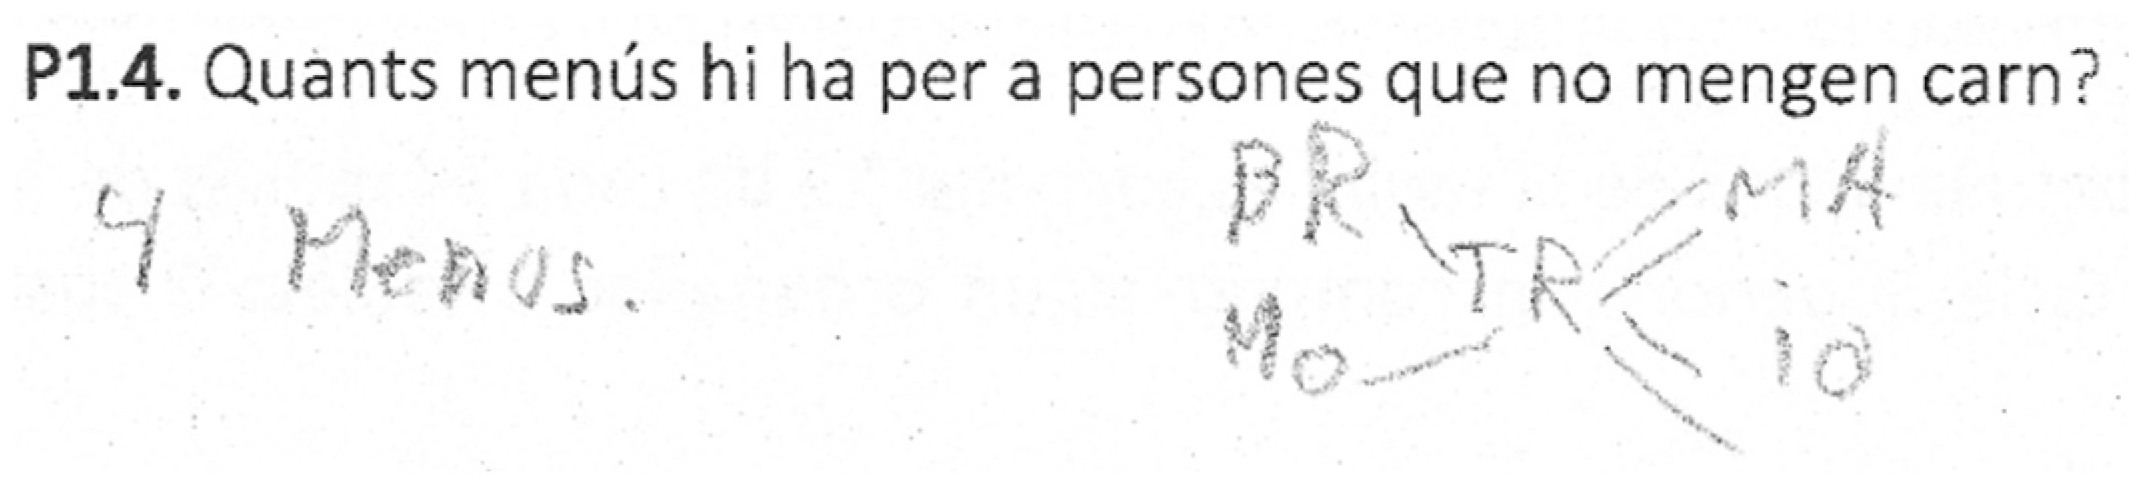
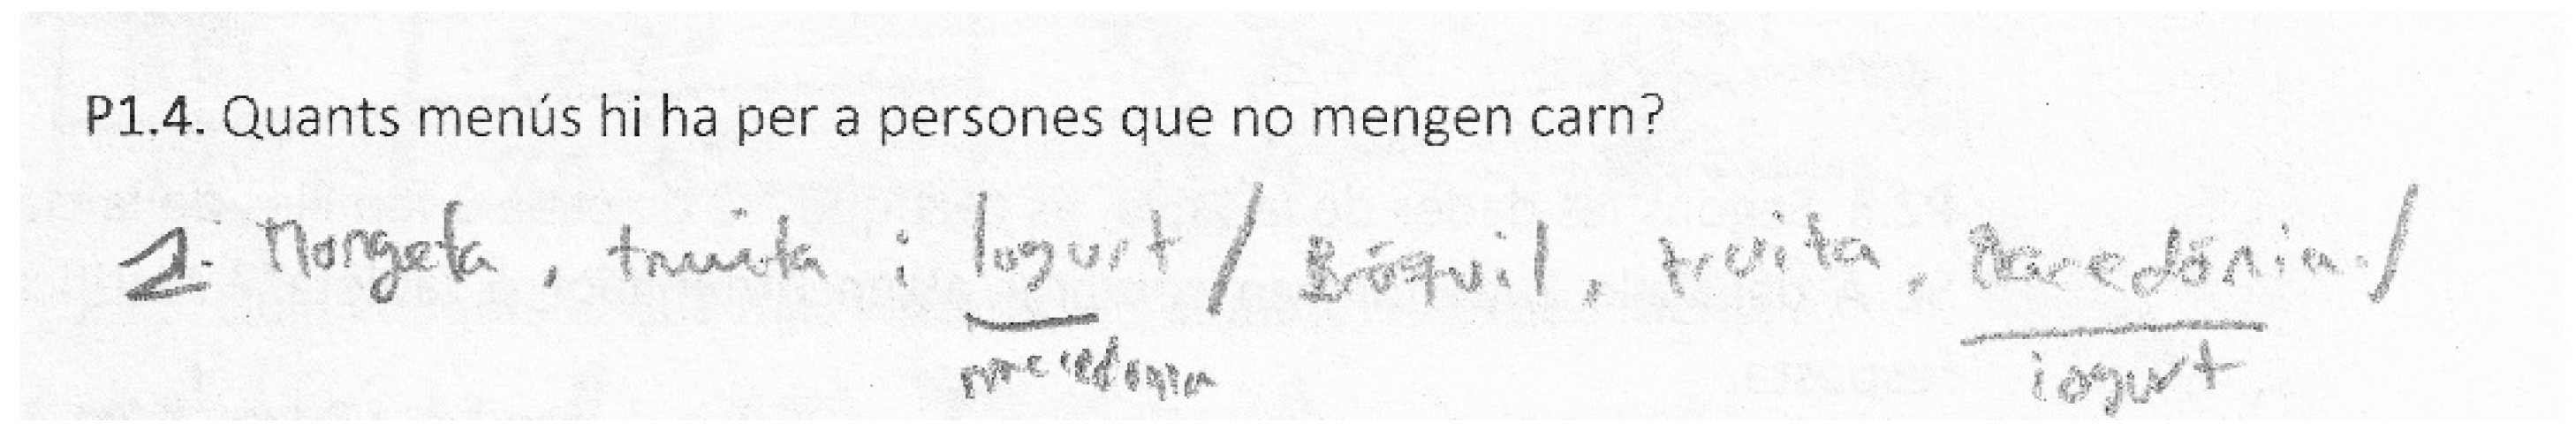
Regarding the incorrect answers of Q4, most of the students who do not show strategy conclude that there are five menus for people who do not eat meat. This amount coincides with the number of dishes that do not contain meat: broccoli, beans, omelet, fruit salad, and yogurt; therefore, it is an intuitive response error, although it seems to be motivated by a conceptual error of the type CC1.
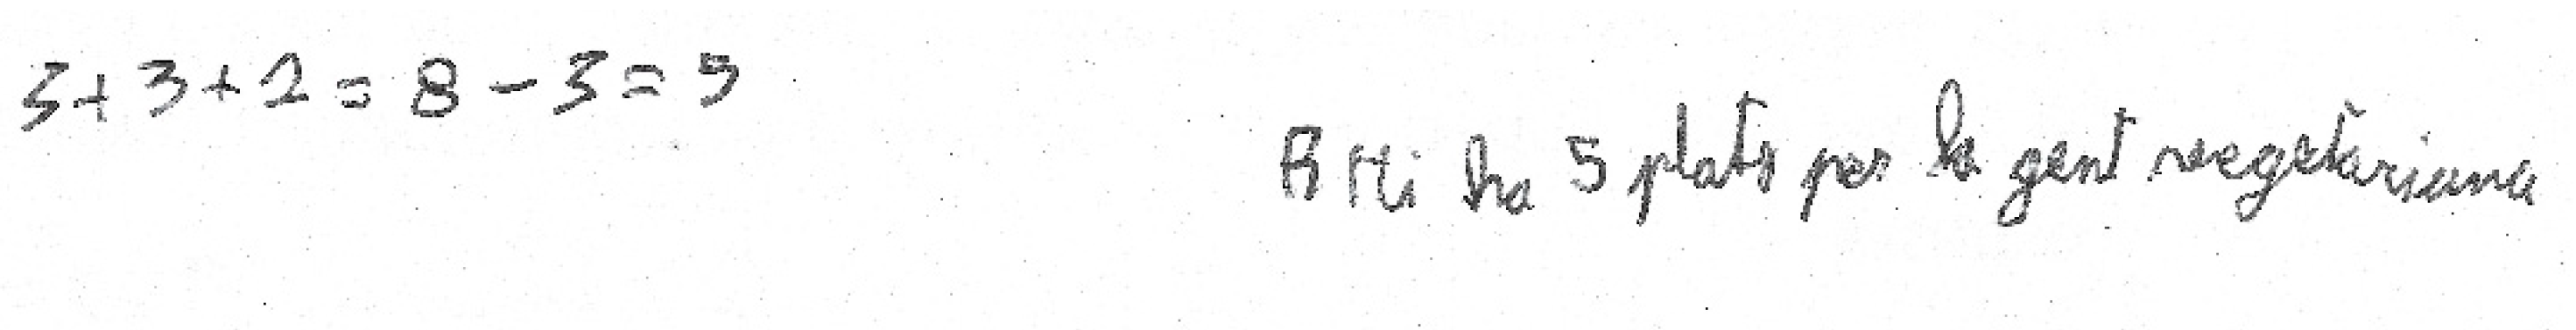
In this line, there is an exceptional case in which the student subtracts the three dishes that do not have meat from the total number of dishes (Figure 9).
Likewise, it should be noted that five students responded with six menus.
In two of the cases, this answer has been considered valid, since it clarifies that there are six possible menus if the banana is taken into account and 4 in case that it is not.
The other three answers, which do not show a strategy, have been categorized as incorrect, since, in Q2, they state that there are eight possible menus. This leads us to think that six comes out of listing all meatless dishes, including banana.
The PC1 error has also been identified in the incorrect answers. Figure 10 shows a resolution in which the enumeration strategy is followed, but the student does not find all the possible combinations.

4.3. Proportional Reasoning Resolutions

Regarding question Q5, the correct answer is considered when the student calculates ¼ of the possible menus and compares, appropriately, this amount with the number of menus for people who do not eat meat, that is, with the result obtained in the Q4.
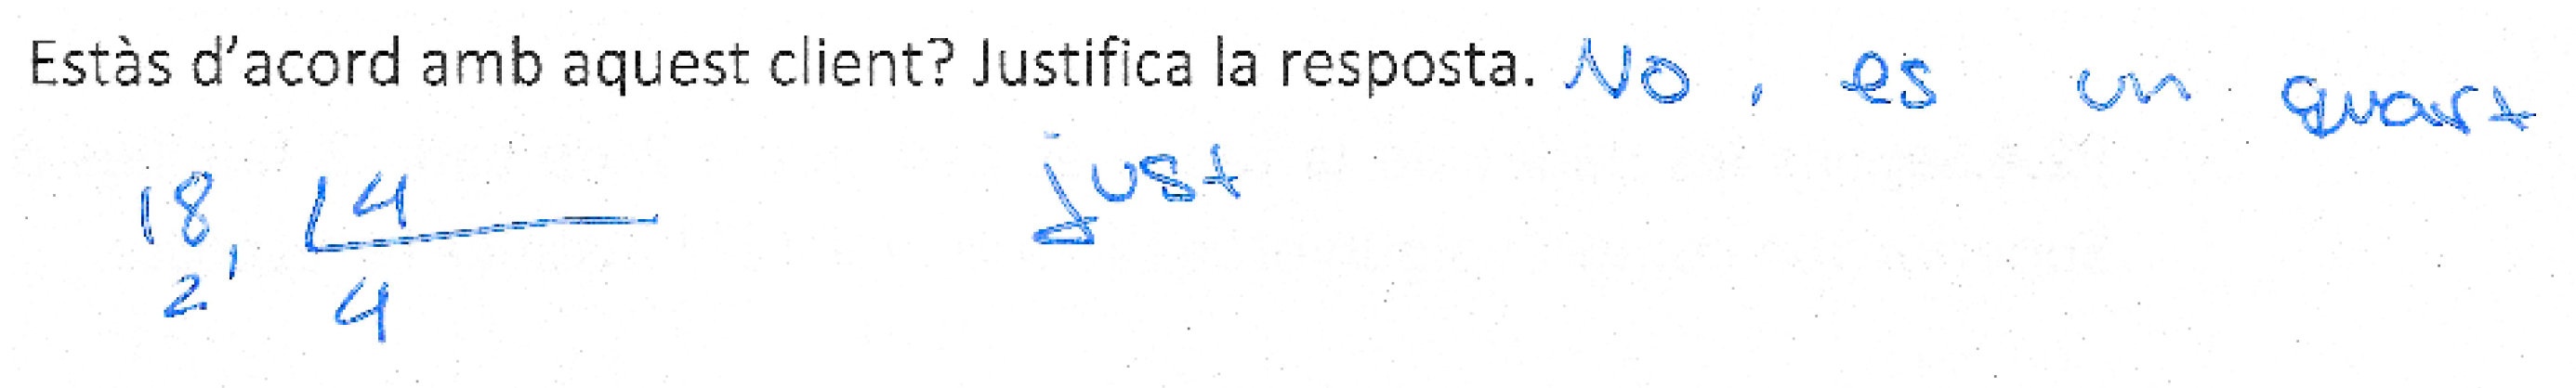
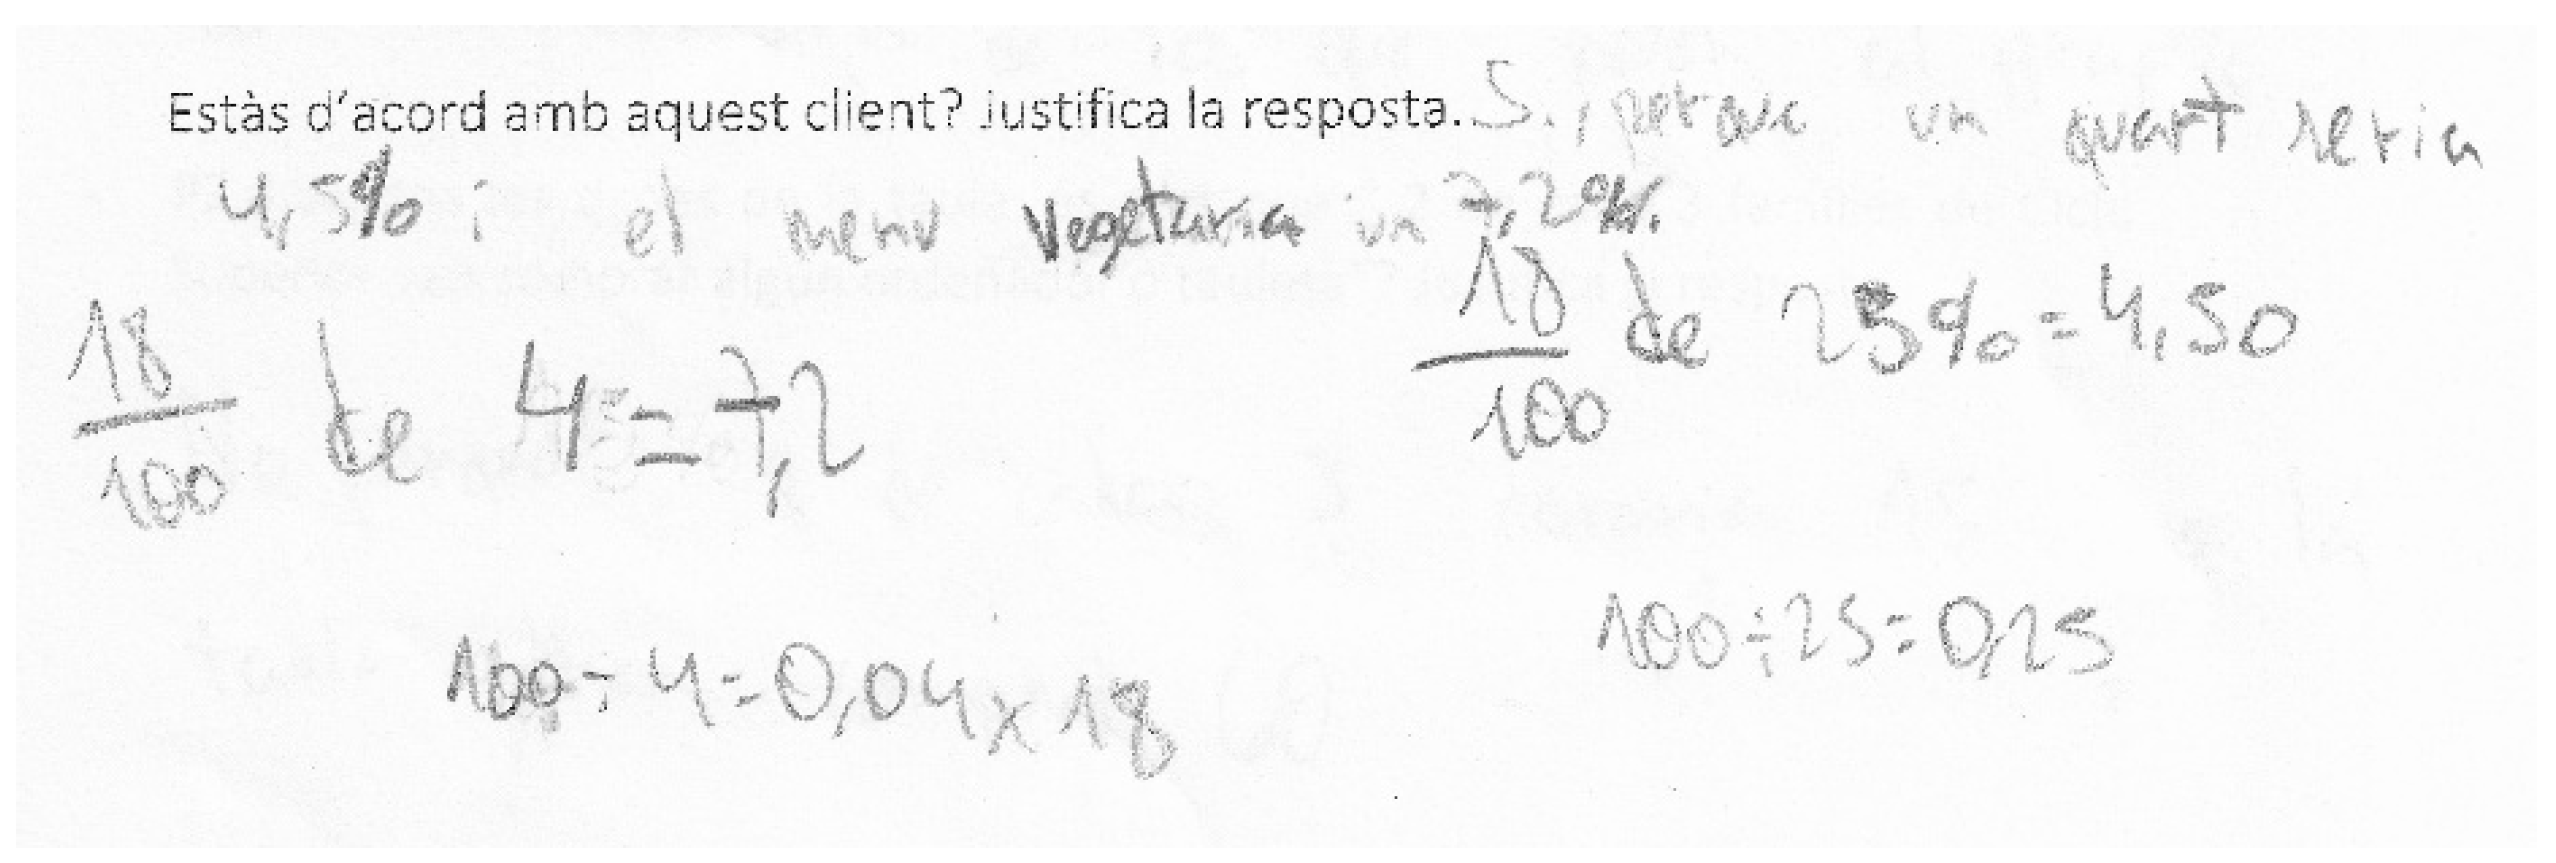
Resolutions that follow an adequate procedure, but when calculating ¼ of 18, the students do not use decimals and, therefore, lead to be in disagreement with the client because precisely the number of menus for people who do not eat meat coincides with ¼ of the total menus, which has been considered partially correct (Figure 11), as well as answers in which the student compares the number of menus without meat, four, with ¼ of 18, but does not explicitly calculate this as 25% (Figure 12). This category also includes resolutions in which the student has not found the correct number of menus in Q2 or Q4 but has, nevertheless, followed a correct procedure.
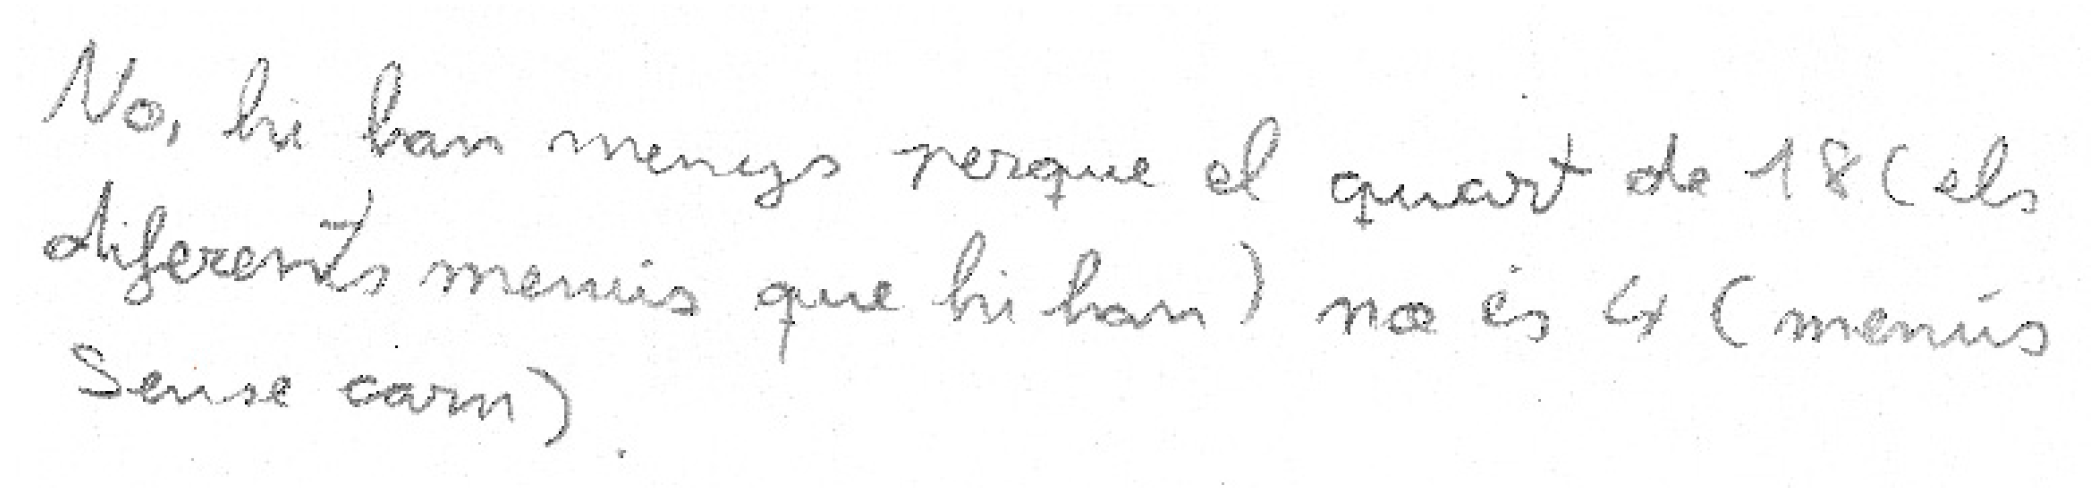
Finally, the answers with an incorrect procedure (Figure 13), with irrelevant qualitative arguments, or in which the student limits himself to affirming or denying the statement, copying it practically literally, have been considered incorrect.
Table 9 shows the number of responses to question Q5, according to the strategy and degree of correction.
Surprisingly, only eight students got the question Q5 right.
Regarding the strategies that lead to a partially correct answer, they indicate that the students understand the problem; although, they may not know how to divide with decimals or apply the operator ¼.
Thus, these strategies are motivated by procedural cognitive conflicts and, specifically, by conflicts in the application of arithmetic strategies.
Something similar happens in the wrong answers. In some cases, it has been observed that the resolution strategy consists of relating ¼ to 25%, but they do not arrive at a correct answer. This means that they are still in the process of developing proportional reasoning.

4.4. Difficulty of the Problems

Mauchly’s sphericity test indicates that the assumption of sphericity does not hold ( χ 2   ( 9 ) = 29.58 , p < 0.05 ); therefore, the degrees of freedom have been corrected with the Huynh-Feldt sphericity estimate ( ε = 0.95 ).
The result of the repeated measures ANOVA indicates that there are statistically significant differences between the scores of the questions,   F ( 3.81 , 720.45 ) = 26.61 ,   p < 0.001 .
Table 10 shows the mean scores for each question, as well as the standard deviations.
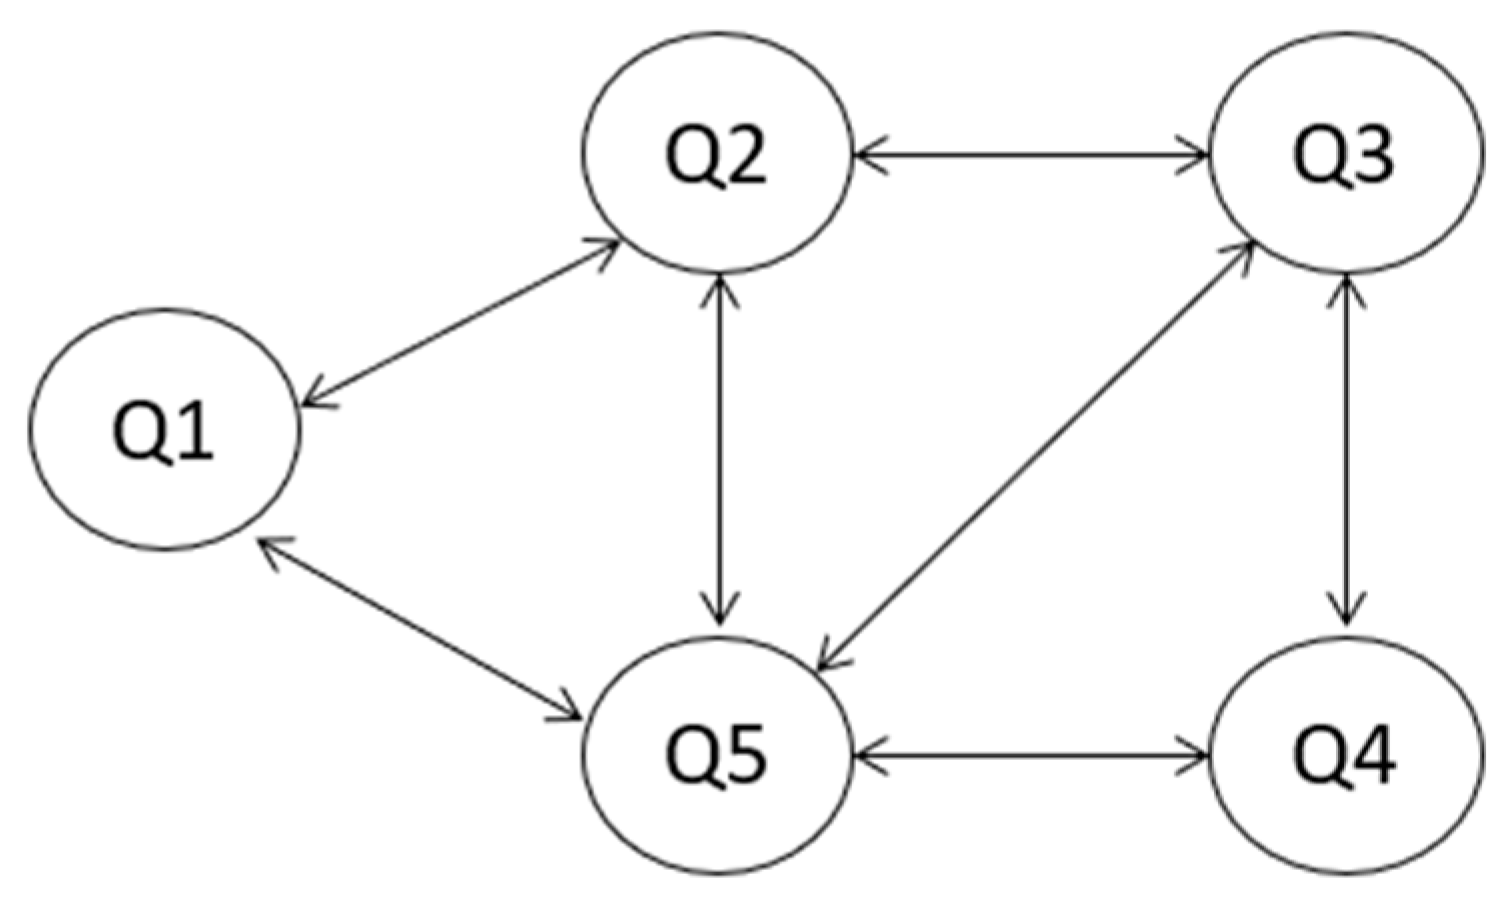
Regarding the pairwise comparisons, there are no statistically significant differences between the scores of Q1 and Q3 ( t (9) =   0.64 ,   p > 0.05 ) , Q1 and Q4 scores ( t = 2.81 ,   p > 0.05 ), and Q2 and Q4 ( t ( 9 ) = 1.77 ,   p > 0.05 ). However, there are significant differences between the scores of Q1 and Q2 ( t ( 9 ) = 5.52 ,   p < 0.001 ) , Q1 and Q5 ( t ( 9 ) = 9.05 ,   p < 0.001 ) , Q2 and Q3 ( t ( 9 ) = 6.65 ,   p < 0.001 ) , Q2 and Q5 ( t ( 9 ) = 12.72 ,   p < 0.001 ) , Q3 and Q4 ( t ( 9 ) = 3.72 ,   p < 0.05 ) , Q3 and Q5 ( t ( 9 ) = 8.01 ,   p < 0.001 ) , and Q4 and Q5 ( t ( 9 ) = 11.43 ,   p < 0.001 ) .
Figure 14 shows a diagram that lists the questions between which there are statistically significant differences in scores.
Thus, it is confirmed that questions Q2 and Q4 have been the easiest, while Q5 has turned out to be the most difficult.

4.5. Differences between Scoring and Strategy

In relation to the purpose of seeing if there are statistically significant differences between the scores obtained in the combinatorial reasoning questions, depending on whether the resolution strategy is shown or not, the test has been carried out for t-Student.
The results indicate that there are statistically significant differences between the two groups, regarding the score obtained in each of the four questions (Table 11).
Thus, it is confirmed that the students who show the resolution strategy in each of the questions have a significantly higher score than those who do not show the strategy.
As can be seen in Table 12, these differences are very notable, especially in questions Q3 and Q1. In Q2 and Q4, they are more moderate.

5. Conclusions

The task designed for this study has turned out to be efficient for researchers, since it has revealed important aspects of students’ mathematical learning and, in particular, their combinatorial and proportional reasoning.
A remarkable result is that there are significant differences between the scores of the items that pose the same combinatorial problem and, especially, between Q2 or Q4 with Q3. If we consider the implicit variables that influence the difficulty of combinatorial problems, that is, the type of combinatorial operation involved in the problem, type of elements to be combined, and total number of possible combinations [43], it can be thought that, between Q3 and Q4, the total of possible solutions affects the difficulty, since, in Q3, there are 27 combinations and in Q4, there only 4. However, what about between Q2 and Q3? Both have a considerable number of possible combinations; therefore, the total number of solutions does not make a difference. In our opinion, the determining factor is the language used in the statement of Q3. Specifically, the use of the verb “add” can lead to a cognitive conflict for students, thus leading them to confuse between multiplicative and additive structure and, consequently, respond erroneously, or simply be unable to respond.
Another noteworthy aspect is the poor results in Q1 and Q5, that is, in the questions that require an explicit argument. This result, together with the fact that most of students do not show any resolution strategy, confirms that students do not reason if they are not encouraged to do so [44]. Additionally, the results confirm that they do not show the strategy when solving a real mathematical problem, since they had not received previous instruction; therefore, the task was a new situation, which points out the need to teach how to solve problems [45]. In addition, it has been seen that students who have shown a strategy have solved problems better. Therefore, students should be encouraged to represent their ideas, in order to organize and clarify [34]. Moreover, teachers should get students used to taking a blank sheet of paper and pencil and always ask them for an explicit and written justification on their solutions.
On the other hand, it should be noted that students tend to be constant in their strategies because, in general, they maintain them if they can. However, the total variable of combinations or, what is the same, the number of elements to combine in a problem, based on the counting principle, is a variable that notably influences the choice of one strategy or another. For sets with a relatively considerable number of elements to combine, as in Q2, they choose multiplication; while, for relatively small sets, as in Q4, they prefer the tree diagram. This fact, in some way, corroborates that the students have quite a few difficulties in constructing the tree diagram [26]; therefore, when there are many elements to combine, they are not able to use it.
It should also be mentioned that, in our case, few students intuitively use enumeration. Although it is an inefficient strategy, from the temporary point of view, when there are many elements to be combined, it should be practiced in the classroom, as it promotes exhaustive thinking; furthermore, it is a very useful technique for calculating the sample space.
Regarding the conceptual and procedural cognitive conflicts observed, such as the use of an arithmetic strategy, instead of a multiplicative one, it must be said that they slow down the development of combinatorial reasoning and, ultimately, make it difficult to probabilistic literacy. It is recommended to introduce the multiplication as a Cartesian product, not as a repetitive addition, to eradicate this error [35].
As for proportional reasoning, something similar happens. The conflict in applying the fraction as an operator can make it difficult to develop. In that sense, it is believed that this error should be dealt with before continuing with more complicated proportionality contexts and, ultimately, the calculus of probabilities.
Finally, it is believed that approaching this type of tasks without prior training in the subject, as well as in a problem-solving environment, is a necessary step prior to instruction, so that students intuitively use their personal strategies; then, they can refine, or even modify, their strategies. Consequently, they will achieve a stronger development of combinatorial and proportional reasoning.
In this work, the written literacy of the students has not been taken into account as a factor that can influence the way in which they justify their answers. It is thought that this variable should be considered in future research.

Author Contributions

Conceptualization, M.R. and A.E.; data collection and analysis, M.R.; validation, all authors; writing—original draft, all authors. All authors have read and agreed to the published version of the manuscript.

Funding

Research project PID2019-105601GB-I00/AEI/10.13039/501100011033 (Ministerio de Ciencia e Innovación) and research group FQM-126 (Junta de Andalucía, Spain).

Institutional Review Board Statement

Not applicable.

Informed Consent Statement

Informed consent was obtained from all subjects involved in the study.

Data Availability Statement

Data are available from M.R. upon request.

Acknowledgments

Equip ICE Grup de Recerca en Educació Estadística i Probabilitat (GREEP) of University of Lleida.

Conflicts of Interest

The authors declare no conflict of interest.

Appendix A

Figure A1. Task.
Figure A1. Task.
Mathematics 10 01340 g0a1

References

  1. Estrada, A.; Batanero, C. Prospective Primary School Teachers’ Attitudes towards probability and its Teaching. Int. Electron. J. Math. Educ. 2020, 15, em0559. [Google Scholar] [CrossRef] [Green Version]
  2. Jolliffe, F. Assessing probabilistic thinking and reasoning. In Exploring Probability in School: Challenges for Teaching and Learning; Jones, G.A., Ed.; Springer: Boston, MA, USA, 2005; pp. 325–344. [Google Scholar] [CrossRef]
  3. Batanero, C.; Henry, M.; Parzysz, B. The nature of chance and probability. In Exploring Probability in School: Challenges for Teaching and Learning; Jones, G.A., Ed.; Springer: Boston, MA, USA, 2005; pp. 15–37. [Google Scholar] [CrossRef]
  4. Batanero, C.; Diaz, C. Meaning and understanding of mathematics. The case of probability. In Philosophical Dimensions in Mathematics Education; Van Bendengen, J.P., François, K., Eds.; Springer: New York, NY, USA, 2007; pp. 107–127. [Google Scholar] [CrossRef]
  5. Piaget, J.; Inhelder, B. The Origin of the Idea of Chance in Children; Norton: New York, NY, USA, 1951. [Google Scholar]
  6. Batanero, C.; Arteaga, P.; Serrano, L.; Ruiz, B. Prospective Primary School Teachers’ Perception of Randomness. In Probabilistic Thinking; Chernoff, E.J., Srirman, B., Eds.; Springer: Dordrecht, The Netherlands, 2014; pp. 345–366. [Google Scholar] [CrossRef]
  7. Van Dooren, W. Probabilistic Thinking: Analyses from a Psychological Perspective. In Probabilistic Thinking; Chernoff, E.J., Srirman, B., Eds.; Springer: Dordrecht, The Netherlands, 2014; pp. 123–126. [Google Scholar] [CrossRef]
  8. Saldanha, L.; Liu, Y. Challenges of Developing Coherent Probabilistic Reasoning. Rethinking Randomness and Probability from a Stochastic Perspective. In Probabilistic Thinking; Chernoff, E.J., Srirman, B., Eds.; Springer: Dordrecht, The Netherlands, 2014; pp. 367–396. [Google Scholar] [CrossRef]
  9. Brase, G.L.; Martinie, S.; Castillo-Garsow, C. Intuitive Conceptions of probability and the Development of Basic Math Skills. In Probabilistic Thinking; Chernoff, E.J., Srirman, B., Eds.; Springer: Dordrecht, The Netherlands, 2014; pp. 161–194. [Google Scholar] [CrossRef]
  10. Greer, B. Commentary on Perspective II: Psychology. In Probabilistic Thinking; Chernoff, E.J., Srirman, B., Eds.; Springer: Dordrecht, The Netherlands, 2014; pp. 299–309. [Google Scholar] [CrossRef]
  11. Vergara, A.; Estrella, S.; Vidal-Szabó, P. Relaciones entre pensamiento proporcional y pensamiento probabilístico en situaciones de toma de decisiones. Relime 2020, 23, 7–36. [Google Scholar] [CrossRef]
  12. Pratt, D.; Kazak, S. Research on Uncertainty. In International Handbook of Research in Statistics Education; Ben-Zvi, D., Makar, K., Garfield, J., Eds.; Springer: Cham, Germany, 2018; pp. 193–227. [Google Scholar] [CrossRef]
  13. Syahputra, E. Combinatorial Thinking. Analysis of student difficulties and alternative solution. In Proceedings of the Third Annual International Seminar on Trends in Science and Science Education, Medan, Indonesia, 7–8 October 2016. [Google Scholar]
  14. Batanero, C.; Chernoff, E.J.; Engel, J.; Lee, H.S.; Sánchez, E. Research on Teaching and Learning Probability; Springer Open: Hamburg, Germany, 2016. [Google Scholar]
  15. English, L.D. Combinatorics and the development of children’s combinatorial reasoning. In Exploring Probability in School: Challenges for Teaching and Learning; Jones, G.A., Ed.; Springer: Boston, MA, USA, 2005; pp. 121–141. [Google Scholar]
  16. Kapur, J.N. Combinatorial analysis and school mathematics. Educ. Stud. Math. 1970, 3, 111–127. [Google Scholar]
  17. Navarro-Pelayo, V.; Batanero, C.; Godino, J.D. Razonamiento combinatorio en alumnos de secundaria. Educ. Matemática 1996, 8, 26–39. [Google Scholar]
  18. Fischbein, E. The Intuitive Sources of Probabilistic Thinking in Children; Reidel: Dordrecht, The Netherlands, 1975. [Google Scholar]
  19. Batanero, C.; Navarro-Pelayo, V.; Godino, J.D. Effect of the implicit combinatorial model on combinatorial reasoning in secondary school pupils. Educ. Stud. Math. 1997, 32, 181–199. [Google Scholar] [CrossRef]
  20. Godino, J.D.; Batanero, C.; Roa, R. An onto-semiotic analysis of combinatorial problems and the solving processes by university students. Educ. Stud. Math. 2005, 60, 3–36. [Google Scholar] [CrossRef]
  21. Gea, M.M.; Batanero, C.; Venegas, A. Lenguaje y estrategias utilizados por futuros profesores de educación primaria en la resolución de problemas combinatorios. Rev. Práxis Educ. 2019, 15, 208–232. [Google Scholar] [CrossRef] [Green Version]
  22. Dubois, J.D. Une systematique des configurations combinatoires simples. Educ. Stud. Math. 1984, 15, 37–57. [Google Scholar] [CrossRef]
  23. Batanero, C.; Godino, J.D.; Navarro-Pelayo, V. Combinatorial Reasoning and its Assessment. In The Assessment Challenge in Statistics Education; Gal, I., Garfield, J.B., Eds.; International Statistical Institute Press: Amsterdam, The Netherlands, 1997; pp. 239–252. [Google Scholar]
  24. Roa, R.; Batanero, C.; Godino, J.D. Estrategias generales y estrategias aritméticas en la resolución de problemas combinatorios. Educ. Matemática 2003, 15, 5–25. [Google Scholar]
  25. Lockwood, E.; Gibson, B.R. Combinatorial tasks and outcome listing: Examining productive listing among undergraduate students. Educ. Stud. Math. 2016, 91, 247–270. [Google Scholar] [CrossRef]
  26. Roldán, A.F.; Batanero, C.; Beltrán-Pellicer, P. El diagrama de árbol: Un recurso intuitivo en Probabilidad y Combinatoria. Épsilon 2018, 100, 49–63. [Google Scholar]
  27. Godino, J.D.; Batanero, C.; Font, V. The onto-semiotic approach to research in mathematics education. Int. J. Math. Educ. 2007, 39, 127–135. [Google Scholar] [CrossRef] [Green Version]
  28. Burgos, M.; Godino, J.D. Semiotic Conflicts in the Learning of proportionality: Analysis of a Teaching Experience in Primary Education. Int. Electron. J. Math. Educ. 2020, 15, em0588. [Google Scholar] [CrossRef] [Green Version]
  29. Lamon, S.J. Teaching Fractions and Ratio for Understanding; Lawrence Erlbaum Associates: Mahwah, HJ, USA, 2005. [Google Scholar]
  30. Lamon, S.J. Rational numbers and proportional reasoning: Toward a theoretical framework. In Second Handbook of Research on Mathematics Teaching and Learning; Lester, F.K., Ed.; Information Age Publishing: Charlotte, NC, USA, 2007; pp. 629–667. [Google Scholar]
  31. Llinares, S. Fracciones, decimales y razón. Desde la relación parte-todo al razonamiento proporcional. In Didáctica de las Matemáticas a Primaria; Chamorro, C., Ed.; Pearson-Prentice Hall: Madrid, Spain, 2003; pp. 187–220. [Google Scholar]
  32. Fiol, M.L.; Fortuny, J.M. Proporcionalidad Directa. La Forma y el Número; Síntesis: Madrid, Spain, 1990. [Google Scholar]
  33. Mooney, E.S.; Langrall, C.W.; Hertel, J.T. A Practitional Perspective on Probabilistic Thinking Models and Frameworks. In Probabilistic Thinking; Chernoff, E.J., Srirman, B., Eds.; Springer: Dordrecht, The Netherlands, 2014; pp. 495–507. [Google Scholar]
  34. National Council of Teachers of Mathematics. Principios y Estándares para la Educación Matemática, 2nd ed.; Thales: Sevilla, Spain, 2000. [Google Scholar]
  35. Mulligan, J.T.; Mitchelmore, M.C. Young children’s intuitive models of multiplication and division. J. Res. Math. Educ. 1997, 28, 309–330. [Google Scholar] [CrossRef] [Green Version]
  36. Drisko, J.W.; Maschi, T. Content Analysis; Oxford University Press: Oxford, UK, 2016. [Google Scholar]
  37. Melusova, J.; Vidermanova, K. Upper-secondary Students’ Strategies for Solving Combinatorial Problems. Proc.-Soc. Behav. Sci. 2015, 197, 1703–1709. [Google Scholar] [CrossRef] [Green Version]
  38. Hernández, R.; Fernández, C.; Baptista, P. Metodología de la Investigación; McGrawHill: Ciudad de México, México, 2014. [Google Scholar]
  39. Flores Muñoz, P.; Muñoz Escobar, L.; Sánchez Acalo, T. Estudio de potencia de pruebas de normalidad usando distribuciones desconocidas con distintos niveles de no normalidad. Perfiles 2019, 21, 4–11. [Google Scholar] [CrossRef]
  40. Mishra, P.; Singh, U.; Pandey, C.; Mishra, P.; Pandey, G. Application of Student’s t-test, Analysis of Variance, and Covariance. Ann. Card. Anaesth. 2019, 22, 407–411. [Google Scholar] [CrossRef] [PubMed]
  41. Pólya, G. Cómo Plantear y Resolver Problemas; Trillas: Ciudad de México, Mexico, 1945. [Google Scholar]
  42. Lamanna, L.; Gea, M.M.; Batanero, C. Secondary school students’ strategies in solving combination problems. In Proceedings of the 12th Congress of the European Society for Research in Mathematics, Bolzano, Italy, 2–5 February 2022. [Google Scholar]
  43. Fischbein, E.; Gazit, A. The combinatorial solving capacity in children and adolescents. Zentr. Didak. Math. 1988, 5, 193–198. [Google Scholar]
  44. Albano, G.; Iacono, U.D. A scaffolding toolkit to foster argumentation and proofs in mathematics: Some case studies. Int. J. Educ. Technol. High. Educ. 2019, 16, 4. [Google Scholar] [CrossRef]
  45. Planas, N. Resolució de problemes. In Pensar i Comunicar Matemàtiques; Planas, N., Ed.; Rosa Sensat: Barcelona, Spain, 2005; pp. 55–62. [Google Scholar]
Figure 1. Partially correct answer of Q1 (translation: no because there are not so many dishes to make so many combinations. The student answers 18 in Q2).
Mathematics 10 01340 g001
Figure 2. Incorrect answer of Q2. Wrong additive strategy. CC1 cognitive conflict (translation: starter: 3; main course: 3; dessert: 3).
Mathematics 10 01340 g002
Figure 3. Incorrect answer of Q1. Wrong arithmetical strategy. CC1 cognitive conflict (translation: No, because you must do in the first 3 × 3 = 9 in the second one 2 × 3= 6 and 6 + 9=15 does not reach 20).
Mathematics 10 01340 g003
Figure 4. Incorrect answer of Q1. AC2 cognitive conflict (translation: yes, because there are a lot of combinations).
Mathematics 10 01340 g004
Figure 5. Correct answer of Q2. Combined strategy (others). Tree diagram product.
Mathematics 10 01340 g005
Figure 6. Correct answer of Q3. Decomposition strategy into sub-problems.
Mathematics 10 01340 g006
Figure 7. Incorrect answer of Q3. SPC1 error (translation: it would be three desserts).
Mathematics 10 01340 g007
Figure 8. Correct answer of Q4. Tree diagram strategy.
Mathematics 10 01340 g008
Figure 9. Incorrect answer of Q4. Arithmetical strategy. CC1 cognitive conflict (translation: there are 5 dishes for vegetarians).
Mathematics 10 01340 g009
Figure 10. Incorrect answer of Q4. Enumeration strategy. PC1 error (translation: 2: Green beans, omelet and yogurt-fruit salad/Broccoli, omelet, fruit salad-yogurt./).
Mathematics 10 01340 g010
Figure 11. Partially correct answer of Q5. Student does not use decimals (translation: no, it is a quarter).
Mathematics 10 01340 g011
Figure 12. Partially correct answer of Q5. Student does not specify ¼ of 18 (translation: no, there are less because the quarter of 18 (different menus that there are) is not 4 (menus without meat)).
Mathematics 10 01340 g012
Figure 13. Incorrect answer of Q5 (translation: yes, because a quarter would be 4.5% and vegetarian menu, 7.2%).
Mathematics 10 01340 g013
Figure 14. Significant differences between problems.
Mathematics 10 01340 g014
Table 1. Correction degree frequencies (percentage) of problems answers.
Correction DegreeQuestion
Q1Q2Q3Q4Q5
Correct61(32.11)103(54.21)67(35.26)91(47.89)8(4.21)
Partially correct20(10.53)---16(8.42)
Incorrect101(53.16)82(43.16)114(60)88(46.32)122(64.21)
No answer8(4.21)5(2.63)9(4.74)11(5.79)44(23.16)
Table 2. Strategies frequencies in each problem.
QuestionNo StrategyStrategyTotal
GraphicalEnumerationArithmeticalOther
ProductAddition
Q1151132412182
Q2152252312185
Q3162101422181
Q41431761120179
Table 3. Degree-strategy frequencies of Q1 and Q2.
DegreeNo StrategyStrategy
GraphicalEnumerationArithmeticalOthers
ProductAddition
Q1Q2Q1Q2Q1Q2Q1Q2Q1Q2Q1Q2
Correct3475121224230011
Partially correct20-0-0-0-0-0-
Incorrect97770023001111
Total151152123524231122
Table 4. Correct responses percentage, according to strategy or not, in Q1 and Q2.
Q1Q2
No StrategyStrategy No StrategyStrategy
Correct3427Correct7528
Total15131Total15233
Percentage22.5%87.1%Percentage49.3%84.8%
Table 5. Degree-strategy frequencies of Q2 and Q3.
DegreeNo StrategyStrategy
GraphicalEnumerationArithmeticalOthers
ProductAddition
Q2Q3Q2Q3Q2Q3Q2Q3Q2Q3Q2Q3
Correct7550212023140012
Incorrect771120030001210
Total152162215023141222
Table 6. Correct responses percentage, according to strategy or not, in Q3.
Q3
No StrategyStrategy
Correct5017
Total16219
Percentage30.9%89.5%
Table 7. Degree-strategy frequencies of Q3 and Q4.
DegreeNo StrategyStrategy
GraphicalEnumerationArithmeticalOthers
ProductAddition
Q3Q4Q3Q4Q3Q4Q3Q4Q3Q4Q3Q4
Correct50621150214110120
Incorrect112810204002100
Total1621431170614112220
Table 8. Correct responses percentage, according to strategy or not in Q4.
Q4
No StrategyStrategy
Correct6229
Total14336
Percentage43.4%80.6%
Table 9. Degree-strategy frequencies of Q5.
DegreeStrategy
Division4 < ¼ de 18Inappropriate ProcedureQualitative Argument
Correct8000
Partially correct61000
Incorrect009113
Total14109113
Table 10. Mean and deviation of each problem.
ProblemMSD
Q10.750.91
Q21.081.00
Q30.710.96
Q40.961.00
Q50.170.48
Table 11. The t-Student test results.
Problem t p R
Q1 t ( 50.41 ) = 8.28 p < 0.001 0.76
Q2 t ( 48.23 ) = 3.02 p = 0.004 0.40
Q3 t ( 28.07 ) = 7.24 p < 0.001 0.81
Q4 t ( 64.89 ) = 4.72 p < 0.001 0.51
Table 12. Mean and deviation, according to the group and question.
ProblemNo StrategyStrategy
MSDMSD
Q10.580.841.740.68
Q21.031.001.550.85
Q30.620.931.790.63
Q40.8711.610.80
Publisher’s Note: MDPI stays neutral with regard to jurisdictional claims in published maps and institutional affiliations.

