Article

Deploying Big Data Enablers to Strengthen Supply Chain Resilience to Mitigate Sustainable Risks Based on Integrated HOQ-MCDM Framework

1
College of Transportation, FuJian University of Technology, Fuzhou 350118, China
2
College of Management, FuJian University of Technology, Fuzhou 350118, China
3
Institute of Industrial Management, College of Management, National Formosa University, Yunlin 632, Taiwan
4
Faculty of Economics and Business, University of Groningen, Nijenborgh 4, 9747 Groningen, The Netherlands
*
Author to whom correspondence should be addressed.
Mathematics 2022, 10(8), 1233; https://doi.org/10.3390/math10081233
Submission received: 21 February 2022 / Revised: 25 March 2022 / Accepted: 1 April 2022 / Published: 9 April 2022
(This article belongs to the Special Issue Supply Chain Management and Mathematical Logistics)

Abstract

:
In the face of global competition, competitive enterprises should pursue sustainable development, and strengthen their supply chain resilience to cope with risks at any time. In addition, big data analysis has been successfully applied in a variety of fields. However, the method has not been applied to improve supply chain resilience in order to reduce sustainable supply chain risks. An approach for enhancing the capabilities of big data analytics must be developed to enhance supply chain resilience, and mitigate sustainable supply chain risks. In this study, a decision framework that integrates two-stage House of Quality and multicriteria decision-making was constructed. By applying this framework, enterprise decision-makers can identify big data analytics that improve supply chain resilience, and resilience indicators that reduce sustainable supply chain risks. A case study of one of China’s largest relay manufacturers is presented to demonstrate the practicability of the framework. The results showed that the key sustainable supply chain risks are risks regarding the IT infrastructure and information system efficiency, customer supply disruptions, transport disruptions, natural disasters, and government instability. To reduce risk in sustainable supply chains, enterprises must improve the key resilience indicators ‘financial capability’, ‘flexibility’, ‘corporate culture’, ‘information sharing’, and ‘robustness’. Moreover, to increase supply chain resilience, the following most important big data analysis enablers should be considered: ‘capital investment’, ‘building big data sharing mechanism and visualisation’, and ‘strengthening big data infrastructures to support platforms and systems’. This decision framework helps companies prioritise big data analysis enablers to mitigate sustainable supply chain risks in manufacturing organisations by strengthening supply chain resilience. The identified priorities will benefit companies that are using big data strategies and pursuing supply chain resilience initiatives. In addition, the results of this study show the direction of creating a fruitful combination of big data technologies and supply chain resilience to effectively mitigate sustainable risks. Despite the limited enterprise resources, management decision-makers can determine where big data analysis enablers can be most cost-effectively improved to promote risk resilience of sustainable supply chains; this ensures the efficient implementation of effective big data strategies.

1. Introduction

Over the past decade, owing to the aggravation of environmental, climate, social, and other problems, the concept of sustainable supply chains (SSCs) has received more and more attention [1]; sustainable supply chain management (SSCM) is becoming a key strategy for companies [2]. The sustainable supply chain of manufacturing enterprises is an important factor in promoting sustainable development [3]. Today, supply chain management (SCM) has developed at both theoretical and industrial application levels; it can be said that supply chain (SC) is the fundamental system for all organisations [4]. The most classical form of manufacturing supply chain is the one that considers the supply chain as a combination of processes to meet customer requirements, including all possible network entities, such as suppliers, manufacturers, transport vehicles, warehouses, retailers, and customers, whose main purpose is to achieve customer satisfaction at the lowest possible cost [5]. The new era exhibits newly emerging problems, such as increased competition, the impact of globalisation, diversity of technological solutions, and unlimited customer expectations, which all lead to increased supply chain uncertainty and risk. Therefore, enterprise managers have shifted their focus to SSC risk management. Supply chain risks (SCRs) can be caused by natural disasters or man-made problems, which may eventually lead to supply chain interruptions, capital chain rupture, and different business complications; these events have a severe impact on supply chains and related industries [6,7]. Supply chain management (SCM) plays an important role in enabling manufacturing enterprises to achieve competitive advantages. However, there is little research on manufacturing [8]. Therefore, it is particularly important to propose effective strategies that can mitigate risks [9].
Sustainable supply chain risks (SSCRs) can cause crisis events at any time. Therefore, an enterprise must be able to mitigate risks; this ability is called ‘resilience’ [10]. According to Sheffi et al., risk represents a potential loss, whereas resilience is the ability of enterprises to recover the normal production or service level after a supply chain interruption [11]. Since 2010, the number of studies and applications of SCRE has considerably increased [12]. Moreover, most of the literature is conceptual, theoretical, and normative, and only few studies will select and implement an appropriate set of strategies to improve SCRE [13]. According to research papers, SCRE can influence the sustainability advantage of manufacturing enterprises [14]. Resilience is not only a necessary condition for achieving sustainable development goals [15]; it will also be a buzzword of the next decade, worthy of further study across multiple sectors [12].
Over the past few years, big data analysis (BDA) has become one of the most investigated research topics [16]. Researchers have discovered that big data analysis can reduce the complexity of manufacturing enterprises’ SSC practices [17], and effectively improve the effectiveness of the SCRE and risk management infrastructure of enterprises [10]. In addition, big data analysis helps enterprises to perform regular operations, reduce management and production cycles, and facilitate centralised manufacturing and mass production [18]. In general, big data analytics can improve the supply chain management performance and implementation of SSCM [19]. Enterprises can gain competitive advantages through big data-driven supply chains [20], and effectively deal with market turbulences [21]. Pettit believes that big data analytics can improve the visibility of an enterprise’s supply chain, help identify potential threats and disruptions, and improve SCRE. However, despite the popularity of BDA, and its application in many fields, the relationship between BDA and SCRE has not been determined, in particular, because there are no empirical data in the literature [22]. Moreover, although companies benefit from the ability to adopt BDA, academic research on topics related to BDA adoption and effectiveness is still in its infancy. One major area that has not been explored in detail is the relationship between big data analytics and its impact on risk resilience [23]. Therefore, we introduce examples to explore the impact of BDA enablers on SCRE.
Because of the complex relationship among SSCR, SCRE, and BDA, QFD is used in this study to analyse the performance in terms of sustainability of one of China’s top 100 electronic manufacturing enterprises. The QFD concept emerged in Japan in 1972. It is used to evaluate the design of new products based on customer input; it was first applied to improve the design of new tankers [24,25]. QFD is a flexible strategy that translates customer requirements into design requirements, and uses a house of quality (HoQ) matrix to identify the relevance of each stage, including the product design, manufacturing, and distribution stages [26]. QFD has become increasingly popular, and its application field has been expanded to supply chains [27].
In recent years, QFD has been successfully applied to solve multicriteria decision-making (MCDM) problems in many fields, such as for selection of knowledge system [28], evaluation of green buildings [29], evaluation of bike-share project [30], priority of technology attribute [31], and reduction of fashion risks [32]. However, not much of the literature combines multi-attribute decision-making with HoQ. Therefore, this study aims to develop an integrated architecture to screen out the enablers of resilience indicators and big data analysis in the manufacturing supply chain to reduce the supply chain risk covered by the enterprise, and investigate the relationship between these three sets of variables (sustainable supply chain risk, supply chain resilience, and big data analysis). One of the highlights of this study is the identification of key big data enablers to strengthen supply chain resilience by the integration of two-stage House of Quality and MCDM methods to reduce or mitigate sustainable supply chain risks.
The following research questions are discussed:
(a)
What are the key SSCRs, SCRE, and BDAEs in the manufacturing supply chain?
(b)
How should quality function deployment, multicriteria decision making, and the three variables be connected to provide decision-making support for the supply chains of manufacturing enterprises?
(c)
How can manufacturers effectively improve supply chain resilience with the proposed framework and big data analysis enablers to address sustainability issues?
The remainder of this paper is organised as follows: The Section 2 presents a literature review, which lists the factors affecting sustainable supply chain risk, supply chain resilience indexes, and big data analysis enablers. The Section 3 introduces the method. The implementation and analysis results of the case study are presented in the Section 4. Finally, Section 5 presents the conclusion and contribution of this study.

2. Literature Review

2.1. Sustainable Supply Chain Risks (SSCRs)

Sustainable supply chains is a large and interesting research field. Because researchers have defined sustainability in different ways [33], their research directions are different. Traditional sustainable development includes social, environmental, and economic dimensions [34]. However, these three dimensions cannot describe the whole system of an organisation. Therefore, Iddrisu proposed a five-dimensional sustainable-development model that considers social, environmental, economic, technological, and institutional dimensions [35]. Valinejad and Rahmani used a five-dimensional approach to assess risks in the telecommunication sector [36]. Moreover, Moktadir et al. used a five-dimensional approach to identify 30 potential risk factors in the leather industry in Bangladesh [37]. Hsu et al. determined 130 risks related to sustainable development in the elevator manufacturing industry based on five dimensions, and 22 sustainable supply chain risks in the fashion industry with the five-dimension method [32,38].
The function of a supply chain is measured in terms of business and its impact on environmental and social systems [39]. Thus, if a supply chain is fully sustainable, it does not damage the ecosystem or social system, and generates profit in the long term [40]. In the era of globalisation, supply chains involve a wider and more complex range of risks [41]. To make the concept of risk easier to understand and manage, researchers have developed different classification methods based on their different perspectives.
For instance, Alora and Barua classified supply chain risks into seven categories according to the different sources of risks in the supply chain: environmental, supplier-side, manufacturer-side, wholesaler-side, distributor-side, retailer-side, and customer risks [42]. Wagner and Bode classified environmental risks into risks regarding natural accidents, normal accidents, abnormal accidents, changes in regulatory policies, political uncertainties, terrorist attacks, international terrorist attacks, civil disturbances, wars or other social and political crises, and diseases or epidemics [43]. Junipero and Ali Al-Tantawi classified supplier-side risks into risks regarding poor raw material quality, supplier bankruptcy, and financial instability of suppliers [44]. Klibi and Martel classified manufacturer-side risks into risks regarding technical failures in factories, technical outage, industrial accidents, and transportation and communication failures [45]. Ritchie and Brindley classified wholesaler- and distributor-side risks into risks regarding delays, the bullwhip effect, transport failure, and communication failure [46]. Wilson classified retailer-side risks into risks regarding technical failures and transportation interruption [47]. Moreover, Bode et al. classified customer risks into risks regarding uncertain or flexible requirements, delivery delays, and inaccurate information [48].
Norman and Lindros and Vanany et al. classified risk into three categories: risks regarding operational accidents, operational disasters, and strategic uncertainty [49,50]. Banwet and Shankar divided risk into breakdown risks, forecast risks, intellectual property rights risks, and IT/IS outsourcing risks. Breakdown risks are critical, and include loss of sales, cost of emergency services, cost of data recovery, and long-term loss of customer goodwill [51]. In addition, Olson and Wu classified risk into external and internal risks [52]. The former type includes natural, political-system, competitor, and market risks; the latter type includes available-capacity, internal-operation, and information system risks. Sawik classified risk into destructive and operational risks [53]. Disruptive risks include risks regarding unplanned outages, unexpected events, and the sudden collapse of material supplies; operational risks are potential uncertainties in internal operations. Diabat et al. classified risks into six categories: product, information, management, macro, demand, and supply risks [54]. Moreover, Cagliano et al. classified risk into two categories: internal risks (strategic, tactical, and operational risks) and external risks (catastrophic, economic, social, political, legal, cultural, industrial, and partner risks) [55]. Avinash et al. classified risks into four categories: supply, demand, operational, and environmental risks [56]. Lavastre et al. divided the risks into quality risk, compliance risk, risk of supply disruptions, production interruption risk, price risk, cost risk, technology risk, prediction risk, reliability risk, uncontrollable external risk, inventory risk, management risk, contract risk, customs risk, information system risk, and business risk [57]. Venkatesh et al. classified risk into globalisation risk, product quality and raw material standard risks, resource shortage risk, supplier uncertainty risk, employee behaviour risk, infrastructure risk, delay risk, demand risk, customer dissatisfaction risk, financial risk, and security risk [58]. Furthermore, Rogers et al. classified risk into cultural, operational, infrastructure, economic, forecast, and vendor-related risks [59]. Kirrubi and Hays classified risks into supply, demand, and internal and external environmental risks [60]. Song et al. classified risk into demand and supply uncertainty risk, supplier risk, responsiveness risk, performance risk, supply risk, inflexibility risk, quality risk, coordination risk, information sharing risk, sustainable technology risk, price and cost risk, exchange rate risk, market risk, natural disaster risk, environment risk, human rights risk, social commitment risk, and business moral hazard risk [61]. Jiang et al. classified risks into the planning process, port service process, distribution process, relational process, nuclear enterprise financial, and external environment-related risks [62]. Prakash et al. classified risk into four categories: supply, process, financial, and demand risks [63]. Xu et al. classified risk into five categories: technical, market, environmental, social, and operational risks [64]. Brzęczek believes that new products will increase operational and technological risks, and increase sales risk [65]. Hsu suggested that supply chain risks can be classified into: (1) external risks: including potential human disasters, operational risks, legal and political risks, supplier and customer risks, environmental and natural disasters, and market trend risks (i.e., 6 dimensions and 62 risks); (2) internal risks: including potential physical accidents, operation risks, personnel risks, strategic management risks, and information management risks (i.e., 5 dimensions and 68 risks) [38]. Saltykov et al. classified risks into natural, economic, financial, market, production, technological, social, environmental, and legal risks [66]. We have created the following Table 1 to show gaps in relevant research.
By referring to the risk classification methods of different researchers, we classify risk into external and internal supply chain risks. All selected supply chain risks involve the five dimensions (e.g., social, environmental, economic, technological, and institutional sustainability factors). External risks include man-made disaster, environmental disaster, natural disaster, and market trend risks. Internal risks include strategic management risks, information system risks, supplier and customer risks, internal unforeseeable risks, internal business risks, and employee risks. There are 10 types in total; the previously presented 10 risk types are further classified into 69 sub-items based on the literature. These sustainable risks will be assessed in detail in Section 4.

2.2. Supply Chain Resilience (SCRE)

The word ‘resilience’ appeared in engineering [67]. In materials science, it is the ability of a material to return to its original shape after deformation without exceeding the limit of resilience [68]. The concept of resilience is used in a wide range of sectors, including manufacturing and services [69], businesses [70], food [71], and fashion [72].
SCRE refers to the ability of a company to respond quickly to vulnerabilities and disruptions in the supply chain, and to return to normal operation afterwards [73,74]. The SCRE degree can be measured based on redundancy, real-time monitoring, visibility systems, and recovery [75]. The SCRE concept for supply chains effectively reduces the possibility of supply chain disruptions and time required to return to normal performance [76]. SCRE is measured based on the ability to respond quickly to supply chain outages, overcome supply chain outages, easily adapt to supply chain outages, and maintain high situational awareness [77]. Resilience is considered one of the key factors for reducing SCRs [78]. Researchers have put forward different classification methods for resilience.
Sheffi and Rice stated that resilience must provide an organisation with a competitive advantage; in addition, they presented the resilience potential of five core elements of a supply chain: supply chain and procurement, transition processes, poverty channels, control systems, and corporate culture [79]. Pereira broke down resilience into different functional attributes (i.e., flexibility, agility, visibility, information sharing, and risk awareness) [80]. Pettit et al. classified resilience into three factors: market position, organisation, and information sharing [81]. In addition, Ponis and Koronis classified resilience into ten functional attributes: agility, flexibility, resilience, speed, visibility, availability, redundancy, resource flow, collaboration, and knowledge of the supply chain structure [82]. Soni et al. classified resilience into six functional attributes: trust, security, sustainability, information sharing, risk, and income sharing among members [83]. Inman and Blumenfeld highlighted two key elements of supply chain resilience: prevention and mitigation [84]. Regarding the simulation of outages, Marie et al. compared different network modelling strategies, and classified the measures of resilience into accessibility, robustness, flexibility, and responsiveness [85]. Moreover, Kamalhammadi and Parast argued that resilience involves 11 competencies: agility, flexibility, redundancy, speed, visibility, collaboration, information sharing, financial strength, product management, risk awareness, and knowledge [86]. According to Jain et al., expanding the resilience capacity involves 13 aspects: adaptability, collaboration among players, trust among participants, supply chain sustainability, risk and revenue sharing, information sharing, supply chain structure, market sensitivity, supply chain agility, supply chain visibility, risk management culture, and minimising uncertainty among partners and technical ability [87]. Sáenz et al. provide a broader framework for the design of supply chain resilience [88]. It includes two components (i.e., responsiveness and initiative), and, further, considers internal and external vulnerabilities while focusing on competitive priorities in the supply chain. Singh et al. classified resilience into flexibility, agility, redundancy, speed, visibility, adaptability, collaboration, information sharing, market location, and security [89]. Furthermore, Xu et al. classified supply chain resilience into 24 factors: risk awareness, security, information sharing, collaboration, adaptability, speed, product flexibility, visibility, agility, storage capacity, redundancy, knowledge, responsiveness, work efficiency, financial strength, market position, expectations, recoverable capabilities, dispersion, management, enterprise, culture, and interrelationships [32]. Konstantinou et al. argued that preparedness, alertness, and agility are the three pillars of supply chain resilience [90]. We have created the following Table 2 to show gaps in relevant research.
Based on the presented references, supply chain resilience is classified into the following 28 components in this study: agility, flexibility, redundancy, production capacity, speed, efficiency, responsiveness, permissions, visibility, adaption to ability, ability to predict, dispersion, coordination and cooperation, market position, information sharing, security, financial capability, product management, risk awareness, knowledge, culture, human resource management, technical ability, trust, sustainability, results, good customer service, and robustness. These resilience indexes will be assessed in detail in Section 4.

2.3. Big Data Analysis (BDA)

BDA is one of the recent technological achievements that has strong applicability in every industrial field, including manufacture [91,92,93]. Applying BDA in supply chains can improve supply chain transparency [94], increase the return on investment by 15–20% [95], improve competitiveness [96], reduce risk [97], and fundamentally improve the performance of supply chains [98].
Singh et al. believe that BDA plays an important role in mitigating the negative impact of supply chain interruptions; it can actively promote the development of supply chain risk resilience within the organisation [97]. Owing to the wide scope of big data analysis, many researchers have presented big data analysis enablers based on different research perspectives.
Wicher et al. classified BDAEs into big data infrastructure construction, information technology and organisational management, high-level support, BDA management ability, and maintaining market competition [99]. Chroneos, Soldic, and Jasna classified BDAEs into establishing a good database collection system, improving the speed of data management and retrieval, improving the efficiency of big data analysis and processing, improving information technology and institutions, and developing intelligent technology and digitalisation processes [100]. Duman classified BDAEs into strengthening database security protection, establishing data acquisition systems, establishing big data centres, improving the data retrieval speed, enhancing big data infrastructure construction, and government support [101]. Reiz et al. classified BDAEs into improving system construction, establishing big data-sharing mechanisms, optimising data structures, improving information technology, enhancing the utilisation value of big data, increasing investments, constructing strategic alliances for supply chains, and developing the guiding roles of governmental departments [102]. Reinmoeller and Van divided BDAEs into realising big data storage and maintenance, optimising data structures, increasing the capital investment, creating professional teams, and expanding the organisational scale [103]. Furthermore, Raut et al. divided BDAEs into improving big data support platforms and systems, improving information technology, increasing capital investment, and cultivating comprehensive talents [98]. Lutfi et al. argued that relative interest, complexity, security, support from top managers, organisational preparation, and government regulations are key enablers of big data analysis [104]. We have created the following Table 3 to show gaps in relevant research.
This study refers to 62 references from 2000 to 2022; we identified 51 big data analysis enablers, which will be assessed in detail in Section 4.

2.4. Sustainable Supply Chain Risk, Supply Chain Resilience, and Big Data Analysis
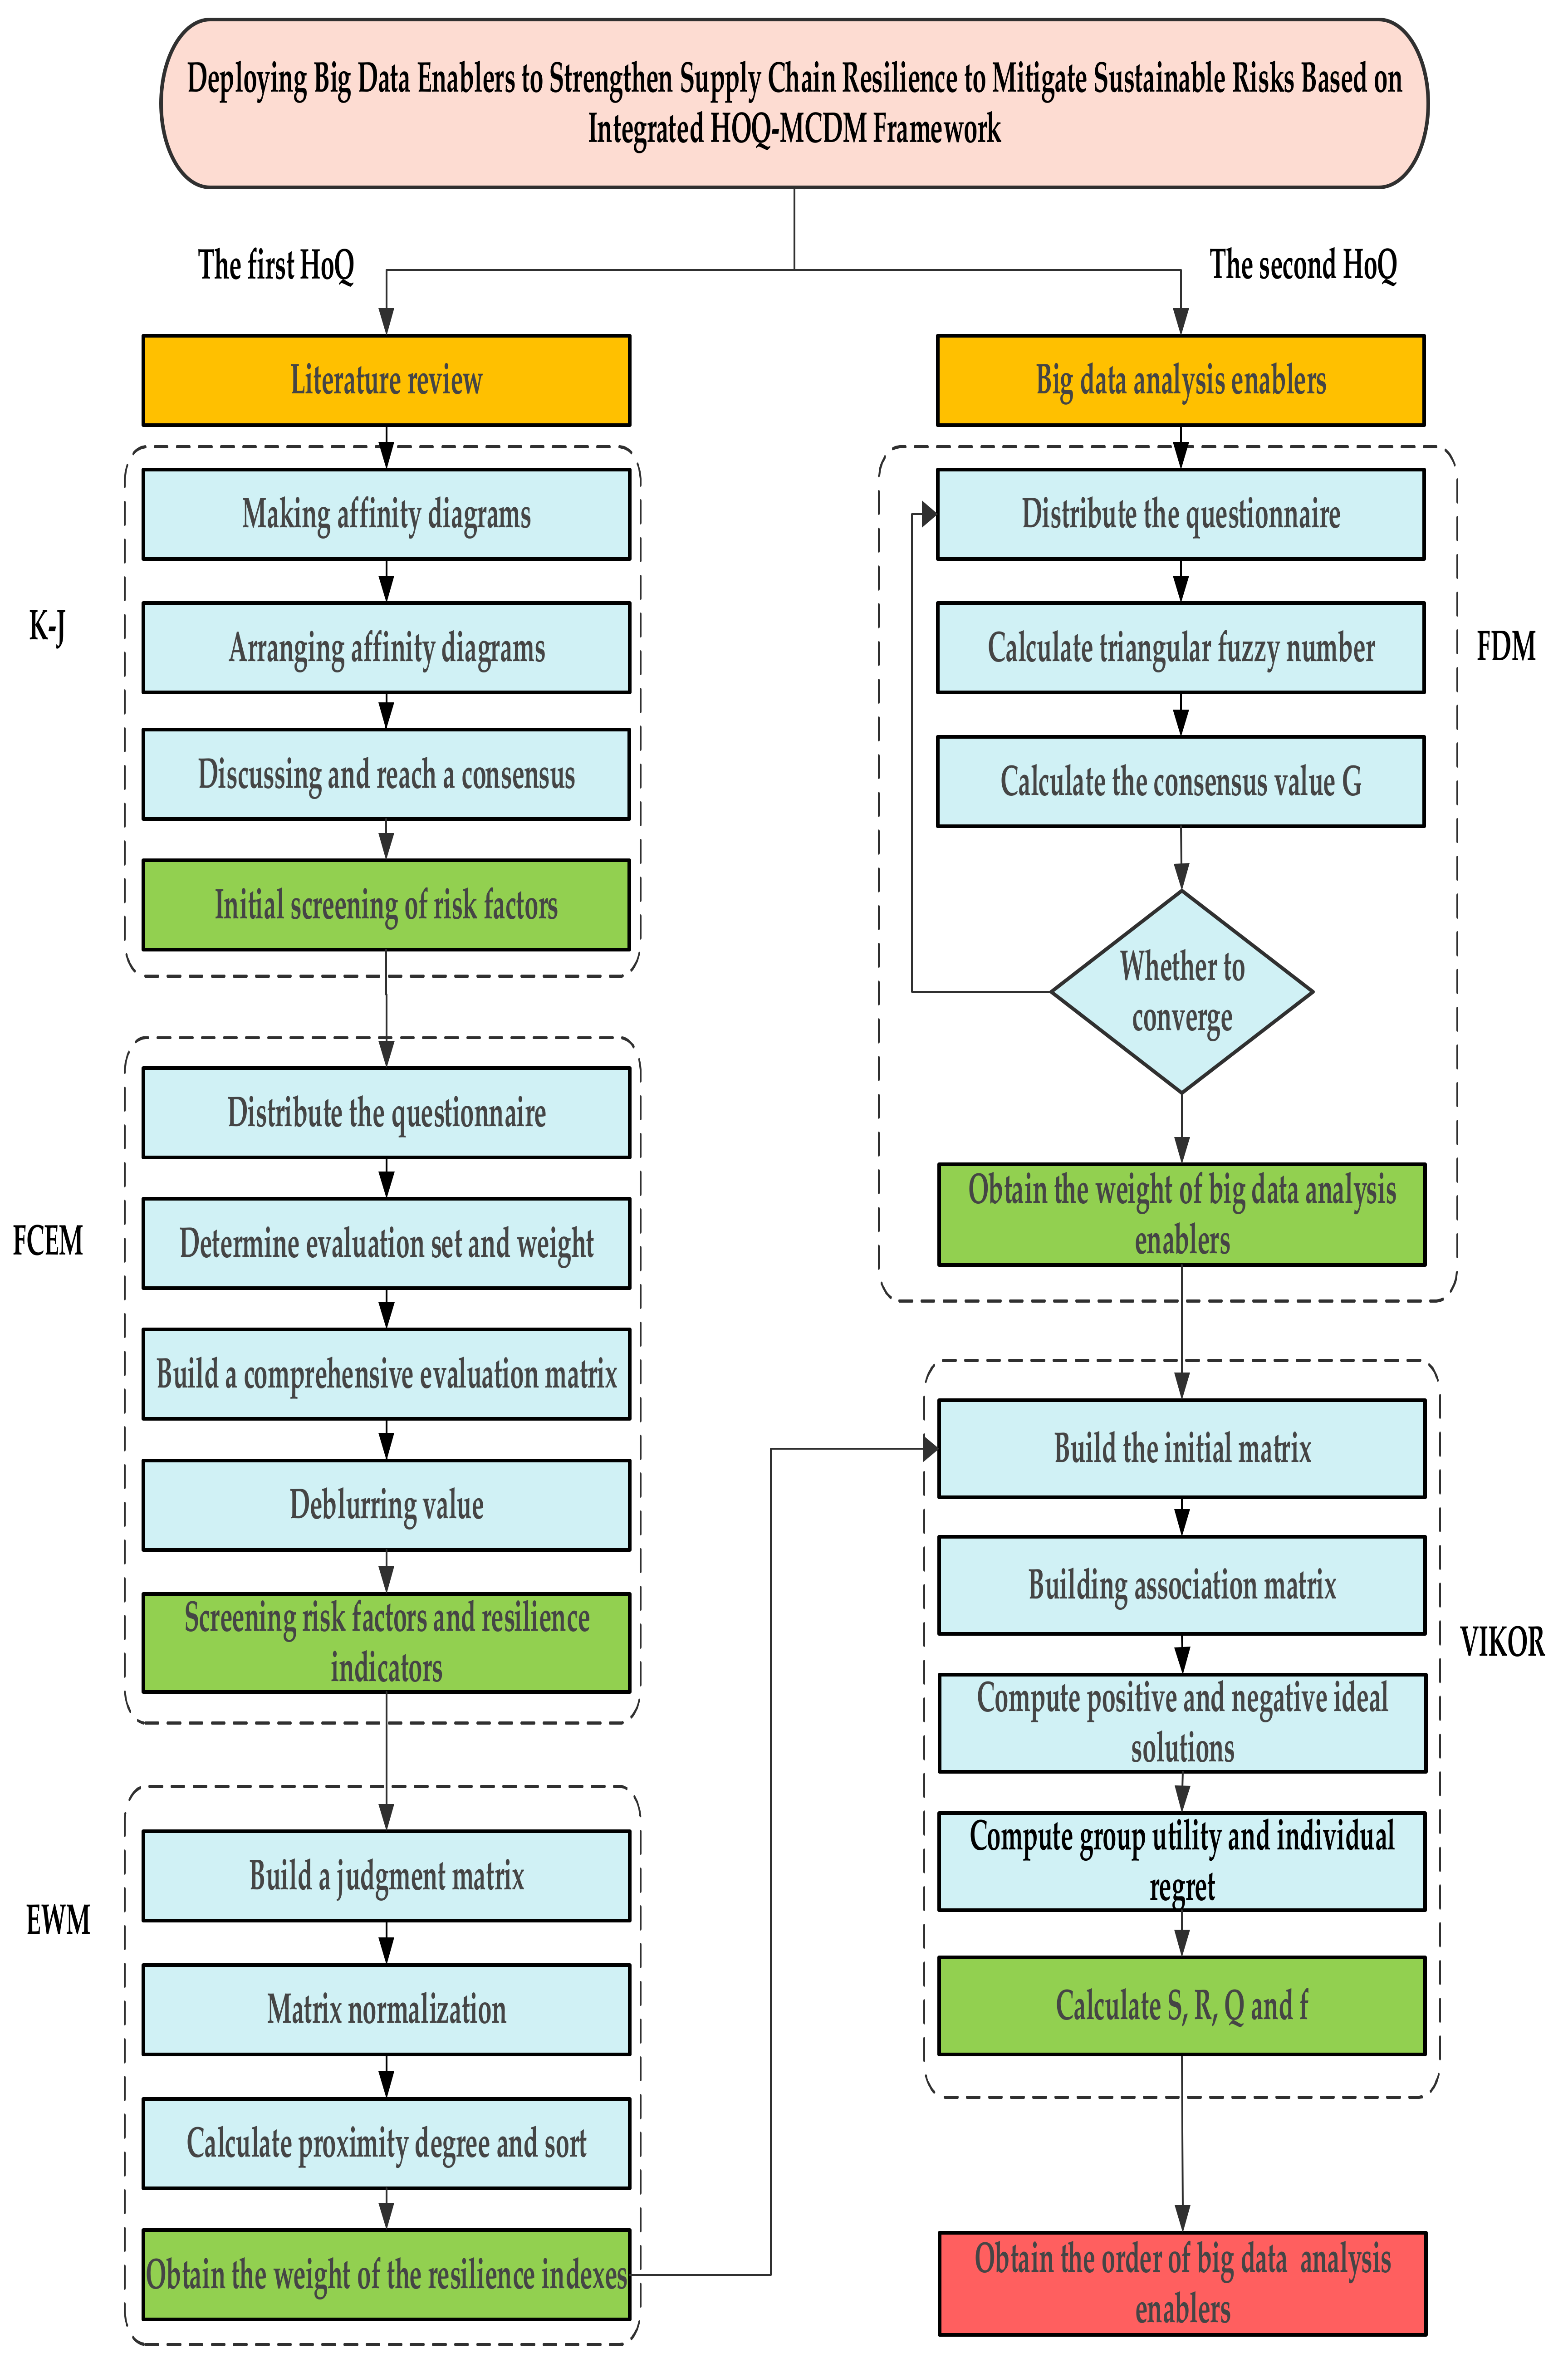
Ponomarov and Holcomb pointed out that SCM decisions can be made based on SCRE, and that investment in resilience has a positive impact on risk management [105]. Jüttner and Maklan pointed out that there is an established relationship between supply chain resilience, vulnerability, and supply chain resilience strategies; they stated that these three concepts are complementary to well-designed supply chains [106]. In addition, Heckman, Comane, and Nickel created a framework for SCRM to express SCRs as the main concept; the framework also considers vulnerability and resilience regarding the impact of risk on supply chains. This shows that supply chain risk and resilience are inextricably linked [107]. Kochak and Sharma used artificial neural networks to model the supply chain and make demand prediction. They believed that predicting future demand through artificial neural networks can help enterprises to make correct decisions in manufacturing and inventory management [108]. Furthermore, Fahimnia and Jabalzadeh examined the relationship between resilience and sustainability from the perspective of supply chain designs [109]. They presented a multi-objective optimal model for the successful design of sustainable and resilient supply chains. Zahiri et al. developed a linear multi-objective mixed-integer-integrated resilient and sustainable programming model to design supply chains under uncertain conditions [110]. Xue et al. used support vector regression (SVR) in machine learning to solve the dynamic prediction problem of commodity supply in case of disaster [111]. Moreover, Ivanov studied the interaction between resilience and sustainable supply chains [112]. He designed a resilient supply chain structure to mitigate chain reactions and sustainable development. Ivano analysed management and sustainability in supply chains; their relationship shows that sustainable development and resilience are closely related to the following aspects: the supply chain design; choice of suppliers; economic and social impact; lean, green, and agile management; climate change and environmental management; logistics; agricultural food supply chains; and management of supply chain performance [113].
In summary, the concept of supply chain resilience cannot be neglected in the study of sustainable supply chain risks. In addition, although many researchers have studied risk and resilience, they have not thoroughly studied manufacturing supply chains. Therefore, the relationship between the two aspects should be investigated. Based on the above studies, it is not difficult to see that the research purpose and significance of most of them are similar. That is, to improve supply chain resilience through some model or framework to reduce supply chain risk. However, it is not difficult to see that many of the studies focus on theoretical description, and are not practical. However, in other company-verified studies, the research methods are generally unique, and the scientific nature and accuracy of the research results are still questionable. There is not much literature in which the two have been combined, and there are many areas that have not been studied.
Researchers have shown that BDA has a positive impact on the development of supply chain risk resilience within an organisation [97]. Redman believes that BDA capabilities enable enterprises to respond flexibly to supply chain disruption events; thus, they have an important effect on improvement and recovery [114]. Regarding sustainable social development and the construction of resilient disaster infrastructures, big data analytics can help scientists, policymakers, and urban planners develop policies and strategies that internalise environmental and human health costs, which are currently being externalised [115]. Dubey et al. believe that enterprises should improve supply chain resilience from multiple aspects [116]. They also believe that the existing information and knowledge of managers can have an important effect on supply chain risk resilience, and that BDA capabilities can add significant value to these enhancement measures.
Many researchers have studied how BDA capabilities can help mitigate disasters and improve recovery, i.e., enhance resilience [114]. However, the presented studies have not adequately addressed how BDA can be used to improve supply chain risk resilience [117,118]. In addition, most of the current research on big data is conducted at the macro level, and little of it starts from the driving factors of big data, or discusses the relationship between the driving factors in detail. In addition, only few researchers have studied sustainable supply chain risk, supply chain resilience, and big data analysis. To the best of our knowledge, nobody has studied the relationship among the three variables. This paper addresses the related research gap. Therefore, we identified the key big data analysis enablers that can improve supply chain resilience and mitigate sustainable supply chain risks.

3. Methodology

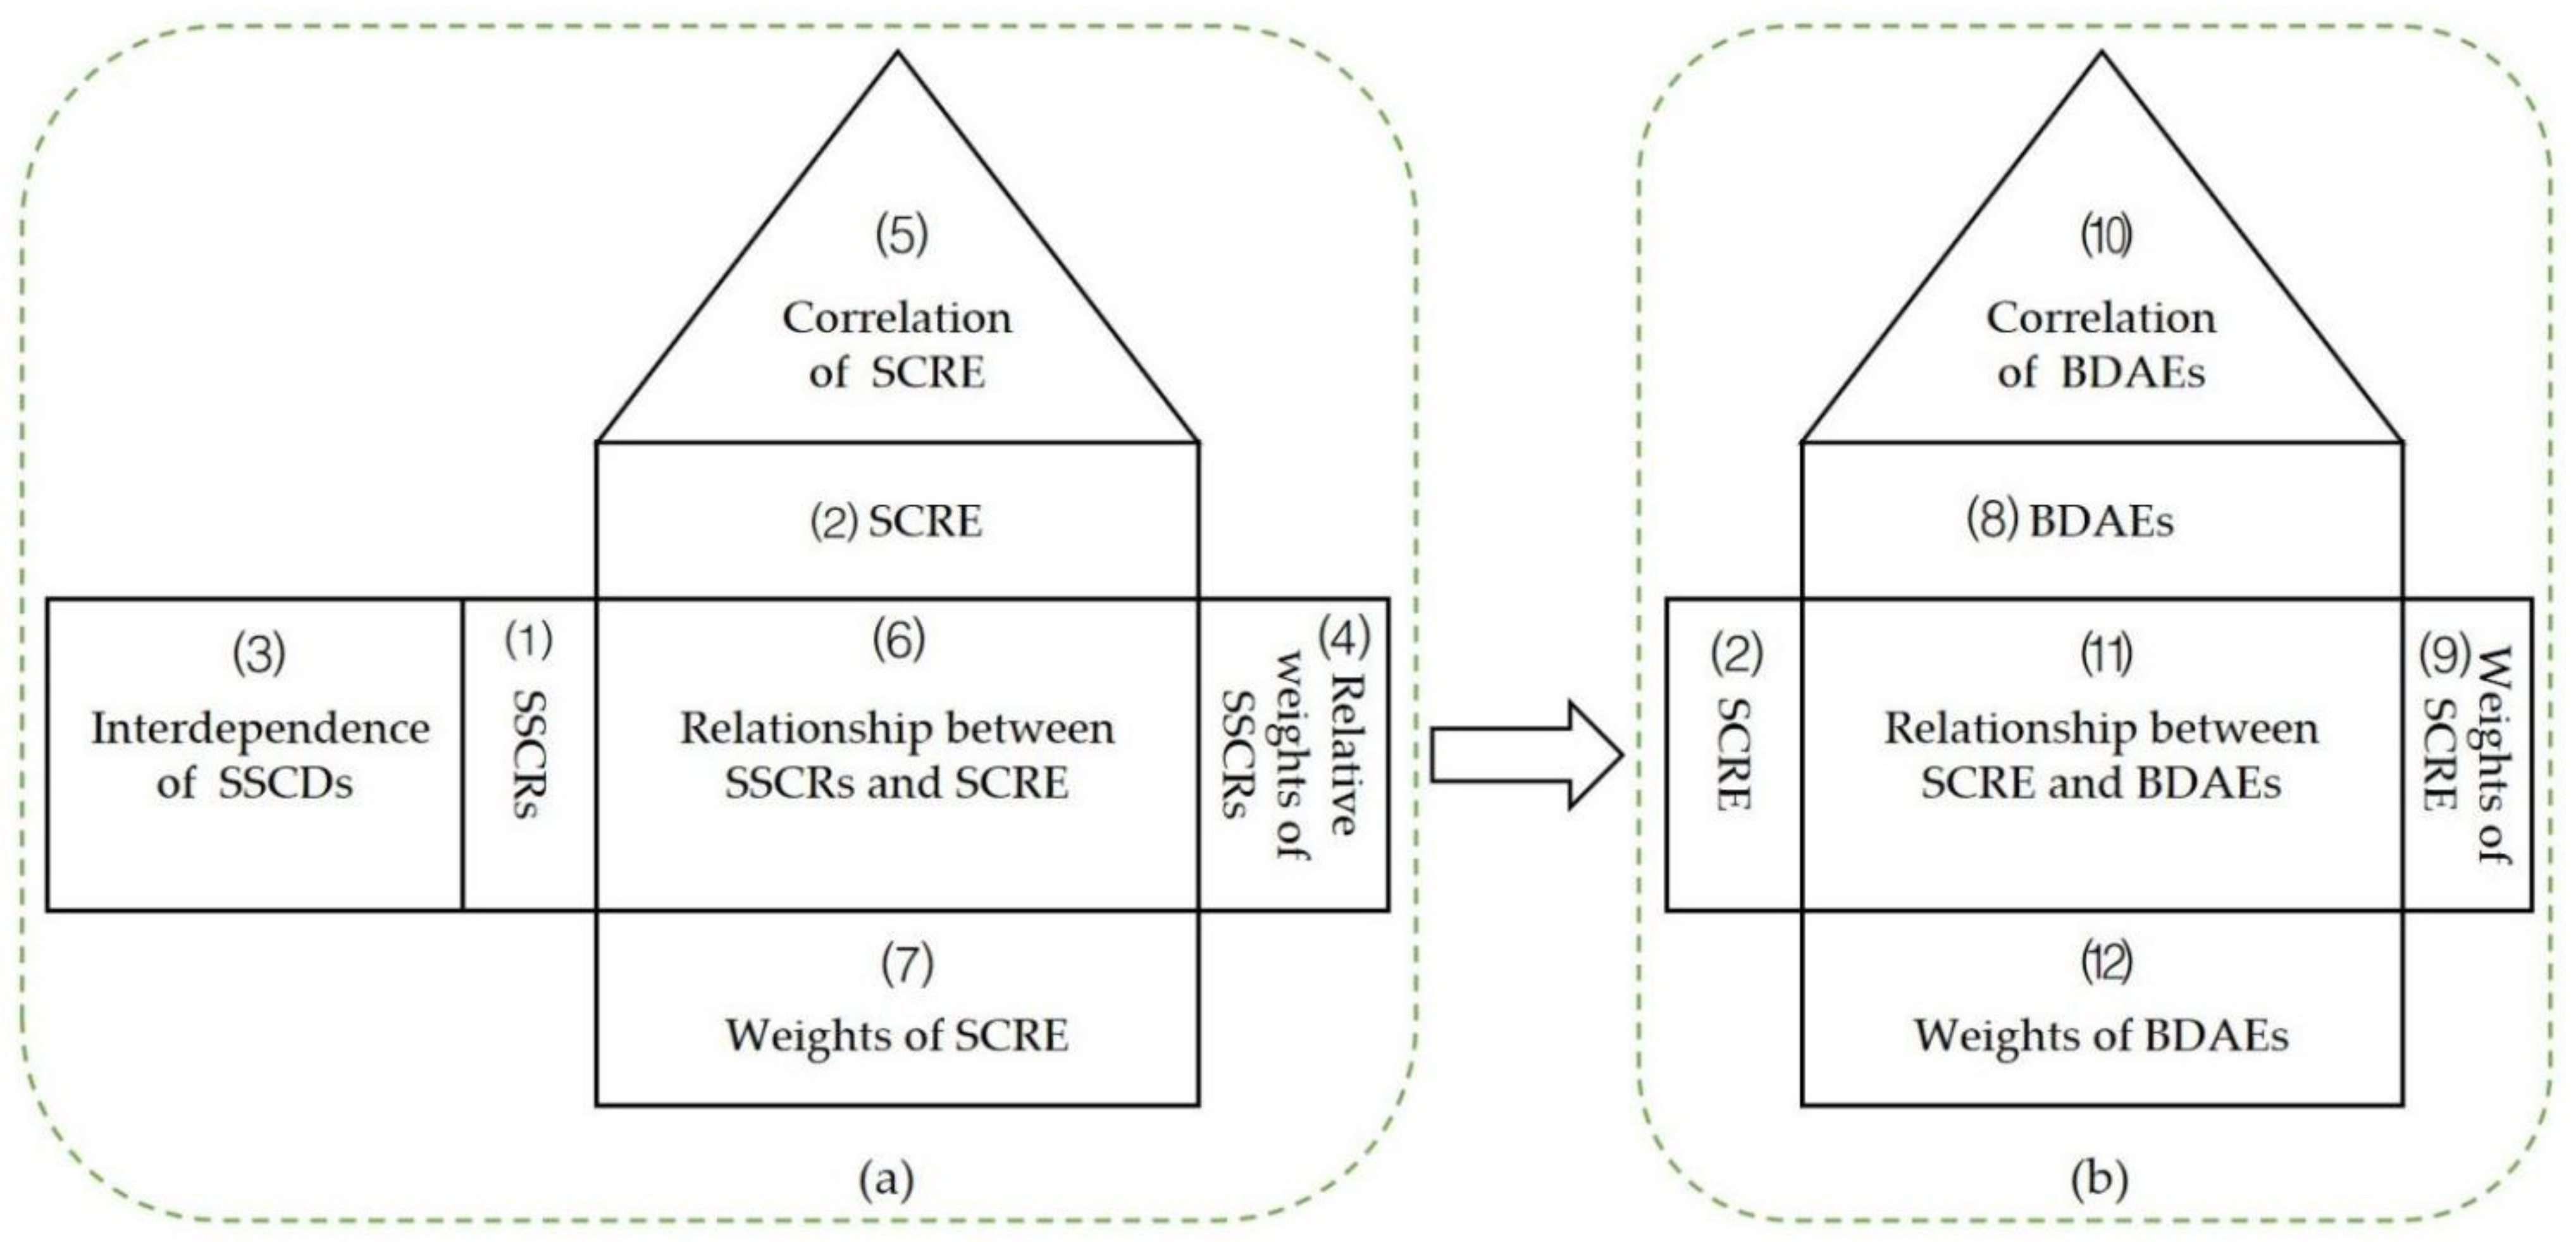
3.1. Quality Function Deployment

In this study, two HoQs were used as the framework of the system to connect SSCRs with SCRE, and SCRE with BDA. The first HoQ links sustainable supply chain risk to supply chain resilience to identify which resilience indexes are more effective in reducing supply chain risk. The second HoQ connects supply chain resilience with big data analysis to identify which big data analysis enablers significantly improve supply chain resilience. In addition, the resilience weight calculated in the first HoQ is the starting point for the construction of the second HoQ; it can be directly used as the importance weight of the second HoQ.
Affinity diagrams, the fuzzy comprehensive evaluation method, entropy weight method, Fuzzy Delphi method, and VIKOR were used to screen the risk factors and resilience indexes of the supply chain; the results present different factors and indexes that are suitable for the enterprise. The reasons for using this combined method are as follows. 1. The data in this study are entirely from questionnaires, and the Fuzzy Delphi method is one of the mainstream methods for analysing questionnaire data at present. 2. Considering the unique subjectivity of the questionnaire, this paper hopes to use a more objective evaluation method to offset the subjective influence brought by the data. Therefore, this study uses the fuzzy comprehensive evaluation method and entropy weight method to calculate the weight. Not only does this improve the objectivity of the data, but the results produced by the former method can be used directly by the latter. The data are not over-processed, which also ensures data consistency. 3. The most innovative research method in this study is the use of the VIKOR method. This method is relatively novel, and rarely cited by scholars. In addition, some scholars have proven that this method is a better calculation method. In accordance with the screening results, a correlation questionnaire was prepared to identify mutual relationships among factors and indexes, and the correlation matrix was determined. Finally, big data analysis is added to draw conclusions about the key big data analysis enablers. The research process of this study is shown in the figure below. These steps in this study are shown in Figure 1 and Figure 2. The symbols numbered from (1) to (12) in the text correspond to the relevant steps in Figure 1 and Figure 2 for easy recognition.

3.2. Affinity Diagram (K-J Method)

An affinity diagram, which is known as the K-J method, was used to classify and analyse, comprehensively, the collected data and information according to their proximity; this approach is also known as the ‘card method’. The tool used in the K-J method is the A-diagram to categorise and synthesise a large number of facts, opinions, or ideas collected on a particular topic according to their relationships. Collecting different opinions, ideas, and experiences of persons without making any choice, and identifying the relationship among these data enables thinking creatively, breaking the status quo, and taking coordinated actions to solve problems.

3.3. Fuzzy Comprehensive Evaluation Method

Fuzzy comprehensive evaluation is based on fuzzy mathematics. It can deal with imperfect information, and uncertain and qualitative problems. Therefore, the fuzzy comprehensive evaluation method was used in this study to evaluate sustainable supply chain risk and supply chain resilience indexes. The specific steps are as follows:
  • The supply chain resilience index and sustainable supply chain risk factor set U and evaluation set V are determined. Simultaneously, the weight of each influencing factor W is determined;
  • The score membership function and comprehensive evaluation matrix R of each factor are constructed, and the membership degree and R are calculated to obtain the fuzzy set;
  • The fuzzy comprehensive evaluation set B is obtained based on the fuzzy comprehensive evaluation matrix R and fuzzy operator ∘ = (∙, +);
B = W R ,
4.
The defuzzifying value (i.e., the comprehensive evaluation score E of the evaluation object) is calculated with the fuzzy comprehensive evaluation set B and measurement scale H;
E = B × H ,
Degrees of H = (very satisfied, satisfied, average, not satisfied, very dissatisfied) = (5, 4, 3, 2, 1).

3.4. Entropy Weight Method

The entropy value can be used to assess the dispersion degree of an index. The smaller the information entropy value is, the greater the dispersion degree of the index is, and the greater the influence of the index on the comprehensive evaluation (namely, the weight) is. If all the values of an index are identical, the index has no effect on the comprehensive evaluation. Therefore, the weight of each index can be calculated with the information entropy to provide a basis for the comprehensive evaluation of multiple indexes. The specific steps of this method are as follows:
  • Standardisation of the original data matrix: let us assume that the original data matrix obtained with m evaluation objects and n evaluation indexes is as follows:
X = x 11 x 12 x 1 n x 21 x 22 x 2 n x m 1 x m 2 x mn ,
The matrix is normalised as follows:
R = ( r ij ) m × n ,
where r i j is the standard value of the ith evaluation object of the JTH evaluation index, r i j 0 , 1 . The indexes that are superior to the larger ones are as follows:
x = x i j min j { x i j } max j { x i j } min j { x i j } ,
The indexes that are superior to the smaller ones are as follows:
x = max j { x i j } x i j max j { x i j } min j { x i j } ,
Negative values and zeros must be eliminated to process the data meaningfully. Therefore, the dimensionless data should be translated as a whole, i.e., x i j = x i j + a . However, the original data should be retained to the maximum extent to avoid destroying the inherent regular of the existence of original data. The value of a should be as small as possible, i.e., it should be closest to the minimum value of x i j . Therefore, a = 0.0001 was considered in this study.
2.
Definition of entropy: In an evaluation problem with n indexes and m evaluated objects, the entropy of the JTH index is defined as follows:
H j = k i = 1 m f i j ln f i j , i = 1 , 2 , , m , PS : f i j = r ij / i = 1 m r ij , k = 1 / ln m , ( f i j = 0 , f i j ln f i j = 0 ) ,
3.
Definition of entropy weight: In the next step, the entropy weight of the JTH index can be defined:
w j = 1 H j j = 1 n H j , PS : 0 w j 1 , i = 1 n w j = 1 ,
4.
Determination of index attribute matrix A: The index attribute matrix A is obtained by multiplying the index weight w j and translated standard matrix R; the result is ranked. The equation of the comprehensive score is as follows:
A = a 11 a 1 n a m 1 a mn = k 1 b 11 k n b 1 n k 1 b m 1 k n b mn ,
5.
Calculation of ideal point p * and proximity degree T i : The ideal point p * is as follows:
p * = ( p 1 * , p 2 * , , p n * ) ,
The type of P j * is the optimal value of each column in A, which is the maximum value, i.e., p j * = Max { a ij , I = 1 , 2 , , M } where j = 1 , 2 , , n .
The relationship between the evaluated object and ideal point p * is as follows:
T i = 1 j = 1 n a ij p j * j = 1 n ( p j * ) 2 , i = 1 , 2 , , m ,

3.5. Fuzzy Delphi Method

The Fuzzy Delphi method is an empirical judgment method in which expert opinions on potential events are anonymously consulted through several correspondence rounds; the organisers collect the opinions in a centralised manner to obtain relatively consistent expert predictions. The Fuzzy Delphi method involves statistical analysis and fuzzy calculation to transform subjective expert opinions into objective data. Applying the Fuzzy Delphi method to factor screening comprehensively considers the uncertainty and fuzziness of subjective expert opinions. To identify the key factors in line with the case study, the Fuzzy Delphi method was first used to screen the big data analysis enablers; the application steps are as follows:
  • All big data analysis enablers are identified. Subsequently, the Fuzzy Delphi expert questionnaire is designed, and each expert is asked to evaluate the importance of each factor for interval scoring. The maximum interval value represents the ‘most optimistic value’ of the expert’s score for this factor. By contrast, the minimum represents the ‘most conservative value’ of the expert’s quantification score for this factor.
  • The expert questionnaires are collected, and the data are integrated. In the next step, the most conservative and most optimistic values of all experts are counted, and extreme values beyond the double standard deviation are eliminated. Fuzzy theory is used to calculate the minima C L i , maxima C U i , geometric means C M i , minimum value O L i and maximum value O U i in “Most Optimistic Value”
  • Finally, the consensus degree of the expert opinions is calculated to determine G i , whether the opinions of all experts have reached consensus or not. The lower the value is, the lower the consensus among experts on this factor is. M i represents the range of optimistic and conservative cognition, and Z i represents the grey area of fuzzy relationships. When M i > Z i , the expert opinions tend to converge. Otherwise, the differences among the expert opinions do not converge; in this case, steps 1–3 must be repeated until all factors converge. The final value G i is calculated as follows:
    G i = ( C U i × O M i ) ( O L i × C M i ) ( C U i C M i ) + ( O M i O L i ) ,
  • A reasonable threshold value G i must be chosen to identify key big data analysis enablers.

3.6. VIKOR

The VIKOR method is based on the measurement of the Hemming and Chebyshev distances; it considers a project optimal when it integrates the ideal solution of the Hemming and Chebyshev distances; this method can measure the design coefficient of the two distances according to the preference of decision-makers. This compromise–multicriteria decision-making method was proposed by Zeng and Opricovic et al. The basic steps of this method are as follows:
  • First, the positive and negative ideal solutions are defined. They refer to the best and worst alternatives in the evaluation criterion, respectively.
  • The evaluation values of alternative schemes are compared, and the priorities of each scheme are arranged according to the distance between them and the ideal scheme [119]. The VIKOR method determines the feasible compromise solution closest to the ideal solution. Compromise means mutual concessions between attributes, which originates from the LP-metric of the compromise planning method (Yu, 1973; Zeleny, 1982); it provides maximum group benefit and minimum individual regret of the opposition. Therefore, the compromise solution can be an acceptable approach for decision-makers [120]. The steps are as follows:
    • Primitive matrix normalisation:
      r i j = u i j i = 1 m u i j , 1 i m , 1 j n , u i j B ,
After the standardisation r i j of the original matrix data U i j , B is the decision set. The positive and negative ideal solutions are calculated as follows:
f i * = ( max j f i j i I 1 ) , ( min j f i j i I 2 ) , i
f i = ( min j f i j i I 1 ) , ( max j f i j i I 2 ) , i
where f i * is the positive ideal solution, f i the negative ideal solution, j all alternative solutions, i all evaluation decisions, f i j the performance evaluation value of the alternative solutions (the specific value of f i j can be found in the questionnaire), I 1 the set of benefit evaluation decisions, and I 2 the set of cost evaluation decisions.
  • The group utility S j and individual regret R j are calculated as follows:
    S j = i = 1 n w ( f i * f i j ) ( f i * f i )
    R j = max i w i ( f i * f i j ) ( f i * f i )
    where w i is the relative weight of the evaluation decisions. It should be noted that the risk weight determined based on the recovered data of the fuzzy comprehensive evaluation questionnaire was used as the weight of the HoQ of the first stage in this study; the calculated results of the HoQ of the first stage were used as the weight of the second stage.
  • The sorting value Q is computed as follows:
    Q j = v ( S j S * ) ( S S * ) + ( 1 v ) ( R j R * ) ( R R * )
    S * = min { S j } , S = max { S j }
    R * = min { R j } , R = max { R j }
The following aspects should be noted:
  • v is the coefficient of the decision-making mechanism. When it is greater than 0.5, decisions are made according to a discussion between the majority of people (biased to the utility level). When it is close to 0.5, decisions are made according to an approval situation. When it is less than 0.5, decisions are made according to a situation of rejection (biased to the regret level).
  • The min { S j } is the maximum group utility, and min { R j } is the minimum individual regret; Q j represents the efficiency ratio that can be produced with j ’s decision-making scheme, which is used as the ranking standard.
    (1)
    The schemes are sorted according to the relationship among Q j , S j , and R j .
    When the following two conditions are true, the scheme can be sorted according to the size of Q j (the smaller Q j is, the better the scheme is):
    ① The initial condition is as follows:
    Q Q 1 J 1 ,
    where Q is the first-rank Q value after sorting according to the Q value; Q is the Q value of the second scheme sorted according to the Q value; J is the number of all evaluated schemes. This equation indicates that only when the difference of the benefit ratio between two adjacent schemes is greater than or equal to the threshold value 1 / ( J 1 ) , the first-rank scheme is significantly better than the second-rank scheme. If there are multiple methods at the same time, the first and second schemes and the third and fourth schemes are compared to determine whether they meet the previously presented conditions ①.
    ② Decision reliability
    After the schemes have been sorted according to Q , the S -value of sorting the first option (the greater, the better) must also be better than that of sorting the second option. Alternatively, the R -value of the first-ranked solution (the smaller, the better) must also be better than that of the second-ranked solution. If there are multiple methods at the same time, the first and second schemes and the third and fourth schemes are compared to determine whether they meet the previously presented conditions ②.
    (2)
    Judgment rules
If the first- and second-ranked schemes satisfy conditions ① and ②, the optimal scheme is the first scheme. If the relationship between the first- and second-ranked schemes only satisfies condition ②, both schemes are accepted as the optimal schemes. If the relationship between the first-ranked scheme and other schemes only satisfies condition ②, the schemes that do not satisfy condition ① are accepted as the optimal scheme.

4. Case Analysis

One of China’s top 100 electronics manufacturing companies is taken as a case study to verify the proposed framework. The case company is a leader in the global relay industry, and has become a world-class relay R&D and production base. It has more than 30 subsidiaries in the import business that produce a large number of mechanical equipment, spare parts, and raw and auxiliary materials needed by the market every year. However, owing to the large and complex supply chain system of the enterprise, it is difficult for the company manager to analyse risks in the supply chain. Accordingly, it is difficult to identify indexes and big data analysis enablers to improve supply chain resilience. The goal of this study is to help managers establish a new perspective, and analyse possible problems in the supply chain. Therefore, we conducted in-depth structured interviews with experts from different departments.
The methods proposed in this study involve two HoQs (i.e., sustainable supply chain risk and supply chain resilience; supply chain resilience and big data analysis enablers). The expertise from seven supply chain experts from different departments was used to make an overall judgment. Finally, the obtained data were transformed into a QFD framework.

4.1. Stage 1: House of Quality

4.1.1. K-J Method

In the first stage, the K-J method was used to design the sustainable supply chain risk questionnaire, and preliminarily screen the risk factors. According to the votes of experts, 69 risk factors regarding sustainable supply chains were identified; the resulting 19 risk factors were classified into 10 internal and 9 external risks (e.g., interruption in customer supply, transportation interruptions, technical risks, and equipment failure).

4.1.2. Fuzzy Comprehensive Evaluation Analysis (FCEA)

The fuzzy comprehensive evaluation method was used to design questionnaires for resilience indexes and risk factors of sustainable supply chains. The analysis steps are as follows:
  • Risk factors of sustainable supply chains
    • Determination of factor weight
    • The evaluation set is as follows: V = ( v 1 , v 2 , v 3 , v 4 , v 5 ) = (very important, important, average, unimportant, very unimportant). The risk factor evaluation index set U contains 19 factors including the previously mentioned ‘interrupted customer supply’, ‘transportation interruptions’, ‘technical risks’, and ‘equipment failure’: U = ( U 1 , U 2 , , U 19 ) . The fuzzy comprehensive evaluation model is used to calculate the evaluation matrix of each factor. Construction of membership matrix R : The tourist evaluations of the interpretation validity of secondary indexes is obtained after data sorting according to the scoring status of the questionnaire. The membership matrices R 1 and R 2 corresponding to the internal risk U 1 and external risk U 2 of the secondary evaluation index set are constructed accordingly:
      R 1 = 0.167   0.500   0.333   0.000   0.000 0.333   0.667   0.000   0.000   0.000 0.333   0.333   0.333   0.000   0.000 0.167   0.500   0.333   0.000   0.000 0.333   0.000   0.500   0.167   0.000 0.000   0.333   0.500   0.167   0.000 0.833   0.167   0.000   0.000   0.000 0.333   0.167   0.500   0.000   0.000 0.500   0.000   0.000   0.500   0.000 0.000   0.167   0.667   0.167   0.000
      R 2 = 0.000   0.333   0.167   0.500   0.000 0.167   0.333   0.167   0.500   0.000 0.333   0.167   0.333   0.167   0.000 0.500   0.333   0.167   0.000   0.000 0.167   0.333   0.333   0.167   0.000 0.333   0.667   0.000   0.000   0.000 0.333   0.167   0.500   0.000   0.000 0.167   0.833   0.000   0.000   0.000 0.500   0.333   0.167   0.000   0.000
    • The FCEA vector of the indexes at all levels is determined: the FCEA set B is calculated with the fuzzy operator = ( , ) , and the weight value of the indexes according to Equation (1):
      B 1 = W 1 R 1 = ( 0.300 , 0.283 , 0.317 , 0.100 , 0.000 )
      B 2 = W 2 R 2 = ( 0.278 , 0.389 , 0.204 , 0.130 , 0.000 )
      where W i is the weight of each index, and is the fuzzy operator. As one of the common synthesis operators in fuzzy mathematics, the product-sum operator M ( , ) highlights the weight, and considers all kinds of indexes with strong comprehensive efficiency and small information loss. Therefore, this operator was selected for the synthesis operation of the fuzzy matrix.
    • Determination of evaluation value: According to Equation (2), the evaluation value obtained via the defuzzification of the first-level index set is as follows. The evaluation value E obtained via the defuzzification of each evaluation set is shown in Table 2:
Result analysis: The 10 risk factors with the highest evaluation values are the IT infrastructure risks (A1), the risk of interruptions in the customer supply (A2), transport interruptions risks (A3), risks caused by suppliers (e.g., unqualified supply) (A4), natural disaster risks (A5), the risk of government instability (A6), equipment failure risks (A7), technical risks (A8), inventory risks (A9), and information asymmetry risks (A10).
  • Resilience
The resilience calculation procedure is identical to that of the risk factors. Through calculation, the weight of each resilience index and the score data of the questionnaire survey can be summarised. Similarly, the weight of each index can be calculated according to the steps in Section 3.3, and the E value of each index can be calculated with the comprehensive fuzzy evaluation model.
According to the E value, the first ten indexes are agility (B1), sustainability (B2), robustness (B3), flexibility (B4), corporate culture (B5), financial ability (B6), redundancy (B7), information sharing (B8), dispersion (B9), and supply chain structure (B10).

4.1.3. Entropy Weight Method

The relationship matrix was determined based on a statistical expert questionnaire on the relationship among resilience and sustainable supply chain risk factors. Subsequently, the entropy weight method was used to calculate the weights of the supply chain risk factors and order of resilience indexes. The specific analysis results are as follows:
  • Standardisation of original data matrix: the normalised matrix R with translation of 0.0001 unit is obtained based on Equations (4)–(6).
    R = 0.3078   0.9232   0.5386   0.6155   0.3078   0.3078   0.0001   0.6155   0.8463   0.1001 0.0001   0.3751   1.0001   0.8751   0.7501   0.5001   0.1251   0.7501   0.8751   0.8751 0.3334   0.5001   0.0001   0.4168   1.0001   0.5834   0.1668   0.1668   0.6668   0.8334 0.5001   0.3001   0.5001   0.5001   1.0001   0.0001   0.7001   0.4001   0.9001   0.9001 0.3334   0.3334   0.5557   0.0001   0.4445   0.6668   0.4445   0.7779   0.5557   1.0001 0.6668   0.3334   0.7501   0.4168   0.0001   0.1668   0.7501   0.9168   0.5834   1.0001 0.6251   0.7501   0.8751   0.6251   0.5001   0.2501   0.0001   0.6251   1.0001   0.8751 0.6668   0.7334   0.8001   0.4001   0.4668   0.4001   0.5334   0.0001   0.1112   0.5557 0.3334   1.0001   0.2223   0.1112   0.1112   0.2223   0.0001   0.0001   0.1112   0.5557 0.0001   0.7174   0.5456   0.8183   0.2728   0.2728   0.3637   0.7274   0.6365   0.7274
  • Definition of entropy: the entropy value H j of each evaluation index can be calculated according to Equation (7) and the normalised matrix R, as shown in Table 4.
  • Definition of entropy weight: the entropy weight W j of each evaluation index can be calculated according to Equation (8) and the entropy value H j ; for details, see Table 4.
    Table 4. Weight of risk factors.
    Table 4. Weight of risk factors.
    Level   Factors   ( U i ) Weight   of   First-Level   Factors   ( W i ) The   Secondary   Factors   ( U i j ) Weight   of   Second-Level   Factors   ( W i j )
    Internal risk0.524Equipment failure risks0.101
    The risk of interruptions in the customer supply0.115
    Technical risks0.106
    Inventory risks0.101
    The risk of lack of quality staff 0.093
    Outsourcing risks0.084
    IT infrastructure risks0.128
    Information asymmetry risks0.101
    Single supplier risks0.093
    The risk of defective product0.079
    External risk0.476The risk of loss of cargo0.083
    Accident risks0.097
    The risk of cognitive error0.107
    The risk of government instability0.126
    Demand risks0.102
    Transport interruptions risks0.126
    The risk of late delivery0.112
    Risks caused by suppliers (e.g., unqualified supply)0.121
    Natural disaster risks0.126
  • Determination of index attribute matrix A: the entropy weight W j is added to the evaluation index attribute matrix, and Equation (9) is used to obtain the weighted index attribute matrix.
  • Calculation of ideal point P * and closeness degree T i : According to Equation (10), the ideal point is
    P * = ( 0.1693 , 0.0107 , 0.0233 , 0.1221 , 0.1516 , 0.1880 , 0.3233 , 0.1659 , 0.0120 , 0.1700 )
According to the calculation results, the evaluation objects are ranked from large to small (i.e., the degree of the impact of each resilience index on sustainable supply chain risk is ranked from large to small); their matching progress is shown in Table 5.

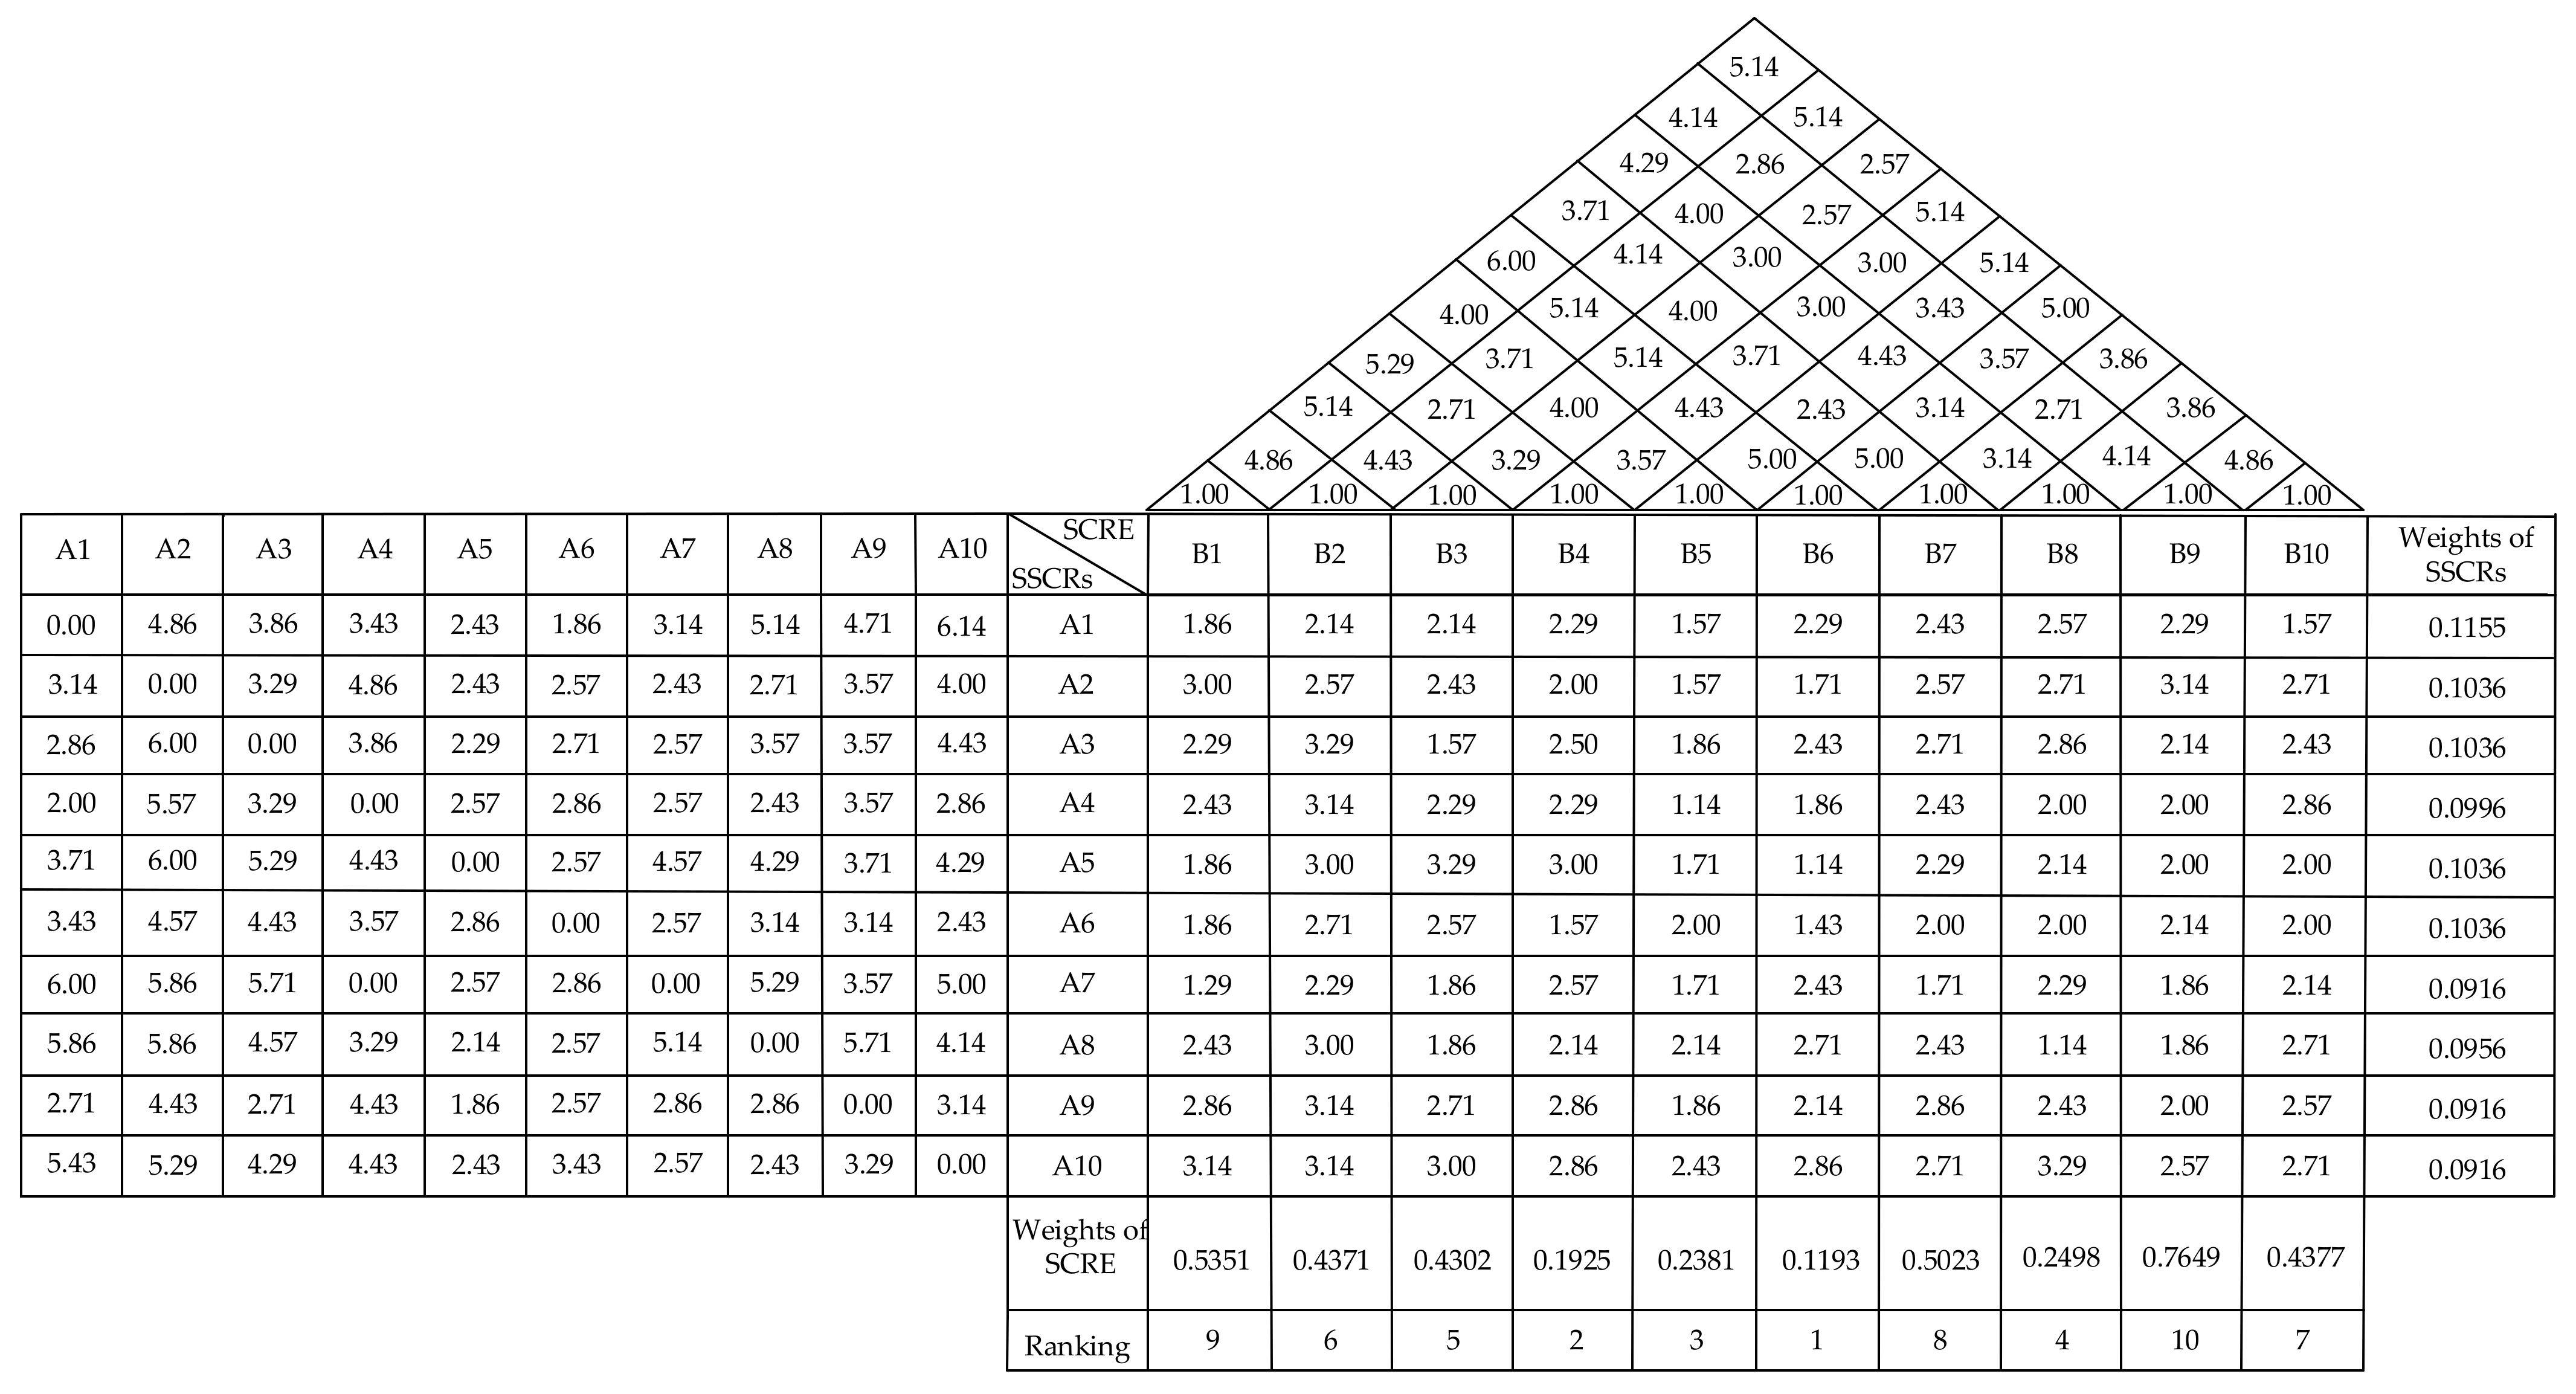
4.1.4. Construction of HoQ in the First Stage

Because sustainable supply chain risk and resilience have mutual influences, and the risk factors of resilience and sustainable supply chains are also correlated, a correlation analysis must be performed on the aspects ‘sustainable supply chain risk’ and ‘resilience’. Therefore, ten sustainable supply chain risk factors and ten resilience indexes screened with the fuzzy comprehensive evaluation method were analysed, and three questionnaires were issued to seven experts of the enterprise. The calculated average values of the questionnaire results are shown in Table 6, Table 7 and Table 8. These results were used as the data of the first stage of HoQ.
Owing to the correlation between risk and resilience, the product of the correlation matrix is used as the result of the initial matrix of the House of Mass. Risk itself exhibits correlations between different risk factors. Therefore, the initial matrix must also include the risk association matrix. The sustainable supply chain risk association matrix A * A is multiplied by the sustainable supply chain risk–resilience association matrix A * B, and then multiplied by the resilience association matrix B × B to obtain the initial QFD matrix of the first stage. The initial matrix is normalised, as shown in Table 9.
At this point, the analysis of the first HoQ stage is completed. Figure 3 shows the procedure of quality function deployment.

4.2. Stage 2: House of Quality

4.2.1. Fuzzy Delphi Method

The analysis in this stage mainly involves the use of Equation (12) and EXCEL2018 to calculate the G value and set an appropriate threshold value S for screening. After the discussion of the experts, the threshold value was set to 6.55. If the G value of the big data analysis enablers is ≥6.55, this criterion is acceptable. Otherwise, it is deleted.
After the screening process with the Fuzzy Delphi method, 10 of the 51 big data analysis enablers with the highest G values were selected for aggregation. The specific analysis steps are as follows:
  • Analysis of expert questionnaires
After integrating the data of the questionnaires from the seven experts, the extreme values were excluded; subsequently, the data that represent the most optimistic and most conservative cognitive values of the experts were excluded in the following calculation. As the data analysis results are within two standard deviations of the mean, they do not have to be eliminated.
2.
Calculation of triangular fuzzy number and consensus value G i
The G i value of the big data analysis enablers is calculated with Equation (12). The greater the consensus value is, the higher the degree of consensus among experts is, i.e., the greater the degree of consistency.
3.
Setting of threshold
Based on the previous step, the threshold of the big data analysis enablers is set to 6.55. If the value is smaller than the threshold, the corresponding big data analysis enablers will be deleted; the results are shown in Table 10, Table 11 and Table 12.

4.2.2. VIKOR

The VIKOR method is applied in the calculation of the ranks of the big data analysis enablers. The purpose of this step is to assess the impact of different enablers on the enterprise resilience indexes; the ranking results are the final result of this study; they can serve as guidance for enterprise managers.
First, the correlation among the resilience index and big data analysis enablers (i.e., the correlation between the resilience index itself and the big data analysis enablers itself) should be considered for the construction of the initial matrix. Therefore, a correlation questionnaire was designed; the questionnaire results were summed up and averaged.
Considering the previous correlation among the resilience indexes, the resilience association matrix B*B is multiplied by the association matrix B*C of resilience-big data analysis enablers, and then multiplied by the association matrix C*C of big data analysis enablers to obtain the initial QFD matrix of the second stage. The standardised initial matrix H can be obtained with Equation (13); the results are shown in Table 13.
The data in Table 14 were substituted into Equations (14) and (15) to obtain the positive ideal solution f i * and negative ideal solution f i of each big data analysis enabler.
Subsequently, group utility S j and individual regret R j were calculated; W i in Equations (16) and (17) was used to evaluate the relative weight of each resilience index. It is expressed with the reciprocal form of the closeness degree of each resilience indexes.
The reciprocal closeness degree was substituted into Equations (18) and (19) to calculate group utility S j and individual regret R j , as shown in Table 15. Finally, the profit ratio P j was calculated. In Equation (20), v is the decision-making mechanism coefficient. To maximise group utility and minimise individual regret, v was set to 0.5.
In Equations (21) and (22), min { S j } is the maximum group utility, min { R j } is the minimum individual regret, and Q j is the interest rate that can be generated by j’s decision. The results calculated with Equations (20)–(22) are shown in Table 16, Table 17, Table 18 and Table 19.
In accordance with the two previously presented conditions, Q j was substituted into Equation (23). Owing to the limitation of condition ② (acceptable decision reliability), if both conditions are true, the order can be carried out according to the size of Q (the smaller Q j is, the better).
The method continued to rank the big data analysis enablers. In accordance with the two conditions, Q j was substituted into Equation (21). If both conditions are true, it can be sorted according to the size of Q; the sorting results are shown in Table 20 above (the smaller Q j is, the better). The final sorting result can be obtained by comparing the enablers in pairs with the judgment rule:
C 3 , C 1 , C 4 > C 10 , C 2 , C 7 , C 5 , C 9 > C 8 > C 6
At this point, the second stage of the HoQ analysis has been completed. Because the smaller the Q j value is, the better, 1 Q j was uniformly used as the index weight for the second-stage HoQ application. The results of the quality function expansion in the second stage are shown in Figure 4.

4.3. Results and Discussion

Owing to the limited resources of the enterprise, it is impossible to improve, simultaneously, the supply chain resilience and big data analysis enablers of all aspects of the enterprise. Therefore, to maximise corporate interests, limited resources must be used to reduce or mitigate the most critical sustainable supply chain risks. To reduce risks effectively, suitable supply chain resilience and big data analysis enablers must be identified and improved. Therefore, a method for improving supply chain resilience based on big data analysis enablers, the K-J method, fuzzy comprehensive evaluation method, entropy weight method, Fuzzy Delphi method, and the integration of VIKOR into QFD is presented to mitigate sustainable supply chain risks. Through the implementation of the two-stage HoQ, sustainable supply chain risk is transformed into supply chain resilience, and supply chain resilience is transformed into big data analysis enablers.
One should not select too few indexes or enablers when selecting supply chain resilience indexes and big data analysis enablers. Too few choices will result in a diminishing marginal effect. In other words, when other inputs are fixed, a continuously increasing input will gradually reduce its new output or income. That is, if an enterprise improves on only one measure, the benefits may be limited, no matter how great the improvement is. Of course, it is not advisable to choose too many indexes or factors, because enterprise resources may become dispersed, and the desired effect will not be achieved. Therefore, in the case of limited resources, enterprises should first reduce or mitigate the most critical sustainable supply chain risks; low-level risks can be temporarily shelved until resources are available. To mitigate sustainable supply chain risks, the most important big data analysis enablers must be improved to strengthen the most critical supply chain resilience factor; subsequently, the overall supply chain resilience ability must be improved to improve the risk resilience of enterprises.
A two-stage HoQ and MCDM-combining framework was used in this study. With this framework, manufacturers can obtain information on key sustainable supply chain risks that affect the enterprise, and which supply chain resilience solutions should be prioritised to mitigate sustainable supply chain risks. In addition, the most important big data analysis enablers are identified, which enables enterprises to focus on their resources to strengthen supply chain resilience. In the following sections, we discuss the rankings of the results of the two HoQs, and the management recommendations arising from the correlation among these three variables.

4.3.1. Sustainable Supply Chain Risks and Supply Chain Resilience in the First HoQ

The evaluation value E of ‘IT infrastructure risks’, calculated by the fuzzy comprehensive evaluation method, was 4.833 (ranked first). Tied for the second place (all with an E of 4.333) were the ‘risk of interruptions in the customer supply’, ‘transportation interruption risks’, ‘natural disaster risks’, and ‘risk of government instability’. The evaluation value E of the other 14 risks was below 4. The priority was to mitigate these five key risks, and avoid harming the sustainability characteristics of the supply chain.
Risks regarding the IT infrastructure are common in manufacturing. The IT infrastructure represents the ability to combine internal and external electronic communication through hardware and software. IT involves different communication technologies, computers, databases, and technology platforms. The IT infrastructure comprises all IT resources that are crucial for the implementation of business applications and organisational communication. Therefore, it directly affects the competitiveness of an organisation [121]. Moreover, IT infrastructures are of vital national interest. Some researchers have stated that IT infrastructure and its security are essential components of smart government systems, regardless of the national strength of a country. Owing to the rapid development of information technology, information security risk has become a concern worldwide. Information system risks can cause huge losses to users [122]. Therefore, each enterprise should attach great importance to the security of its information system, and increase respective investments to ensure that information security risks are as low as possible.
Risk regarding customer supply disruptions is one type of the more severe risks. Disruptions can cause actual economic losses to customers, and, thereby, affect the reputation of the enterprise. In October 2015, many subsidiaries of an electronics manufacturer in Shenzhen, China, went bankrupt after its employees went on a strike and the company was unable to deliver products to its customers. In September 2021, owing to the COVID-19 pandemic, more than 50 cargo ships did not leave the Port of Los Angeles for more than eight days, which led to interruptions in many supply chains. There are many reasons for possible customer supply interruptions. Some researchers have pointed out that suppliers can prevent supply interruptions by influencing the reliability of the supply process [123].
Transportation interruptions have frequently occurred in recent years. There are many reasons why transportation interruptions have a profound impact on supply chains. When a cargo ship ran aground in March 2021, the Suez Canal was closed for just a few days; nevertheless, the electronics sector in many countries was affected by the shortage of mobile phones, computers, and batteries. Pellegrino et al. pointed out that the shortage of transport capacity can rapidly cause the entire supply chain to cripple [124]. Pan stated that transport quality must be ensured, and transport supervision must be strengthened to prevent disruptions. Moreover, economic and social conditions should be considered to choose appropriate measures for different types of interruption events [125].
Natural disasters are dangerous events for businesses because the loss cannot be compensated. In July, 2011, floods hit southern Thailand, thereby forcing the closure of more than 200 processing plants, and causing 1% direct economic loss of the annual GDP. In 2018, the Hokkaido earthquake affected many Silicon fabrication plants in Japan; production had to be suspended, which severely impacted the global semiconductor market. Permani1 and Xu believe that natural disasters will destroy the trade supply chains of different countries in the future [126]. Owing to the increasing frequency and severity of natural disasters, they constitute a great threat to human life and property [127].
Regarding government instability, in the economic development of each country, the relationship between the government and market has always been an unavoidable key issue. In June 2019, riots broke out in Hong Kong. Owing to political instability, many factories experienced large-scale strikes, and society has been brought to a standstill; in addition, the electronics industry was affected by the riots. Some researchers have pointed out that long-term instable political situations will undoubtedly cause great obstacles to the recovery and development of the manufacturing industry. Moreover, instability in the policy environment can cause developmental problems or even survival struggles in enterprises. According to Ilyas et al., government support can significantly strengthen the relationship between enterprise senior management and supply chain management; a healthy relationship can help to achieve sustainable development [128].
To help case enterprises reduce these five key sustainable supply chain risks, we also identified five resilience indices that can improve enterprise resilience. The closeness degree, Ti, of ‘financial ability’, calculated by the entropy weight method, was 0.1193 (ranked first). The Ti values of ‘flexibility’, ‘corporate culture’, ‘information sharing’, and ‘robustness’ were 0.1925, 0.2381, 0.2498, and 0.4302, respectively (ranked second to fifth in that order). The sorting results of the first HoQ have thus been highlighted. The bottom five resilience indices will not be discussed in this study.
Financial capability is a prominent index of resilience, and one of the most important indexes of an enterprise. There are many factors that influence financial capability, such as the environment, society, and policies [129]. To improve the resilience in terms of financial capability, enterprises must consider many aspects. South Korea’s Samsung Electronics published its first operating profit loss in 2019 after sales fell sharply short of market expectations. Nevertheless, owing to its financial strength, Samsung Electronics still spent the highest amount on R&D worldwide at that time. This investment doubled Samsung’s assets by 2020. This demonstrates the importance of the financial capability of enterprises. Improving financial capability has always been the most important research aspect in financial management for enterprises [130].
Many researchers consider flexibility an important intrinsic feature of systems. In many manufacturing industries, increasing flexibility across the board can significantly increase the sustainability of an enterprise, in particular, in industries with high customisation requirements. For example, Sophia, which is a well-known Chinese clothing brand, has a flexible production capacity of 28,000 pieces per day, which can be filled with about 700 sets of wardrobes. Sophia’s flexible production line has formed a strong production support system in China, which leads the national industry. In addition, Fastems (a century-old enterprise from Finland) is currently the world’s largest supplier of flexible production line solutions. The enterprise helped MTU, which is Germany’s largest engine producer, to achieve flexible production. This reduced the production time, and significantly increased production flexibility. Therefore, some researchers have pointed out that ensuring comprehensive and accurate implementation standards for flexibility and improving all factors of flexibility is crucial [131].
Regarding corporate culture, if the culture within a company is not consistent with the brand’s vision, the produced products will be different from the advertised products; consequently, its reputation will suffer. Therefore, corporate culture is essential. For example, IBM is considered one of the world’s top ten companies with the best corporate culture. For more than a century, IBM has unswervingly adhered to the three principles: ‘respect for employees, respect for customers, and excellence in performance’. Owing to IBM’s unique corporate culture, it was selected as the second-best employer in the world by Forbes 2021 in October 2021. Haier Group, which is also the flagship enterprise of Chinese Electric Appliances has always placed much importance on its corporate culture. Almost every cultural aspect of the enterprise has its own slogan. Today, Haier Group is a world-famous brand. Hence, corporate culture has a crucial role on employees and productivity [132].
Information sharing can solve many current manufacturing problems, e.g., improve the allocation of resources and supply capacity. In 1984, General Motors was hit by the oil crisis. Subsequently, it formed an information sharing partnership with Toyota, and received first-hand information about Toyota’s production and efficient management modes; this helped General Motors to overcome the crisis. Qualcomm and Nuvia cannot share information, owing to their different design architectures and competitive relationship. However, in January 2021, Qualcomm acquired Nuvia. This allowed Qualcomm to develop more core designs and use Nuvia’s architecture, which greatly improved the competitiveness of the enterprise. Many researchers have shown that information sharing can reduce supply chain costs, improve supply–demand matching, and reduce the bullwhip effect [133].
Robustness refers to the ability of a supply chain to maintain benefits and continuous operation functions under the uncertain interference of internal operations and external emergencies. Owing to the more global economy, supply chains have become increasingly complex. Every link bears potential risks. In addition, because any problem in any link can severely impact the entire supply chain, the supply chain must be resistant. For example, the global manufacturing sector was severely impacted by the COVID-19 pandemic in 2020; Toyota’s annual sales fell to their lowest level after approximately nine years. Nevertheless, Toyota still achieved profits, which demonstrate the robustness of Toyota. Owing to China’s epidemic prevention measures, production could be resumed smoothly. Global customers have recognised the robustness of China’s supply chains, and global orders have been transferred to China. A robust supply chain does not suffer significant performance degradation in response to disruptions [134].

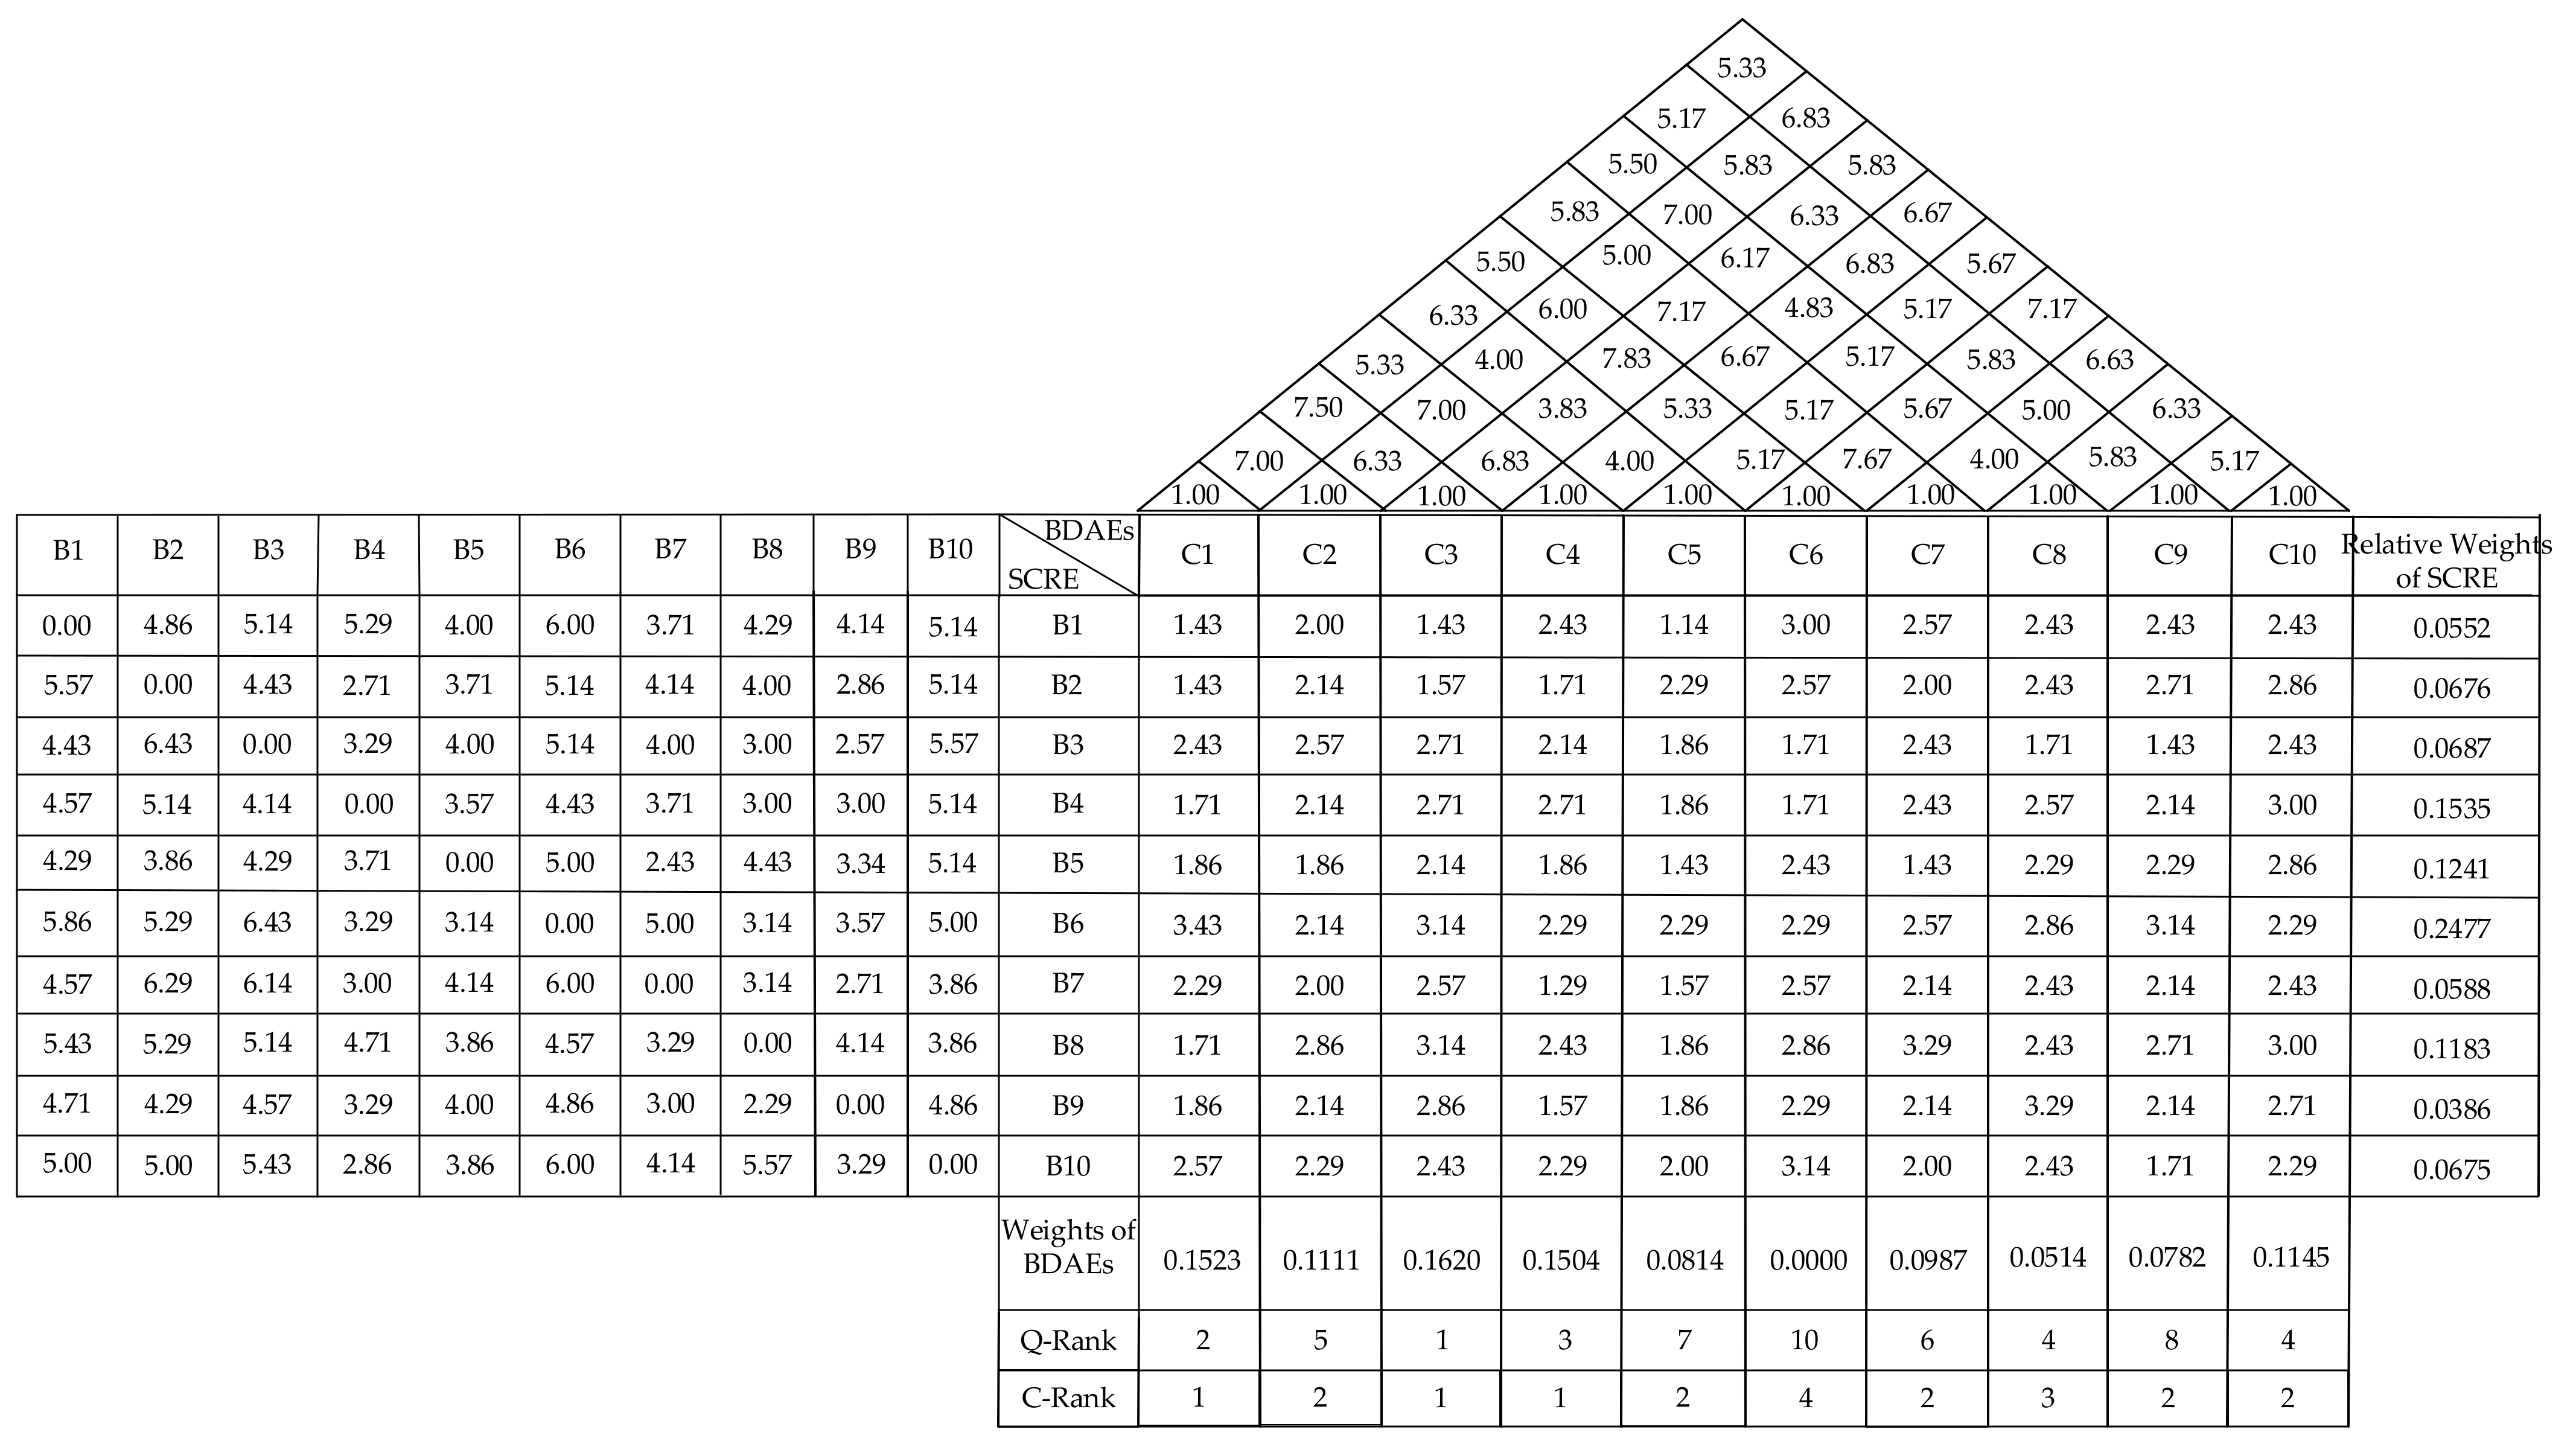
4.3.2. Supply Chain Resilience and Big Data Analysis Enablers in Second HoQ

The weight of each big data analysis enabler was calculated by the VIKOR method. Among the enablers, ‘the combination of big data infrastructure to support platforms and systems’ was ranked first, with a weight value of 0.1620. The second was ‘capital investment’, with a weight of 0.1523. The third was ‘big data sharing and visualisation’, weighing 0.1504. Compared with the former, the weight values of the latter seven enablers showed a large gap, which will not be discussed in this study. From the compromise ranking results of the second HoQ, it can be seen that these three enablers are listed as the first key enablers of big data analysis. Therefore, it would be insufficient if the case enterprises improve only one enabler; enterprise managers should consider, at least, the above three enablers to improve supply chain resilience. In addition, there can also be some interaction between the three kinds of enablers: enterprise capital investment can not only help companies build large, effective data centres, and support data sharing mechanisms, but also support enterprises in building big data technology support platforms and systems, which will help firms improve their quality of big data, and enhance their competitive position.
Capital investment is the most direct and effective way to improve the financial capability and, thereby, the supply chain resilience of an enterprise. The case enterprise is one of the top 100 electronic manufacturing enterprises in China; hence, capital investment is an essential aspect. The innovation and upgrade of products and the manufacture of electronic components require huge investments. For example, TSMC is the world leader in chip manufacturing. The company expects to invest $100 billion in chip manufacturing from 2021 to 2023. Furthermore, capital investment is crucial for competitiveness in the manufacturing industry. Sena pointed out that, over time, the more capital is invested in enterprises with BDA capabilities, the faster the frontier transfer (i.e., technological progress) of enterprises is [135]. Increasing the investment can improve the reputation of enterprises, and attract more investors [136].
Regarding big data sharing and visualisation, for manufacturing companies, collation and analysis of data is a way to connect with consumers. Big data infrastructure and visualisation are crucial for this approach. Some researchers have pointed out that data visualisation makes data more convincing, reveals more in-depth information, and improves coherence in information transmission [137]. Today, big data applications are moving to digital platforms, e.g., the real estate analysis platforms, college student teaching service platforms, audit analysis platforms, and airline Nebula platform. Hence, invisible data become visible. Finally, data visualisation enables us to communicate better with the world [138].
Regarding the combination of big data infrastructures to support platforms and systems, as the number of internet users worldwide is increasing, data has become an increasingly valuable asset in modern society; the huge data amounts will generate inestimable value in the future. For example, there are reportedly at least a few hundred thousand devices that use Google’s services. Even with such a vast big data infrastructure, Google is still building its own data centres worldwide. Alibaba founder Jack Ma said that ‘Alibaba Group is essentially a company that expands the value of data.’ Alibaba can be considered at the forefront regarding the construction of big data infrastructure. In 2017, Alibaba set up a separate data centre: ‘Ali Data’. Infrastructure is the cornerstone of internet development. Every upgrade of a key technology is accompanied by an upgrade of its infrastructure, and BDA infrastructure is crucial for enhancing enterprise resilience [139]. Hence, BDA is closely related to infrastructure capacity, and can promote SCRE [139].
The second-ranked enablers are the ‘establishment of big data centres’, ‘guiding role of government departments’, ‘improving the efficiency of big data analysis and processing’, ‘strengthening database and information security protection’, and ‘improving information technology and information management systems’. The third enabler is ‘storage and maintenance of big data’.
Although these big data analysis enablers are also important, owing to the limited resources of enterprises, they should apply the Pareto principle to the analysis results, i.e., a small number of important causes can have a large impact. The electronics industry can first focus on enhancing the most important big data analysis enablers to strengthen the most critical supply chain resilience factors, thereby reducing or mitigating the most critical sustainable supply chain risks. In addition, once the first three big data analysis enablers have been improved, the other big data analysis enablers can be improved, thereby strengthening other supply chain resilience factors and mitigating other sustainable supply chain risks. Finally, when all sustainable supply chain risks have been mitigated, the risk resilience of the entire electronic manufacturing supply chain can be greatly improved; the results will improve the competitiveness of enterprises in the global market.

5. Conclusions

In the global market where sustainable supply chain risks are becoming increasingly realistic threats, manufacturers have recognised the need to create resilient supply chains. This study broadens the perspective of risk resilience management in sustainable supply chains of electronic manufacturing enterprises by considering the major sustainable supply chain risks, supply chain resilience, and big data analysis enablers from a supply chain perspective. According to the empirical investigation of the largest relay manufacturer in China, the main findings are as follows:
  • The key sustainable supply chain risks to be mitigated are risks regarding the IT infrastructure, information systems and communications efficiency, customer supply disruptions, transport disruptions, natural disasters, and government instability.
  • Supply chain resilience must be strengthened in terms of financial capability, flexibility, corporate culture, information sharing, and robustness.
  • The key big data analysis enablers to be improved are ‘capital investment’, ‘building big data sharing mechanisms and visualisation’, and ‘consolidating big data infrastructures to support platforms and systems’.
The decision-making framework proposed in this paper is based on a circular approach to increase risk resilience based on big data analysis. Regarding the enterprise strategy, the role of the HoQ is to unfold supply chain resilience based on the risk after establishing sustainable supply chain risk; subsequently, supply chain resilience is expanded to determine the big data analysis enablers. Regarding enterprise technology, the role of the HoQ is to strengthen supply chain resilience with big data analysis enablers, and to resist sustainable supply chain risks with the help of supply chain resilience. Thus, these aspects are closely linked.
The main contributions of this study are as follows:
First, this study first proposed an integrated KJ-FCE-FDM-EWM-VIKOR method based on the QFD framework for supply chain risk research. This method can support decision-making to improve enterprise resilience. Using this method can not only reduce the subjectivity brought by the questionnaire, but also bring more scientific and accurate research results.
Second, this study integrates sustainable supply chain risk, supply chain resilience, and big data analysis contributing factors into the above methodological framework for the first time, and explores the interrelationship between these three variables to construct feasible resilience solutions for enterprises to mitigate sustainable supply chain risk.
Finally, through the results of data analysis, enterprise managers can effectively adjust the strategy, operation, and management of the company’s manufacturing system under the condition of limited resources, and clearly understand where to improve big data enablers to strengthen the resilience of the supply chain to deal with sustainable supply chain risks.
We present two future research directions. First, supply chain systems in different industries can use the framework to design risk resilience solutions. However, the different characteristics of different industries must be considered to identify their unique risk factors, which can be integrated in the proposed framework. Second, a practical decision system for this framework can be developed to enable manufacturers and manufacturing systems to identify risks effectively, and make decisions autonomously to improve supply chain resilience.
The reasons for using this combined method are as follows. 1. The data in this study are entirely from questionnaires, and the Fuzzy Delphi method is one of the mainstream methods for analysing questionnaire data at present. 2. Considering the unique subjectivity of the questionnaire, this paper hopes to use a more objective evaluation method to offset the subjective influence brought by the data. Therefore, this study uses the fuzzy comprehensive evaluation method and entropy weight method to calculate the weight. Not only does this improve the objectivity of the data, but the results produced by the former method can be used directly by the latter. The data are not over-processed, which also ensures data consistency. 3. The most innovative research method in this study is the use of the VIKOR method. This method is relatively novel and rarely cited by scholars. In addition, some scholars have proven that this method is a better calculation method.

Author Contributions

Conceptualization, C.-H.H. and M.-G.L.; methodology, C.-H.H. and A.-Y.C.; software, M.-G.L. and T.-Y.Z.; validation, C.-H.H., M.-G.L. and A.-Y.C.; formal analysis, C.-H.H. and S.-Z.S.; investigation, M.-G.L. and S.-Z.S.; resources, C.-H.H. and A.-Y.C.; data curation, M.-G.L. and T.-Y.Z.; writing—original draft preparation, M.-G.L. and S.-Z.S.; writing—review and editing, C.-H.H. and M.-G.L.; visualization, C.-H.H. and W.-L.L.; supervision, C.-H.H. and A.-Y.C.; project administration, C.-H.H. and A.-Y.C.; funding acquisition, C.-H.H. All authors have read and agreed to the published version of the manuscript.

Funding

This paper was supported by Natural Science Foundation of Fujian Province of China, (Grant No. 2019J01790) and the Education and Scientific Research Foundation of Fujian Province, Finance Department of China (Grant No. GY-Z21001).

Institutional Review Board Statement

Not applicable.

Informed Consent Statement

Not applicable.

Data Availability Statement

Not applicable.

Acknowledgments

The authors are very much indebted to the Editor-in-Chief and anonymous referees who greatly helped to improve this paper with their valuable comments and suggestions.

Conflicts of Interest

The authors declare no conflict of interest.

Abbreviations

SCSupply chain
SSCSustainable supply chain
SCMSupply chain management
SSCMSustainable supply chain management
BDAEsBig data analysis enablers
SCRsSupply chain risks
SSCRsSustainable supply chain risks
SCRESupply chain resilience
BDABig data analysis
QFDQuality function deployment
HoQHouse of Quality
MCDMMulticriteria decision-making

References

  1. Khan, S.A.R.; Zhang, Y.; Kumar, A.; Zavadskas, E.; Streimikiene, D. Measuring the impact of renewable energy, public health expenditure, logistics, and environmental performance on sustainable economic growth. Sustain. Dev. 2020, 28, 833–843. [Google Scholar] [CrossRef]
  2. Liu, H.C.; Quan, M.Y.; Li, Z.W.; Wang, Z.L. A new integrated MCDM model for sustainable supplier selection under interval-valued intuitionistic uncertain linguistic environment. Inf. Sci. 2019, 486, 254–270. [Google Scholar] [CrossRef]
  3. Nautiyal, H.; Goel, V. Sustainability assessment of hydropower projects. J. Clean. Prod. 2020, 265, 121661. [Google Scholar] [CrossRef]
  4. Barbosa-Póvoa, A.P.; da Silva, C.; Carvalho, A. Opportunities and challenges in sustainable supply chain: An operations research perspective. Eur. J. Oper. Res. 2018, 268, 399–431. [Google Scholar] [CrossRef]
  5. Simchi-Levi, D.; Kaminsky, P.; Simchi-Levi, E. Designing and Managing the Supply Chain: Concepts, Strategies and Case Studies, 3rd ed.; McGraw Hill: New York, NY, USA, 2007. [Google Scholar]
  6. Rajesh, R.; Ravi, V. Modeling enablers of supply chain risk mitigation in electronic supply chains: A Grey–DEMATEL approach. Comput. Ind. Eng. 2015, 87, 126–139. [Google Scholar] [CrossRef]
  7. da Silva, C.; Barbosa-Póvoa, A.P.; Carvalho, A. Environmental monetization and risk assessment in supply chain design and planning. J. Clean. Prod. 2020, 270, 121552. [Google Scholar] [CrossRef]
  8. Doan, T. Supply chain management drivers and competitive advantage in manufacturing industry. Uncertain Supply Chain. Manag. 2020, 8, 473–480. [Google Scholar] [CrossRef]
  9. Elmsalmi, M.; Hachicha, W.; Aljuaid, A.M. Prioritization of the Best Sustainable Supply Chain Risk Management Practices Using a Structural Analysis Based-Approach. Sustainability 2021, 13, 4608. [Google Scholar] [CrossRef]
  10. Singh, N. Developing Business Risk Resilience through Risk Management Infrastructure: The Moderating Role of Big Data Analytics. Inf. Syst. Manag. 2020, 39, 34–52. [Google Scholar] [CrossRef]
  11. Sheffi, Y.; Vakil, B.; Griffin, T. Risk and disruptions: New software tools. 2012. Available online: http://citeseerx.ist.psu.edu/viewdoc/summary?doi=10.1.1.399.1561 (accessed on 21 February 2022).
  12. Pettit, T.J.; Croxton, K.L.; Fiksel, J. The evolution of resilience in supply chain management: A retrospective on ensuring supply chain resilience. J. Bus. Logist. 2019, 40, 56–65. [Google Scholar] [CrossRef]
  13. Tukamuhabwa, B.R.; Stevenson, M.; Busby, J.; Zorzini, M. Supply chain resilience: Definition, review and theoretical foundations for further study. Int. J. Prod. Res. 2015, 53, 5592–5623. [Google Scholar] [CrossRef]
  14. Tarigan, Z.J.H.; Siagian, H.; Jie, F. Impact of Internal Integration, Supply Chain Partnership, Supply Chain Agility, and Supply Chain Resilience on Sustainable Advantage. Sustainability 2021, 13, 5460. [Google Scholar] [CrossRef]
  15. Mari, S.I.; Lee, Y.H.; Memon, M.S. Sustainable and resilient garment supply chain network design with fuzzy multi-objectives under uncertainty. Sustainability 2016, 8, 1038. [Google Scholar] [CrossRef] [Green Version]
  16. Shah, S.; Wiese, J. Reality of big data adoption in supply chain for sustainable manufacturing SMEs. In Proceedings of the 2018 IEEE International Conference on Engineering, Technology and Innovation (ICE/ITMC), Stuttgart, Germany, 17–20 June 2018; IEEE: Piscataway, NJ, USA, 2018; pp. 1–6. [Google Scholar]
  17. Mageto, J. Big Data Analytics in Sustainable Supply Chain Management: A Focus on Manufacturing Supply Chains. Sustainability 2021, 13, 7101. [Google Scholar] [CrossRef]
  18. Mišić, V.V.; Perakis, G. Data analytics in operations management: A review. Manuf. Serv. Oper. Manag. 2020, 22, 158–169. [Google Scholar] [CrossRef] [Green Version]
  19. Zhang, X.; Yu, Y.; Zhang, N. Sustainable supply chain management under big data: A bibliometric analysis. J. Enterp. Inf. Manag. 2020, 34, 427–445. [Google Scholar] [CrossRef]
  20. Schoenherr, T.; Speier-Pero, C. Data science, predictive analytics, and big data in supply chain management: Current state and future potential. J. Bus. Logist. 2015, 36, 120–132. [Google Scholar] [CrossRef]
  21. Gunasekaran, A.; Yusuf, Y.Y.; Adeleye, E.O.; Papadopoulos, T. Agile manufacturing practices: The role of big data and business analytics with multiple case studies. Int. J. Prod. Res. 2018, 56, 385–397. [Google Scholar] [CrossRef]
  22. Zhang, X.; Zhao, J. The Impact of Big Data on Supply Chain Resilience: The Moderating Effect of Supply Chain Complexity.WHICEB 2019 Proceedings. 2019. Available online: https://aisel.aisnet.org/whiceb2019/22 (accessed on 21 February 2022).
  23. Kitchens, B.; Dobolyi, D.; Li, J.; Abbasi, A. Advanced customer analytics: Strategic value through integration of relationship-oriented Big Data. J. Manag. Inf. Syst. 2018, 35, 540–574. [Google Scholar] [CrossRef]
  24. Hauser, J.; Clausing, D. The house of quality. Harv. Bus. Rev. 1988, 66, 63–73. [Google Scholar]
  25. Lam, J.S.L.; Bai, X. A quality function deployment approach to improve maritime supply chain resilience. Transp. Res. Part. E Logist. Transp. Rev. 2016, 92, 16–27. [Google Scholar] [CrossRef]
  26. Hsu, C.H.; Chang, A.Y.; Kuo, H.M. Data mining QFD for the dynamic forecasting of life cycle under green supply chain. WSEAS Trans. Comput. 2012, 11, 1–10. [Google Scholar]
  27. He, L.; Wu, Z.; Xiang, W.; Goh, M.; Xu, Z.; Song, W.; Ming, X.; Wu, X. A novel Kano-QFD-DEMATEL approach to optimise the risk resilience solution for sustainable supply chain. Int. J. Prod. Res. 2020, 59, 1714–1735. [Google Scholar] [CrossRef]
  28. Li, M.; Jin, L.; Wang, J. A new MCDM method combining QFD with TOPSIS for knowledge management system selection from the user’s perspective in intuitionistic fuzzy environment. Appl. Soft Comput. 2014, 21, 28–37. [Google Scholar] [CrossRef]
  29. Ignatius, J.; Rahman, A.; Yazdani, M. An integrated fuzzy ANP–QFD approach for green building assessment. J. Civ. Eng. Manag. 2016, 22, 551–563. [Google Scholar] [CrossRef] [Green Version]
  30. Tian, Z.P.; Wang, J.Q.; Wang, J.; Zhang, H.Y. A multi-phase QFD-based hybrid fuzzy MCDM approach for performance evaluation: A case of smart bike-sharing programs in Changsha. J. Clean. Prod. 2018, 171, 1068–1083. [Google Scholar] [CrossRef]
  31. Wang, X.; Fang, H.; Song, W.Y. Technical attribute prioritisation in QFD based on cloud model and grey relational analysis. Int. J. Prod. Res. 2019, 58, 5751–5768. [Google Scholar] [CrossRef]
  32. Hsu, C.H.; Chang, A.Y.; Zhang, T.Y.; Lin, W.D.; Liu, W.L. Deploying Resilience Enablers to Mitigate Risks in Sustainable Fashion Supply Chains. Sustainability 2021, 13, 2943. [Google Scholar] [CrossRef]
  33. Abdel-Basset, M.; Mohamed, R. A novel plithogenic TOPSIS-CRITIC model for sustainable supply chain risk management. J. Clean. Prod. 2020, 247, 119586. [Google Scholar] [CrossRef]
  34. Boussemart, J.P.; Leleu, H.; Shen, Z.; Valdmanis, V. Performance analysis for three pillars of sustainability. J. Product. Anal. 2020, 53, 305–320. [Google Scholar] [CrossRef]
  35. Iddrisu, I.; Bhattacharyya, S.C. Sustainable Energy Development Index: A multi-dimensional indicator for measuring sustainable energy development. Renew. Sustain. Energy Rev. 2015, 50, 513–530. [Google Scholar] [CrossRef] [Green Version]
  36. Valinejad, F.; Rahmani, D. Sustainability risk management in the supply chain of telecommunication companies: A case study. J. Clean. Prod. 2018, 203, 53–67. [Google Scholar] [CrossRef]
  37. Moktadir, M.A.; Dwivedi, A.; Khan, N.S.; Paul, S.K.; Khan, S.A.; Ahmed, S.; Sultana, R. Analysis of risk factors in sustainable supply chain management in an emerging economy of leather industry. J. Clean. Prod. 2021, 283, 124641. [Google Scholar] [CrossRef]
  38. Hsu, C.H.; Yu, R.Y.; Chang, A.Y.; Chung, W.H.; Liu, W.L. Resilience-Enhancing Solution to Mitigate Risk for Sustainable Supply Chain–An Empirical Study of Elevator Manufacturing. Processes 2021, 9, 596. [Google Scholar] [CrossRef]
  39. Kot, S. Sustainable supply chain management in small and medium enterprises. Sustainability 2018, 10, 1143. [Google Scholar] [CrossRef] [Green Version]
  40. Niño-Amézquita, J.; Legotin, F.; Barbakov, O. Economic success and sustainability in pharmaceutical sector: A case of Indian SMEs. Entrep. Sustain. Issues 2017, 5, 157–168. [Google Scholar] [CrossRef] [Green Version]
  41. Abdel-Basset, M.; Gunasekaran, M.; Mohamed, M.; Chilamkurti, N. A framework for risk assessment, management and evaluation: Economic tool for quantifying risks in supply chain. Future Gener. Comput. Syst. 2019, 90, 489–502. [Google Scholar] [CrossRef] [Green Version]
  42. Alora, A.; Barua, M.K. An integrated structural modelling and MICMAC analysis for supply chain disruption risk classification and prioritisation in India. Int. J. Value Chain. Manag. 2019, 10, 1–25. [Google Scholar] [CrossRef]
  43. Wagner, S.M.; Bode, C. An empirical examination of supply chain performance along several dimensions of risk. J. Bus. Logist. 2008, 29, 307–325. [Google Scholar] [CrossRef]
  44. Giunipero, L.C.; Eltantawy, R.A. Securing the upstream supply chain: A risk management approach. Int. J. Phys. Distrib. Logist. Manag. 2004, 34, 698–713. [Google Scholar] [CrossRef] [Green Version]
  45. Klibi, W.; Martel, A. Scenario-based supply chain network risk modeling. Eur. J. Oper. Res. 2012, 223, 644–658. [Google Scholar] [CrossRef]
  46. Ritchie, B.; Brindley, C. Supply chain risk management and performance: A guiding framework for future development. Int. J. Oper. Prod. Manag. 2007, 27, 303–322. [Google Scholar] [CrossRef]
  47. Wilson, M.C. The impact of transportation disruptions on supply chain performance. Transp. Res. Part E Logist. Transp. Rev. 2007, 43, 295–320. [Google Scholar] [CrossRef]
  48. Bode, C.; Wagner, S.M.; Petersen, K.J.; Ellram, L.M. Understanding responses to supply chain disruptions: Insights from information processing and resource dependence perspectives. Acad. Manag. J. 2011, 54, 833–856. [Google Scholar] [CrossRef]
  49. Norrman, A.; Lindroth, R. Categorization of supply chain risk and risk management. Supply Chain Risk 2004, 15, 14–27. [Google Scholar]
  50. Vanany, I.; Zailani, S.; Pujawan, N. Supply chain risk management: Literature review & future research. Int. J. Inf. Syst. Supply Chain Manag. 2008, 2, 16–33. [Google Scholar]
  51. Faisal, M.N.; Banwet, D.K.; Shankar, R. Information risks management in supply chains: An assessment and mitigation framework. J. Enterp. Inf. Manag. 2007, 20, 677–699. [Google Scholar] [CrossRef]
  52. Olson, D.L.; Wu, D.D. A review of enterprise risk management in supply chain. Kybernetes 2010, 39, 694–706. [Google Scholar] [CrossRef] [Green Version]
  53. Sawik, T. Selection of supply portfolio under disruption risks. Omega 2011, 39, 194–208. [Google Scholar] [CrossRef]
  54. Diabat, A.; Govindan, K.; Panicker, V.V. Supply chain risk management and its mitigation in a food industry. Int. J. Prod. Res. 2012, 50, 3039–3050. [Google Scholar] [CrossRef] [Green Version]
  55. Cagliano, A.C.; De Marco, A.; Grimaldi, S.; Rafele, C. An integrated approach to supply chain risk analysis. J. Risk Res. 2012, 15, 817–840. [Google Scholar] [CrossRef] [Green Version]
  56. Samvedi, A.; Jain, V.; Chan, F.T.S. Quantifying risks in a supply chain through integration of fuzzy AHP and fuzzy TOPSIS. Int. J. Prod. Res. 2013, 51, 2433–2442. [Google Scholar] [CrossRef]
  57. Lavastre, O.; Gunasekaran, A.; Spalanzani, A. Effect of firm characteristics, supplier relationships and techniques used on supply chain risk management (SCRM): An empirical investigation on French industrial firms. Int. J. Prod. Res. 2014, 52, 3381–3403. [Google Scholar] [CrossRef]
  58. Venkatesh, V.G.; Rathi, S.; Patwa, S. Analysis on supply chain risks in Indian apparel retail chains and proposal of risk prioritization model using Interpretive structural modeling. J. Retail. Consum. Serv. 2015, 26, 153–167. [Google Scholar] [CrossRef]
  59. Rogers, H.; Srivastava, M.; Pawar, K.S.; Shah, J. Supply chain risk management in India–Practical insights. Int. J. Logist. Res. Appl. 2016, 19, 278–299. [Google Scholar] [CrossRef]
  60. Kilubi, I.; Haasis, H.D. Supply chain risk management research: Avenues for further studies. Int. J. Supply Chain Oper. Resil. 2016, 2, 51–71. [Google Scholar] [CrossRef] [Green Version]
  61. Song, W.; Ming, X.; Liu, H.C. Identifying critical risk factors of sustainable supply chain management: A rough strength-relation analysis method. J. Clean. Prod. 2017, 143, 100–115. [Google Scholar] [CrossRef]
  62. Jiang, B.; Li, J.; Shen, S. Supply chain risk assessment and control of port enterprises: Qingdao port as case study. Asian J. Shipp. Logist. 2018, 34, 198–208. [Google Scholar] [CrossRef]
  63. Prakash, A.; Agarwal, A.; Kumar, A. Risk assessment in automobile supply chain. Mater. Today Proc. 2018, 5, 3571–3580. [Google Scholar] [CrossRef]
  64. Xu, Z.; Chen, X.; Wu, S.R.; Gong, M.; Du, Y.; Wang, J.; Li, Y.K.; Liu, J. Spatial-temporal assessment of water footprint, water scarcity and crop water productivity in a major crop production region. J. Clean. Prod. 2019, 224, 375–383. [Google Scholar] [CrossRef]
  65. Brzęczek, T. Optimisation of product portfolio sales and their risk subject to product width and diversity. Rev. Manag. Sci. 2020, 14, 1009–1027. [Google Scholar] [CrossRef] [Green Version]
  66. Saltykov, M.A.; Obraztsova, E.Y.; Bubnovskaya, T.V. Risks Associated with the Implementation of Fishery Development Program in the Far Eastern Federal District. In IOP Conference Series: Earth and Environmental Science; IOP Publishing: Bristol, UK, 2022; Volume 988, p. 032074. [Google Scholar]
  67. Woods, D. Resilience Engineering: Concepts and Precepts; Ashgate Publishing, Ltd.: Farnham, UK, 2006. [Google Scholar]
  68. Rice, J.B.; Caniato, F. Building a secure and resilience supply chain. Pdf. Supply Chain Manag. Rev. 2003, 5, 22–30. [Google Scholar]
  69. Belhadi, A.; Kamble, S.; Jabbour, C.J.C.; Gunasekaran, A.; Ndubisi, N.O.; Venkatesh, M. Manufacturing and service supply chain resilience to the COVID-19 outbreak: Lessons learned from the automobile and airline industries. Technol. Forecast. Soc. Change 2021, 163, 120447. [Google Scholar] [CrossRef] [PubMed]
  70. Centobelli, P.; Cerchione, R.; Ertz, M. Managing supply chain resilience to pursue business and environmental strategies. Bus. Strategy Environ. 2020, 29, 1215–1246. [Google Scholar]
  71. Davis, K.F.; Downs, S.; Gephart, J.A. Towards food supply chain resilience to environmental shocks. Nat. Food 2021, 2, 54–65. [Google Scholar] [CrossRef]
  72. Bevilacqua, M.; Ciarapica, F.E.; Marcucci, G.; Mazzuto, G. Fuzzy cognitive maps approach for analysing the domino effect of factors affecting supply chain resilience: A fashion industry case study. Int. J. Prod. Res. 2020, 58, 6370–6398. [Google Scholar] [CrossRef]
  73. Piprani, A.Z.; Mohezar, S.; Jaafar, N.I. Supply chain integration and supply chain performance: The mediating role of supply chain resilience. Int. J. Supply Chain Manag. 2020, 9, 58–73. [Google Scholar]
  74. Hosseini, S.; Ivanov, D.; Dolgui, A. Review of quantitative methods for supply chain resilience analysis. Transp. Res. Part E: Logist. Transp. Rev. 2019, 125, 285–307. [Google Scholar] [CrossRef]
  75. Ivanov, D.; Dolgui, A. OR-methods for coping with the ripple effect in supply chains during COVID-19 pandemic: Managerial insights and research implications. Int. J. Prod. Econ. 2021, 232, 107921. [Google Scholar] [CrossRef]
  76. Gružauskas, V.; Vilkas, M. Managing Capabilities for Supply Chain Resilience through it Integration. Econ. Bus. 2017, 31, 30–43. [Google Scholar] [CrossRef] [Green Version]
  77. Liu, C.-L.; Lee, M.-Y. Integration, supply chain resilience, and service performance in third-party logistics providers. Int. J. Logist. Manag. 2018, 29, 5–21. [Google Scholar] [CrossRef]
  78. Um, J.; Han, N. Understanding the relationships between global supply chain risk and supply chain resilience: The role of mitigating strategies. Supply Chain. Manag. Int. J. 2020, 26, 240–255. [Google Scholar] [CrossRef]
  79. Sheffi, Y.; Rice, J.B., Jr. A supply chain view of the resilient enterprise. MIT Sloan Manag. Rev. 2005, 47, 41. [Google Scholar]
  80. Pereira, J.V. The new supply chain’s frontier: Information management. Int. J. Inf. Manag. 2009, 29, 372–379. [Google Scholar] [CrossRef]
  81. Pettit, T.J.; Fiksel, J.; Croxton, K.L. Ensuring supply chain resilience: Development of a conceptual framework. J. Bus. Logist. 2010, 31, 1–21. [Google Scholar] [CrossRef]
  82. Ponis, S.T.; Koronis, E. Supply chain resilience: Defifinition of concept and its formative elements. J. Appl. Bus. Res. 2012, 28, 921–929. [Google Scholar] [CrossRef]
  83. Soni, U.; Jain, V.; Kumar, S. Measuring supply chain resilience using a deterministic modeling approach. Comput. Ind. Eng. 2014, 74, 11–25. [Google Scholar] [CrossRef]
  84. Inman, R.R.; Blumenfeld, D.E. Product complexity and supply chain design. Int. J. Prod. Res. 2014, 52, 1956–1969. [Google Scholar] [CrossRef]
  85. Mari, S.I.; Lee, Y.H.; Memon, M.S. Complex network theory-based approach for designing resilient supply chain networks. Int. J. Logist. Syst. Manag. 2015, 21, 365–384. [Google Scholar] [CrossRef]
  86. Kamalahmadi, M.; Parast, M.M. A review of the literature on the principles of enterprise and supply chain resilience: Major findings and directions for future research. Int. J. Prod. Econ. 2016, 171, 116–133. [Google Scholar] [CrossRef]
  87. Jain, V.; Kumar, S.; Soni, U.; Chandra, C. Supply chain resilience: Model development and empirical analysis. Int. J. Prod. Res. 2017, 55, 6779–6800. [Google Scholar] [CrossRef]
  88. Sáenz, M.J.; Revilla, E.; Acero, B. Aligning supply chain design for boosting resilience. Bus. Horiz. 2018, 61, 443–452. [Google Scholar] [CrossRef]
  89. Singh, C.S.; Soni, G.; Badhotiya, G.K. Performance indicators for supply chain resilience: Review and conceptual framework. J. Ind. Eng. Int. 2019, 15, 105–117. [Google Scholar] [CrossRef] [Green Version]
  90. Konstantinou, C.; Chatzoudes, D.; Chatzoglou, P. Supply Chain Resilience during the COVID-19 pandemic. In Proceedings of the 2021 IEEE International Conference on Technology and Entrepreneurship (ICTE), Kaunas, Lithuania, 24–27 August 2021; IEEE: Piscataway, NJ, USA, 2021; pp. 1–6. [Google Scholar]
  91. Babiceanu, R.F.; Seker, R. Big Data and virtualization for manufacturing cyber-physical systems: A survey of the current status and future outlook. Comput. Ind. 2016, 81, 128–137. [Google Scholar] [CrossRef]
  92. Moktadir, M.A.; Ali, S.M.; Paul, S.K.; Shukla, N. Barriers to big data analytics in manufacturing supply chains: A case study from Bangladesh. Comput. Ind. Eng. 2019, 128, 1063–1075. [Google Scholar] [CrossRef]
  93. Babu, M.M.; Rahman, M.; Alam, A.; Dey, B.L. Exploring big data-driven innovation in the manufacturing sector: Evidence from UK firms. Ann. Oper. Res. 2021, 1–28. [Google Scholar] [CrossRef]
  94. McAfee, A.; Brynjolfsson, E.; Davenport, T.H.; Patil, D.J.; Barton, D. Big data: The management revolution. Harv. Bus. Rev. 2012, 90, 60–68. [Google Scholar]
  95. Perrey, J.; Spillecke, D.; Umblijs, A. Smart Analytics: How Marketing Drives Short-Term and Long-Term Growth. McKinsey Quarterly: Seattle, WA, USA, 2013. [Google Scholar]
  96. Wamba, S.F.; Akter, S.; Edwards, A.; Chopin, G.; Gnanzou, D. How ‘big data’can make big impact: Findings from a systematic review and a longitudinal case study. Int. J. Prod. Econ. 2015, 165, 234–246. [Google Scholar] [CrossRef]
  97. Singh, N.P.; Singh, S. Building supply chain risk resilience: Role of big data analytics in supply chain disruption mitigation. Benchmarking Int. J. 2019, 26, 2318–2342. [Google Scholar] [CrossRef]
  98. Raut, R.D.; Mangla, S.K.; Narwane, V.S.; Dora, M.; Liu, M. Big Data Analytics as a mediator in Lean, Agile, Resilient, and Green (LARG) practices effects on sustainable supply chains. Transp. Res. Part E Logist. Transp. Rev. 2021, 145, 102170. [Google Scholar] [CrossRef]
  99. Wicher, P.; Zapletal, F.; Lenort, R.; Staš, D. Measuring the metallurgical supply chain resilience using fuzzy analytic network process. Metalurgija 2016, 55, 783–786. [Google Scholar]
  100. Chroneos-Krasavac, B.; Soldic-Aleksic, J.; Petkovic, G. The big data phenomenon: The business and public impact. Industrija 2016, 44, 117–144. [Google Scholar] [CrossRef] [Green Version]
  101. Duman, G.M. Big Data Analytics in Supply Chain Management: A Literature Review on Supply Chain Analytics. 2017. Available online: https://scholarworks.bridgeport.edu/xmlui/handle/123456789/1918 (accessed on 21 February 2022).
  102. Organizing Committee of the Madrid 2017 Critical Care Datathon; Reiz, A.N.; Sagasti, F.M.; González, M.Á.; Malpica, A.B.; Benítez, J.C.M.; Cabrera, M.N.; Del Pino Ramírez, Á.; Perdomo, J.M.G.; Alonso, J.P.; et al. Big data and machine learning in critical care: Opportunities for collaborative research. Med. Intensiva 2019, 43, 52–57. [Google Scholar]
  103. Reinmoeller, P.; Van Baardwijk, N. The link between diversity and resilience. MIT Sloan Manag. Rev. 2005, 46, 61. [Google Scholar]
  104. Lutfi, A.; Alsyouf, A.; Almaiah, M.A.; Alrawad, M.; Abdo, A.A.K.; Al-Khasawneh, A.L.; Ibrahim, N.; Saad, M. Factors Influencing the Adoption of Big Data Analytics in the Digital Transformation Era: Case Study of Jordanian SMEs. Sustainability 2022, 14, 1802. [Google Scholar] [CrossRef]
  105. Ponomarov, S.Y.; Holcomb, M.C. Understanding the concept of supply chain resilience. Int. J. Logist. Manag. 2009, 20, 124–143. [Google Scholar] [CrossRef]
  106. Jüttner, U.; Maklan, S. Supply chain resilience in the global financial crisis: An empirical study. Supply Chain Manag. Int. J. 2011, 16, 246–259. [Google Scholar] [CrossRef]
  107. Heckmann, I.; Comes, T.; Nickel, S. A critical review on supply chain risk–Definition, measure and modeling. Omega 2015, 52, 119–132. [Google Scholar] [CrossRef] [Green Version]
  108. Kochak, A.; Sharma, S. Demand forecasting using neural network for supply chain management. Int. J. Mech. Eng. Robot. Res. 2015, 4, 96–104. [Google Scholar]
  109. Fahimnia, B.; Jabbarzadeh, A. Marrying supply chain sustainability and resilience: A match made in heaven. Transp. Res. Part E: Logist. Transp. Rev. 2016, 91, 306–324. [Google Scholar] [CrossRef]
  110. Zahiri, B.; Zhuang, J.; Mohammadi, M. Toward an integrated sustainable-resilient supply chain: A pharmaceutical case study. Transp. Res. Part E Logist. Transp. Rev. 2017, 103, 109–142. [Google Scholar] [CrossRef]
  111. Xue, H.; Jiang, C.; Cai, B.; Yuan, Y. Research on demand forecasting of retail supply chain emergency logistics based on NRS-GA-SVM. In Proceedings of the 2018 Proceedings of the 30th Chinese Control and Decision Conference (2018 CCDC), Shenyang, China, 9–11 June 2018; IEEE: Piscataway, NJ, USA, 2018; pp. 3647–3652. [Google Scholar]
  112. Ivanov, D. Revealing interfaces of supply chain resilience and sustainability: A simulation study. Int. J. Prod. Res. 2018, 56, 3507–3523. [Google Scholar] [CrossRef] [Green Version]
  113. Zavala-Alcívar, A.; Verdecho, M.J.; Alfaro-Saíz, J.J. A conceptual framework to manage resilience and increase sustainability in the supply chain. Sustainability 2020, 12, 6300. [Google Scholar] [CrossRef]
  114. Redman, C.L. Should sustainability and resilience be combined or remain distinct pursuits? Ecol. Soc. 2014, 19, 8. [Google Scholar] [CrossRef] [Green Version]
  115. Song, M.; Zhang, J.; Wang, S. Review of the network environmental efficiencies of listed petroleum enterprises in China. Renew. Sustain. Energy Rev. 2015, 43, 65–71. [Google Scholar] [CrossRef]
  116. Dubey, R.; Gunasekaran, A.; Childe, S.J.; Fosso Wamba, S.; Roubaud, D.; Roubaud, D. Empirical investigation of data analytics capability and organizational flexibility as complements to supply chain resilience. Int. J. Prod. Res. 2021, 59, 110–128. [Google Scholar] [CrossRef]
  117. Akter, S.; Wamba, S.F.; Gunasekaran, A.; Dubey, R.; Childe, S.J. How to improve firm performance using big data analytics capability and business strategy alignment? Int. J. Prod. Econ. 2016, 182, 113–131. [Google Scholar] [CrossRef] [Green Version]
  118. Altay, N.; Gunasekaran, A.; Dubey, R.; Childe, S.J. Agility and resilience as antecedents of supply chain performance under moderating effects of organizational culture within the humanitarian setting: A dynamic capability view. Prod. Plan. Control 2018, 29, 1158–1174. [Google Scholar] [CrossRef]
  119. Opricovic, S.; Tzeng, G.H. Extended VIKOR method in comparison with outranking methods. Eur. J. Oper. Res. 2007, 178, 514–529. [Google Scholar] [CrossRef]
  120. Yu, P.L. A class of solutions for group decisio n problems. Manag. Sci. 1973, 19, 936–946. [Google Scholar] [CrossRef]
  121. Hou, C.K. The effects of IT infrastructure integration and flexibility on supply chain capabilities and organizational performance: An empirical study of the electronics industry in Taiwan. Inf. Dev. 2020, 36, 576–602. [Google Scholar] [CrossRef]
  122. Peisheng, L.; Yunping, H.; Xiaole, Z.; Shunshun, W.; Zhenglin, L. Research on information system risk Assessment Based on Improved AHP-Fuzzy theory. In Journal of Physics: Conference Series; IOP Publishing: Bristol, UK, 2020; Volume 1693, p. 012046. [Google Scholar]
  123. Che, C.; Zhang, X.; Chen, Y.; Zhao, L.; Zhao, L.; Liang, Y. Dual-Source Procurement and Supplier Pricing Decision under Supply Interruption. Discret. Dyn. Nat. Soc. 2021, 2021, 5584559. [Google Scholar] [CrossRef]
  124. Pellegrino, R.; Costantino, N.; Tauro, D. The value of flexibility in mitigating supply chain transportation risks. Int. J. Prod. Res. 2021, 59, 6252–6269. [Google Scholar] [CrossRef]
  125. Pan, S.; Yan, H.; He, J.; He, Z. Vulnerability and resilience of transportation systems: A recent literature review. Phys. A Stat. Mech. Its Appl. 2021, 581, 126235. [Google Scholar] [CrossRef]
  126. Permani, R.; Xu, X. The Nexus between Natural disasters, Supply Chains and Trade–Revisiting the Role of FTAs in Disaster Risk Reduction. 2020. Available online: https://ageconsearch.umn.edu/record/304269/files/18076.pdf (accessed on 21 February 2022).
  127. Kim, J.M.; Yum, S.G.; Park, H.; Bae, J. A Strategic Framework for Natural Disaster-Induced Cost Risk Analysis and Mitigation: A Two-Stage Approach Using Deep Learning and Cost-Benefit Analysis. Nat. Hazards Earth Syst. Sci. Discuss. 2021, 1–18. [Google Scholar] [CrossRef]
  128. Ilyas, S.; Hu, Z.; Wiwattanakornwong, K. Unleashing the role of top management and government support in green supply chain management and sustainable development goals. Environ. Sci. Pollut. Res. 2020, 27, 8210–8223. [Google Scholar] [CrossRef]
  129. Shakil, M.H. Environmental, social and governance performance and financial risk: Moderating role of ESG controversies and board gender diversity. Resour. Policy 2021, 72, 102144. [Google Scholar] [CrossRef]
  130. Zhang, H.; Khurshid, A.; Xinyu, W.; Băltăţeanu, A.M. Corporate financial risk assessment and role of big data; New perspective using fuzzy analytic hierarchy process. J. Econ. Forecast. 2021, 2, 181–199. [Google Scholar]
  131. Bazazzadeh, H.; Nadolny, A.; Mehan, A.; Safaei, S.S.H. The Importance of Flexibility in Adaptive Reuse of Industrial Heritage: Learning from Iranian Cases. Int. J. Conserv. Sci. 2021, 12, 113–128. [Google Scholar]
  132. Cherian, J.; Gaikar, V.; Paul, R.; Pech, R. Corporate Culture and Its Impact on Employees’ Attitude, Performance, Productivity, and Behavior: An Investigative Analysis from Selected Organizations of the United Arab Emirates (UAE). J. Open Innov. Technol. Mark. Complex. 2021, 7, 45. [Google Scholar] [CrossRef]
  133. Liu, M.; Dan, B.; Zhang, S.; Ma, S. Information sharing in an E-tailing supply chain for fresh produce with freshness-keeping effort and value-added service. Eur. J. Oper. Res. 2021, 290, 572–584. [Google Scholar] [CrossRef]
  134. Mackay, J.; Munoz, A.; Pepper, M. Conceptualising redundancy and flexibility towards supply chain robustness and resilience. J. Risk Res. 2020, 23, 1541–1561. [Google Scholar] [CrossRef]
  135. Sena, V.; Ozdemir, S. Spillover effects of investment in big data analytics in B2B relationships: What is the role of human capital? Ind. Mark. Manag. 2020, 86, 77–89. [Google Scholar] [CrossRef]
  136. Leonova, O. Benefits and Potential of Using Foreign Private Capital to Supply Innovation and Investment Needs in Russia. In Proceedings of the 8th International Conference on Contemporary Problems in the Development of Economic, Financial and Credit Systems (DEFCS 2020), Belgorod, Germany, 9–11 September 2020; Atlantis Press: Paris, France, 2020; pp. 235–238. [Google Scholar]
  137. Kang-le, W. Visualization of sports journalism in the era of big data: Advantages and challenges. Sports Res. Educ. 2016, 31, 13–17. [Google Scholar] [CrossRef]
  138. Wentzell, P.D.; Gonçalves, T.R.; Matsushita, M.; Valderrama, P. Combinatorial Projection Pursuit Analysis for Exploring Multivariate Chemical Data. Anal. Chim. Acta 2021, 1174, 338716. [Google Scholar] [CrossRef] [PubMed]
  139. Mandal, S. Exploring the significance of big data infrastructure in dynamic capability development: A supply chain resilience perspective. Int. J. Work Organ. Emot. 2020, 11, 247–264. [Google Scholar] [CrossRef]
Figure 1. Two-stage HoQs. (a) The first HoQ; (b) The second HoQ.
Mathematics 10 01233 g001
Figure 2. Research flow chart.
Mathematics 10 01233 g002
Figure 3. The first stage of HoQ.
Mathematics 10 01233 g003
Figure 4. The second stage of HoQ.
Mathematics 10 01233 g004
Table 1. Sustainable supply chain risk summary form.
ReferenceResearch Emphasis or SignificanceResearch
Methodologies
Research Results
Olson and Wu (2010)Review supply chain risk management methods, including identification and classification of risk types, cases, and models.Literature analysisA general framework of supply chain risk is proposed.
Sawik (2011)Find the optimal choice of supply mix in an environment with supply chain disruption risk.Mixed integer programsIt is verified that the probability of supply interruption is the key determinant of demand allocation among suppliers.
Govindan et al. (2012)Create models and discuss risk mitigation strategies.ISMRisks in the food supply chain of the companies studied are identified, and strategies to mitigate them are proposed.
Samvedi et al. (2013)Quantify the risks in the supply chain, and then integrate their values into a comprehensive risk index.AHP and TOPSISA general risk index is proposed and calculated.
Lavastre et al. (2014)A framework of supply chain risk management is proposed.Literature analysisSome influencing factors that can reduce supply chain risk are identified.
Venkatesh et al. (2015)A new risk priority series (RPN) calculation model is proposed.ISM and fuzzy MICMAC methodsThe feasibility of the model is verified.
Kilubi and Haasis(2016)The topic of supply chain risk management (SCRM) is analysed and recognised in depth.Literature analysisIt is proved that SCRM and enterprise performance are not necessarily related.
Song (2017)A rough weighting decision is proposed.DEMATELFailure to choose the right supplier is the most prominent risk factor in an SSCM.
Jiang et al.(2018)Identify port enterprise supply chain risk, and strengthen supply chain risk control.Improved AHPMeasures to strengthen supply chain risk management of port enterprises are put forward.
Xu et al. (2019)Identify and assess supply chain sustainability risks.Literature analysisA framework was established to assess supply chain sustainability risks.
Brzęczek (2020)Develop a set of decision models to predict sales risks.Literature analysisProduct expansion generally leads to an increase in expected sales and nominal risk, but also to a lower relative risk.
Xu et al. (2021)Try to find measures to improve supply chain resilience and reduce risk.Multicriteria decision makingConcrete measures are proposed to enhance the resilience of the supply chain.
Saltykov et al. (2022)Assessing reasonable risks and obstacles to the implementation of strategic actions.Expert risk assessment methodsIdentify the key risks in fisheries development projects.
Table 2. Supply chain resilience summary table.
ReferenceResearch Emphasis or SignificanceResearch MethodologiesResearch Results
Sheffi and Rice (2005)The performance of the supply chain at different stages is analysed, and the decision is made.Decision theory
and theory building
By building redundancy and flexibility into their supply chains, organisations can improve their ability to recover quickly from disruptions.
Pereira (2009)Analyse the key issues facing the supply chain, and develop a new strategy to improve resilience.SDDESIT should be implemented into the supply chain to improve robustness and resilience.
Pettit et al. (2010)Creates a conceptual framework for assessing and improving supply chain resilience.Hypothesis testingIt provides managers with several theoretical solutions to improve resilience.
Ponis and Koronis (2012)Identify which supply chain capabilities can support the containment of disruptions, and how they affect resilience.Literature analysisSupply chains that can adapt to disruptions gain an edge over the competition.
Soni et al. (2014)A model to improve supply chain resilience is proposed.Graph theory methodThis model can be used to quantify resilience by a single numerical index.
Mari et al. (2015)The applicability of various complex network models in the design of resilient supply chain networks is discussed.Complex network theoryThe design index of the resilient supply chain network is put forward.
Kamalahmadi and Parast (2016)Discuss the future direction of supply chain resilience research.Literature analysisA framework of supply chain resilience principles is developed.
Jain et al. (2017)Build a supply chain resilience model.Hypothesis testThe model identifies 13 contributors to resilience, and describes their relationships.
Sáenz et al. (2018)Methods to improve resilience were discussed.Online survey method and case study methodA framework for deploying supply chain resilience dynamics is proposed.
Singh et al. (2019)Develop a supply chain resilience framework.Literature analysisSeventeen resilience indicators were identified to establish a resilience framework.
Xu et al. (2021)Explore solutions to improve supply chain resilience.Multicriteria decision-makingIt provides an effective method to improve the resilience of the supply chain.
Dilek Ozdemir et al. (2022)Explore the impact of supply chain resilience on business performance.Hypothesis testA conceptual framework is proposed to improve supply chain resilience.
Table 3. Summary table of big data supply chain research.
ReferenceResearch Emphasis or SignificanceResearch
Methodologies
Research Results
Biljana et al. (2016)A comprehensive overview of the concept of ‘big data’ development characteristics and their application possibilities.Literature analysisThe use of big data technology can effectively improve supply chain sales and trade.
Duman and Murat(2017)A comparative study on the role of big data in fields related to the literature gaps.Literature analysisBig data-driven supply chain management is expected to be more efficient in terms of operational performance, supply chain risk management, and supply chain collaboration.
Reiz et al. (2019)Big data research and machine learning.Case analysisCreates the possibility for ICUs to store many of machines.
Raut et al. (2021)Provide a framework that can assist the regulatory body in developing effective policies for BDA in manufacturing companies.SEMThe applicability of the framework is verified.
Lutfi et al. (2022)Identify the drivers of big data analytics in the context of Jordan’s developing economy.PLS-SEMSolve the problem of BD driving factors in small- and medium-sized enterprises.
Table 5. Evaluation of risk factors.
The Factor of RisksE Value
Equipment failure risks3.834
The risk of interruptions in the customer supply4.333
Transport interruptions risks4.333
Technical risks3.996
Inventory risks3.834
The risk of lack of quality staff3.332
Outsourcing risks2.999
IT infrastructure risks4.833
Information asymmetry risks3.833
The risk of defective product3.333
Risks caused by suppliers (e.g., unqualified supply)4.167
Natural disaster risks4.333
Single supplier risks3
The risk of defective product2.833
The risk of loss of cargo2.333
Accident risks3.001
The risk of cognitive error3.499
The risk of government instability4.333
Demand risks3.333
Table 6. The initial matrix.
A1A2A3A4A5A6A7A8A9A10
B12.1673.5002.6672.8332.1672.1671.5002.8333.3333.667
B22.5003.0003.8333.6673.5003.1672.6673.5003.6673.667
B32.5002.8331.8332.6673.8333.0002.1672.1673.1673.500
B42.6672.3332.6672.6673.5001.8333.0002.5003.3333.333
B51.8331.8332.1671.3332.0002.3332.0002.5002.1672.833
B62.1673.5002.6672.8332.1672.1671.5002.8333.3333.667
B72.6672.0002.8332.1671.3331.6672.8333.1672.5003.333
B83.0003.1673.3332.3332.5002.3332.6671.3332.8333.833
B92.6673.6672.5002.3332.3332.5002.1672.1672.3333.000
B101.8333.1672.8333.3332.3332.3332.5003.1673.0003.167
Table 7. Entropy value and entropy weight of risk factors.
A1A2A3A4A5A6A7A8A9A10
H j 0.75671.03420.97770.86630.85470.72970.58690.82661.10361.3052
W j 0.2538−0.03570.02330.13950.15160.28200.43110.1810−0.1081−0.3185
Table 8. Closeness degree and ranking results of evaluation indexes.
B6B4B5B8B3B2B10B7B1B9
T i 0.11930.19250.23810.24980.43020.43710.43770.50230.53510.7649
The order12345678910
Table 9. Association matrix of risk factors. (A × A).
A1A2A3A4A5A6A7A8A9A10
A10.004.863.863.432.431.863.145.144.716.14
A13.140.003.294.862.432.572.432.713.574.00
A12.866.000.003.862.292.712.573.573.574.43
A12.005.573.290.002.572.862.572.433.572.86
A13.716.005.294.430.002.574.574.293.714.29
A13.434.574.433.572.860.002.573.143.142.43
A16.005.865.713.002.572.860.005.293.575.00
A15.865.864.573.292.142.575.140.005.714.14
A12.714.432.714.431.862.572.862.860.003.14
A15.435.294.294.432.433.432.572.433.290.00
Table 10. Association matrix of resilience indexes. (B×B).
B1B2B3B4B5B6B7B8B9B10
B10.004.865.145.294.006.003.714.294.145.14
B25.570.004.432.713.715.144.144.002.865.14
B34.436.430.003.294.005.144.003.002.575.57
B44.575.144.140.003.574.433.713.003.005.14
B54.293.864.293.710.005.002.434.433.435.14
B65.865.296.433.293.140.005.003.143.575.00
B74.576.296.143.004.146.000.003.142.713.86
B85.435.295.144.713.864.573.290.004.143.86
B94.714.294.573.294.004.863.002.290.004.86
B105.005.005.432.863.866.004.145.573.430.00
Table 11. Association matrix of risk factors and resilience indexes. (A×B).
B1B2B3B4B5B6B7B8B9B10
A11.862.142.142.291.572.292.432.572.291.57
A23.002.572.432.001.571.712.572.713.142.71
A32.293.291.572.501.862.432.712.862.142.43
A42.433.142.292.291.141.862.432.002.002.86
A51.863.003.293.001.711.142.292.142.002.00
A61.862.712.571.572.001.432.002.002.142.00
B71.292.291.862.571.712.431.712.291.862.14
A82.433.001.862.142.142.712.431.141.862.71
A92.863.142.712.861.862.142.862.432.002.57
A103.143.143.002.862.432.862.713.292.572.71
Table 12. Standardization of the initial matrix of risk-resilience association matrix.
B1B2B3B4B5B6B7B8B9B10
A10.01250.01280.01280.00890.00990.01340.00940.00930.00840.0122
A20.00990.01010.01010.00700.00780.01060.00750.00730.00660.0097
A30.01090.01130.01120.00790.00870.01180.00830.00810.00730.0107
A40.00950.00980.00970.00680.00750.01020.00720.00700.00640.0093
A50.01330.01360.01370.00950.01050.01420.01000.00980.00890.0129
A60.01030.01060.01060.00740.00820.01110.00780.00760.00690.0101
B70.01380.01410.01420.00990.01090.01480.01040.01010.00920.0135
A80.01350.01380.01380.00960.01060.01440.01010.00980.00900.0131
A90.00930.00950.00950.00670.00740.00990.00700.00680.00620.0091
A100.01110.01140.01140.00790.00880.01190.00830.00820.00740.0108
Table 13. Big data analysis enablers.
Key Enablers G i
C1Capital investment8.16
C2Establishment of big data centres8.09
C3Regarding the combination of big data infrastructures to support platforms and systems7.37
C4Regarding big data sharing and visualisation7.19
C5Guiding role of government departments6.91
C6Data mining6.83
C7Guiding role of government departments6.82
C8Maintain the storage of big data 6.73
C9Strengthening database and information security protection6.65
C10Improving information technology and information management systems6.56
Table 14. Association matrix of big data analysis enablers. (C*C).
C1C2C3C4C5C6C7C8C9C10
C10.007.007.505.336.335.505.835.505.175.33
C12.500.006.337.004.006.005.007.005.836.83
C12.177.170.006.833.837.837.176.176.335.83
C12.675.005.000.004.005.336.674.836.836.67
C14.175.835.835.000.005.175.175.175.175.67
C13.177.677.335.333.830.007.675.675.837.17
C12.837.006.005.833.836.170.004.005.006.33
C12.507.507.006.503.835.177.170.005.836.33
C12.175.837.506.175.005.336.176.500.005.17
C14.005.336.676.335.006.337.675.507.170.00
Table 15. Association matrix of resilience–big data analysis enablers. (B*C).
C1C2C3C4C5C6C7C8C9C10
B11.432.001.432.431.143.002.572.432.432.43
B21.432.141.571.712.292.572.002.432.712.86
B32.432.572.712.141.861.712.431.711.432.43
B41.712.142.712.711.861.712.432.572.143.00
B51.861.862.141.861.432.431.432.292.292.86
B63.432.143.142.292.292.292.572.863.142.29
B72.292.002.571.291.572.572.142.432.142.43
B81.712.863.142.431.862.863.292.432.713.00
B91.862.142.861.571.862.292.143.292.142.71
B102.572.292.432.292.003.142.002.431.712.29
Table 16. The standardised initial matrix H.
C1C2C3C4C5C6C7C8C9C10
B10.00570.01280.01270.01200.00870.01150.01280.01090.01160.0118
B20.00500.01130.01120.01050.00770.01010.01130.00960.01020.0105
B30.00510.01140.01150.01070.00780.01020.01150.00970.01030.0106
B40.00480.01080.01090.01020.00740.00960.01090.00920.00980.0101
B50.00490.01100.01100.01030.00760.00990.01100.00940.01000.0103
B60.00530.01170.01180.01100.00800.01050.01180.01000.01070.0109
B70.00530.01180.01190.01110.00810.01060.01190.01010.01070.0110
B80.00520.01170.01180.01100.00800.01050.01180.00990.01070.0109
B90.00470.01060.01060.00990.00730.00940.01060.00900.00960.0098
B100.00550.01230.01230.01160.00850.01110.01230.01050.01110.0114
Table 17. Positive ideal solution and negative ideal solution of each big data analysis enabler.
C1C2C3C4C5C6C7C8C9C10
f i * 0.01380.01410.01420.00990.01090.01480.01040.01010.00920.0135
f i 0.00930.00950.00950.00670.00740.00990.00700.00680.00620.0091
Table 18. The calculation results of group utility and individual regret.
1 / T i C1C2C3C4C5C6C7C8C9C10
B11.86880000000000
B22.28781.63781.55481.61401.57941.53971.59361.59961.60401.56331.5398
B32.32451.36431.37991.32681.40641.43391.53451.37791.48051.49141.4253
B45.19484.55514.53364.49954.46584.59964.70594.55284.62394.62734.5459
B54.19993.27253.29383.35703.27663.35283.26253.39323.35333.28323.2275
B68.38223.47004.05713.72583.90323.98724.22173.94623.99723.72283.9506
B71.99080.80920.86560.79710.87230.85190.86940.86020.84650.86630.8410
B84.00321.83731.88191.79391.91451.89201.96661.86051.99811.90611.9275
B91.30741.30741.30741.30741.30741.30741.30741.30741.30741.30741.3074
B102.28470.43590.48670.42890.46010.45050.49540.53000.48190.54360.4840
S j 18.689519.360718.850219.185819.414919.956919.427819.692819.311319.2490
R j 4.55514.53364.49954.46584.59964.70594.55284.62394.62734.5459
Table 19. The calculation results of Q j .
C1C2C3C4C5C6C7C8C9C10
Q0.18590.40610.13360.19580.56491.00000.47240.72510.58170.3876
S * = 18.6895 ,   S = 19.9569 , R * = 4.4698 , R = 4.7059 , v = 0.5
Table 20. Ranking results of big data enablers.
C1C2C3C4C5C6C7C8C9C10
S18.689519.360718.850219.185819.414919.956919.427819.692819.311319.2490
R4.55514.53364.49954.46584.59964.70594.55284.62394.62734.5459
Q0.18590.40610.13360.19580.56491.00000.47240.72510.58170.3876
The order of S10598413267
The order of R58910416327
The order of Q25137106984
Weights (1 − Q) 0.15230.11110.16200.15040.08140.00000.09870.05140.07820.1145
Publisher’s Note: MDPI stays neutral with regard to jurisdictional claims in published maps and institutional affiliations.

