Article

LinkNet-B7: Noise Removal and Lesion Segmentation in Images of Skin Cancer

1
Graduate School of Informatics, Management Information Systems, Gazi University, Ankara 06560, Turkey
2
Management Information Systems Department, Applied Sciences Faculty, Gazi University, Ankara 06560, Turkey
*
Author to whom correspondence should be addressed.
Mathematics 2022, 10(5), 736; https://doi.org/10.3390/math10050736
Submission received: 24 January 2022 / Revised: 17 February 2022 / Accepted: 21 February 2022 / Published: 25 February 2022
(This article belongs to the Topic Machine and Deep Learning)

Abstract

:
Skin cancer is common nowadays. Early diagnosis of skin cancer is essential to increase patients’ survival rate. In addition to traditional methods, computer-aided diagnosis is used in diagnosis of skin cancer. One of the benefits of this method is that it eliminates human error in cancer diagnosis. Skin images may contain noise such as like hair, ink spots, rulers, etc., in addition to the lesion. For this reason, noise removal is required. The noise reduction in lesion images can be referred to as noise removal. This phase is very important for the correct segmentation of the lesions. One of the most critical problems in using such automated methods is the inaccuracy in cancer diagnosis because noise removal and segmentation cannot be performed effectively. We have created a noise dataset (hair, rulers, ink spots, etc.) that includes 2500 images and masks. There is no such noise dataset in the literature. We used this dataset for noise removal in skin cancer images. Two datasets from the International Skin Imaging Collaboration (ISIC) and the PH2 were used in this study. In this study, a new approach called LinkNet-B7 for noise removal and segmentation of skin cancer images is presented. LinkNet-B7 is a LinkNet-based approach that uses EfficientNetB7 as the encoder. We used images with 16 slices. This way, we lose fewer pixel values. LinkNet-B7 has a 6% higher success rate than LinkNet with the same dataset and parameters. Training accuracy for noise removal and lesion segmentation was calculated to be 95.72% and 97.80%, respectively.

1. Introduction

Cancer can be defined as a disease that results from the uncontrolled proliferation of cells in various organs [1]. An estimated 10 million people died from cancer in 2020 [2]. In recent years, the number of skin cancer cases has increased rapidly under the influence of environmental conditions. Melanoma is the most deadly skin cancer. According to the American Cancer Society, the number of new melanoma cases in the United States in 2019 is 115,320 and the number of deaths is 11,540, and ~63% of skin cancer-related deaths are caused by melanoma [3].
Early diagnosis is crucial for the treatment of skin cancer. When diagnosis is made early and treatment is initiated, the five-year survival rate is 92% [4]. The increasing mortality rate of skin cancer causes additional costs for treatment services [5]. Dermoscopy images are assessed by dermatologists, which is usually a very time-consuming and error-prone process [6]. The visual examination requires many serious steps such as dermoscopy and biopsy. The success rate, especially for visual inspection, may decrease significantly depending on the dermatologist’s qualifications. Visual examination of skin cancer shows that the success rate is ~80% even for the best dermatologists [7].
Nowadays, image processing and deep learning algorithms are widely used to diagnose skin cancer [8]. When detecting skin cancer with deep learning and image processing, it is crucial to remove hair-like noise from the lesion. If the hair removal is not done correctly, the success rate in classifying the lesion decreases [9]. In one study, an image processing algorithm was developed to segment images of skin cancer and other pigmented cancer lesions. The results were consistent with those obtained by experts [10].
As deep learning and image processing algorithms eliminate the human factor, they can provide more reliable results than conventional methods. One of the main advantages of these methods is that they do not require surgical intervention, and these advantages help to significantly reduce the diagnosis time. Surgical techniques are time-consuming and disturb patients. These algorithms ensure that human errors are eliminated and the expert obtains successful results. In addition, these methods reduce the costs in the diagnostic phase to almost zero and reduce the error rates. The use of machine learning in diagnosing the disease has recently increased significantly [11]. Medical imaging is a tool for clinicians to make diagnoses and plan surgeries. Uncertainty influences decision-making processes. Visualization can help understand and communicate these uncertainties [12].
As stated earlier, the human factor leads to errors in the diagnosis process. In our study, the noise in the skin cancer images is removed and the lesion is segmented. Thanks to this visualization, physicians can more easily examine the lesion without noise and make more successful diagnostic decisions. One of the most critical problems with using such automated methods is the inaccuracy of cancer diagnosis, as noise removal and segmentation cannot be performed effectively. In addition, the lack of hair removal datasets hinders the development of deep learning techniques for hair removal. If you look at the literature, there is no such dataset. What we have done is different from the existing literature.
  • We divided the images into 16 layers (256 × 256 × 3). The images in the PH2 dataset have a resolution of 765 × 533 pixels. In the ISIC 2018, the images have different resolutions such as 4288 × 2848, 3024 × 2016. If the input data are below these resolutions, data loss in the image is inevitable. To minimize this, we can divide the images into 16 slices and use an image with a total size of 1024 × 1024 as input. This way we can minimize the loss of pixels.
  • We proposed LinkNet-B7. The results show us that LinkNet-B7 has high accuracy. There is no LinkNet-based algorithm for skin cancer segmentation and noise removal in the literature.
  • We created a noise dataset that includes hair, water bubbles, ink stains, and ruler marks. No such dataset exists in the literature (only hair masks).
  • Some images have a black frame and band-aid noises. In the segmentation phase, these noises were eliminated.
The following sections of our study are planned as follows. The Section 2 contains related work. The Section 3 will explain the material and method. In the Section 4 and Section 5, the results of the method are presented, discussed, and a conclusion is drawn. The overall representative structure of the study is shown in Figure 1.

2. Related Works

One of the first studies to offer a solution to the hair removal problem is the DullRazor algorithm developed by Lee et al. [13]. This algorithm removes hairs in the lesion using thresholds and morphological operations. Ali et al. [14] proposed a study on hair removal and lesion segmentation on skin cancer images. They said that hair removal is important because the CNN model will detect correlations between the noise and the target (skin cancer class). If we do not remove this noise from the image, the CNN must learn to ignore the noise using gradient descent and a large image dataset.
Nowadays, image datasets are used for skin cancer diagnosis with deep learning. Two of the most commonly used datasets are the ISIC and the PH2 [15]. Wei et al. [16] proposed a UNet-based method for hair removal. They prepared a hair dataset. They achieved ~96% dice coefficient with UNet in hair removal phase and 86.5% in segmentation. In the study of Zafar et al. [17], their method allows replacing the parts containing hairs in the lesion with the colors in the areas closest to them. They proposed a UNet-based deep learning algorithm for lesion segmentation. They used ResNet50 as the encoder. In the segmentation phase, the study achieved a Dice coefficient rate of 85.8% with the the ISIC 2017 dataset and 92.4% with the PH2 dataset. In this study, the accuracy increased by approximately 1% when they used a dataset with cleaned hair.
Zhang et al. [18] presented a DSM algorithm for segmentation. They used the the ISIC 2017 and PH2 datasets. In this study, segmentation was performed after the hair removal phase using DSM. The study obtained a dice coefficient of 92% with the PH2 dataset. In one study [19], the UNet and FCN algorithms are applied together. A success rate of approximately 87% was obtained with the ISIC 2017 dataset. It was found that the desired segmentation results were not achieved. Hair noise, brightness, and color variations on the lesion were shown to be the cause. In another study [20], the UNet algorithm was used, and the training accuracy was 88.580% in the hair removal phase and 92.600% in the segmentation phase. In the hair removal phase, 1534 images and masks with hair were used, and in the segmentation phase, 13,000 images and masks were used (the ISIC 2018). Only images with hair noise (without other noises) were used in this study.
Nowadays, some models are commonly used as pre-trained coders in deep learning algorithms. This allows them to achieve higher accuracy in the training stages. One of the latest coding algorithms is EfficentNetB7. EfficentB7 from Google has 66M parameters, fast training time, and high accuracy [21]. In another study [22], a UNet-based algorithm was used for lesion segmentation. In this study, denseness was used as an encoder. They achieved a dice accuracy of 94% in the PH2 dataset. Baheti et al. [23] proposed the Eff-Unet model. This model is based on UNet and uses efficientNetB7 as the encoder. This study shows that UNet with efficientNetB7 as encoder has higher accuracy than others (ResNet 18, 34, 50, 101). In another study [24], a deep learning algorithm called EAR-UNet was proposed. This algorithm includes EfficientNet and ResNet.
In the study by Talavera-Martinez et al. [25], they created a hair dataset. Their dataset contains only simulated hair sounds. They used the CNN-based model with an input size of 512 × 512. It is easy to find sounds in these images. However, in reality, the images may contain more different hair sounds (different colors, contrast, etc.). Therefore, we do not know how their model works for real hair sounds. Chaurasia et al. [26] proposed a deep learning model called LinkNet. LinkNet provides short epoch time, high performance with 11.5 M parameters. According to this study, LinkNet has higher accuracy than old models (SegNet, Enet, Dilation10, Deep-Lab CRF (Vgg16), Deep-Lab CRF (ResNet101)). UNet is widely used in medical segmentation. However, UNet also has a significant drawback. The UNet model has the problem of creating a unified mask for many kernels. In addition, these either overlap or seem to be very close to each other. In the study by Kallam et al. [27], LinkNet has higher accuracy than UNet (UNet = 94.8 and LinkNet = 97.2). They used the architecture of LinkNet34. LinkNet uses ResNet18 as the encoder. However, LinkNet34 uses ResNet34 as the encoder.
Dong et al. [28] proposed a deep learning model called FAC-Net. In this study, 91.19% dice coefficient was obtained with using the ISIC 2018 dataset. The model is based on upsampling, not downsampling like the UNet architecture. There are modified LinkNet architectures in the literature; one of them is D-LinkNet. D-LinkNet uses ResNet34 as the encoder and a middle block containing dilated convolutional layers. They achieved a 2% higher accuracy rate than LinkNet34 [29]. Xiong et al. [30] proposed Dp-LinkNet. It is similar to D-LinkNet. They used a different center block than D-LinkNet. They achieved 0.9% higher accuracy rate than D-LinkNet. However, it also increases the training time. Şahin et al. [31] proposed a signet-based model for lesion segmentation. They used the Dullrazor algorithm to remove the hair noise. The study shows that Dullrazor is not sufficient for thin hairs. They achieved a dice accuracy of 88.43%. This study shows that hair removal increases the accuracy. In another study [32] on skin lesion segmentation, SegNet was used. They achieved 85.16% dice accuracy on the PH2 dataset. In another study, Bagheri et al. [33] proposed a Mask R-CNN based model. They reached 89.83 % dice accuracy on the PH2 dataset.
Looking at the literature, using deep learning and image processing together is a more suitable solution to increase the success rate of noise removal and lesion segmentation. Image processing is insufficient because the contrast is different and the noise has similar pixel features as the lesion. In addition, the use of data enhancement techniques is beneficial to increase the success rate.

3. Materials and Methods

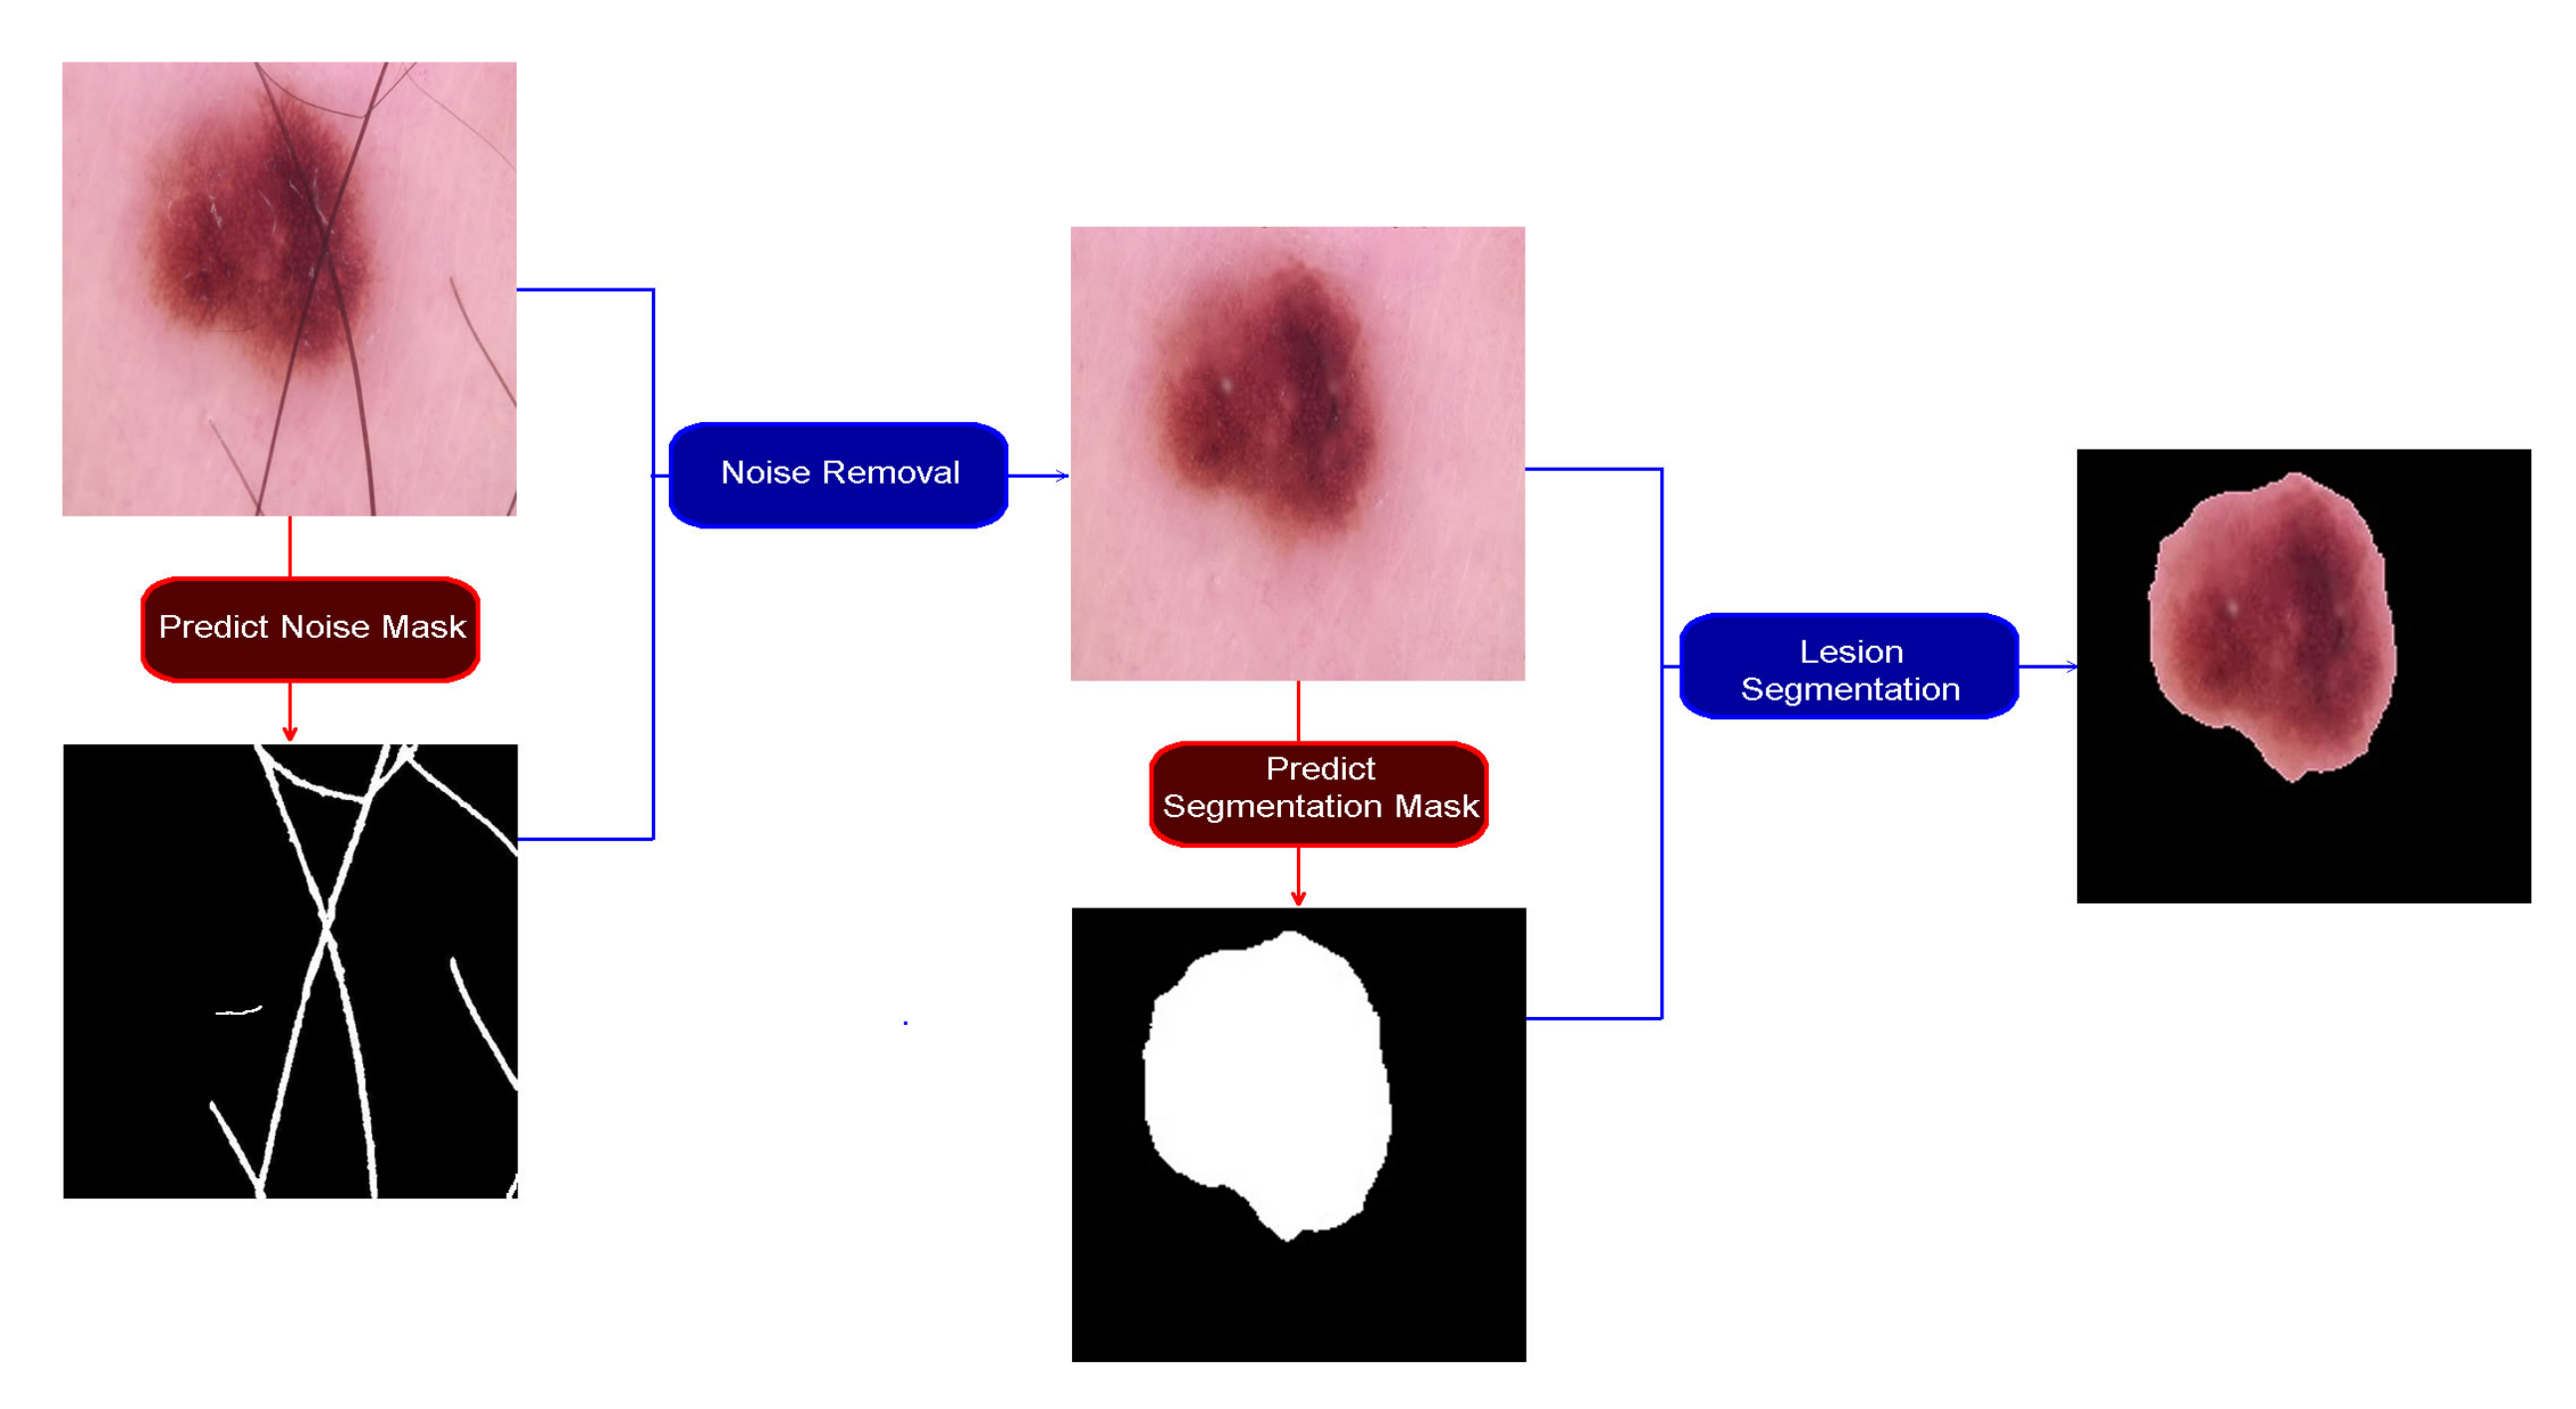
Our study consists of the noise removal and lesion segmentation phases. The data are divided into 70% training, 20% validation, and 10% test sets in both phases. These rates are acceptable values used in deep learning studies.

3.1. Datasets

Two ISIC datasets were used, taken from the 2018 ISIC Challenge. The first dataset consists of 10,015 RGB images with lesions in jpeg format. There are no segmentation masks in the dataset of 10,015 images from the ISIC 2018 [
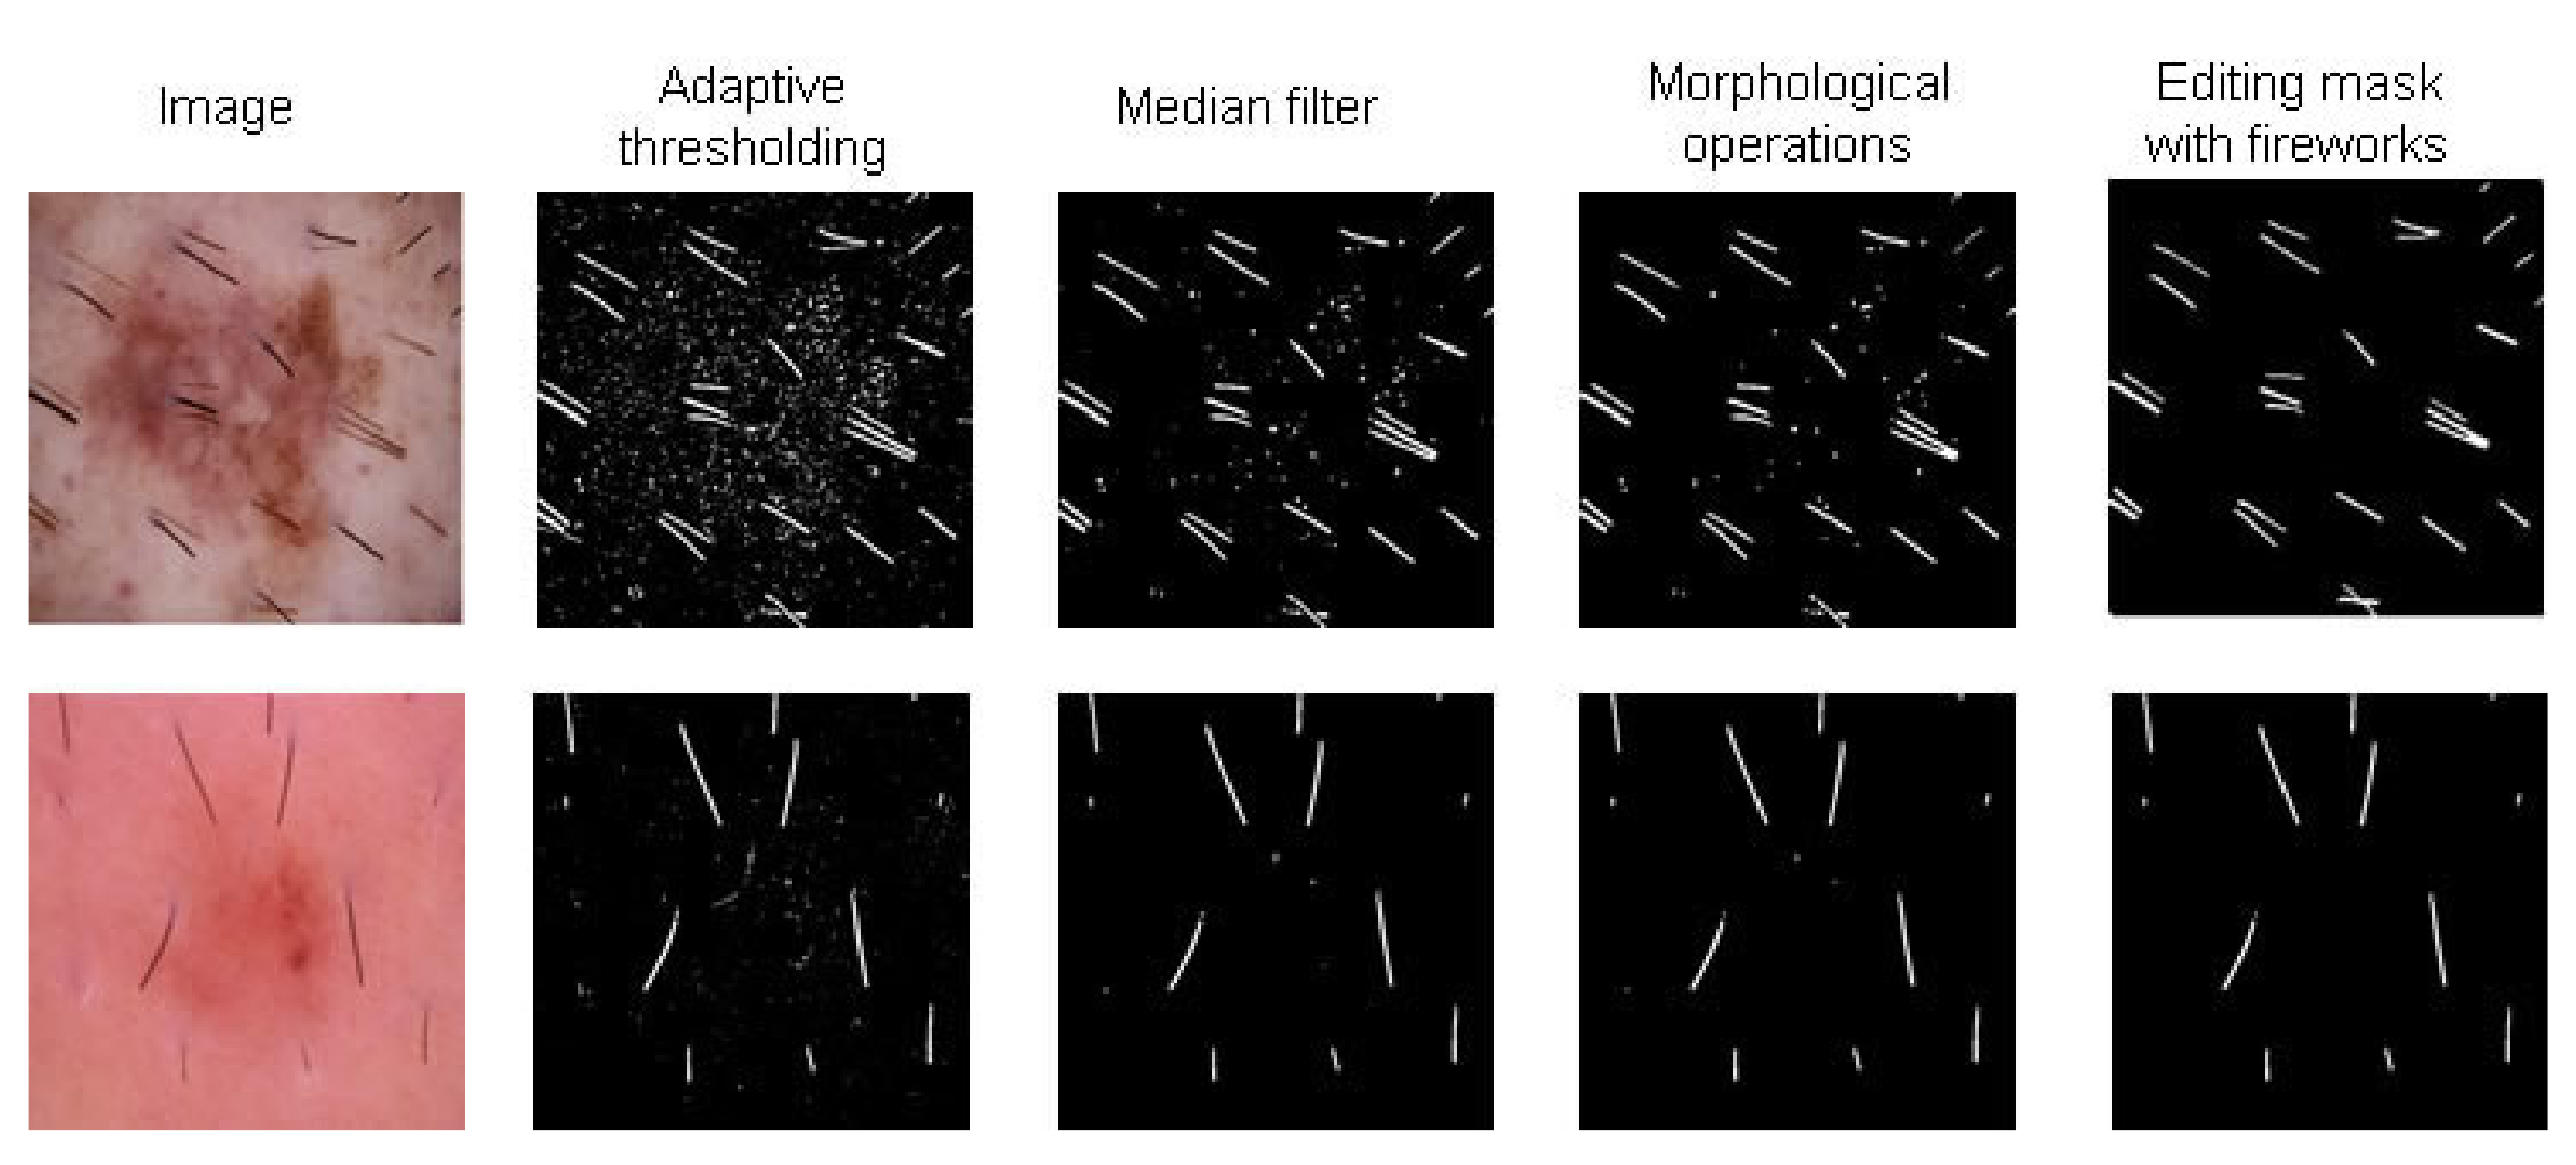
34]. Therefore, we can only use this dataset for noise removal phase. From this dataset, we created 2500 images containing noise, ink and ruler traces, and water bubble noise. We created 2500 noise masks from the cleaned dataset and increased them to 10,000 in the noise removal phase by data expansion. This dataset is now called the cleanup dataset. The process of creating this dataset is shown in Figure 2. We could have created a mask by using fireworks without other processes; however, it was easier for us to use a different process. We used OpenCV functions. Functions and parameters used in the processes:
1. Adaptive thresholding: If the pixel value is less than the threshold, it is set to 0. Otherwise, it is set to a maximum value. The algorithm determines the threshold value for a pixel based on a small area around the pixel. Thus, we get different thresholds for other regions of the same image, leading to better results for images those suffer with uneven lighting.
We used cv2.adaptiveThreshold(image, 255, cv2.ADAPTIVE_THRESH_MEAN_C, cv2.THRESH_BINARY, 11, 8).
First parameter: Original image. Second parameter: Maximum value.
Third parameter: This is using the arithmetic mean of the local pixel neighborhood to compute our threshold value.
Fourth parameter: THRESH_BINARY indicates that any pixel value that passes the threshold test will an output value of 0. Otherwise, it will have a value of 255.
Fifth parameter: The mean grayscale pixel intensity value of each 11 × 11 sub-region will be computed in the image to compute threshold value.
Sixth parameter: A constant which is subtracted from the mean or weighted mean calculated.
2. Median filter: The function computes the median of all the pixels under the kernel window and the central pixel is replaced with this median value. This way we can remove small noises from the image. We used cv2.medianBlur(image, 5) (5 is kernel size).
3. Morphological operations.
(a) The opening process is obtained by the erosion of an image followed by a dilation. Erosion erodes away the boundaries of foreground object. Furthermore, dilation increases the white region in the image or size of foreground object increases. It is useful for removing small objects. A kernel tells us how to change the value of any given pixel by combining it with different amounts of the neighboring pixels. kernel = np.ones((3,3),np.uint8).
We used cv.morphologyEx(image, cv.MORPH_OPEN, kernel).
(b) The closing process is the reverse of opening, dilation followed by erosion. It is useful for closing small holes in foreground objects or small black dots on the object [35].
We used cv.morphologyEx(img, cv.MORPH_CLOSE, kernel).
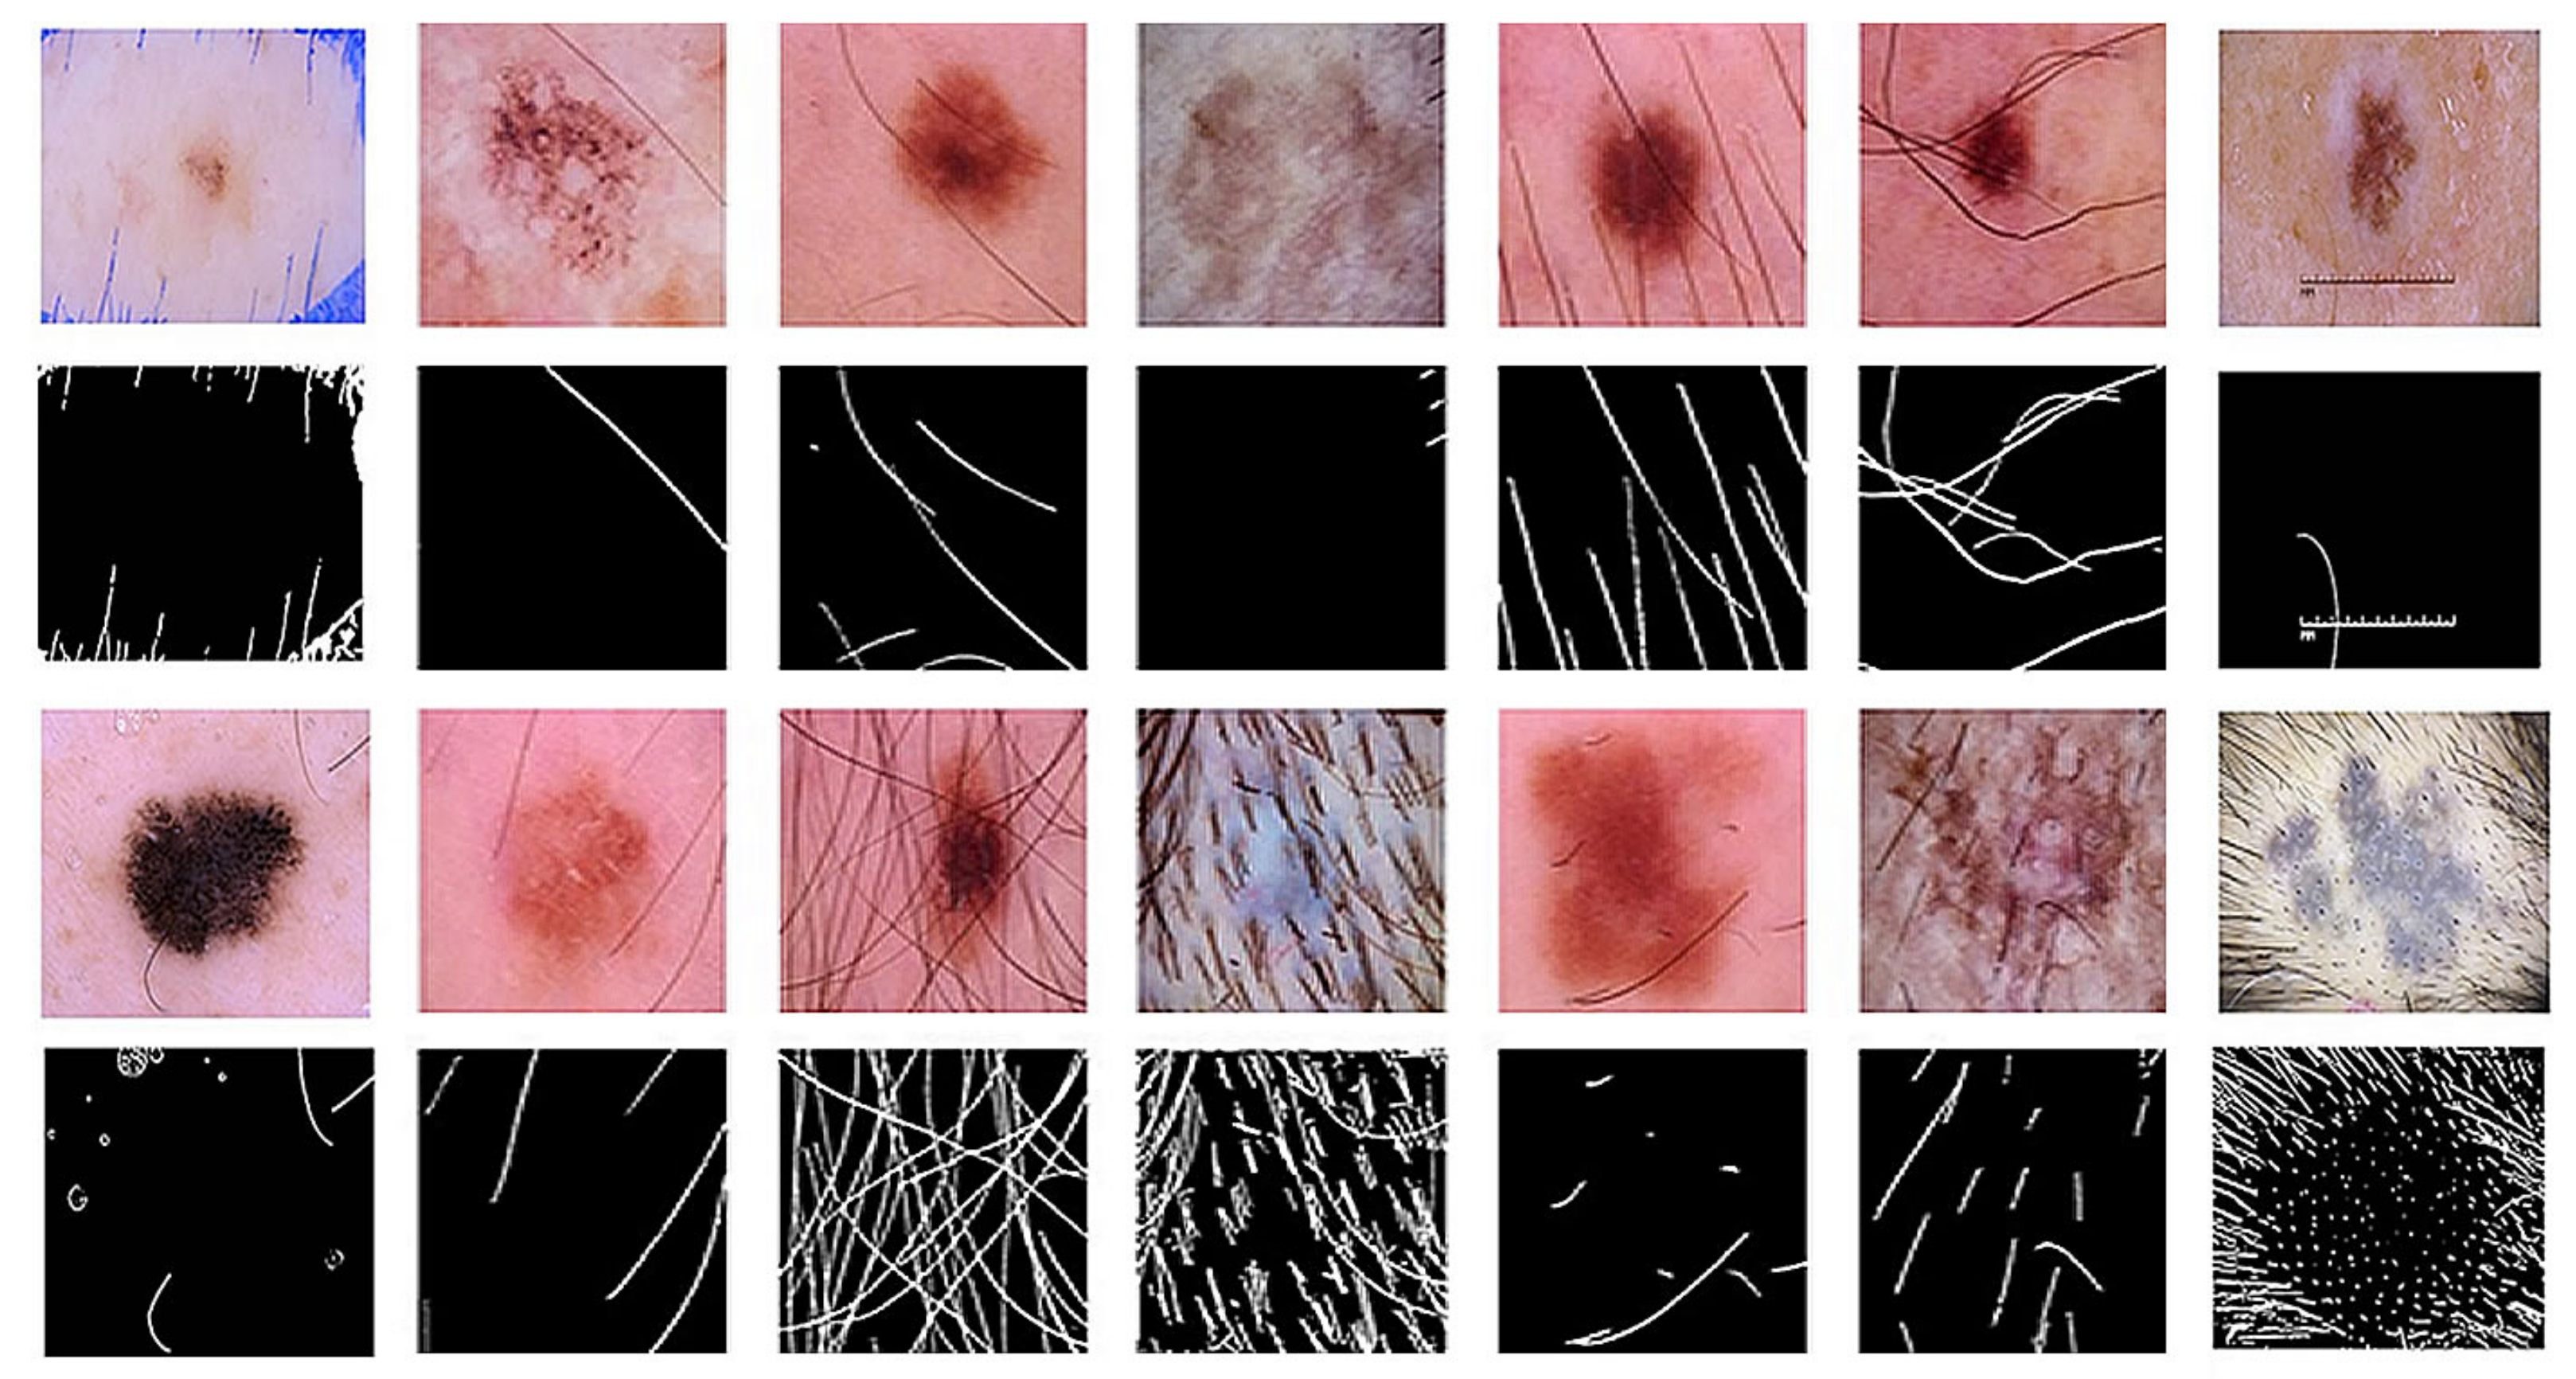
In this study, three different datasets were used to increase the total number of images because the first ISIC 2018 dataset did not contain segmentation masks. 
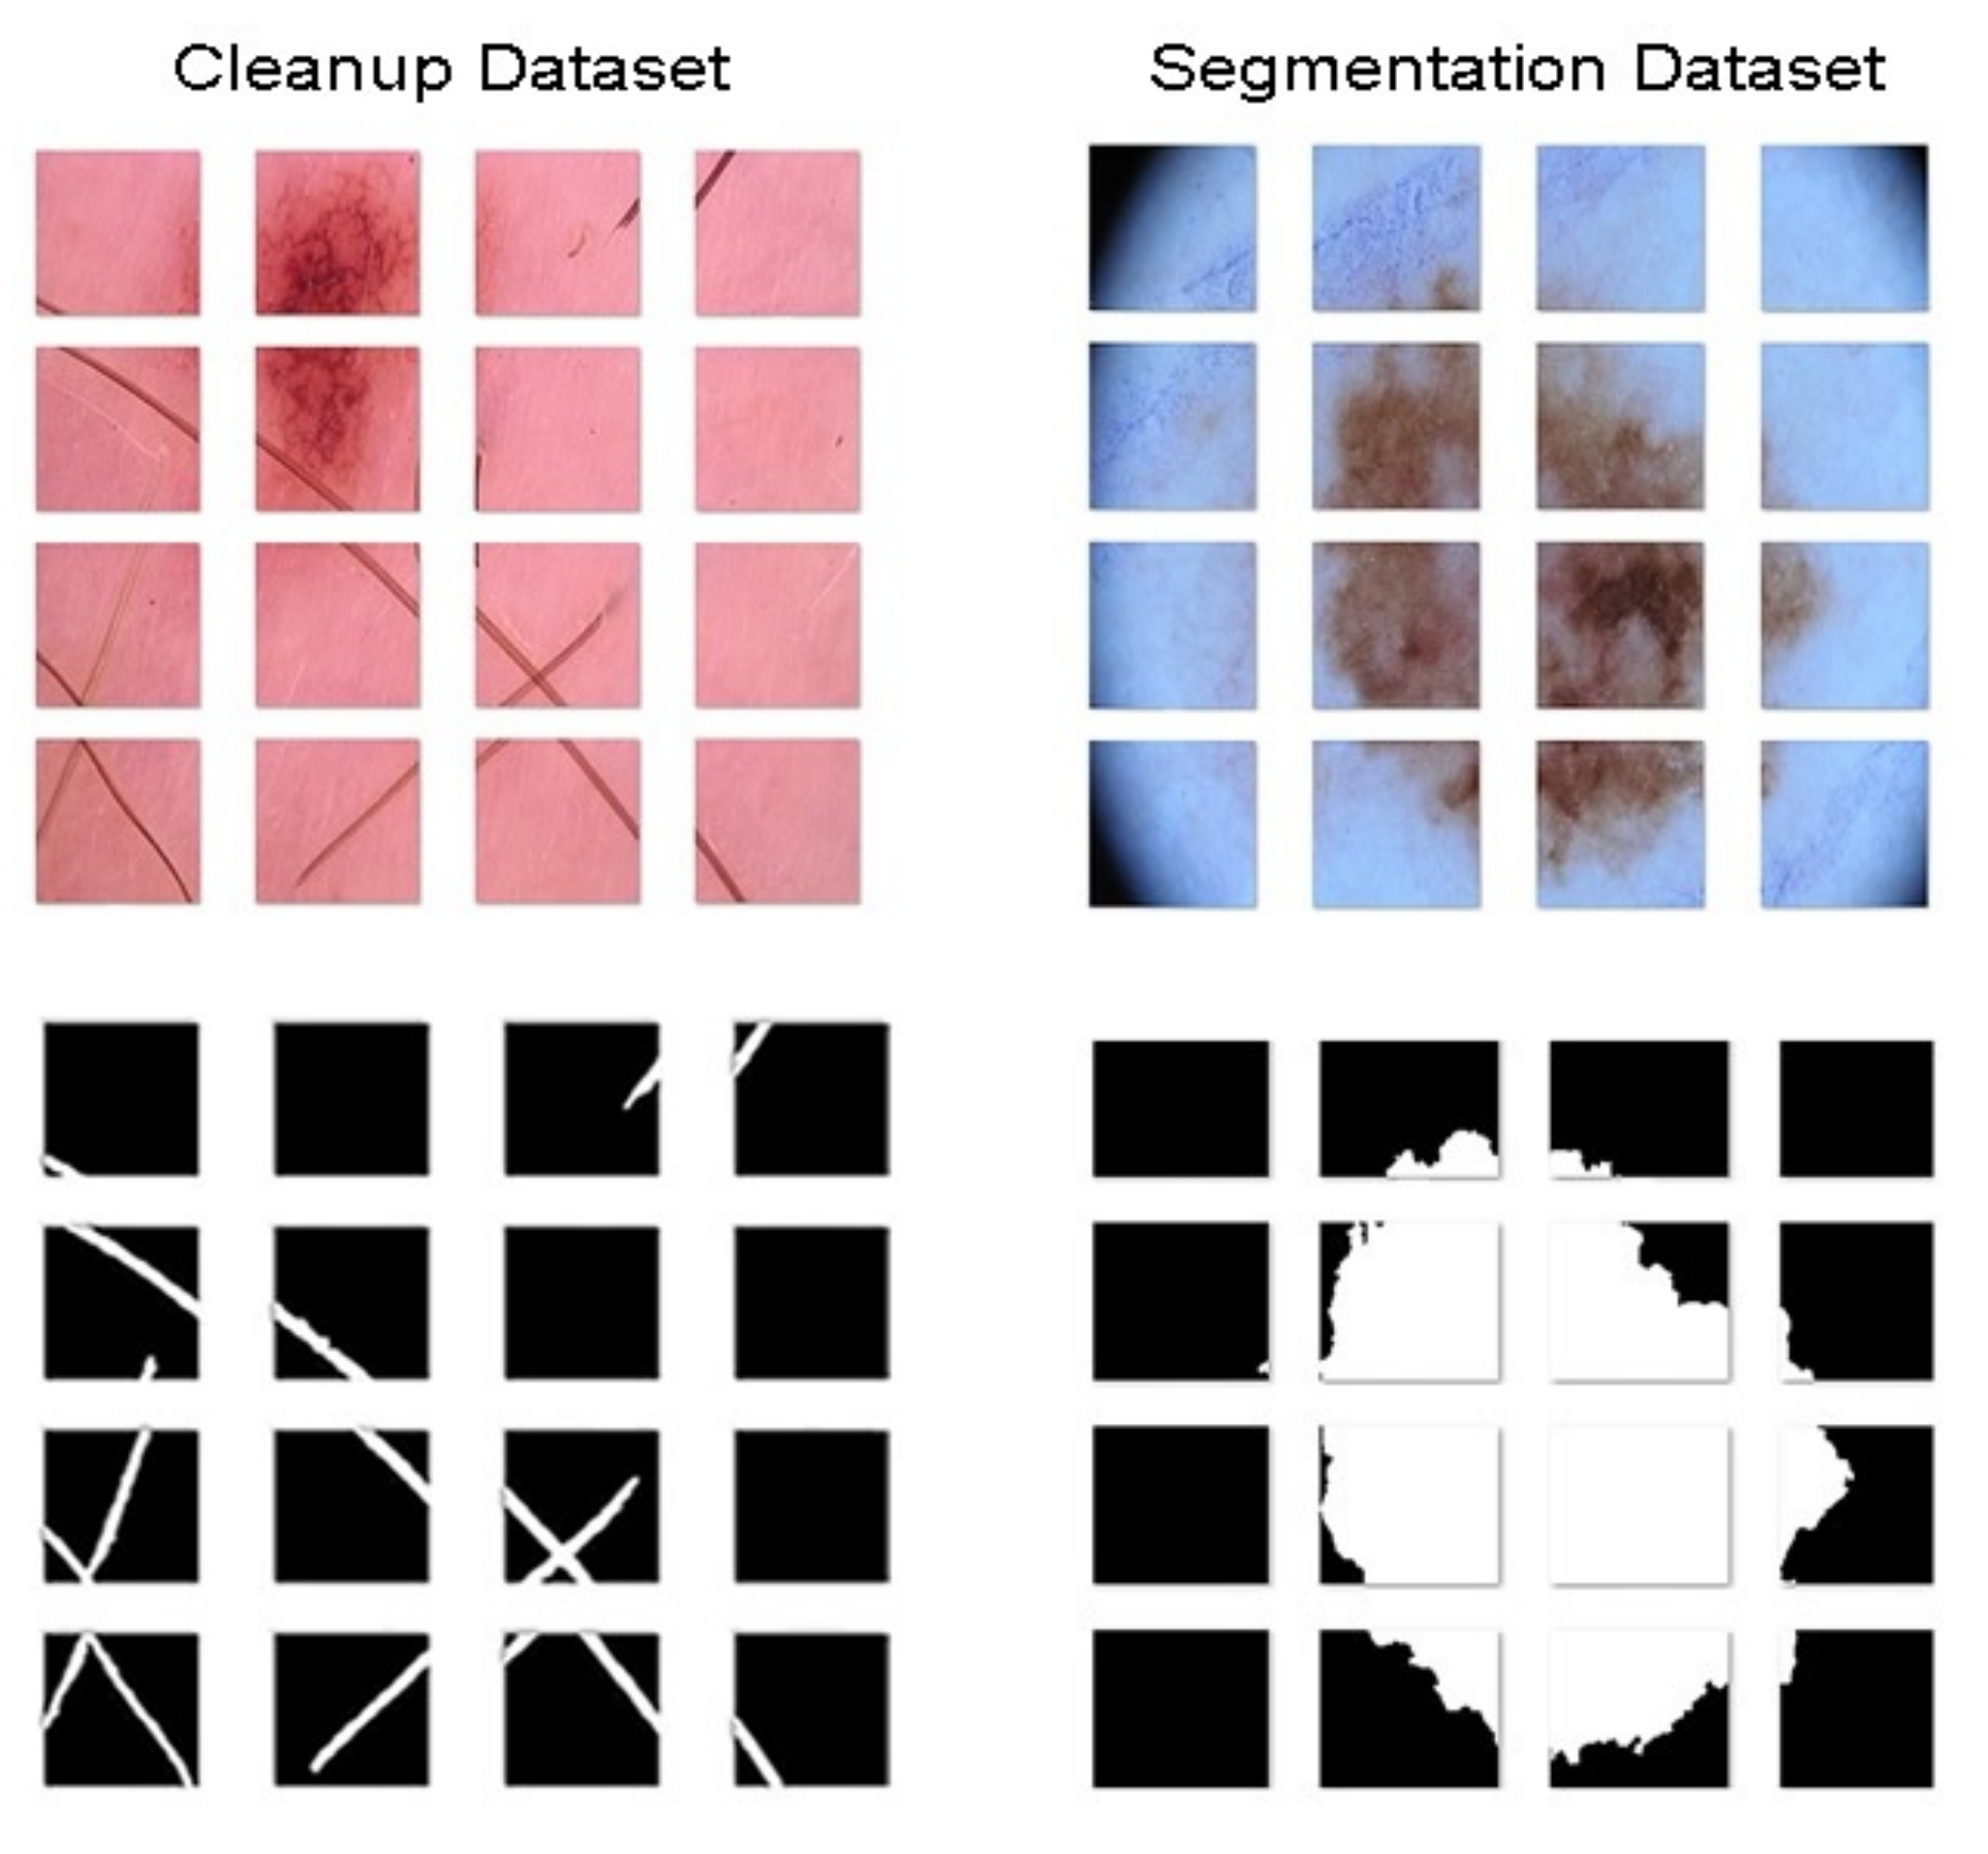
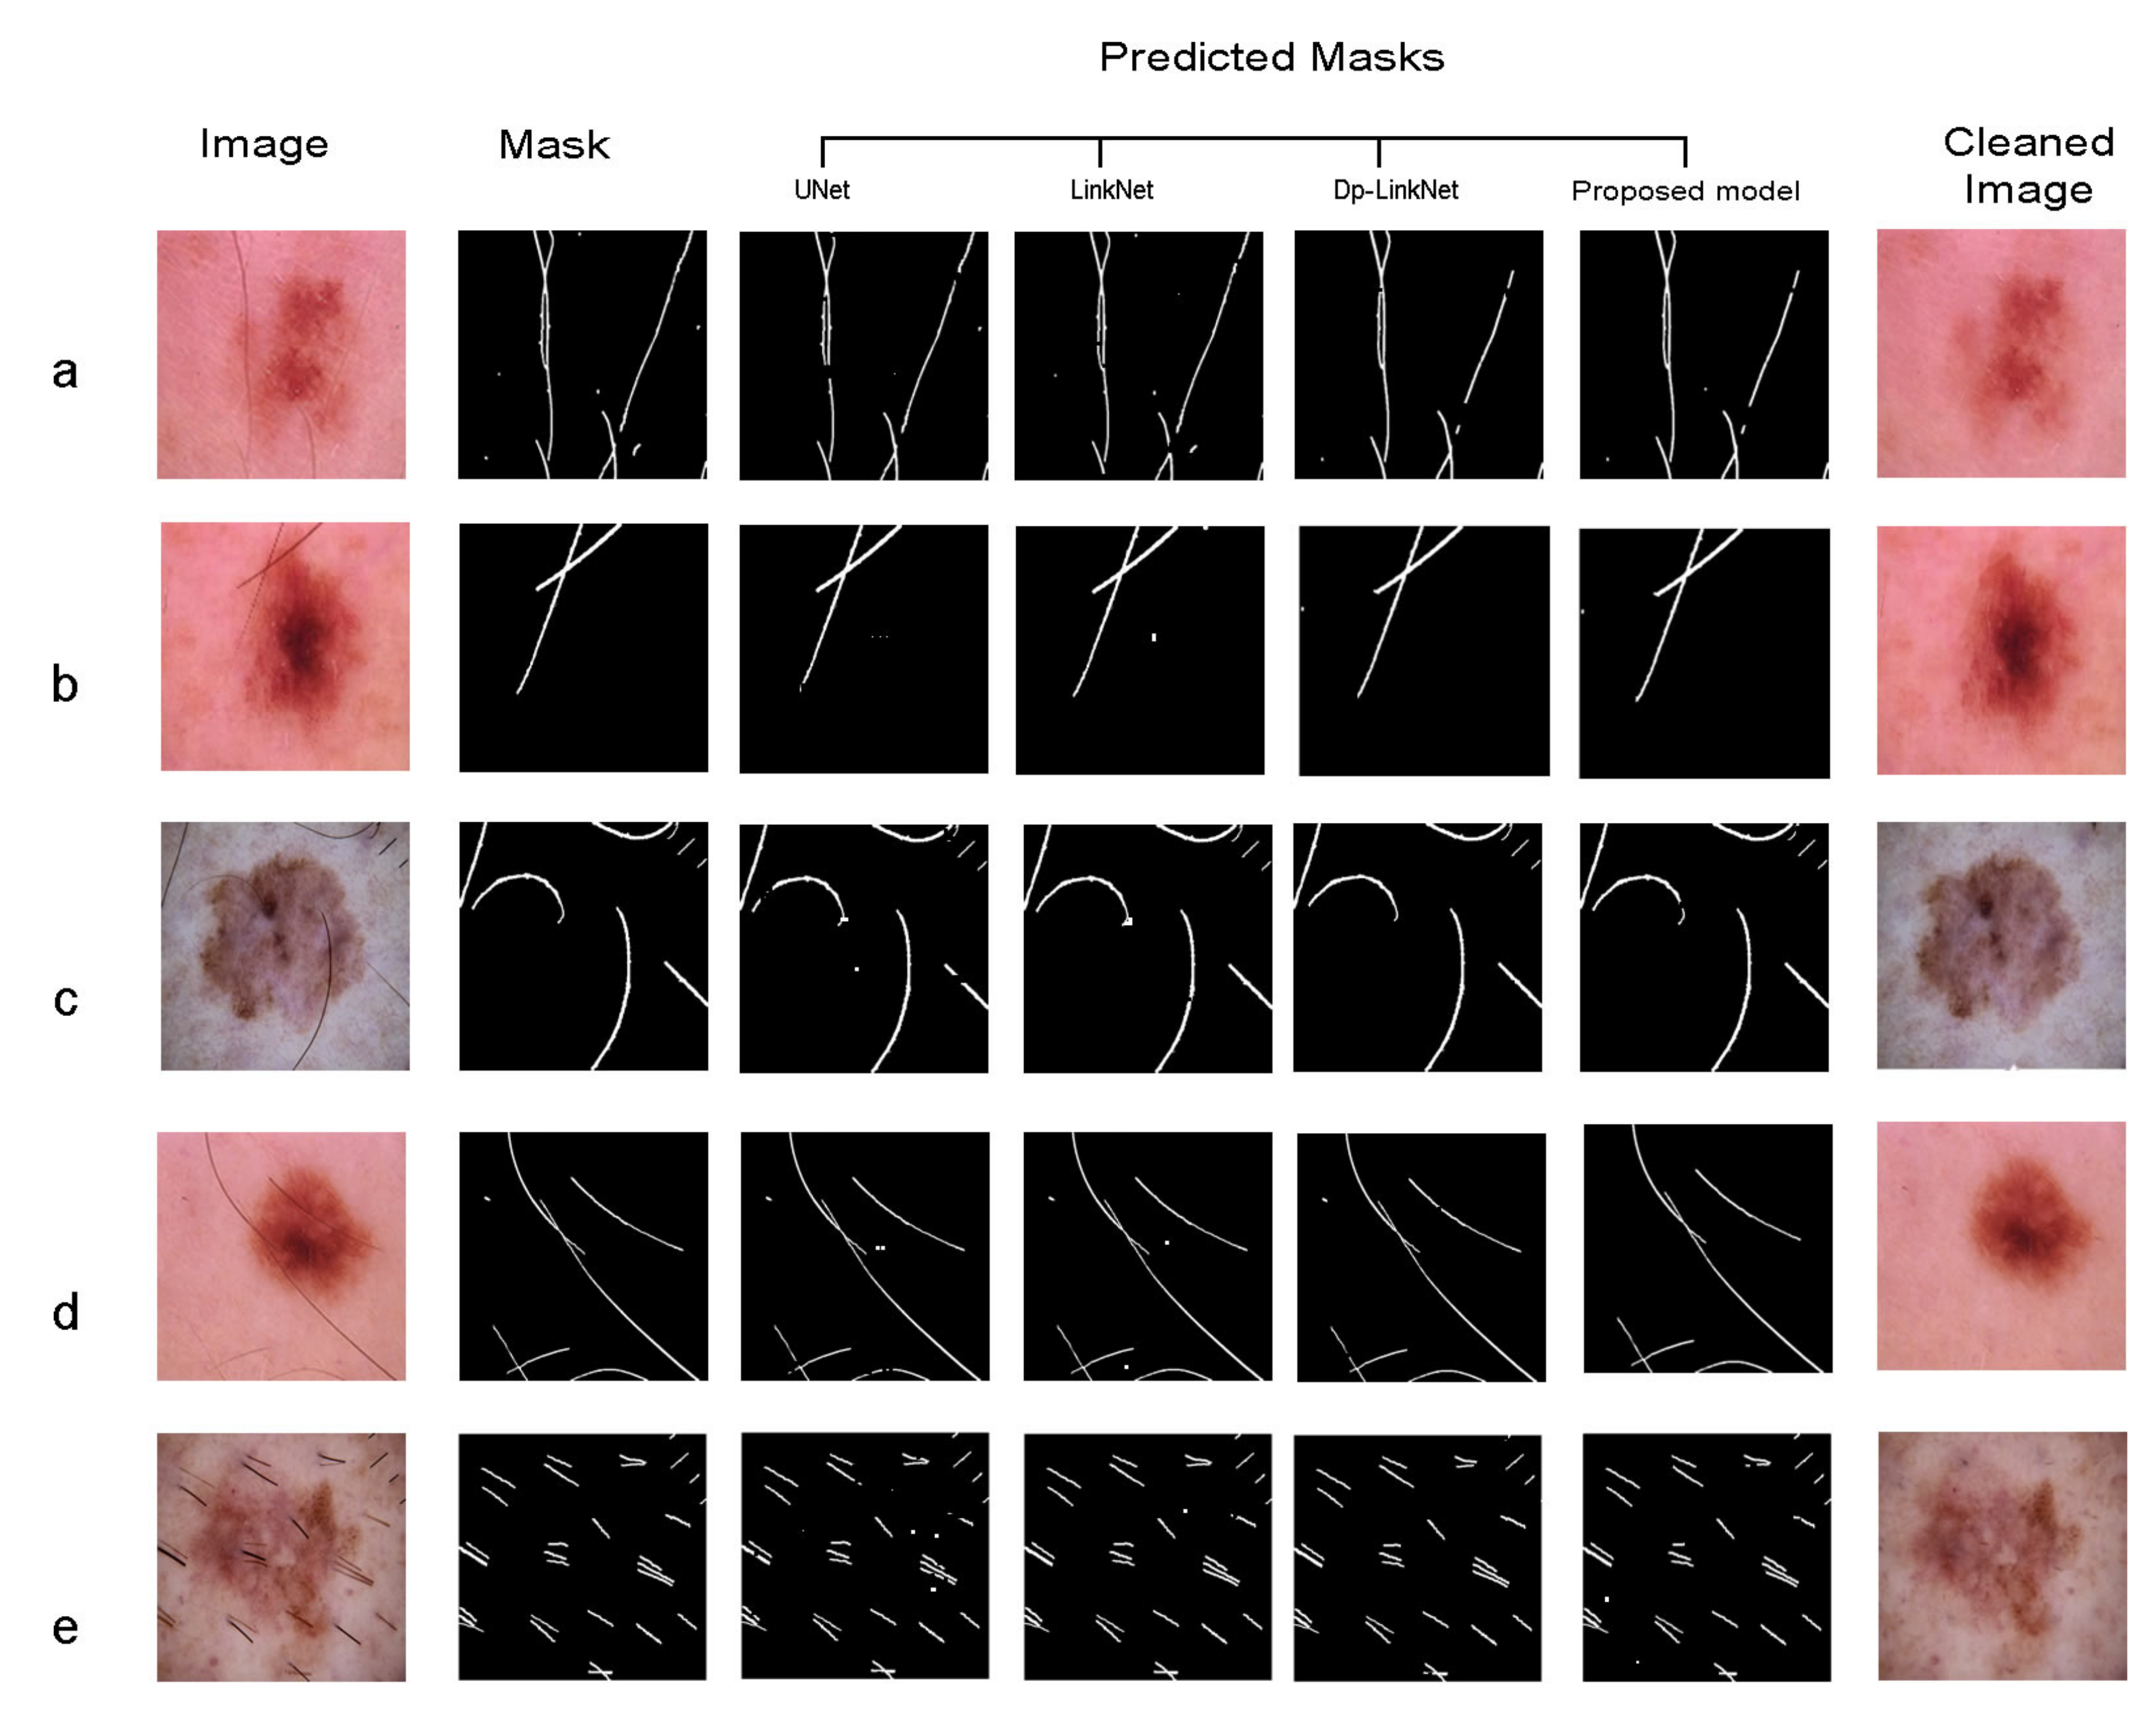
Figure 3 shows examples of our cleaned dataset.
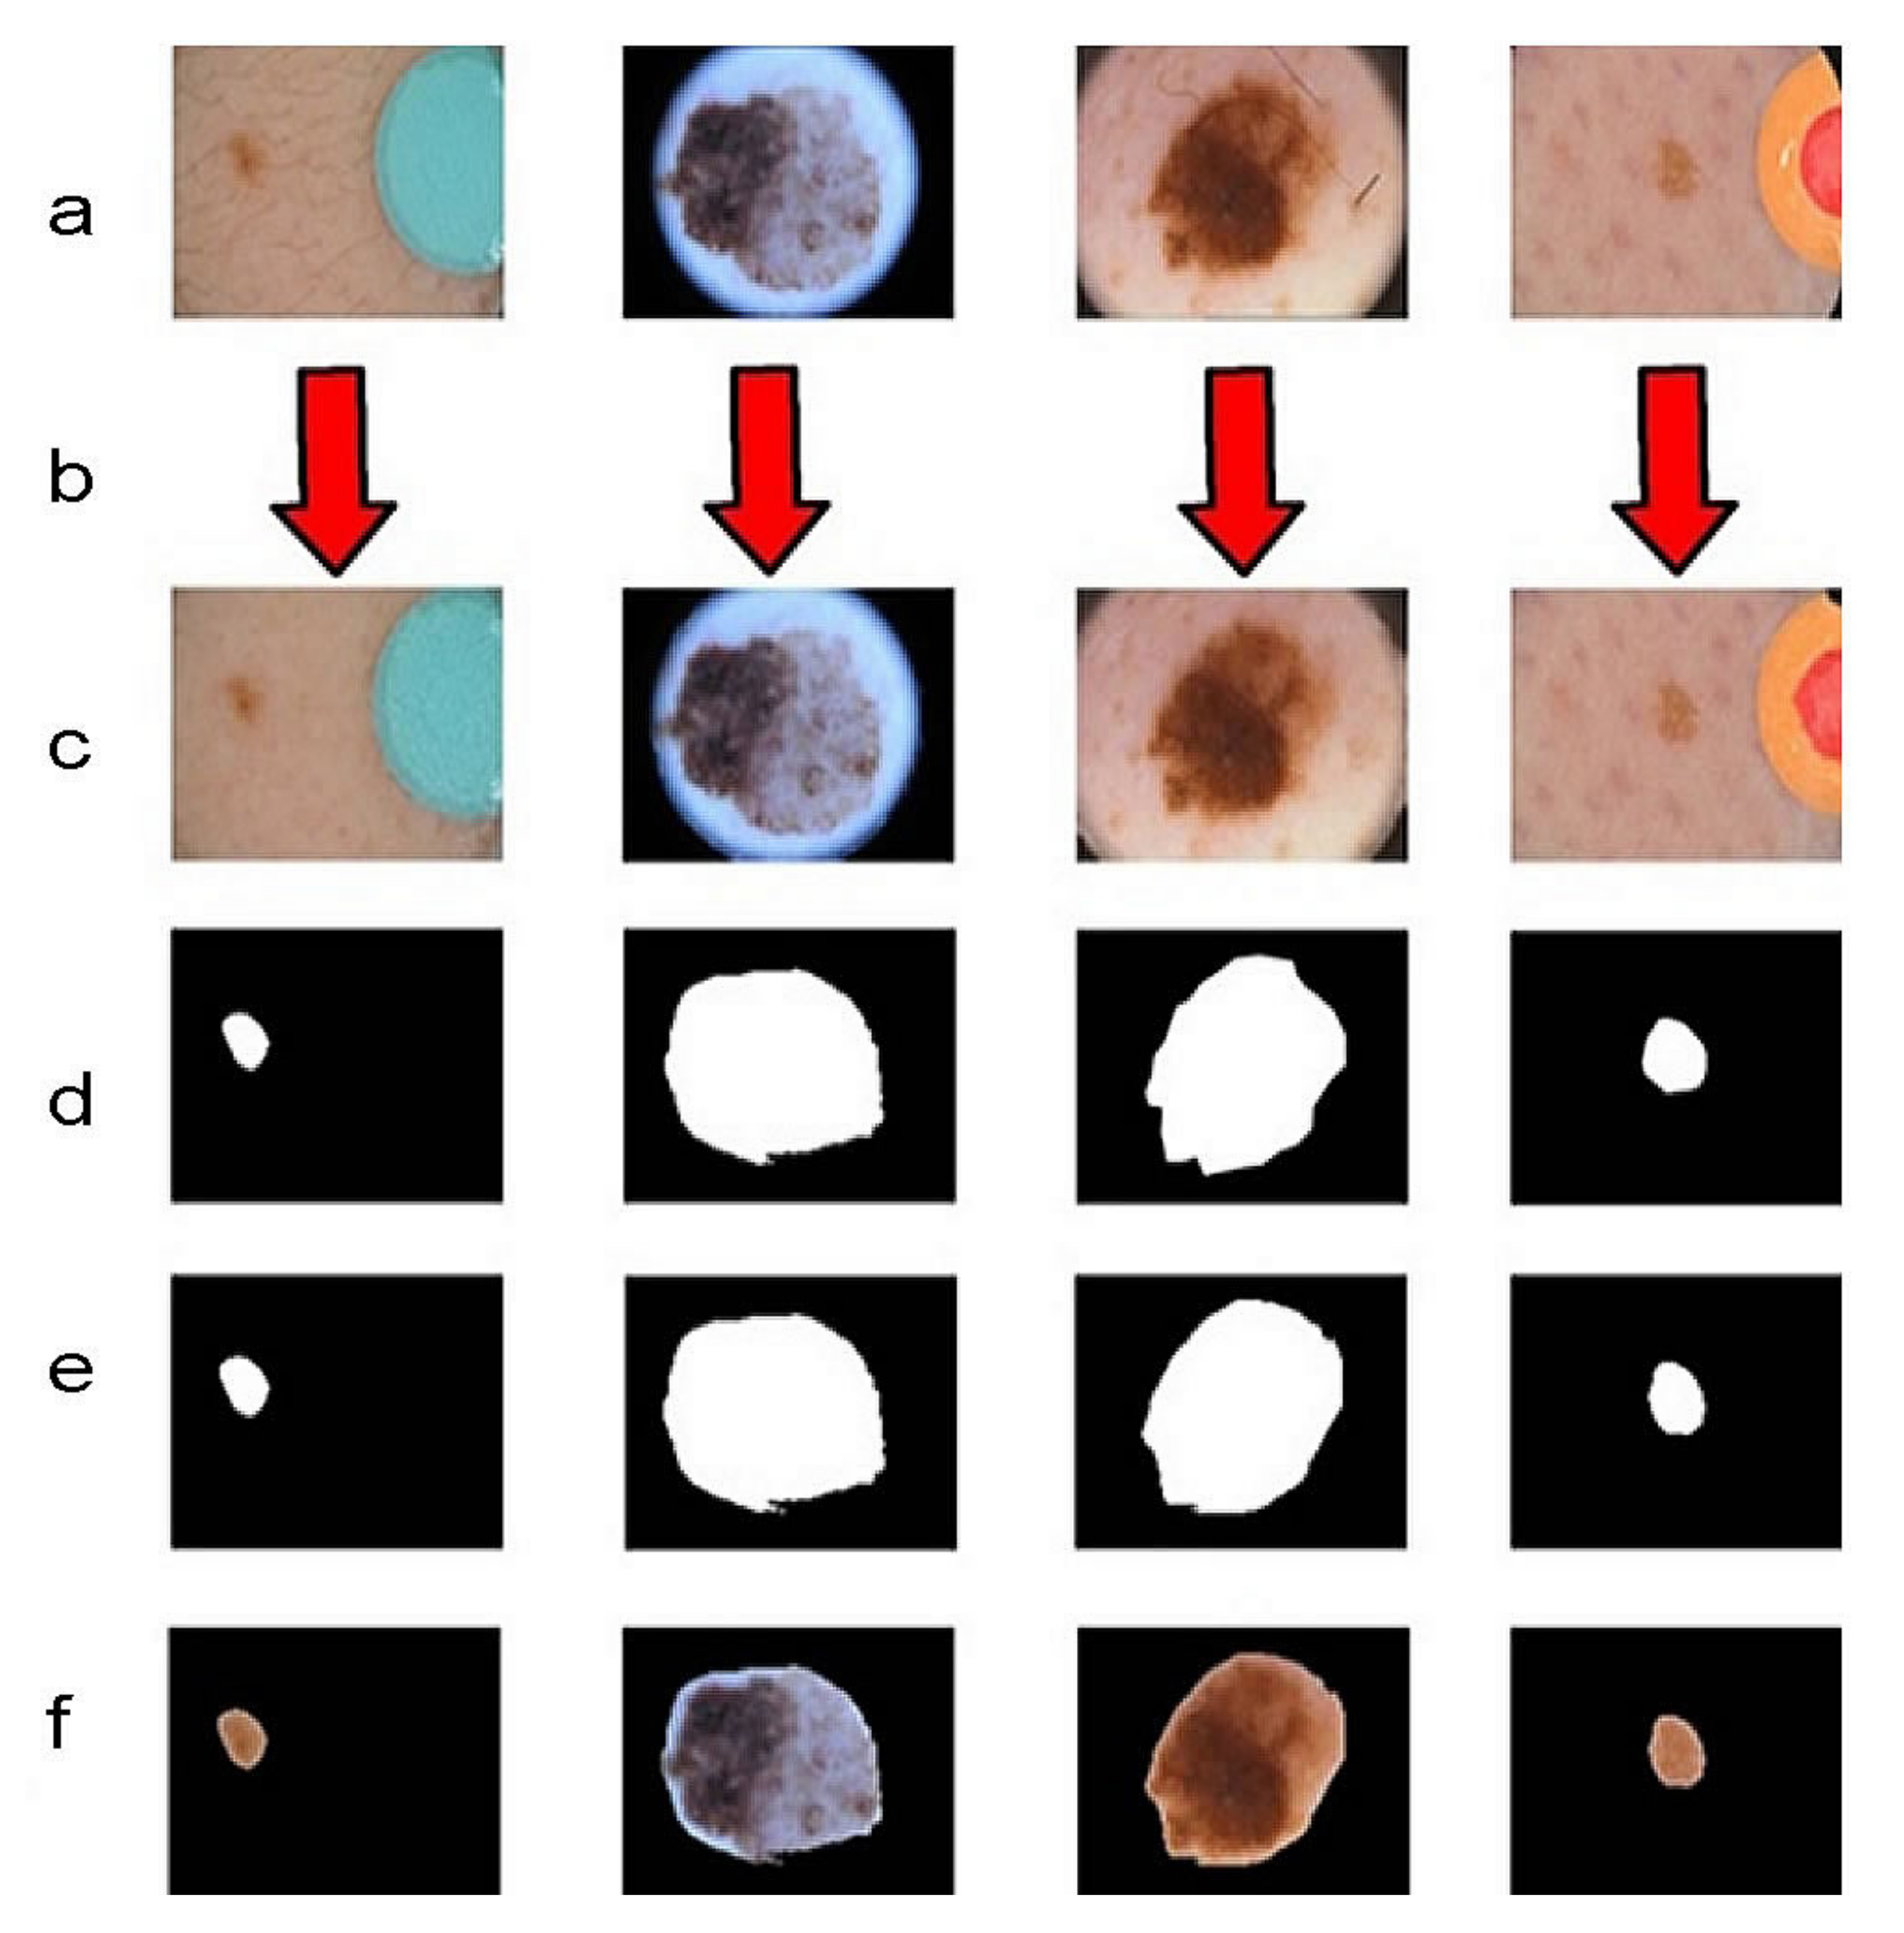
The second ISIC dataset (13,000 images in jpeg format and masks in png format) [36] and the PH2 dataset (200 images and masks in .bmp format) [
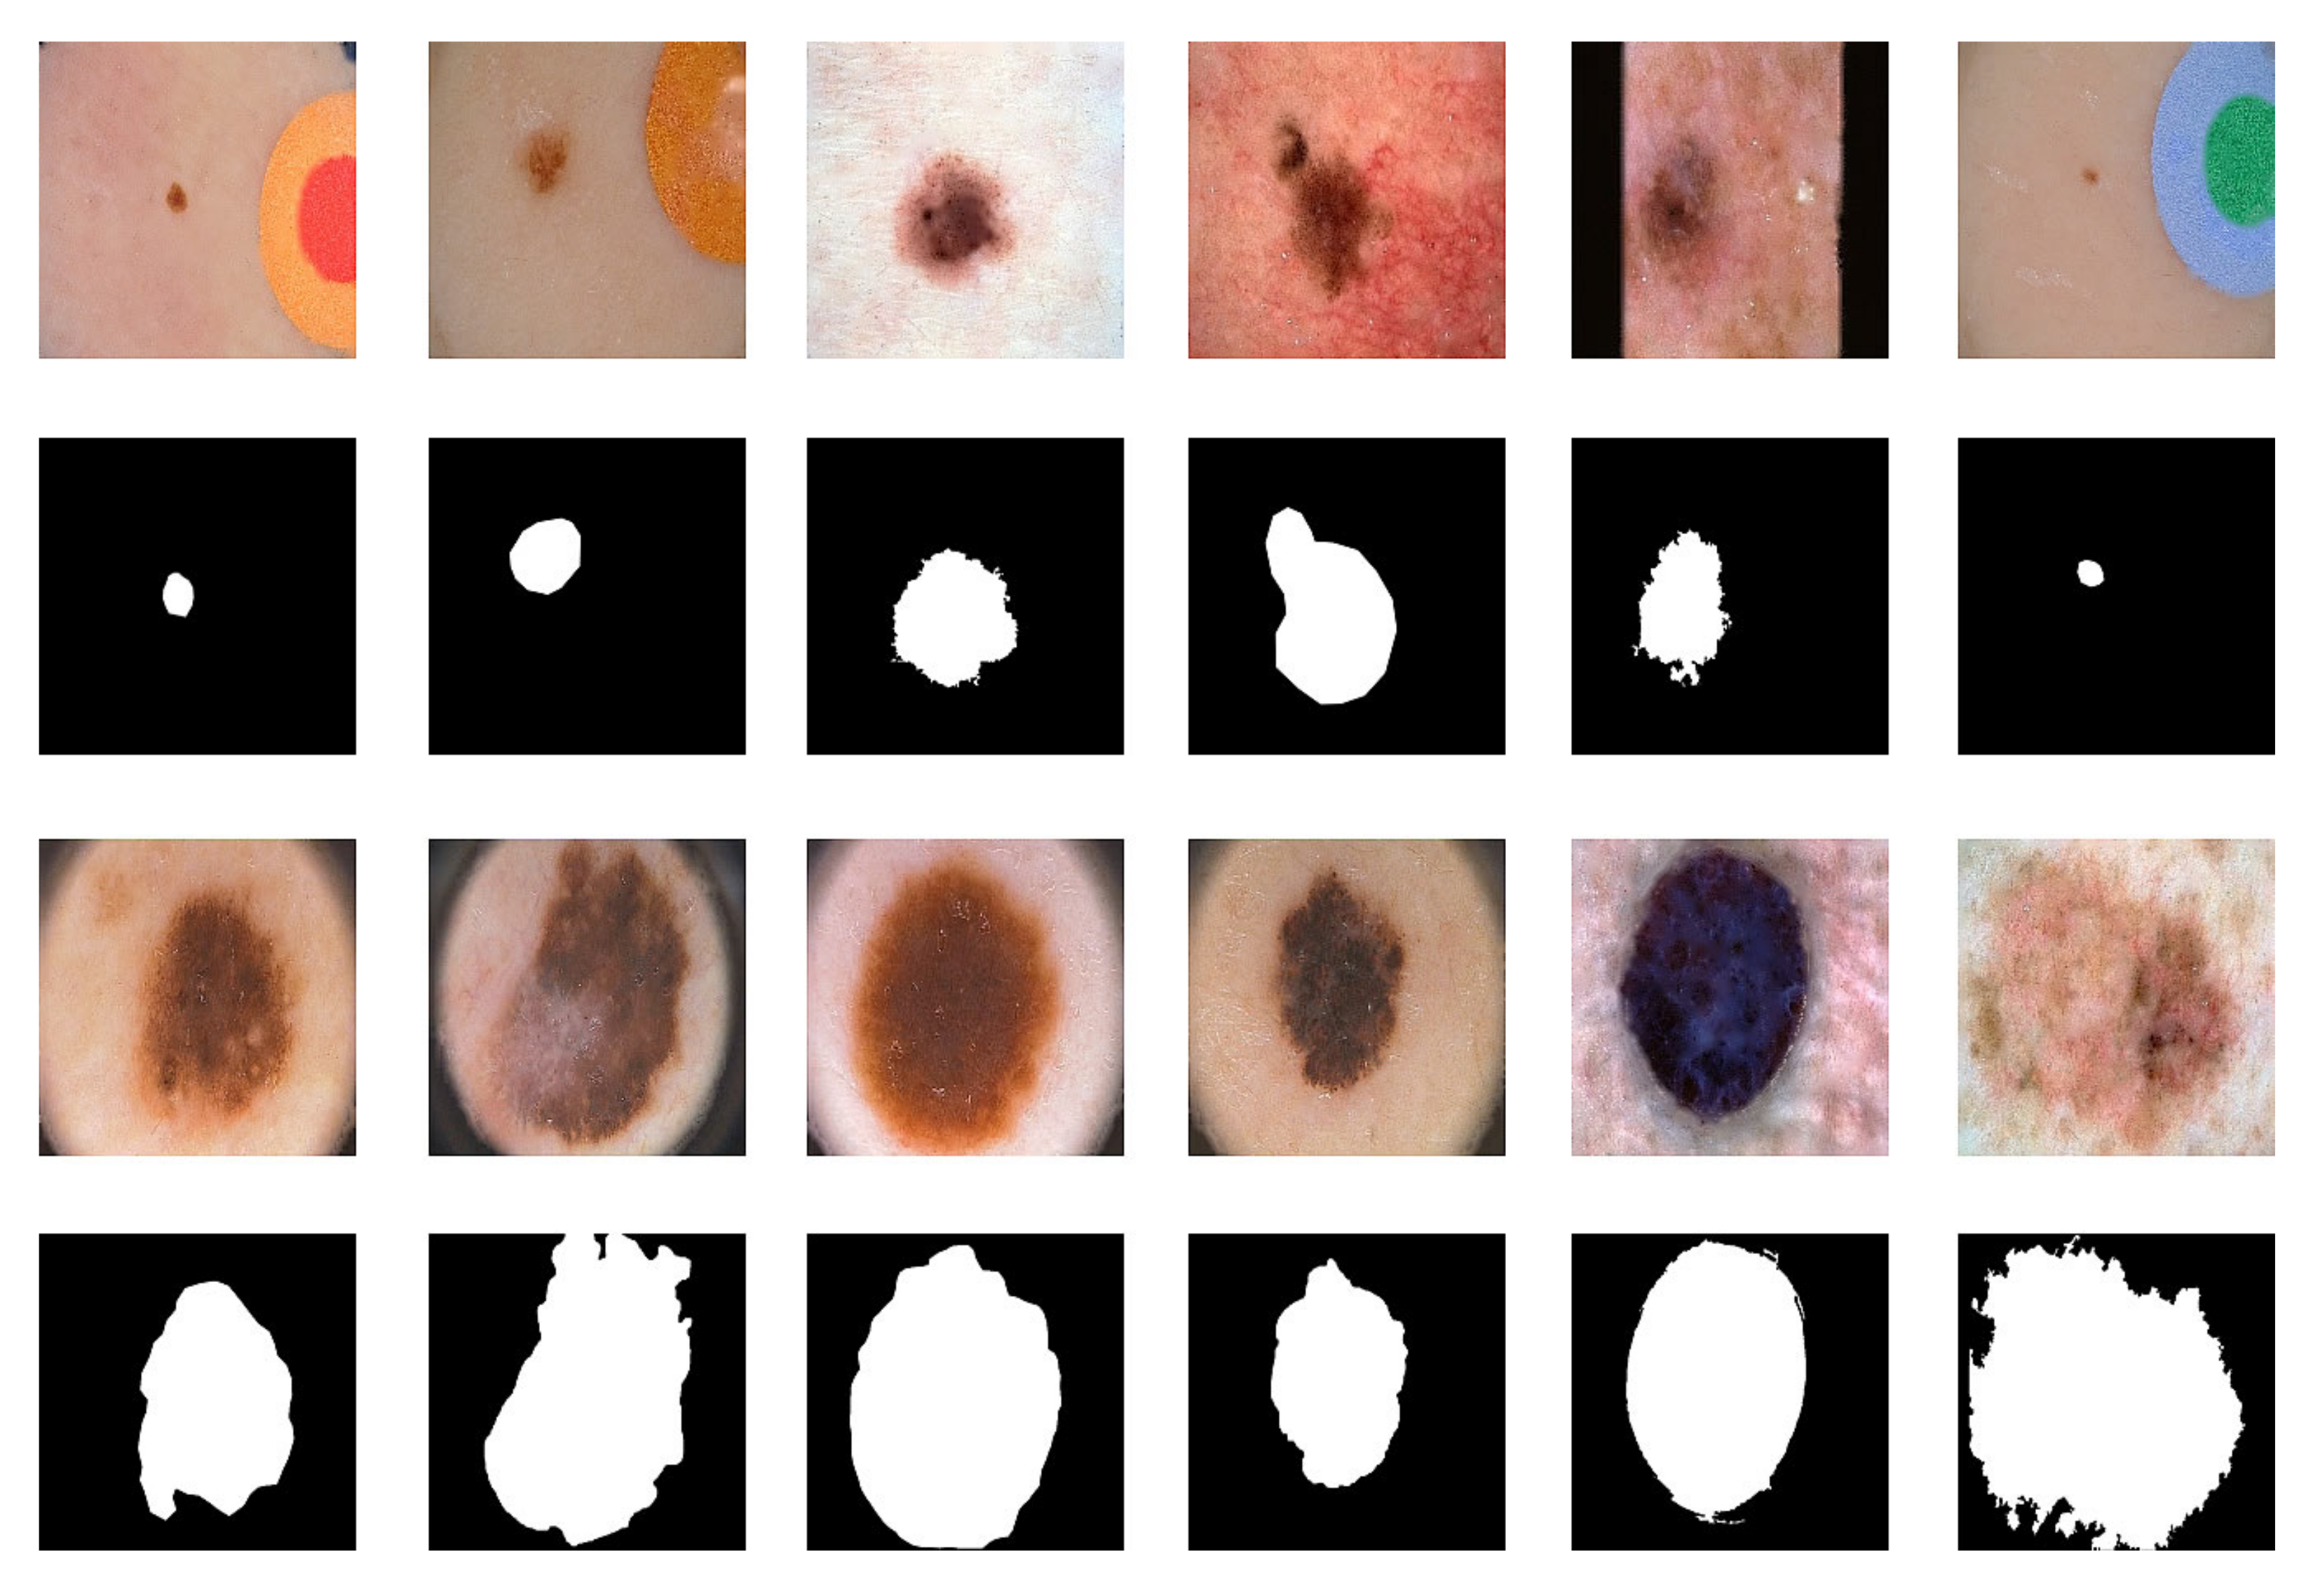
37] were used for lesion segmentation. The dataset was increased to 52,800 by data expansion. This dataset is now called the segmentation dataset. Figure 4 shows some examples of the segmentation dataset.

3.2. Data Augmentation and Dataset Slices

During the noise removal and lesion segmentation phases, the data were augmented to increase learning and prevent overfitting. Parameters:
• rescale = 1./255 • color_mode = ‘rgb’ • horizontal_flip = True • vertical_flip = True.
• width_shift_range = 0.1 • height_shift_range = 0.1.
We have divided all the images in the datasets into 16 slices (256 × 256 × 3). This allows us to use a total of 1024 × 1024 × 3 images as inputs. The cleanup dataset consists of 160,000 images, and the segmentation dataset consists of 844,800 images. Figure 5 shows examples of sliced images.

3.3. EfficientNet and ResNet

The basic building block of the EfficientNet architecture is Mobile Inverted Bottleneck Convolution (MBConv) [38] with a squeeze and excitation optimization. The concept of MBConv is shown in 
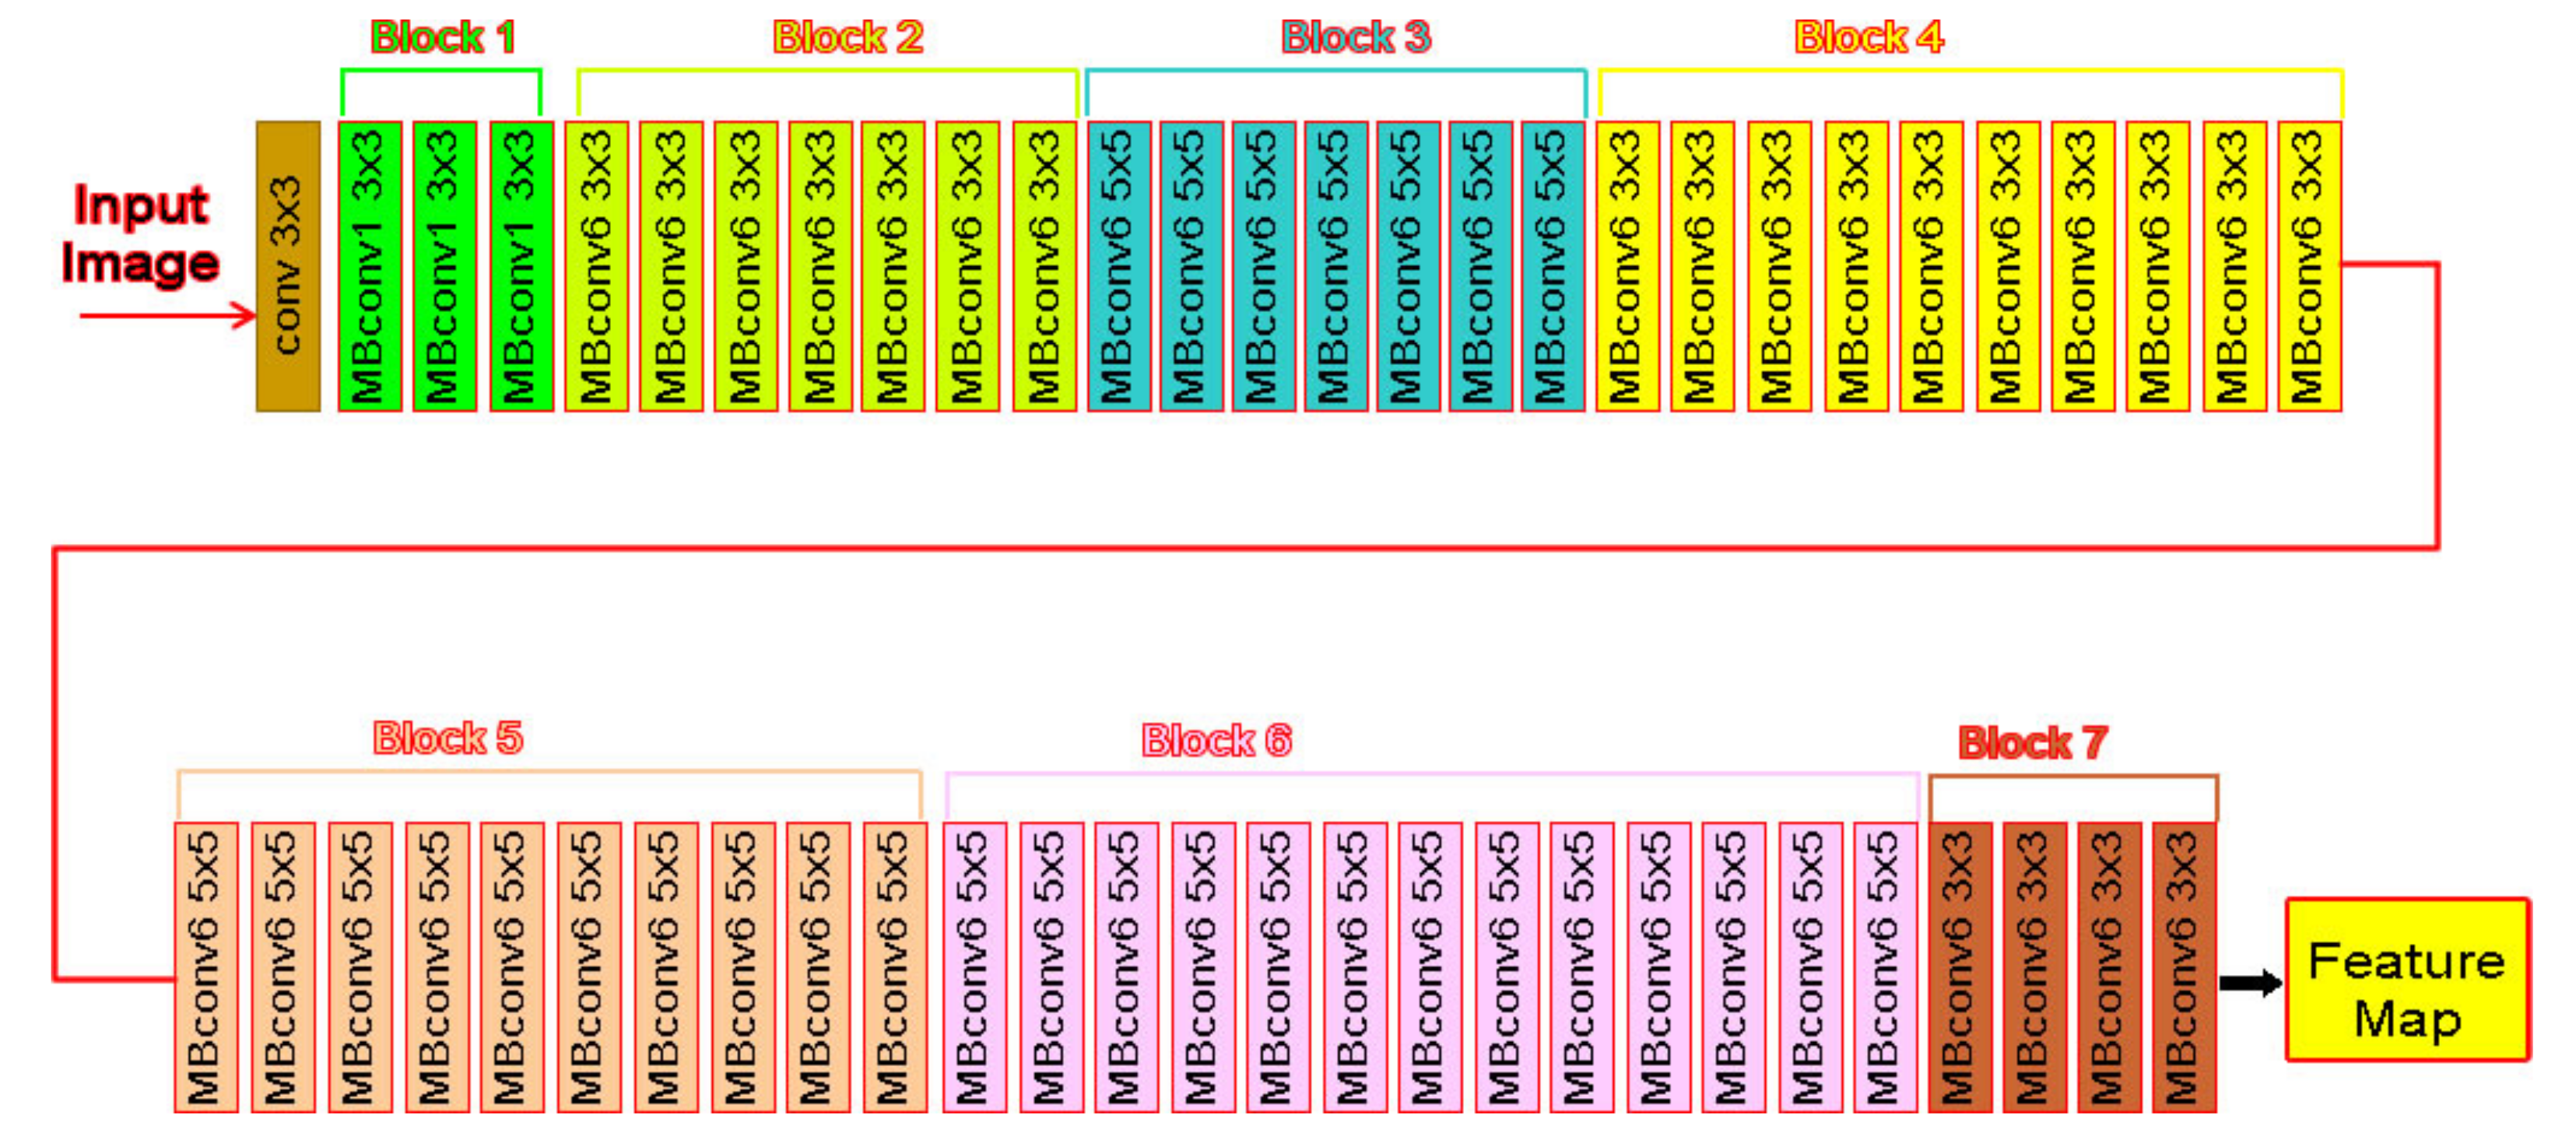
Figure 4. The family of EfficientNet networks has different numbers of these MBConv blocks. From EfficientNetB0 to EfficientNetB7, depth, width, resolution, and model size continue to increase, and the accuracy also improves. The best performing model, EfficientNetB7, outperforms previous state-of-the-art CNNs in terms of ImageNet accuracy and is also 8.4-fold smaller and 6.1-fold faster than the best existing CNN [21]. The network architecture of EfficientNetB7 is shown in Figure 6. It can be divided into seven blocks based on the filter size, striding, and a number of channels [23].
In semantic segmentation, each pixel of an image is labeled, and therefore the preservation of spatial information is of paramount importance [26]. EfficientNet is widely used in image classification and segmentation. For example, Chetoui et al. [39] used EfficientNet to achieve the best performance in work on diabetic retinopathy (DR). Kamble et al. [40] used EfficientNet as an encoder combined with UNet++ and achieved high accuracy in optic disk segmentation (OD). Messaoudi et al. [41] used EfficientNet to convert a 2D classification network into a 3D semantic segmentation of brain tumors, which also resulted in satisfactory performance [24]. The figure shows the architecture of EfficientNetB7.
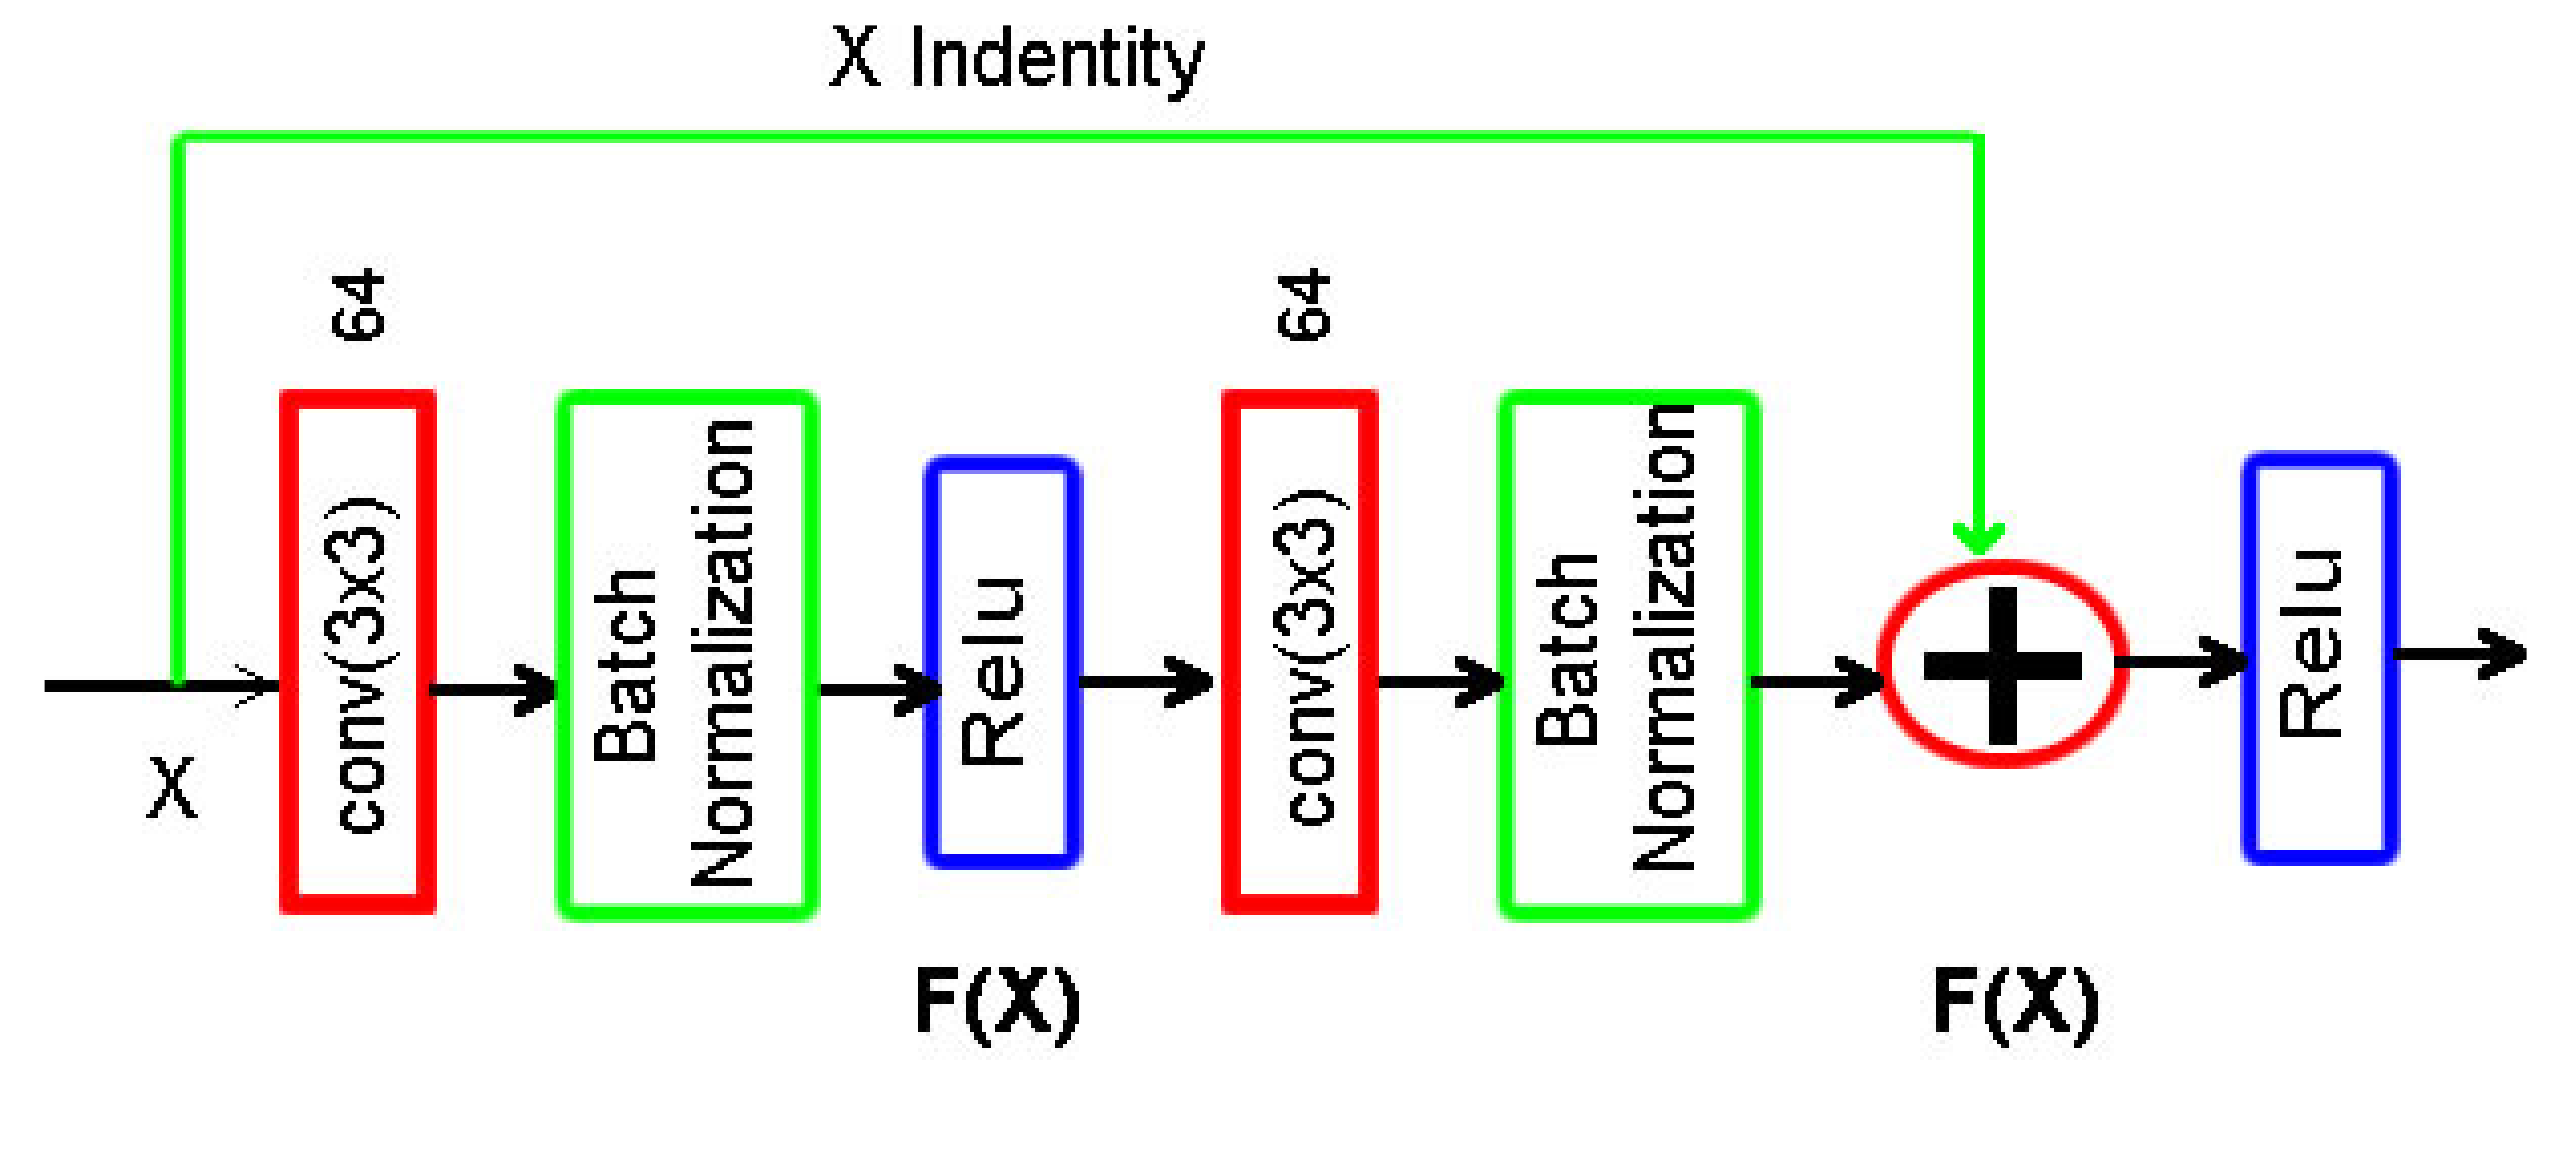
The formulation of F(x) + x can be realized by neural feedforward networks with “shortcut connections”. The ResNet architecture the network is shown in Figure 7. Shortcut connections are connections that skip one or more layers [42].

3.4. Proposed Model: LinkNet-B7

The optimizer was determined to be Adam. Sigmoid was used as the output function. The activation function for the output is usually chosen as a sigmoid function when there are two potential output classes [43]. The parameters are given in Table 1.
There are four encoder blocks and four decoder blocks [29]. LinkNet was chosen because of its high accuracy and low epoch time in medical image segmentation [30]. We used EfficientNetB7 as the encoder. This is because it has higher accuracy and parameter count than other types [
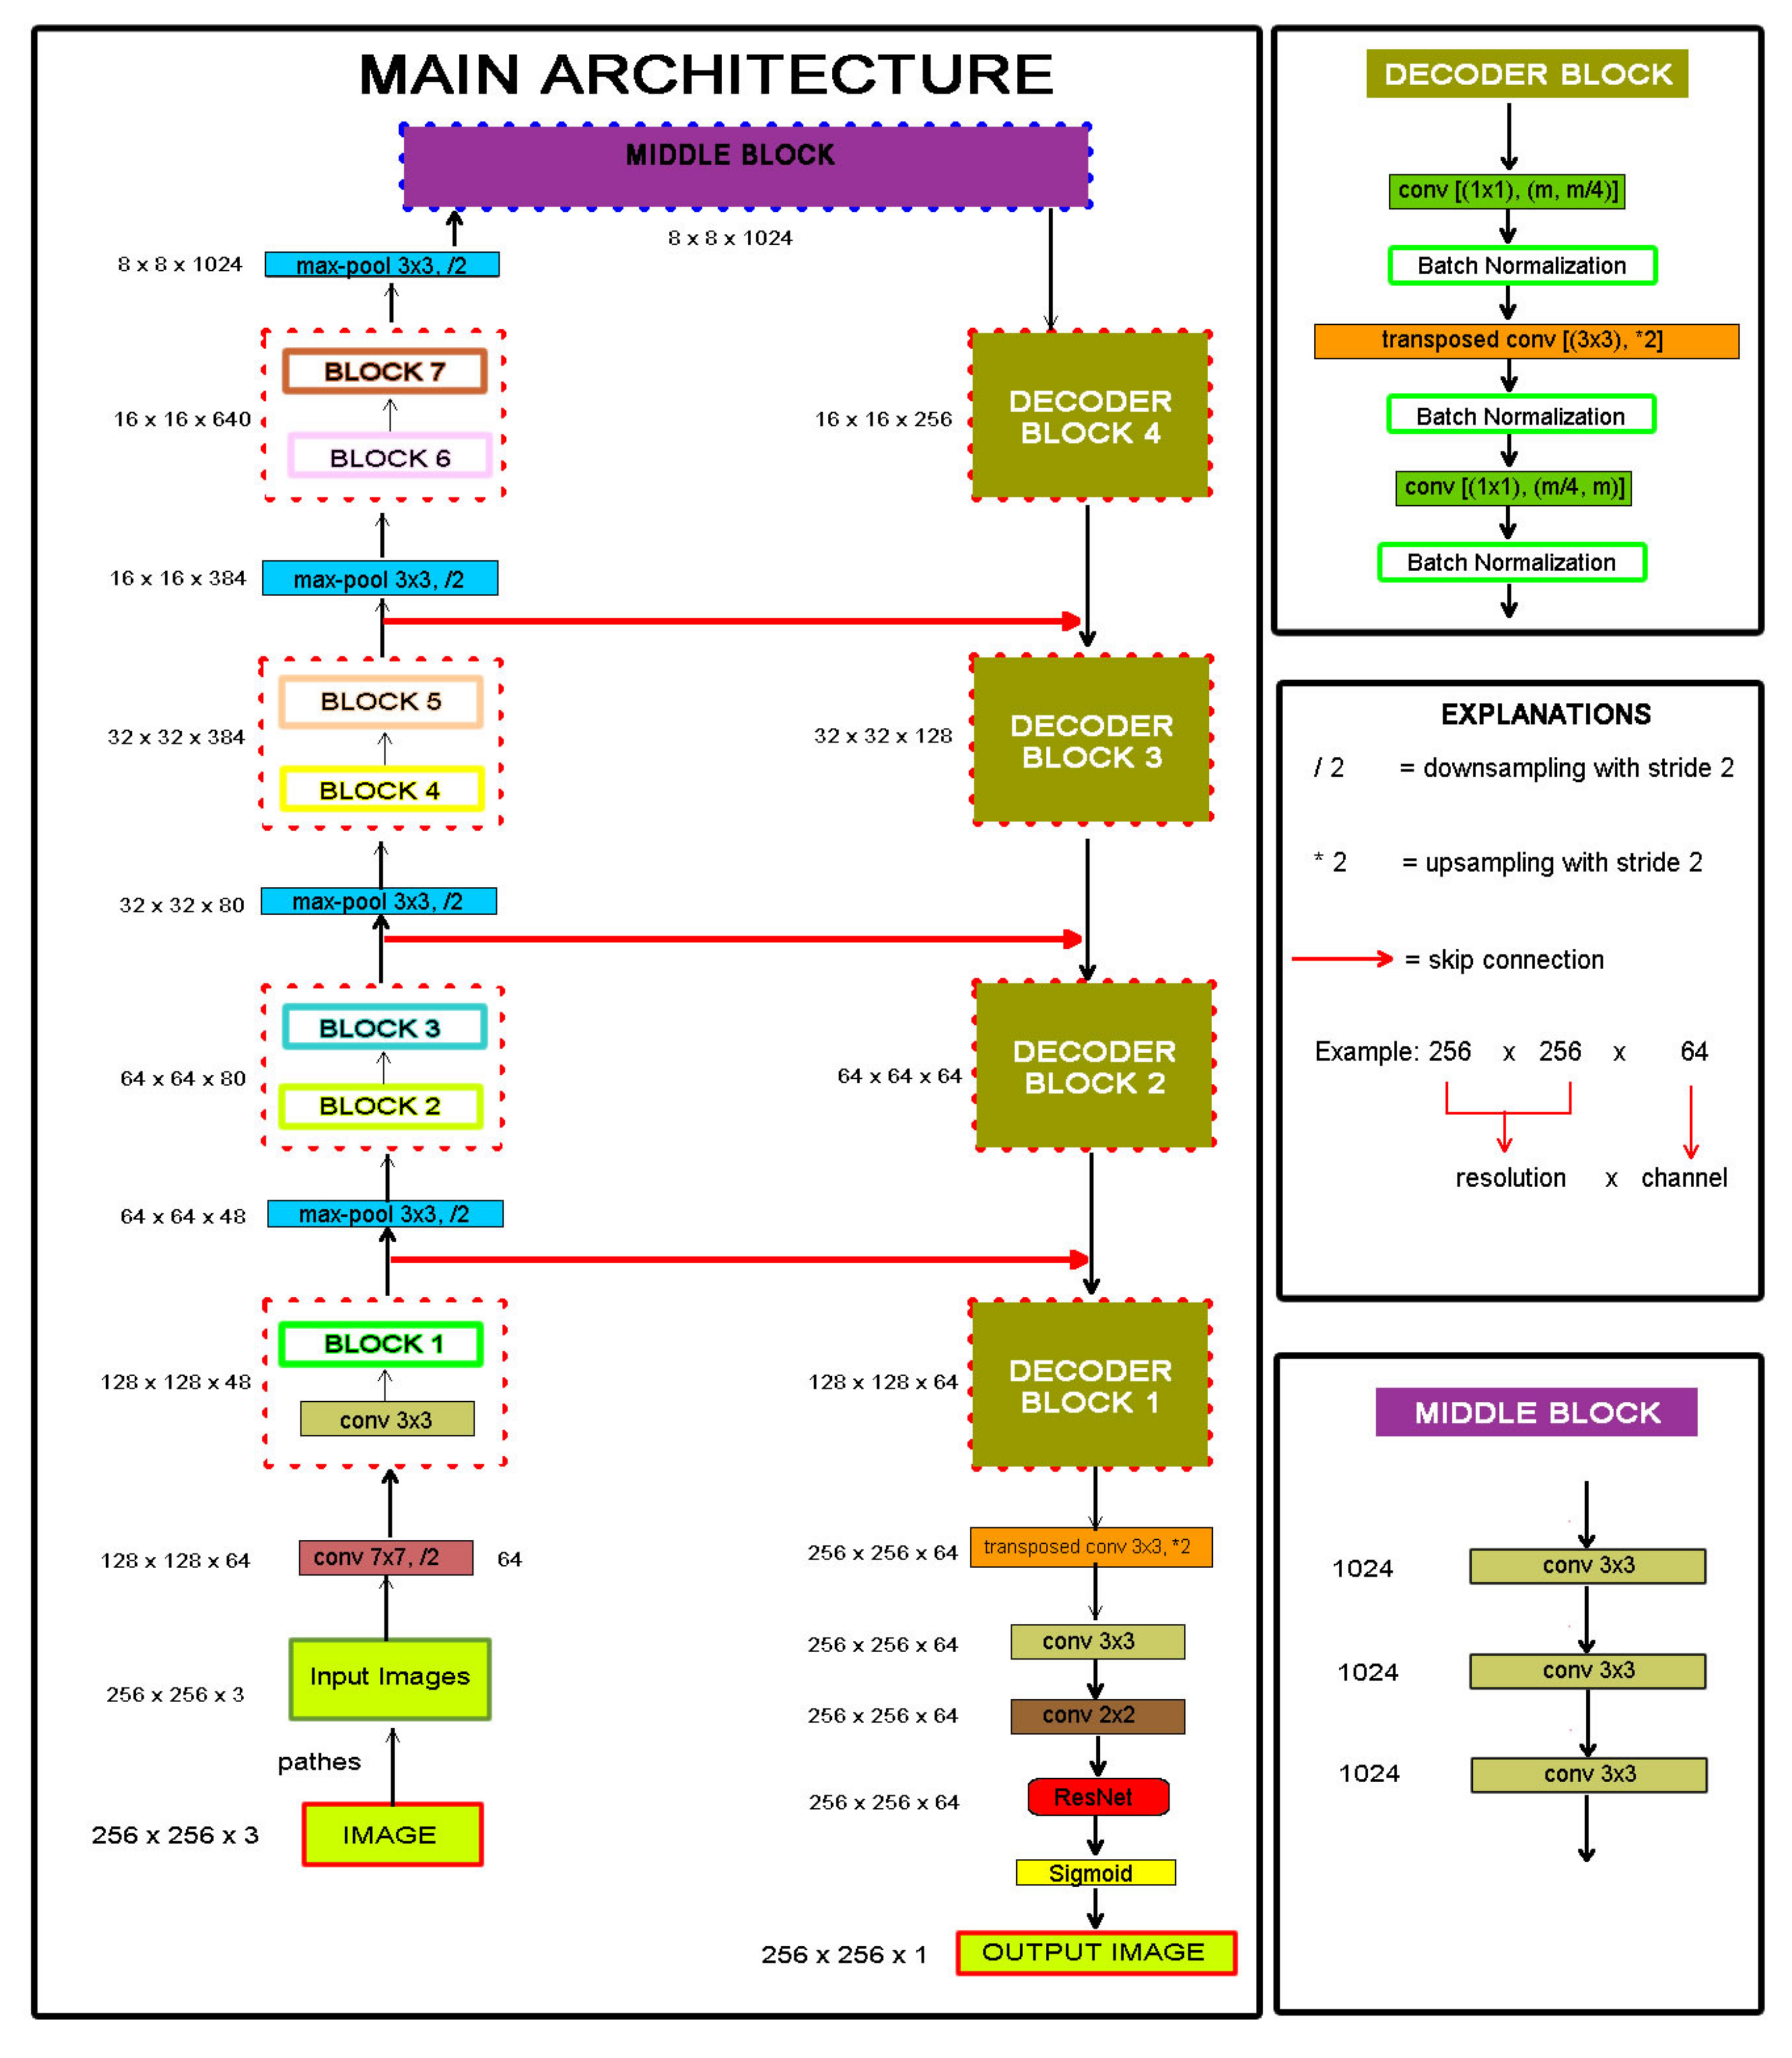
30]. We proposed a LinkNet-based deep learning algorithm called LinkNet-B7 with input size 256 × 256 × 3 and EfficentNetB7 as the encoder. Table 2 shows the structure of the encoder.
We added a single ResNet block to our model before the last layer, because other ResNet models have more layers which increases the epoch time and slows down the model. Moreover, we used a middle block before the decoder blocks. This way we could obtain more features before the decoder blocks and thus improve the accuracy.
Finally, we used a modified hybrid model called LinkNet-B7. The first block of the model performs a convolution of the input image using a kernel of size 7 × 7 with a stride of 2. A max-pooling layer follows this with a stride of 2. The model is shown in Figure 8.

3.5. Parameters

• Dice coefficient: This metric is computed by comparing the pixel-wise correspondence between the ground truth Y and the corresponding predicted segmentation X [44]. The format of an equation should be as follows:
D i c e c o e f f i c i e n t = ( 2 | X Y | ) / ( | X | + | Y | )
• Loss function: In this study, MSE (mean squared error) is a loss function for both phases. MSE is the sum of the squared distances between our target variable and the predicted values [45].
• Optimizer: We choose the Adam optimizer in the Keras library. The Adam optimizer is a stochastic gradient descent method [46].
• mIoU (Intersection Over Union): This measure gives the similarity between the predicted region and the actual region for an object present in the image [47]. We have used mean IoU in the Keras library. TP: True Positive, FP: False Positive, FN: False Negative.
The format of an equation should be as follows:
m I o U = T P / ( F P + T P + F N )

3.6. Noise Removal Phase

• Step 1: The cleanup dataset is divided into 112,000 training, 32,000 validation, and 16,000 test datasets.
• Step 2: The model has been trained for 5000 epochs.
• Step 3: Make predictions with the model.
• Step 4: Postprocess: Remove noise from the results using median filter and morphological operations (opening, closing). During postprocessing, the noise was removed from the image using the mask estimated by the INPAINT function.

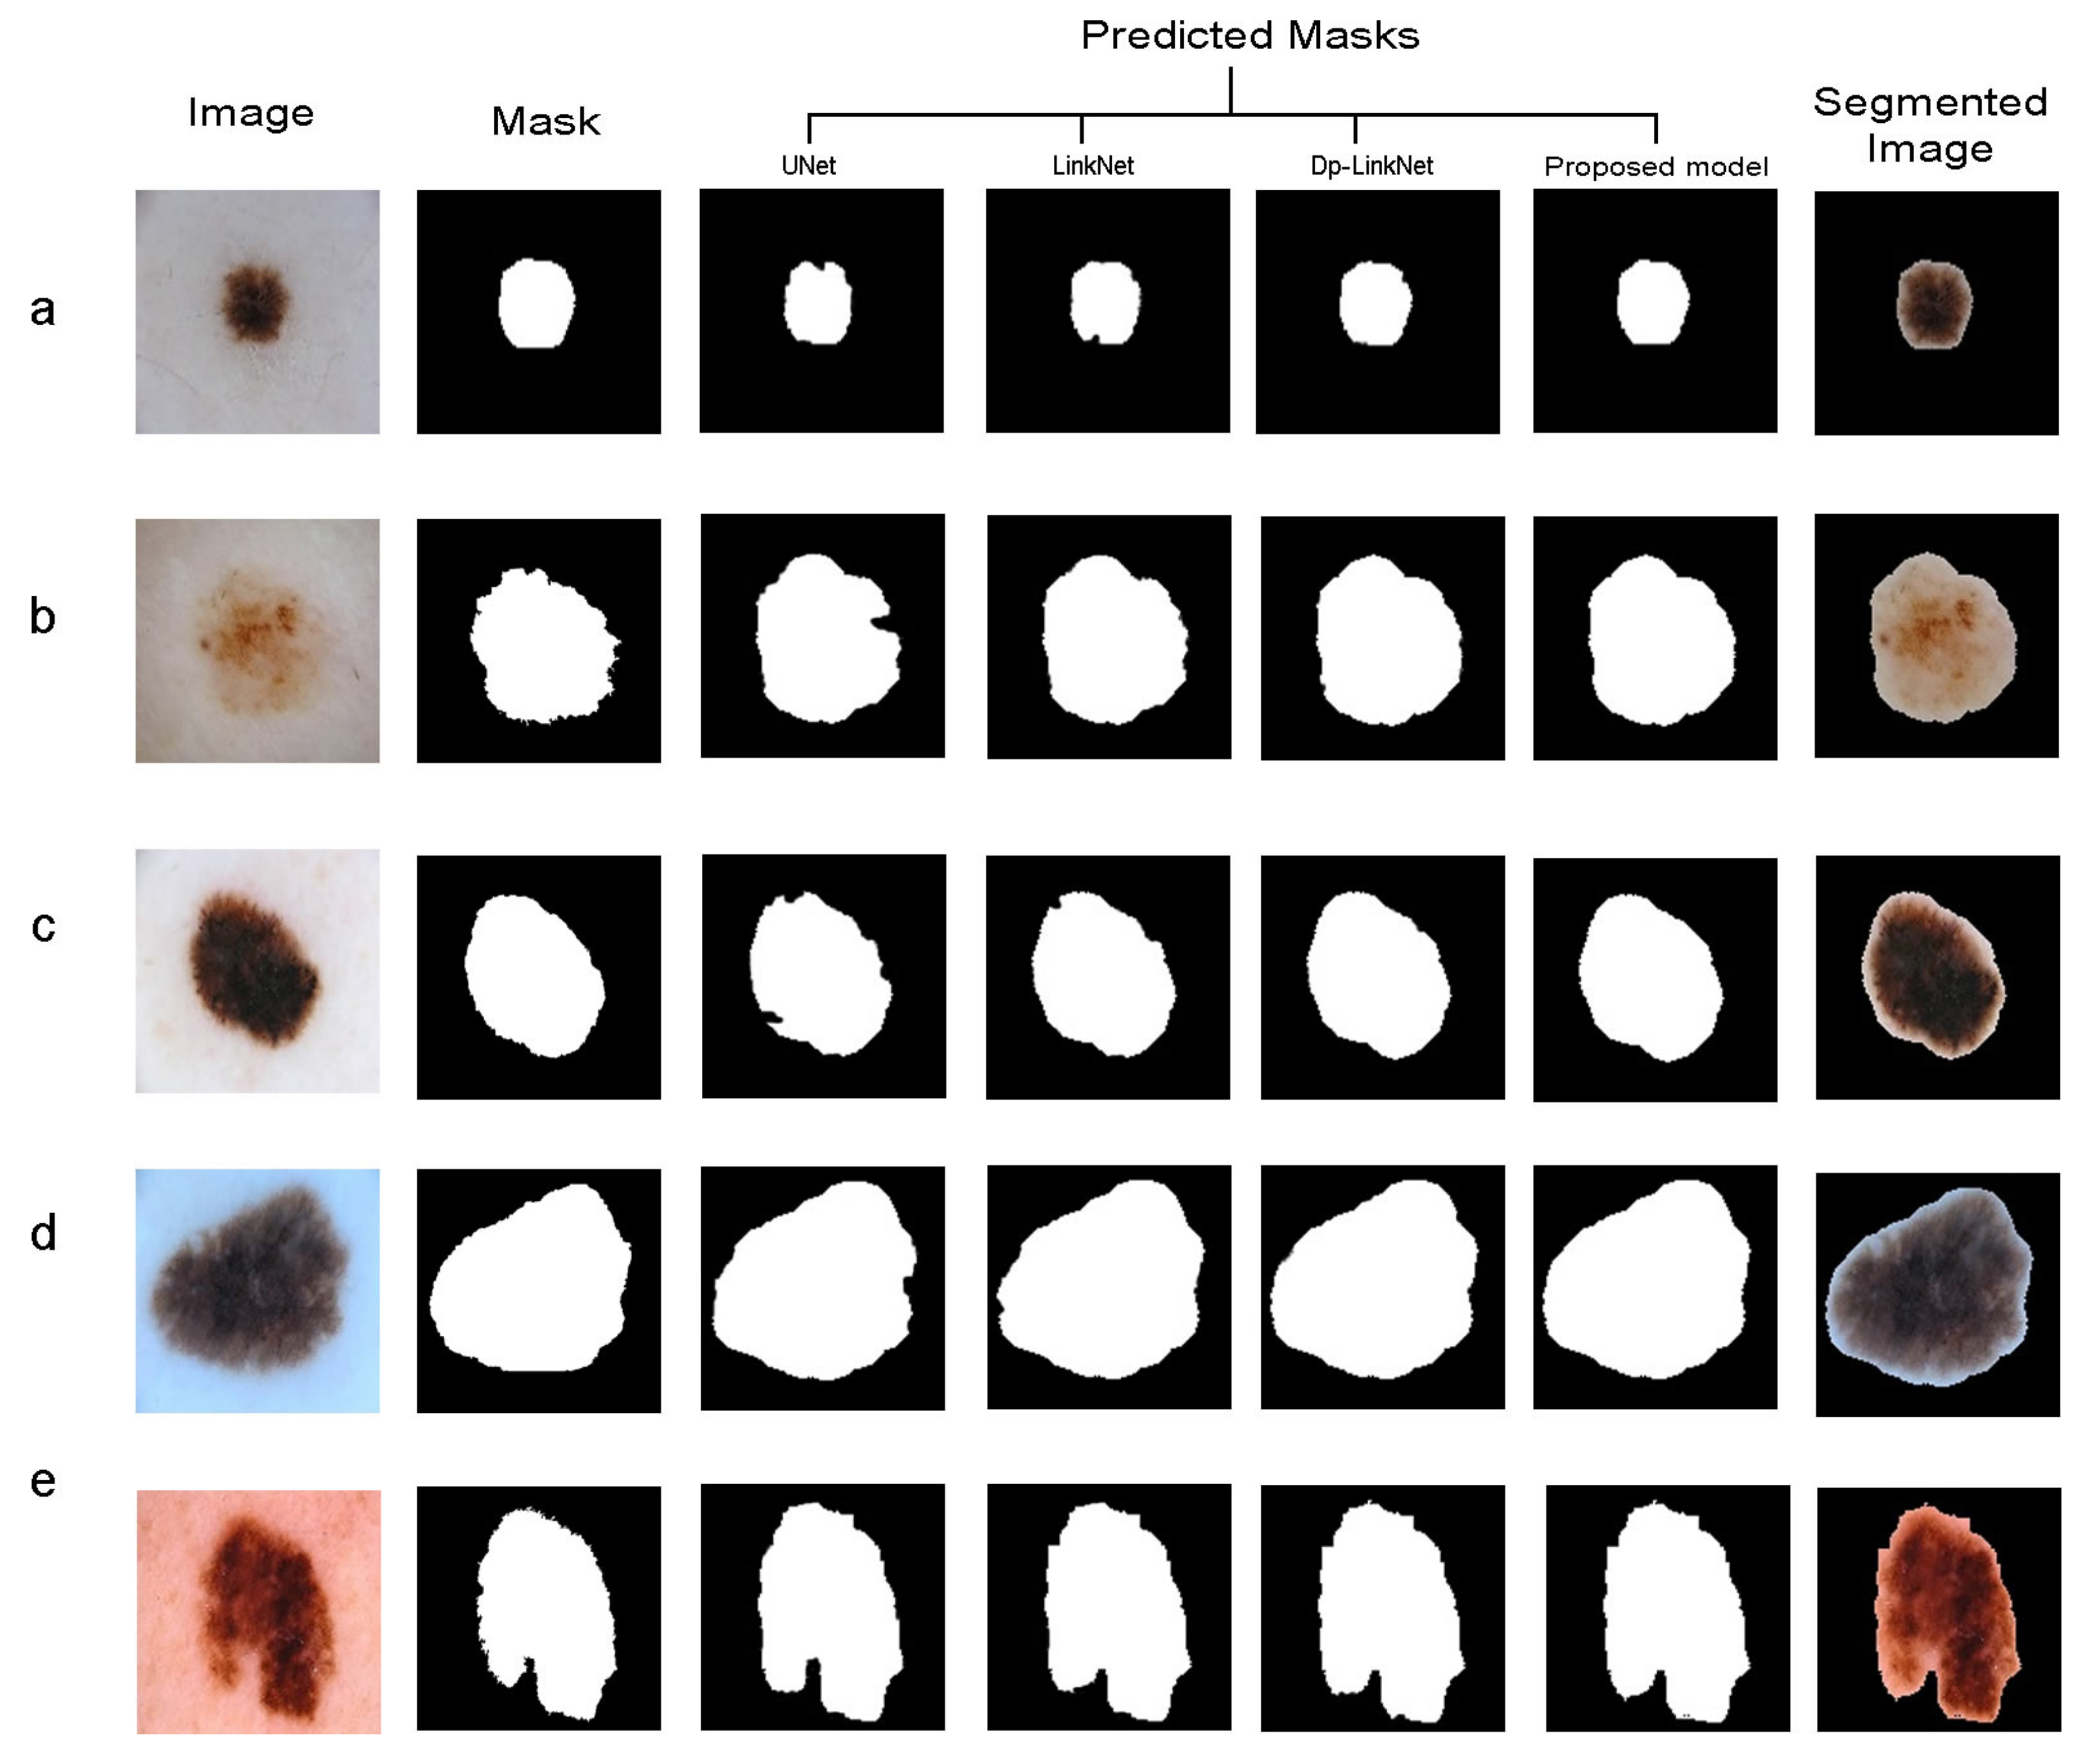
3.7. Lesion Segmentation Phase

The noise in the dataset was removed using the model created in the previous step. The training accuracy of nearly 2% increases with the dataset that has been cleared of noise.
• Step 1: The segmentation dataset is divided into 591,360 training, 168,960 validation, and 84,480 datasets.
• Step 2: The model has been trained for 5000 epochs.
• Step 3: Make predictions with the model.
• Step 4: Postprocess: Remove noise from the results using median filter and morphological operations (opening, closing).

4. Results

In the noise removal and the lesion segmentation phases, we tested the proposed model with the dataset described in Section 3.1 and obtained a dice coefficient of 0.9572 and 0.9670, respectively. Four models were run with the same parameters and data set. The results obtained at this phase are shown in Table 3 and Table 4.
Figure 9 and Figure 10 show the results of the noise removal and the lesion segmentation phases using different models. LinkNet-B7 was more successful than other models (images (a, b, c, d, e)). We applied a median filter and opening and closing morphological functions to each of the predicted images.
The study by Wei et al. [16] is similar to our study. They created hair mask datasets (306 images and masks using the ISIC 2018). However, they did not mention other noises like water bubbles or ink blots. They used 306 images and masks in the hair removal phase, and 2594 images and masks in the segmentation phase. We do not know exactly which images they used. For this reason, we used only the same number of images belonging to the ISIC 2018. The results of the methods for compressing the hair removal and lesion segmentation phases during training can be seen in Table 5.
We compared LinkNet-B7 in lesion segmentation with other studies. The results of the methods for compressing the lesion segmentation phase in training can be seen in Table 6 and Table 7. We achieved the highest dice accuracy among the other models.

5. Conclusions

In this study, we proposed a new LinkNet-B7 model using the superior features of the existing LinkNet and EfficientNet models. We tested UNet, LinkNet, Dp-Link, and the proposed model (LinkNet-B7) on the same dataset in the stages of noise removal and lesion segmentation. The results showed that the LinkNet-B7 model provided more successful results in noise removal and lesion segmentation in skin cancer images than other LinkNet models. We also compared our model with the others.
• In the literature, the highest resolution is usually 512 × 512 × 3, so if the images have a higher resolution than the input size, the images will lose pixel values. We divided the images into 16 slices (256 × 256 × 3) to minimize data loss. As a result, we can use a total image size of 1024 × 1024 × 3 as input. By using slices and data expansion, we were able to increase the training accuracy by almost 3%.
• In the noise removal phase, our model removed hair and water bubbles, ink spots, and ruler marks in lesion images. There is no such dataset in the literature (only hair masks). Thus, we were able to remove these noises from lesion images before training lesion segmentation.
• Some images have a black frame and patch noises. In the segmentation phase, these noises were eliminated. Thus, our segmentation results were completely removed from the noise. Figure 11 (images (a), noise removal (b), cleaned images (c), mask (d), predicted mask (e), and segmented image (f)) shows the results obtained with our model.

Author Contributions

Conceptualization, C.A. and N.A.; methodology, C.A.; software, C.A.; validation, C.A., N.A.; writing—original draft preparation, C.A.; writing—review and editing, C.A. and N.A.; visualization, N.A. All authors have read and agreed to the published version of the manuscript.

Funding

This research received no external funding.

Institutional Review Board Statement

Not applicable.

Informed Consent Statement

Not applicable.

Data Availability Statement

ISIC datasets that were used in this study are available at https://challenge2018.isic-archive.com/ accessed on 23 January 2022. And PH2 dataset that was used in this study are available at https://www.fc.up.pt/addi/PH2{%}20database.html accessed on 23 January 2022.

Conflicts of Interest

The authors declare no conflict of interest.

References

  1. Baykara, O.T. Current Modalities in Treatment of Cancer. Balıkesir Health Sci. J. 2016, 5, 154–165. [Google Scholar] [CrossRef]
  2. WHO. Available online: https://www.who.int/news-room/fact-sheets/detail/cancer (accessed on 20 December 2021).
  3. Siegel, R.L.; Miller, K.D.; Jemal, A. Cancer statistics. CA Cancer J. Clin. 2021, 71, 7–33. [Google Scholar] [CrossRef]
  4. Unver, H.M.; Ayan, E. Skin Lesion Segmentation in Dermoscopic Images with Combination of YOLO and GrabCut Algorithm. Diagn. J. 2019, 9, 1–21. [Google Scholar]
  5. McNoe, B.M.; Morgaine, K.C.; Reeder, A.I. Effectiveness of Sun Protection In-terventions Delivered to Adolescents in a Secondary School Setting: A Systematic Review. Hindawi J. Skin Cancer 2021, 2021, 1–15. [Google Scholar] [CrossRef] [PubMed]
  6. Alom, M.Z.; Aspiras, T.; Taha, T.M.; Asari, V.K. Skin Cancer Segmentation and Classification with NABLA-N and Inception Recurrent Residual Convolutional Networks. arXiv 2019, arXiv:1904.11126. Available online: https://arxiv.org/ftp/arxiv/papers/1904/1904.11126.pdf (accessed on 8 December 2021).
  7. Kadampur, M.A.; Riyaee, S.A. Skin cancer detection: Applying a deep learning based model driven architecture in the cloud for classifying dermal cell images. Inform. Med. Unlocked J. 2020, 18, 1–6. [Google Scholar] [CrossRef]
  8. Senan, M.; Jadhav, M. Classification of Dermoscopy Images for Early Detection of Skin Cancer—A Review. Int. J. Comput. Appl. 2019, 178, 37–43. [Google Scholar]
  9. Mehta, P.; Shah, B. Review on Techniques and Steps of Computer Aided Skin Cancer Diagnosis. Procedia Comput. Sci. 2016, 85, 309–316. Available online: https://www.sciencedirect.com/science/article/pii/S1877050916305865 (accessed on 2 January 2021). [CrossRef] [Green Version]
  10. Xua, L.; Jackowskia, M.; Goshtasbya, A.; Rosemanb, D.; Binesb, S.; Yuc, C.; Dhawand, A.; Huntleye, A. Segmentation of Skin Cancer Images. Image Vis. Comput. 1999, 178, 65–74. [Google Scholar] [CrossRef]
  11. Gillmann, C.; Saur, D. How to deal with Uncertainty in Machine Learning for Medical Imaging? In Proceedings of the TREX 2021: Workshop on TRust and EXpertise in Visual Analytics, New Orleans, LA, USA, 24–29 October 2021. [Google Scholar]
  12. Gillmann, C.; Saur, D.A.; Wischgoll, T.; Scheuermann, G. Uncertainty-aware Visualization in Medical Imaging—A Survey. EUROVIS 2021, 40, 665–689. [Google Scholar] [CrossRef]
  13. Lee, T.; Ng, V.; Gallagher, R.; Coldman, A.; McLean, D. Dullrazor: A Software Approach to Hair Removal from Images. Comput. Biol. Med. 1997, 27, 533–543. [Google Scholar] [CrossRef]
  14. Ali, K.; Shaikh, Z.A.; Khana, A.A.; Laghari, A.A. Multiclass skin cancer classification using EfficientNets—A first step towards preventing skin cancer. Artif. Intell. Brain Inform. 2022, 2, 1–10. [Google Scholar] [CrossRef]
  15. Cassidya, B.; Kendricka, C.; Brodzicki, A.; Jaworek-Korjakowska, J.; Yapa, M.H. Analysis of the ISIC image datasets: Usage benchmarks and recommendations. Med. Image Anal. 2022, 75, 1–15. [Google Scholar] [CrossRef] [PubMed]
  16. Wei, L.; Alex, N.J.R.; Tardi, T.; Zhemin, Z. Digital hair removal by deep learning for skin lesion segmentation. Pattern Recognit. 2021, 117, 1–15. [Google Scholar]
  17. Zafar, K.; Gilani, S.O.; Waris, A.; Ahmed, A.; Jamil, M.; Khan, M.N.; Kashif, A.S. Skin Lesion Segmentation from Dermoscopic Images Using Convolutional Neural Network. Sens. J. 2020, 20, 1601. [Google Scholar] [CrossRef] [PubMed] [Green Version]
  18. Zhang, G.; Shen, X.; Chen, S.; Liang, L.; Luo, Y.; Yu, J.; Lu, J. DSM: A Deep Supervised Multi-Scale Network Learning for Skin Cancer Segmentation. IEEE Access 2016, 7, 1–10. [Google Scholar] [CrossRef]
  19. Hasan, K.; Dahal, L.; Samarakoon, P.N.; Tushara, F.I.; Marti, R. DSNet: Automatic Dermoscopic Skin Lesion Segmentation. Comput. Biol. Med. 2020, 120, 426–434. [Google Scholar] [CrossRef] [Green Version]
  20. Akyel, C.; Arıcı, N. A New Approach to Hair Noise cleaning and Lesion Segmentation in Images of Skin Cancer. J. Polytech. 2020, 23, 821–828. [Google Scholar]
  21. Mingxing, T.; Quoc, V.L. EfficientNet: Rethinking Model Scaling for Convolutional Neural Networks. In Proceedings of the 36th International Conference on Machine Learning, Long Beach, CA, USA, 9–15 June 2019. [Google Scholar]
  22. Phan, T.; Kim, S.; Yang, H.; Lee, G. Skin Lesion Segmentation by U-Net with Adaptive Skip Connection and Structural Awareness. Appl. Sci. 2021, 11, 4528. [Google Scholar] [CrossRef]
  23. Baheti, B.; Innani, S.; Gajre, S.; Talbar, S. Eff-UNet: A Novel Architecture for Semantic Segmentation in Unstructured Environment. In Proceedings of the 2020 IEEE/CVF Conference on Computer Vision and Pattern Recognition Workshops (CVPRW), Seattle, WA, USA, 14–19 June 2020. [Google Scholar]
  24. Wang, J.; Zhang, X.; Lv, P.; Zhou, L.; Wang, H. EAR-U-Net: EfficientNet and attention-based residual U-Net for automatic liver segmentation in CT. arXiv 2021, arXiv:2110.01014. Available online: https://arxiv.org/abs/2110.01014 (accessed on 18 November 2021).
  25. Talavera-Martínez, L.; Bibiloni, P.; González-Hidalgo, M. Hair Segmentation and Removal in Dermoscopic Images Using Deep Learning. IEEE Access 2021, 9, 2694–2704. [Google Scholar] [CrossRef]
  26. Chaurasia, A.; Culurciello, E. LinkNet: Exploiting The encoder Representations for Efficient Semantic Segmentation. In Proceedings of the IEEE Visual Communications and Image Processing (VCIP), St. Petersburg, FL, USA, 10–13 December 2017. [Google Scholar]
  27. Kallam, S.; Kumar, M.S.; Natarajan, V.A.; Patan, R. Segmentation of Nuclei in Histopathology images using Fully Convolutional Deep Neural Architecture. In Proceedings of the 2020 International Conference on Computing and Information Technology (ICCIT-1441), Tabuk, Saudi Arabia, 23 November 2020. [Google Scholar]
  28. Dong, Y.; Wang, L.; Cheng, S.; Li, Y. FAC-Net: Feedback Attention Network Based on Context Encoder Network for Skin Lesion Segmentation. Sens. J. 2021, 15, 5172. [Google Scholar] [CrossRef] [PubMed]
  29. Zhou, L.; Zhang, C.; Wu, M. D-LinkNet with Pretrained The encoder and Dilated Convolution for Resolution Satellite Imagery Road Extraction. In Proceedings of the 2018 IEEE/CVF Conference on Computer Vision and Pattern Recognition Workshops (CVPRW), Salt Lake City, UT, USA, 18–22 June 2018. [Google Scholar]
  30. Xiong, W.; Jia, X.; Yang, D.; Ai, M.; Li, L.; Wang, S. DP-LinkNet: A convolutional network for historical document image binarization. Ksii Trans. Internet Inf. Syst. 2021, 15, 1778–1797. [Google Scholar]
  31. Şahin, N.; Alpaslan, N. SegNet Mimarisi Kullanılarak Cilt Lezyon Bölütleme Performansının İyileştirilmesi. Available online: https://dergipark.org.tr/tr/download/article-file/1024855 (accessed on 18 December 2021).
  32. Brahmbhatt, P.; Rajan, S.N. Skin Lesion Segmentation using SegNet with Binary CrossEntropy. In Proceedings of the International Conference on Artificial Intelligence and Speech Technology (AIST2019), Delhi, India, 14–15 November 2019. [Google Scholar]
  33. Bagheri, F.; Tarokh, M.J.; Ziaratban, M. Skin lesion segmentation based on mask RCNN, Multi Atrous Full-CNN, and a geodesic method. Int. J. Imaging Syst. Technol. 2021, 31, 1609–1624. [Google Scholar] [CrossRef]
  34. ISIC. Available online: https://challenge2018.isic-archive.com/task3/training/ (accessed on 1 January 2022).
  35. OPENCV. Available online: https://docs.opencv.org/ (accessed on 1 January 2022).
  36. ISIC. Available online: https://challenge2018.isic-archive.com/ (accessed on 1 January 2022).
  37. FCUP110. Available online: https://www.fc.up.pt/addi/PH2{%}20database.html (accessed on 30 December 2021).
  38. Sandler, M.; Howard, A.G.; Zhu, M.; Zhmoginov, A.; Chen, L. Mobilenetv2: Inverted residuals and linear bottlenecks. In Proceedings of the 2018 IEEE/CVF Conference on Computer Vision and Pattern Recognition, Salt Lake City, UT, USA, 18–23 June 2018. [Google Scholar]
  39. Chetoui, M.; Akhloufi, M.A. Explainable Diabetic Retinopathy using EfficientNET. In Proceedings of the 42nd Annual International Conference of the IEEE Engineering in Medicine & Biology Society (EMBC), Montreal, QC, Canada, 20–24 July 2020. [Google Scholar]
  40. Kamble, R.; Samanta, P.; Singhal, N. Optic Disc, Cup and Fovea Detection from Retinal Images Using UNet++ with EfficientNet Encoder. In Proceedings of the International Workshop on Ophthalmic Medical Image Analysis, Lima, Peru, 8 October 2020. [Google Scholar]
  41. Messaoudi, H.; Belaid, A.; Allaoui, M.L.; Zetout, A.; Allili, M.S.; Tliba, S.; Salem, D.B.; Conzer, P. Efficient embedding network for 3D brain tumor segmentation. In Proceedings of the BrainLes: International MICCAI Brainlesion Workshop, Lima, Peru, 4 October 2020. [Google Scholar]
  42. He, K.; Zhang, X.; Ren, S.; Sun, J. Deep Residual Learning for Image Recognition. arXiv 2015, arXiv:1512.03385. Available online: https://arxiv.org/pdf/1512.03385.pdf (accessed on 22 December 2021).
  43. Nieradzik, L.; Scheuermann, G.; Saur, B.; Gillmann, C. Effect of the output activation function on the probabilities and errors in medical image segmentation. arXiv 2021, arXiv:2109.00903. Available online: https://arxiv.org/pdf/2109.00903.pdf (accessed on 20 December 2021).
  44. L’opez, A.R. Skin Lesion Detection From Dermascopic Images Using Convolutional Neural Networks. Semantic Scholar. Available online: https://www.semanticscholar.org/paper/Skin-lesion-detection-from-dermoscopic-images-using-L{%}C3{%}B3pez/77b0dd5672950dfffe72f79668d5e0655b5462e5#paper-header (accessed on 14 December 2021).
  45. Das, K.; Jiang, J.; Rao, J.N.K. Mean Squared Error of Empirical Predictor. Ann. Stat. 2004, 32, 1–24. [Google Scholar] [CrossRef] [Green Version]
  46. Keras. Available online: https://keras.io/api/optimizers/adam/ (accessed on 23 October 2021).
  47. Wang, Y.; Rahman, A. Optimizing Intersection-Over-Union in Deep Neural Net-works for Image Segmentation. In Proceedings of the International Symposium on Visual Computing, Las Vegas, NV, USA, 12–14 December 2016. [Google Scholar]
  48. Ronneberger, O.; Fischer, P.; Brox, T. U-Net: Convolutional Networks for Biomedical Image Segmentation. In Proceedings of the Medical Image Computing and Computer-Assisted Intervention—MICCAI 2015, Munich, Germany, 5–9 October 2016. [Google Scholar]
Figure 1. The overall representative structure of the study.
Mathematics 10 00736 g001
Figure 2. The cleanup dataset creation process.
Mathematics 10 00736 g002
Figure 3. Examples of the cleanup dataset.
Mathematics 10 00736 g003
Figure 4. Examples of the segmentation data set.
Mathematics 10 00736 g004
Figure 5. Examples of sliced images.
Mathematics 10 00736 g005
Figure 6. EfficientNetB7 architecture.
Mathematics 10 00736 g006
Figure 7. ResNet architecture.
Mathematics 10 00736 g007
Figure 8. LinkNet-B7 Architecture.
Mathematics 10 00736 g008
Figure 9. Comparison of models in the noise removal phase.
Mathematics 10 00736 g009
Figure 10. Comparison of models in the lesion segmentation phase.
Mathematics 10 00736 g010
Figure 11. Results in the segmentation phase with images with black frame and band-aid noise.
Mathematics 10 00736 g011
Table 1. Parameters used in training phases.
ParameterNoise Removal PhaseSegmentation Phase
Batch size88
Learning rate0.0010.001
Epoch number50005000
Input size256 × 256256 × 256
OptimizerAdamAdam
Table 2. The structure of the encoder.
PhaseOperatorResolutionChannelsLayers
1conv 7 × 7, /2128 × 128641
2conv 3 × 3128 × 128641
3Block 1—MBconv1 3 × 3128 × 128323
4Block 2—MBconv6 3 × 364 × 64487
5Block 3—MBconv6 5 × 564 × 64807
6Block 4—MBconv6 3 × 332 × 328010
7Block 5—MBconv6 5 × 532 × 3222410
8Block 6—MBconv6 5 × 516 × 1638413
9Block 7—MBconv6 3 × 316 × 166404
Table 3. The results were obtained with different models in the noise cleanup phase.
ParameterUNet [48]LinkNet [26]Dp-Link [30]LinkNet-B7
Training accuracy (%)87.2590.1894.8695.72
Training loss (%)11.887.286.366.22
Validation accuracy (%)81.1090.3294.0294.42
Validation loss (%)6.824.684.223.60
mIoU %86.1089.2093.5094.15
Table 4. The results obtained with different models in the lesion segmentation phase.
ParameterUNet [48]LinkNet [26]Dp-Link [30]LinkNet-B7
Training accuracy (%)89.2593.1896.6097.80
Training loss (%)10.888.286.806.22
Validation accuracy (%)89.1092.8295.7096.60
Validation loss (%)5.824.284.204.05
mIoU %87.9092.0195.1096.70
Table 5. Comparison of two methods in the hair removal phase with the ISIC 2018 dataset.
ReferenceMethodPhaseImage NumDice Coef
Wei et al. [16]UNet-basedHair removal30687.42
Proposed methodLinkNet-basedHair removal30697.80
Wei et al. [16]UNet-basedLesion segmentation259496.88
Proposed method (%)LinkNet-basedLesion segmentation259497.02
Table 6. Comparison of methods in the lesion segmentation phase with the PH2 dataset.
ReferenceMethodDatasetImage NumDice Accuracy %
Zafar et al. [17]UNet-basedPH220092.4
Rajan et al. [32]SegNet-basedPH215085.16
Phan et al. [22]UNet-basedPH220094.04
Bagheri et al. [33]CNN-basedPH220089.83
Proposed methodLinkNet-basedPH220097.42
Table 7. Comparison of methods in the lesion segmentation phase with the ISIC dataset.
ReferenceMethodDatasetImage NumDice Accuracy %
Dong et al. [28]UNet-basedISIC2018259491.19
Zafar et al. [17]UNet-basedISIC201785.8
Zhang et al. [18]UNet-basedISIC2017275094.3
Hasan et al. [19]UNet-basedISIC2017275087.5
Arıcı et al. [20]UNet-basedISIC201813,00092.6
Şahin et al. [31]SegNet-basedISBI201690088.43
Proposed methodLinkNet-basedISIC 2018844,80096.75
Publisher’s Note: MDPI stays neutral with regard to jurisdictional claims in published maps and institutional affiliations.

