Article

Effect of Lithology on Mechanical and Damage Behaviors of Concrete in Concrete-Rock Combined Specimen

School of Resources and Safety Engineering, Central South University, Changsha 410083, China
*
Author to whom correspondence should be addressed.
Mathematics 2022, 10(5), 727; https://doi.org/10.3390/math10050727
Submission received: 24 January 2022 / Revised: 22 February 2022 / Accepted: 22 February 2022 / Published: 25 February 2022

Abstract

:
A concrete structure built on rock foundation works together with the connected rock mass, which has a significant effect on the mechanical behaviors of the concrete structure. To study the effect of lithology on the mechanical and damage behaviors of concrete in a concrete-rock combined specimen (CRCS), first, a test method for measuring the concrete part (concrete in CRCS) is adopted, then, uniaxial compression tests on seven types of specimens are performed and acoustic emission (AE) events are simultaneously monitored. Test results show that the low-strength concrete part plays a major role in the fracture behavior of CRCS. When the CRCS is failed, a sudden stress drop happens in CRCS, and the rock part (rock in CRCS) experiences a rapid axial strain recovery and intensifies the failure of the concrete part. The load-bearing and deformation capacities of the concrete part increase with the strength of the rock part, but the rock part shows the opposite behaviors under the influence of the concrete part. Furthermore, the damage of CRCS is mainly formed in the concrete part, and the damage extent of the concrete part is positively correlated with the strength of the rock part. Finally, a damage constitutive model of the concrete part is established and validated. This model can be used to accurately describe the effect of lithology on the mechanical response of the concrete part under uniaxial compression loading.
MSC:
74A45; 74A20; 74Q15; 74L10; 92F05

1. Introduction

Concrete structures are widely built on rock foundations in the fields of hydraulic, civil and mining engineering, for instance, dams and retaining walls on a rock foundation, concrete support in underground excavation and underground nuclear waste repositories [1,2,3,4,5,6,7,8,9,10,11]. In the past, extensive studies have been carried out on pure concrete materials, and their deformation and failure evolution can be reasonably predicted. However, under the action of loading, in situ stress or temperature variation, the concrete structure and the connected rock foundation work and respond together. In this situation, the mechanical behaviors of concrete structures are significantly different from those of pure concrete structures, i.e., there are obvious shortcomings in revealing the mechanical performance of concrete structures built on rock foundations based on the experimental results of pure concrete specimens. In response to this situation, the concrete–rock structure should be considered as a combined body, and it is worthwhile to perform research on the concrete–rock combined specimen and further forecast the mechanical behaviors of concrete structures in practical applications.
In recent years, some efforts have been made to study the mechanical properties of CRCS subjected to various types of loads, such as compressive [12,13,14,15,16], shear [17,18,19,20], tensile [21,22,23,24,25], etc., in laboratory experiments. For example, Selçuk et al. [12] implemented uniaxial compressive tests on the concrete–rock bi–materials and found that with the increase of interface inclination angle, the strength of the combined specimen first decreases and then increases. Shen et al. [17] reported that the peak shear strength of the concrete–rock interface increases with the joint roughness coefficient, but the increase rate gradually decreases, and the peak strength tends to be stable. Chang et al. [21] observed that the load–bearing capacity of concrete–rock bi–material discs increases with the interface inclination angle, and the fracture pattern gradually changes from shear failure to a combined mode of shear fracture and tensile fracture, and finally it turns into tensile failure. Dong et al. [26] stated that under three–point bending, the failure of concrete–rock interface is mode I dominated fracture, and under four–point shearing, the mode II component may increase in the case of a small notched crack length–to–depth ratio. Although the above experimental studies mainly focus on the interface fracture and the influence of interface conditions on strength, it is implied that compared to pure concrete, the mechanical properties of CRCS are significantly affected when the rock material is involved.
Besides experimental studies, theoretical and numerical works have also been undertaken to analyze the mechanical behaviors of concrete–rock combined bodies. Javanmardi et al. [27] propose a theoretical model for transient water pressure variation along the concrete–rock crack during the earthquake, and the model is validated and further implemented in a finite element program for dynamic stability analysis of a concrete gravity dam resting on a rock foundation. Andjelkovic et al. [28] derived the mathematical models of shear deformability and shear strength for the contact of concrete and rock mass, and these models can serve as a basis for the structural analysis of concrete dams in the preliminary design. In addition, Tian et al. [29] developed a cohesive interface model for cemented concrete–rock joints to simulate the whole shear stress–shear displacement curve, including the elastic, bond failure and friction sliding stags. For seismic safety evaluation, Chavez et al. [30] used the Coulomb friction model to quantify the relative movement of earthquake–induced sliding at the interface between the concrete dam base and rock foundation. Furthermore, through experimental investigation, Dong et al. [23] propose an interfacial crack propagation criterion for the composite rock–concrete specimen, and by applying this criterion into the numerical simulation, the complete fracture process of a gravity dam is numerically analyzed, and the potential crack propagation paths are predicted.
Considering the difference between concrete and rock materials, these above–reviewed works emphasize the importance of concrete–rock contact and interface conditions, and some mechanical behaviors of the whole concrete–rock body under shear loads are also investigated. However, under the conditions of response to loading together, especially for compression, the concrete and rock in the combined body interact with each other and the mechanical behaviors of concrete structure are significantly affected by the rock mass. When designing and evaluating the concrete structure built on the rock foundation, this issue needs to be essentially concerned, while by far, few papers can be found to study the mechanical properties of concrete in the combined body. Moreover, in practical engineering, the concrete structures are built on bedrock with different lithology, and the mechanical performance of the concrete structures is closely related to the lithology of the rock foundation. In this paper, firstly an experimental method to obtain the stress and strain of concrete part in CRCS is adopted. Then uniaxial compression tests on seven types of specimens, including three types of pure rock specimens with different lithology, one type of pure concrete specimen and three types of CRCSs, are performed and acoustic emission (AE) events happening in the specimen are simultaneously monitored. The effect of rock lithology on the mechanical behaviors of the concrete part is analyzed. In addition, a statistical damage constitutive model of the concrete part is established and validated. Research in this study can provide fundamental insights into the mechanical and damage behaviors of concrete structures built on rock foundations with different lithology.

2. Specimen and Experiment Setup
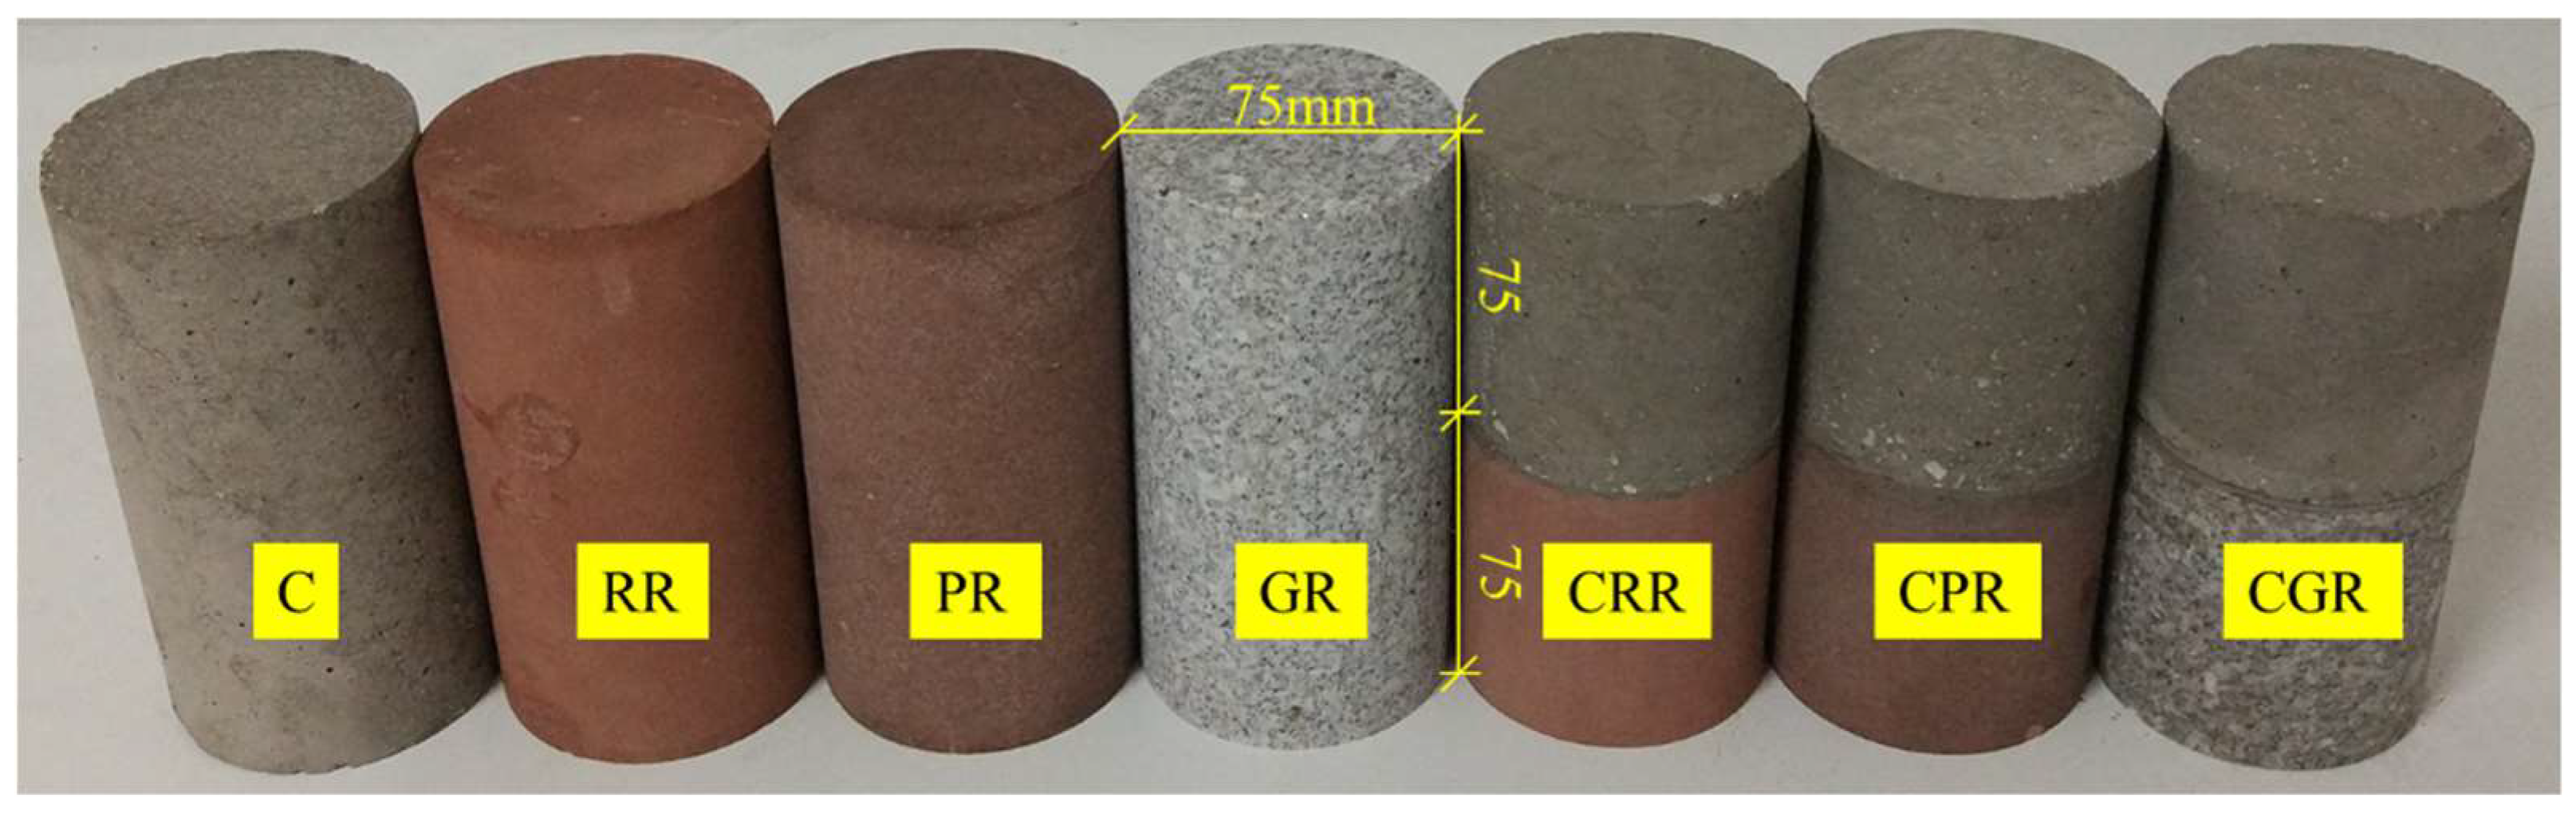
2.1. Specimen

To study the effect of lithology on the mechanical and damage behaviors of the concrete part, in the present study, three types of rock, i.e., red sandstone, purple sandstone and granite, have been considered for the rock part. These three types of rock materials are processed into cylinders of 75 mm in diameter, and the heights of the cylinders are 75 mm and 150 mm. For the concrete, alluvial sands from a natural deposit with a fineness modulus of 2.9 have been used as fine aggregates. Clean gravels with a maximum size of 7 mm are used as coarse aggregates. Portland 42.5R cement, which is often adopted in practice, has been selected as cementitious material and the corresponding water/cement ratio is 0.67. The detailed material composition of current concrete is listed in Table 1.
Before casting the pure concrete specimens and combined specimens, the internal surfaces of designed cylindrical metal moulds with an inner diameter of 75 mm have been fully smeared with lubricating oil to avoid adhesion. When casting the combined specimens, 75 mm high rock parts are first placed at the bottom of the metal moulds. Considering the practical engineering operation that the concrete structures are built on a geological body, the cement–aggregate–water mixture is then directly poured onto the upper surfaces of rock parts and compacted by placing the moulds on a vibrating machine. For a combined specimen, the heights of concrete and rock part are both 75 mm, i.e., the concrete–rock height ratio in combined specimens is equal to 1, and for a pure material specimen, the height of cylindrical concrete or rock is 150 mm. The specimens are taken out from the moulds 24 h after casting and then moist–cured in an environment of 20 ± 2 °C and 100% relative humidity for 2 months. Before conducting the uniaxial compression tests, the specimens are ground by using a polisher to make both ends of the cylindrical specimens parallel and smooth, and the errors of specimen dimensions are within ± 1 mm. Then the specimens are coated with grease to reduce the friction between the specimen and the rigid loading platens. For the current study, one type of pure concrete specimen, three types of pure rock specimens and three types of CRCSs are prepared as shown in Figure 1, and at least five specimens for each type are processed for testing. The specimen labels and combination forms are listed in Table 2.

2.2. Test Method

Liu et al. [31] proposed an experimental method to obtain the stress and strain of coal in coal–rock combined specimens by gluing strain gauges on the rock surface. For the present study, similarly, the same experimental method is adopted. In this method, when the combined specimen is subjected to static uniaxial compression loading, the stresses in the concrete part, rock part and the whole combined specimen are equal to each other during the loading process which can be written as:
σC = σR = σW
where σC is the stress in the concrete part, σR is the stress in the rock part and σW is the stress of the whole combined specimen.
The total axial deformation of the combined specimen due to loading is equal to the sum of axial deformations of the concrete and rock parts, which can be expressed as:
ΔLW = ΔLC + ΔLR
where ΔLW is the axial deformation of the whole combined specimen, ΔLC is the axial deformation of the concrete part, and ΔLR is the axial deformation of the rock part.
When a CRCS is loaded on a test device such as servo–controlled material testing machine, the axial stress and strain of the combined specimen, σW and εW, can be measured directly. According to Equation (1), the stresses in the concrete and rock parts, σC and σR, can be easily obtained. For the CRCS, generally, its failure is initiated by the break of the concrete part due to the fact that the strength and rigidity of rock are much higher than those of concrete. However, since concrete contains a large number of coarse aggregates, local deformations are significantly different at the positions of coarse aggregate and cement during the loading process. As a result, the strain of the concrete part, εC, cannot be directly and accurately measured by simply attaching strain gauges to the surface of the concrete part. While on the other side, the rock part is much more homogeneous. Its deformation is uniformly distributed along the height and its axial strain, εR, can be measured by gluing strain gauges on its surface. Therefore, according to the relationship between deformation and strain, and substituting the measured strains into Equation (2), the axial strain of the concrete part can also be obtained as follows:
ε C = h W ε W h R ε R h C
where hW, hR and hC are the heights of the whole combined specimen, the rock and concrete parts, respectively.

2.3. Equipment Setup

The whole experimental equipment mainly consists of three sub–systems, i.e., the loading system, AE monitoring system and the strain testing system as shown in Figure 2. The INSTRON 1346 servo–controlled material testing machine with a capacity of 2000 KN is used as the uniaxial compression loading system. The specimens are performed uniaxial compression testing on this testing machine with a displacement–controlled loading mode, and the loading rate is maintained at 0.15 mm/min. In current testing, the lower rigid loading platen is loaded upwards to exert pressure on the specimen while the upper rigid loading platen keeps stationary. A linear variable differential transformer (LVDT), which is directly connected to Computer No. 1 for signal processing, is used to measure the axial strain of the whole specimen. The PCI–2 AE detector, developed by PAC, is used to monitor AE signals during the loading process. The AE sensor is attached to the bottom surface of the upper rigid loading platen with a magnetic fixing device. To ensure the signal reception, Vaseline taken as a coupling agent is smeared on the interfaces and the AE sensor is placed as close as possible to the specimen. The AE signals are received and then amplified and transmitted to Computer No. 2. The main parameters for the AE detector are set as pre–amplifier gain 40 dB, threshold 40 dB and sampling rate 1 MHz, respectively. The DH3817 static strain testing system, consisting of strain gauges, a data–collection device and a computer, is used to measure the axial strain of the rock part. The strain gauges glued on the cylindrical surface of the rock part are directly connected to the data–collection device and the data–collection device is subsequently connected to Computer No. 3. To ensure the accuracy of measured strain data, three strain gauges separated by 120° are glued on the surface of the rock part for each combined specimen, as shown in Figure 2b. During the experiment, three specimens for each type are first tested, and if sharp contrast existed between the results, more specimens of this type are further tested until three similar results are obtained.

3. Experimental Results and Analysis

3.1. Strength and Failure Pattern of Seven Types of Specimen

The uniaxial compressive strengths of the seven types of specimens are listed in Table 3. During the experiment, further tests are aborted when three similar results are obtained for one type of specimen, thus additional data for this type are not available and the average strength is determined based on the three similar values of all the obtained results for this type to avoid scattering and get a representative strength. As can be seen from the table, the average uniaxial compressive strengths of three types of pure rock specimens, i.e., red sandstone, purple sandstone and granite, are 76.50 MPa, 109.68 MPa and 166.27 MPa, respectively. After 2 months of curing, the average uniaxial compressive strength of pure concrete specimens is 33.71 MPa, and those of CRCSs are 36.99 MPa, 43.42 MPa, and 46.29 MPa, respectively. Herein, it can be noted that although the strengths of combined specimens are much smaller than those of pure rock specimens, they are obviously higher than that of pure concrete specimens, about 9.73–37.32% higher than the latter, and they increase with the increment of the strength of the rock part, which means the load–bearing capacity of the combined specimen is significantly affected by the lithology of rock part.
Figure 3 shows the ultimate failure patterns of concrete, rock and combined specimens in the testing. As can be observed, typical axial splitting fractures form in the pure concrete specimen, while shear–induced fractures occur in the three types of pure rock specimens. In the cases of CRCSs, although rock materials are also present, the specimens are all failed by axial splitting fractures along the loading direction. The axial cracks initiate and mostly propagate in the concrete parts and the crack density in concrete increases as the strength of rock increases. This is mainly because the axial cracks in concrete generate horizontal tensile stresses acting on the rock part, and higher strength rock needs more tension created in this way to overcome its tensile strength. With the growth of new cracks, the higher strength rock part is finally fractured in tension. From these observations, it can be found that the low–strength concrete plays a major role in the fracture behavior of CRCSs under uniaxial compression.

3.2. Stress–Strain Curve of Seven Types of Specimen

In the uniaxial compression testing, the axial stress and strain of the whole specimen are directly measured and recorded by using the loading system. Figure 4 shows the stress–strain curves of the whole specimens and these stress–strain responses are closely related to the damage development of specimens. From the curves it can be seen that the whole loading process of concrete–rock specimens generally can be subdivided into five successive stages, i.e., compaction hardening, elastic deformation, plastic deformation, post–peak strain softening and residual friction.
The concrete usually contains lots of pores, and many micro cracks exist in the rock as well. In the initial compaction hardening stage, these existing flaws in the combined specimen are quickly crushed and closed under the pressure. Through self–adjustment, the density and stiffness of the combined specimen gradually increase, thus a concave curve is presented during this period. When the maximum compaction pressure is reached, the materials of concrete and rock tend to be completely compact and even, and the combined specimen begins to behave almost in a linear–elastic manner, that is to say, the combined specimen enters into an elastic deformation stage. At this stage, the stiffness of the specimen approximately keeps constant. Under the pressure, the concrete and rock parts work together, and the stress increases rapidly. With the further increase of stress, low–strength concrete first turns into a plastic state and the development of original randomly distributed micro cracks in the rock is also initiated. The stiffness of the combined specimen gradually decreases, and the plastic deformation increases nonlinearly. At the end of this stage, the combined specimen reaches its ultimate compressive strength. After that, the cracks in concrete quickly spread and converge, and the stress inside the specimen redistributes and rapidly decreases. In this situation, the specimen exhibits strain-softening behavior and undergoes a rapid decrease in load–bearing capacity. During this stage, the concrete changes into failure, and the cracks in the concrete form some major axial fractures and spread downwards to the interface. At the interface, the axial splitting fractures in concrete generate horizontal tensile stresses on the rock part, and with the growth of new cracks in concrete, the rock is finally fractured. The rock part is instantaneously fractured, at the same time, a sudden and steep stress drop happens and this phenomenon will be discussed in detail in Section 3.3 where the strain variation of the rock part is introduced. At last, the entire specimen is destroyed, but due to the friction between crack and fracture surfaces, it still maintains some residual resistance strength, and with the continuous increase of deformation, the stress in the combined specimen slowly decreases.
The main difference between the stress–strain curves of pure rock, pure concrete and combined specimens in the loading process is the post–peak strain–softening stage. Because of the brittle nature, the stress–strain curves of pure rock specimens can only be recorded a little later after the peaks. In contrast, due to being more ductile, the stress–strain curve of pure concrete specimen has good continuity and its post–peak strain–softening stage is relatively smooth. While in this regard, the CRCSs integrate both of the characteristics of the above two kinds of pure materials. Their stress–strain curves also present good continuity, but sudden stress drops appear at the ends of the post–peak strain softening stages when the rock in specimens are thoroughly fractured. Besides that, it is worth noting here that, with the increasing of rock strength in the combined specimen, the corresponding stress drop in the post–peak strain–softening stage delays. As mentioned in Section 3.1, this is again because of the horizontal tensile stresses generated by the axial cracks in concrete. When the higher strength rock is split, it needs more axial cracks of concrete to create enough horizontal tension to overcome its tensile strength, which means the corresponding combined specimen allows its concrete part to deform persistently along the loading direction with more axial strain.

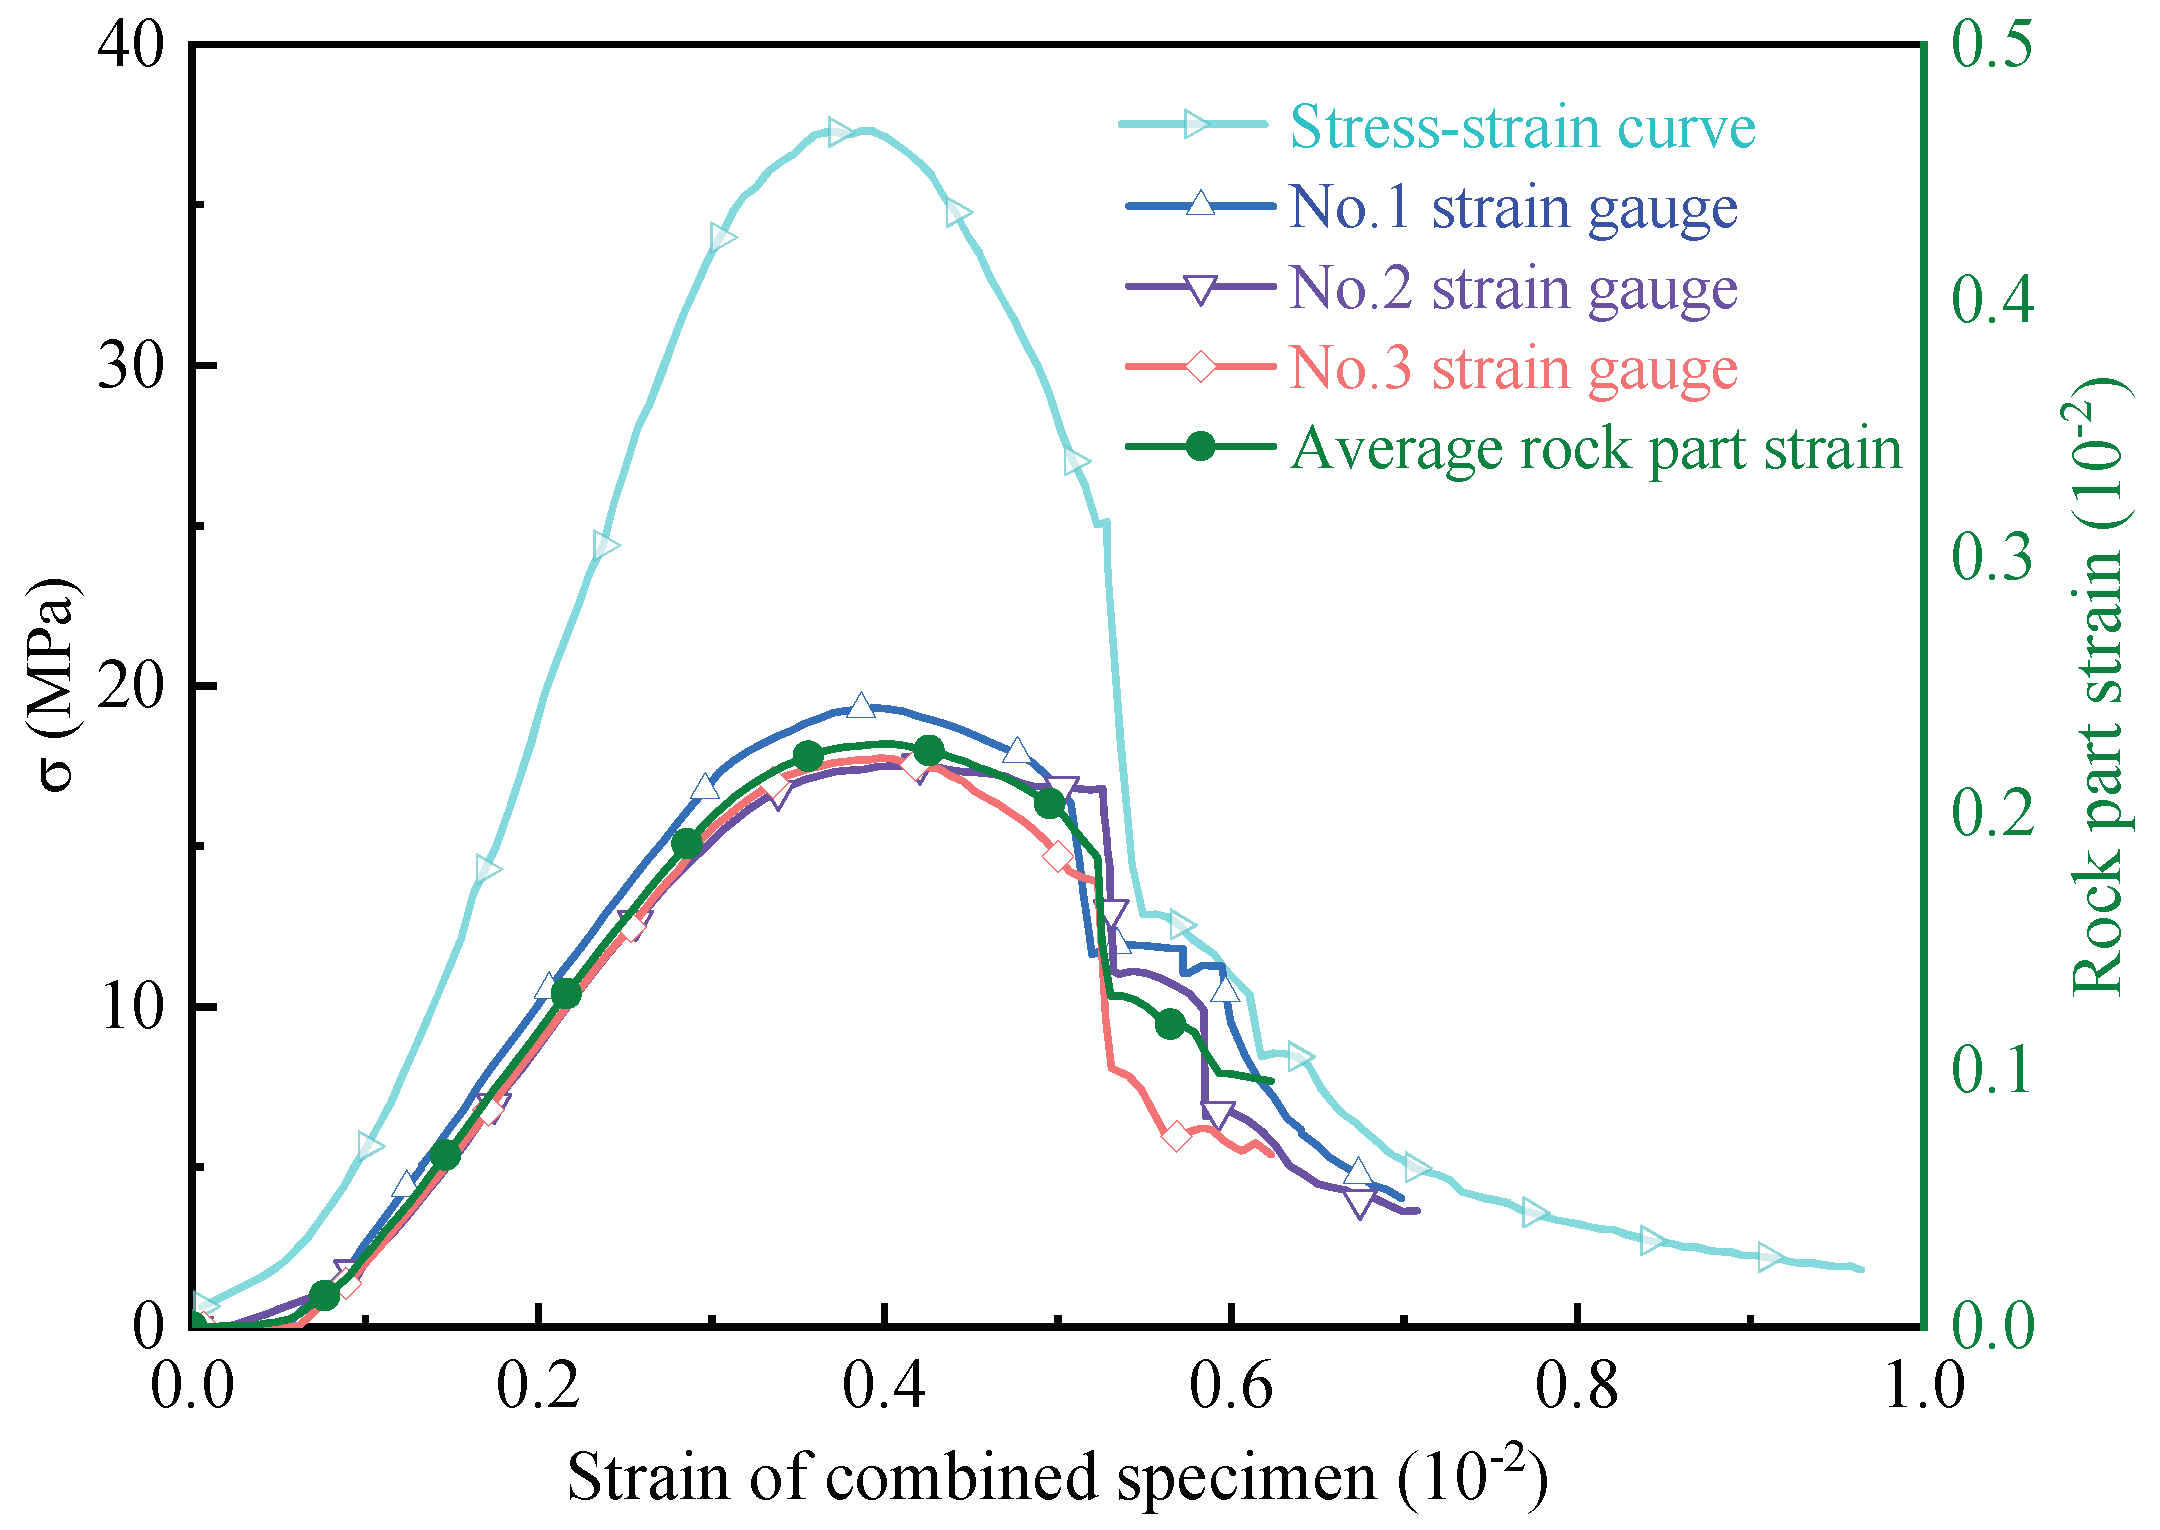
3.3. Strain Variation of Rock Part

The axial strain of the rock part in the combined specimen is directly measured by using the strain testing system. Since the response behaviors of different rock parts in combined specimens during the loading are similar, here the stress–strain data of the rock part in CRR–1 (see Figure 5) is taken as an example for the analysis of strain variation of rock part. As can be seen, the axial strain variation of the rock part is similar to the stress variation of the corresponding combined specimen. Due to that, the strength and stiffness of rock are much higher than those of concrete, the rock part is almost intact before the fracture in concrete extends into it, during this period, according to the stress–strain curve in Figure 4a, the axial strain of rock in CRR–1 is still in the elastic stage, and a large amount of elastic energy is accumulated in rock part under the compressive loading. At the end of the post–peak strain–softening stage, the rock part is instantaneously fractured and a rapid axial strain recovery happens in the rock part. It is worth noting that the rapid axial strain recovery of the rock part and the sudden stress drop of CRCS almost happen at the same time. This phenomenon can be explained by the fact that when the rock part experiences a rapid axial strain recovery, the elastic energy accumulated in the rock part releases quickly and the rock part plays an axial loading role on the concrete part, which intensifies the failure of the concrete part, and as a result, the sudden stress drop happens in the CRCS. In addition, it can also be found from the figure that when the rapid axial strain recovery happens, the axial strain in the rock part and the stress in CRCS do not recover and decrease to zero, which indicates that the axial loading effect of the rock part cannot completely crush the concrete part, and the concrete part still has some residual strength.
Furthermore, it can be found that the strain of the rock part in the combined specimen at peak stress is much smaller than that of the corresponding combined specimen. For instance, the average strains of rock parts (rock in CRR–1, CPR–2 and CGR–2) at peak stresses are 2.28 × 10⁻³, 1.90 × 10⁻³ and 1.47 × 10⁻³, respectively. The average strains of corresponding combined specimens at peak stresses are 3.91 × 10⁻³, 4.16 × 10⁻³ and 4.06 × 10⁻³, respectively. In other words, the axial deformations of rock parts at the peak stresses account for 29.16%, 22.84% and 18.10% of the corresponding combined specimens, respectively. Compared to the strains of pure rock specimens at the peak stresses (for example, 6.92 × 10⁻³, 6.46 × 10⁻³ and 5.55 × 10⁻³ for RR–2, PR–1 and GR–3), the axial strains of rock in combined specimens are only 32.95%, 29.41% and 26.49%. This is mainly due to the fact that the failure pattern of rock in the combined specimen is different from that of pure rock specimen under compressive loading. As mentioned in Section 3.1, the failure pattern of rock changes from a shear–induced fracture in a pure rock specimen to an axial tensile fracture in the combined specimen. Thus, it can be concluded that when the concrete–rock combined body is subjected to ultimate load, the concrete structure has a weakening effect on the axial load–bearing and deformation capacity of the connected rock foundation, and the weakening effect becomes more obvious with the increase of rock strength.

3.4. Stress–Strain Curve of Concrete Part

By substituting the strains of the rock part and corresponding combined specimen into Equation (3), the strain of the concrete part can be obtained. The stress of the concrete can be obtained by Equation (1). Because the whole combined specimen is near failed when the sudden stress drop happens, we only calculate the stress and strain of the concrete part before the stress drop happens. Figure 6 shows the stress–strain curve of the pure concrete specimen (C–3) and the derived stress–strain curves of concrete parts (concrete in CRR–1, CPR–2 and CGR–2). As can be seen, although the stress–strain curves of the pure concrete specimen and concrete parts show a similar evolution trend, several apparent differences can be observed from them. For instance, the strengths of concrete parts range from 37.35 MPa to 46.87 Mpa, and they are obviously higher than that of the pure concrete specimen (33.68 MPa). Moreover, the strains of concrete parts at peak stresses vary from 5.54 × 10⁻³ to 6.65 × 10⁻³, which are also much larger than that of the pure concrete specimen (4.12 × 10⁻³). Therefore, compared with the pure concrete specimen, the load–bearing and deformation capacities of the concrete part are both enhanced, and the strength and strain at peak stress of concrete parts also increase with the strength of the rock part. To illustrate these more clearly, the variations of the strength and the strain at peak stress of concrete and concrete parts are shown in Figure 7.

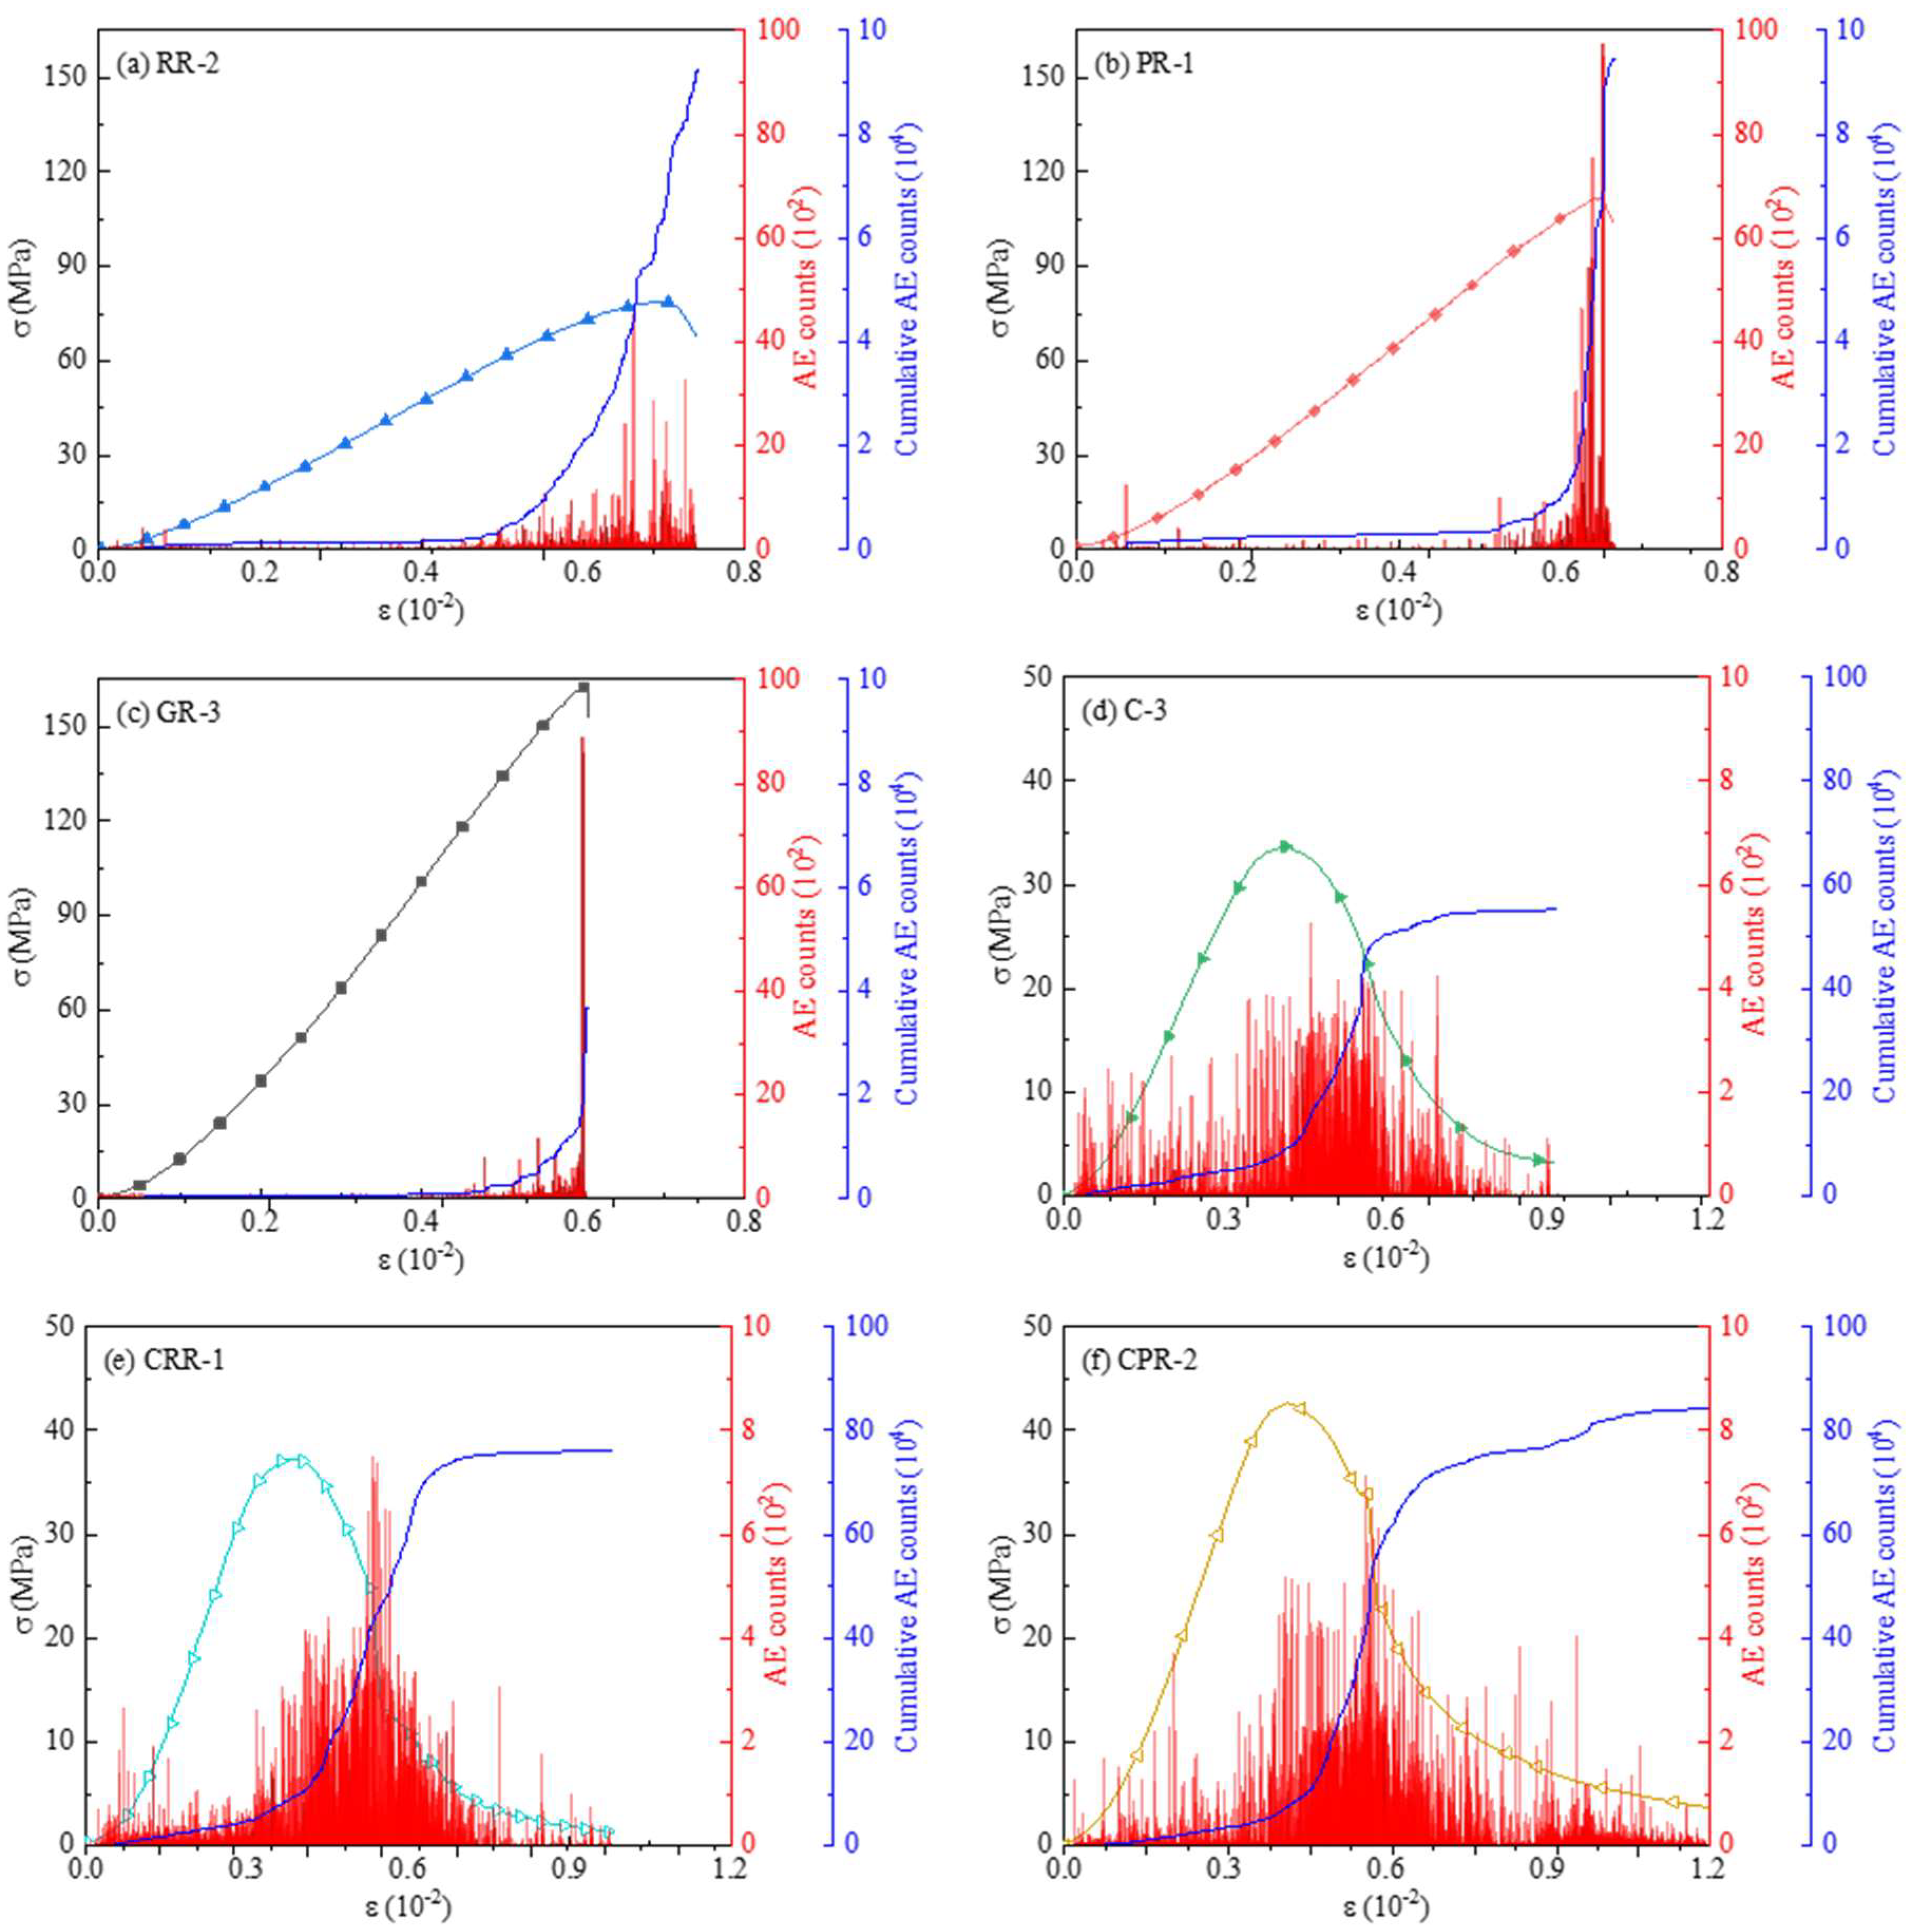
3.5. Damage Behaviors of Concrete Part

The AE signals (AE counts and cumulative AE counts) are monitored by using the PCI–2 AE detector to investigate the damage behaviors of the tested specimen. The AE detector runs simultaneously with the load–testing machine. Figure 8 shows AE counts and cumulative AE counts versus the stress–strain curve of each tested specimen. As can be seen from the figures, the variation of AE signals has a good correlation with the stress–strain curve. For all the specimens, at the beginning of loading, i.e., at the compaction hardening stage, due to the closure of micro pores and cracks, a small number of AE counts appeared, and then the AE activity was relatively quiet at the elastic deformation stage. When the plastic deformation stage is reached, the AE counts increase sharply, at the same time, the cumulative AE counts increase exponentially. The main differences of AE signals among these various types of specimens are that before the plastic deformation stage, the AE activities of pure rock specimens can be neglected, while due to the fact that concrete contains more pores, a number of AE events in pure concrete specimen and CRCSs are recorded. Moreover, because of the brittle nature, the AE signals of pure rock specimens can only be recorded a little later after the peaks, and due to being more ductile than rock, the AE events in the pure concrete specimen and CRCSs are active throughout the whole post–peak part. The peak values of AE counts of pure rock and concrete specimens appear near the peak load, while those of the CRCSs appear at the end of the post–peak soften stages where the sudden stress drop happens, and both mean the corresponding specimen is close to failing or failed.
During the loading process, the crack propagation and extension cause damage to the specimen, and the AE events happen in the specimen. According to the principle of AE technology, the damage extent of the specimen after the test can be inferred by the final cumulative AE counts. The final cumulative AE counts of pure rock specimens (RR–2, PR–1 and GR–3) are 9.23 × 10⁴, 9.45 × 10⁴, and 3.67 × 10⁴, respectively, and those of pure concrete specimen (C–3) and CRCSs (CRR–1, CPR–2 and CGR–2) are 5.52 × 10⁵, 7.61 × 10⁵, 8.44 × 10⁵, and 9.13 × 10⁵, respectively. The values of pure concrete specimen and CRCSs are much higher than those of pure rock specimens, and this indicates that the internal damage of pure concrete and combined specimens are more severe than those of pure rock specimens. Furthermore, by comparing the values of cumulative AE counts of pure rock and concrete specimens, it can be concluded that the AE events of the CRCS mainly happen in the concrete part, and this illustrates that the damage of the CRCS is mainly formed in the concrete part. Furthermore, it can also be found that the final cumulative AE counts increase with the rock strength in CRCS, and this means that the damage extent of the concrete part has a positive correlation with the strength of the rock part.

4. Damage Constitutive Model of Concrete Part

4.1. Derivation of Constitutive Equation

There are a large number of defects in concrete in terms of micro pores and cracks, and these defects gradually develop and extend under external load and eventually lead to material damage. However, the properties of these micro defects, such as position, dimension, strength and stiffness, etc., are impossible to be known exactly. For the sake of simplification, it is generally thought that the micro–unit strength of concrete obeys some statistical distributions when trying to describe the mechanical behavior of concrete mathematically. In the same manner, for the present study of a constitutive model for the concrete part, it is assumed that the micro–unit strength of concrete satisfies Weibull distribution, and the probability density function of micro–unit strength can be written in the form of:
φ f ¯ = m a f ¯ a m 1 exp f ¯ a m
where f ¯ is the micro–unit strength variable, and m and a are the shape parameter and the scale parameter, respectively.
The quantity of failure unit in interval [0, f ¯ ] can be calculated as:
N f f ¯ = 0 f ¯ N φ x d x = N 1 exp f ¯ a m
The loading damage variable is defined as the ratio of the quantity of failure unit Nf to that of total unit N:
D = N f N
Substituting Equation (5) into Equation (6), then the loading damage variable is obtained as:
D = 1 exp f ¯ a m
When further assuming that the micro–unit strength of concrete satisfies the maximum–tensile strain yield criterion, the micro–unit strength variable can be written as:
f ¯ = f ε = ε
where ε is the strain of the concrete part. By substituting Equation (8) into Equation (7), the loading damage variable becomes:
D = 1 exp ε a m
In 1971, Lemaitre [32] puts forward a strain equivalence hypothesis. According to his hypothesis, the strain behavior of a damage material can be modified by damage only through the effective stress and represented by constitutive equations of the virgin material (without any damage) in which the stress is simply replaced by the effective stress. This hypothesis has been widely used in the researches for concrete under various loading conditions [33,34]. Based on this strain equivalence hypothesis, in 1985, Lemaitre [35] develops a damage constitutive model under uniaxial loading as follows:
σ = 1 D E C ε
where EC is the average Young’s modulus of pure concrete specimens.
As mentioned in the foregoing analysis, the strength of concrete parts increases as the rock part strength increases, and the mechanical response of concrete parts is quite different from that of pure concrete. This is because rocks with different lithology have varying degrees of influence on the mechanical response of concrete parts. From this point of view, the above Equation (10), a traditional constitutive model for pure concrete, obviously cannot be used to accurately describe the behavior of concrete parts under uniaxial loading, and the influence of rocks with different lithology should be taken into consideration. At the beginning of loading, the concrete and rock parts are both in the compaction hardening process, but only a small amount of damage appeared in the rock, and the rock is almost in an elastic state before the sudden stress drop happens, thus the effect of rock part on the mechanical behavior of concrete part can be regarded as a non–ideal elastic body. In this way, the concrete in the combined specimen can be viewed as a cascade system of a damage body and a non–ideal elastic body (as shown in Figure 9) before the stress drop happens, and the constitutive equation for the non–ideal elastic body can be temporarily written as Equation (11):
σ = E R ε
where σ and ε are the stress and strain of the non–ideal elastic body, respectively, and ER is the average Young’s modulus of pure rock specimens.
Since the stress of the damage body is equal to that of the non–ideal elastic body, and the strain of the concrete part consists of those of the damage body and the non–ideal elastic body, then they can be written as
σ = σ D = σ N ε = ε D + ε N
where σD and εD are the stress and strain of damage body, respectively, and σN and εN are the stress and strain of non–ideal elastic body, respectively.
By substituting Equations (10) and (11) into Equation (12), the statistical damage constitutive equation of concrete part can be obtained as:
σ = 1 D E C E R ε 1 D E C + E R
However, in the above establishment of damage constitutive equation, the compaction hardening process is not taken into account. As mentioned in Section 3.2, many micro pores and cracks exist within the concrete and rock, in the early stage of loading, these initial flaws in the combined specimen are rapidly compacted, and thus the stress–strain curve first starts with an obvious concave increase. To accurately express the characteristic of compaction hardening of the concrete part, a compaction hardening coefficient, α, is proposed to quantify the extent of compaction hardening:
α = log n n 1 ε ε e + 1 ε < ε e 1 ε ε e
where n is a fitting constant obtained by fitting the experimental data, and εe is the strain of the concrete part corresponding to the stress at the starting point of the elastic deformation stage.
This compaction hardening coefficient is defined as the ratio of the slope of stress–strain curve to the Young’s modulus of concrete part and it increases logarithmically with strain. By introducing this coefficient into Equation (14), the statistical damage constitutive model is modified as:
σ =   α 1 D E C E R ε 1 D E C + E R ε < ε e   1 D E C E R ε 1 D E C + E R ε ε e
where m and a in “D” can be determined by fitting the experimental data.

4.2. Model Verification

Figure 10 shows the comparison of the stress–strain curves calculated using the above derived statistical damage constitutive model and the corresponding experimental data of concrete part under uniaxial compression loading. The curves are only calculated to the point of stress drop since the whole combined specimens are failed when the sudden stress drop happens. As can be seen, the calculated curves agree well with the experimental data, which indicates that the established statistical damage constitutive model can accurately describe the mechanical response of concrete parts under uniaxial compression loading.
Table 4 gives the fitting parameters and the related physical and mechanical parameters for the established damage constitutive model, and by introducing the fitting parameters a and m into Equation (9), the damage evolution curves (loading damage variable D versus strain) of the concrete part in combined specimens with different rock lithology are obtained as shown in Figure 11. As can be seen from the figure, the damage evolution curve reflects the mechanical performance of the concrete part under uniaxial compressive loading. When the concrete in different CRCSs suffers from the same damage at a higher level, the strain increases with the increment of the strength of the rock part. This indicates that the deformation capacity of the concrete part enhances with the rock part strength, and adds that the values of loading damage variable range from zero to one, they are concordant with the foregoing experimental results, and indirectly means that the statistical damage constitutive model and the corresponding fitting process are reliable.

5. Conclusions

In this study, the effect of lithology on the mechanical and damage behaviors of the concrete part in CRCS is investigated, and a statistical damage constitutive model for the concrete part is established and validated. The major conclusions are drawn as follows:
1. The low–strength concrete part plays a major role in the fracture behavior of CRCS under uniaxial compression loading. When the CRCS is failed, a sudden stress drop happens in CRCS and the rock part experiences a rapid strain recovery and plays an axial loading role on the concrete part, which intensifies the failure of the concrete part.
2. Compared with the pure concrete specimen, the strength and the strain at peak stress of the concrete part increase with the increment of rock part strength, which illustrates the load–bearing and deformation capacities of the concrete part are both enhanced. However, the load–bearing and deformation capacity of the rock part is weakened due to the influence of the concrete part, and the weakening effect becomes more obvious with the increase of rock strength.
3. Through the AE monitoring and signal analysis, it is found that the damage of CRCS mainly happens in the concrete part, and the damage extent of the concrete part has a positive correlation with the strength of the rock part.
4. A damage constitutive model of the concrete part is established by using a cascade system, including a damage body and a non–ideal elastic body and validated against the experimental data. This statistical damage constitutive model can be used to accurately describe the effect of lithology on the mechanical response of the concrete part under uniaxial compression loading.

Author Contributions

Conceptualization, K.L.; methodology, S.J.; software, K.L. and S.J.; validation, K.L., S.J., Y.R. and J.H.; formal analysis, Z.Z.; investigation, Y.R., J.H. and Z.Z.; resources, S.J.; data curation, S.J.; writing—original draft preparation, K.L; writing—review and editing, Y.R.; visualization, J.H.; supervision, Z.Z.; project administration, K.L.; funding acquisition, S.J. and Y.R. All authors have read and agreed to the published version of the manuscript.

Funding

The research was supported by the National Natural Science Foundation of China, project No. 51974360.

Institutional Review Board Statement

Not applicable.

Informed Consent Statement

Not applicable.

Data Availability Statement

The experimental data cannot be shared at this time, because the data is also used in the ongoing study.

Acknowledgments

We thank anonymous reviewers for their constructive comments.

Conflicts of Interest

The authors declare no conflict of interest.

References

  1. Armaghani, D.J.; Bayat, V.; Koopialipoor, M.; Pham, B.T. Investigating the effect of jointed environment on the cracked concrete arch dam in 3D conditions using FEM. Bull. Eng. Geol. Environ. 2021, 80, 55–70. [Google Scholar] [CrossRef]
  2. de Granrut, M.; Simon, A.; Dias, D. Artificial neural networks for the interpretation of piezometric levels at the rock-concrete interface of arch dams. Eng. Struct. 2019, 178, 616–634. [Google Scholar] [CrossRef]
  3. Fernandes, I. Role of granitic aggregates in the deterioration of a concrete dam. Bull. Eng. Geol. Environ. 2015, 74, 195–206. [Google Scholar] [CrossRef]
  4. Fishman, Y.A. Features of shear failure of brittle materials and concrete structures on rock foundations. Int. J. Rock. Mech. Min. Sci. 2008, 45, 976–992. [Google Scholar] [CrossRef]
  5. Fishman, Y.A. Stability of concrete retaining structures and their interface with rock foundations. Int. J. Rock. Mech. Min. Sci. 2009, 46, 957–966. [Google Scholar] [CrossRef]
  6. Kebab, H.; Boumezbeur, A.; Rivard, P. Rock mass properties and their suitability as a foundation for a rolled compacted concrete gravity dam: Case study of Beni Haroun dam (Mila, NE Algeria). Bull. Eng. Geol. Environ. 2021, 80, 1729–1743. [Google Scholar] [CrossRef]
  7. Rui, Y.C.; Zhou, Z.L.; Lu, J.Y.; Barkat, U.; Cai, X. A Novel AE Source Localization Method Using Clustering Detection to Eliminate Abnormal Arrivals. Int. J. Min. Sci. Technol. 2022, 32, 51–62. [Google Scholar] [CrossRef]
  8. Cheng, R.; Cheng, R.; Chen, W.; Hao, H.; Li, J. Dynamic Response of Road Tunnel Subjected to Internal Boiling Liquid Expansion Vapour Explosion (BLEVE). Tunn. Undergr. Space Technol. 2022, 123, 104363. [Google Scholar] [CrossRef]
  9. Wang, S.F.; Tang, Y.; Wang, S.Y. Influence of brittleness and confining stress on rock cuttability based on rock indentation tests. J. Cent. South. Univ. 2021, 28, 2786–2800. [Google Scholar] [CrossRef]
  10. Rui, Y.C.; Zhou, Z.L.; Cai, X.; Dong, L.J. A Novel Robust Method for Acoustic Emission Source Location Using DBSCAN Principle. Measurement 2022, 191, 110812. [Google Scholar] [CrossRef]
  11. Yang, J.C.; Liu, K.W.; Li, X.D.; Liu, Z.X. Stress initialization methods for dynamic numerical simulation of rock mass with high in–situ stress. J. Cent. South. Univ. 2020, 27, 3149–3162. [Google Scholar] [CrossRef]
  12. Selçuk, L.; Aşma, D. Experimental investigation of the rock–concrete bi materials influence of inclined interface on strength and failure behavior. Int. J. Rock. Mech. Min. Sci. 2019, 123, 104119. [Google Scholar] [CrossRef]
  13. Song, Z.Y.; Konietzky, H.; Herbst, M. Three–dimensional particle model based numerical simulation on multi–level compressive cyclic loading of concrete. Constr. Build. Mater. 2019, 225, 661–677. [Google Scholar] [CrossRef]
  14. Zhao, B.Y.; Liu, Y.; Huang, T.Z.; Wang, X.P. Experimental study on strength and deformation characteristics of rock–concrete composite specimens under compressive condition. Geotech. Geol. Eng. 2019, 37, 2693–2706. [Google Scholar] [CrossRef]
  15. Greco, O.; Ferrero, A.M.; Oggeri, C. Experimental and analytical interpretation of the behaviour of laboratory tests on composite specimens. Int. J. Rock. Mech. Min. Sci. 1993, 30, 1539–1543. [Google Scholar] [CrossRef]
  16. Li, J.G.; Yu, Z.Q.; Zhou, Z.Y.; Wang, Y.C.; Li, J.W. Mechanical analysis and failure modes prediction of composite rock under uniaxial compression. Sci. Rep. 2021, 11, 22826. [Google Scholar] [CrossRef]
  17. Bista, D.; Sas, G.; Johansson, F.; Lia, L. Influence of location of large–scale asperity on shear strength of concrete–rock interface under eccentric load. J. Rock Mech. Geotech. 2020, 12, 449–460. [Google Scholar] [CrossRef]
  18. Saiang, D.; Malmgren, L.; Nordlund, E. Laboratory tests on shotcrete–rock joints in direct shear, tension and compression. Rock Mech. Rock Eng. 2005, 38, 275–297. [Google Scholar] [CrossRef]
  19. Shen, P.W.; Tang, H.M.; Ning, Y.B.; Xia, D. A damage mechanics based on the constitutive model for strain–softening rocks. Eng. Fract. Mech. 2019, 216, 106521. [Google Scholar] [CrossRef]
  20. Zhao, W.S.; Chen, W.Z.; Zhao, K. Laboratory test on foamed concrete–rock joints in direct shear. Constr. Build. Mater. 2018, 173, 69–80. [Google Scholar] [CrossRef]
  21. Chang, X.; Lu, J.Y.; Wang, S.Y.; Wang, S.R. Mechanical performances of rock–concrete bi–material disks under diametrical compression. Int. J. Rock. Mech. Min. Sci. 2018, 104, 71–77. [Google Scholar] [CrossRef]
  22. Chang, X.; Guo, T.F.; Lu, J.Y.; Wang, H. Experimental study on rock–concrete joints under cyclically diametrical compression. Geomech. Eng. 2019, 17, 553–564. [Google Scholar]
  23. Dong, W.; Song, S.Z.; Zhang, B.S.; Yang, D. SIF–based fracture criterion of rock–concrete interface and its application to the prediction of cracking paths in gravity dam. Eng. Fract. Mech. 2019, 221, 106686. [Google Scholar] [CrossRef]
  24. Qiu, H.; Zhu, Z.M.; Wang, M.; Wang, F.; Luo, C.S.; Wan, D.Y. Study of the failure properties and tensile strength of rock–mortar interface transition zone using bi–material Brazilian discs. Constr. Build. Mater. 2020, 236, 117551. [Google Scholar] [CrossRef]
  25. Zhou, Z.L.; Lu, J.Y.; Cai, X. Static and dynamic tensile behavior of rock–concrete bi–material disc with different interface inclinations. Constr. Build. Mater. 2020, 256, 119424. [Google Scholar] [CrossRef]
  26. Dong, W.; Wu, Z.M.; Zhou, X.M.; Wang, N.; Kastiukas, G. An experimental study on crack propagation at rock–concrete interface using digital image correlation technique. Eng. Fract. Mech. 2017, 171, 50–63. [Google Scholar] [CrossRef]
  27. Javanmardi, F.; Léger, P.; Tinawi, R. Seismic structural stability of concrete gravity dams considering transient uplift pressures in cracks. Eng. Struct. 2005, 27, 616–628. [Google Scholar] [CrossRef]
  28. Andjelkovic, V.; Pavlovic, N.; Lazarevic, Z.; Nedovic, V. Modelling of shear characteristics at the concrete–rock mass interface. Int. J. Rock. Mech. Min. Sci. 2015, 76, 222–236. [Google Scholar] [CrossRef]
  29. Tian, H.M.; Chen, W.Z.; Yang, D.S.; Yang, J.P. Experimental and numerical analysis of the shear behaviour of cemented concrete–rock joints. Rock Mech. Rock Eng. 2015, 48, 213–222. [Google Scholar] [CrossRef]
  30. Chavez, J.W.; Fenves, G.L. Earthquake analysis of concrete gravity dams including base sliding. Earthq. Eng. Struct. Dyn. 1995, 24, 678–686. [Google Scholar] [CrossRef]
  31. Liu, X.S.; Tan, Y.L.; Ning, J.G.; Lu, Y.W.; Gu, Q.H. Mechanical properties and damage constitutive model of coal in coal–rock combined body. Int. J. Rock. Mech. Min. Sci. 2018, 110, 140–150. [Google Scholar] [CrossRef]
  32. Lemaitre, J. Evaluation of dissipation and damage in metals submitted to dynamic loading. In Proceedings of the 1st International Conference on Mechanical Behavior of Materials, Kyoto, Japan, 15–20 August 1971. [Google Scholar]
  33. Abu Al-Rub, R.K.; Kim, S.-M. Computational applications of a coupled plasticity–damage constitutive model for simulating plain concrete fracture. Eng. Fract. Mech. 2010, 77, 1577–1603. [Google Scholar] [CrossRef]
  34. Ren, X.; Li, J. A unified dynamic model for concrete considering viscoplasticity and rate–dependent damage. Int. J. Damage Mech. 2013, 22, 530–555. [Google Scholar] [CrossRef]
  35. Lemaitre, J. A continuous damage mechanics model for ductile fracture. J. Eng. Mater. Technol. 1985, 107, 83–89. [Google Scholar] [CrossRef]
Figure 1. Seven types of specimens.
Mathematics 10 00727 g001
Figure 2. Test system: (a) Uniaxial compression testing system; (b) Schematic diagram of strain gauge sticking method.
Mathematics 10 00727 g002
Figure 3. Failure patterns of different types of specimens.
Mathematics 10 00727 g003
Figure 4. Stress−strain curves of the whole specimens.
Mathematics 10 00727 g004
Figure 5. Strain variation of rock part in CRR–1.
Mathematics 10 00727 g005
Figure 6. Stress−strain curves of the pure concrete specimen and concrete parts.
Mathematics 10 00727 g006
Figure 7. Variations of the strength and the strain at peak stress of concrete and concrete parts.
Mathematics 10 00727 g007
Figure 8. AE counts and cumulative AE counts of tested specimen versus strain.
Mathematics 10 00727 g008aMathematics 10 00727 g008b
Figure 9. Damage constitutive model for concrete part.
Mathematics 10 00727 g009
Figure 10. Comparison of experimental data and calculated stress–strain curves by using established statistical damage constitutive model.
Mathematics 10 00727 g010
Figure 11. Variation of loading damage variable D of concrete parts versus strain.
Mathematics 10 00727 g011
Table 1. Concrete mix proportions.
ConstituentAmount (kg/m3)
Cement (Portland 42.5R)336
Water226
Fine aggregate791
Coarse aggregate1036
Table 2. Combination forms and concrete–rock height ratio.
Specimen LabelLithologyConcrete–Rock Height Ratio
CConcrete1:0
RRRed sandstone0:1
PRPurple sandstone0:1
GRGranite0:1
CRRConcrete–Red sandstone1:1
CPRConcrete–Purple sandstone1:1
CGRPurple–Granite1:1
Table 3. Uniaxial compressive strength (MPa).
Specimen LabelNo. 1No. 2No. 3No. 4No. 5Average
C34.2433.2133.68//33.71
RR77.7377.4374.34//76.50
PR110.45111.56107.03//109.68
GR167.50168.60162.71//166.27
CRR37.3530.5235.5138.11/36.99
CPR43.2142.7333.5837.2944.3143.42
CGR44.7146.8730.7847.28/46.29
Table 4. Fitting and related physical mechanical parameters for damage constitutive model.
Specimen (C in)namεe (10−3)EC (GPa)
C34.2433.2133.68//
RR77.7377.4374.34//
PR110.45111.56107.03//
GR167.50168.60162.71//
CRR37.3530.5235.5138.11/
CPR43.2142.7333.5837.2944.31
CGR44.7146.8730.7847.28/
Publisher’s Note: MDPI stays neutral with regard to jurisdictional claims in published maps and institutional affiliations.

