Article

Predictive Modeling of Short-Term Rockburst for the Stability of Subsurface Structures Using Machine Learning Approaches: t-SNE, K-Means Clustering and XGBoost

1
School of Resources and Safety Engineering, Central South University, Changsha 410083, China
2
Department of Mining Engineering, Institute Technology of Bandung, Bandung 40132, Indonesia
*
Author to whom correspondence should be addressed.
Mathematics 2022, 10(3), 449; https://doi.org/10.3390/math10030449
Submission received: 15 December 2021 / Revised: 23 January 2022 / Accepted: 24 January 2022 / Published: 30 January 2022

Abstract

:
Accurate prediction of short-term rockburst has a significant role in improving the safety of workers in mining and geotechnical projects. The rockburst occurrence is nonlinearly correlated with its influencing factors that guarantee imprecise predicting results by employing the traditional methods. In this study, three approaches including including t-distributed stochastic neighbor embedding (t-SNE), K-means clustering, and extreme gradient boosting (XGBoost) were employed to predict the short-term rockburst risk. A total of 93 rockburst patterns with six influential features from micro seismic monitoring events of the Jinping-II hydropower project in China were used to create the database. The original data were randomly split into training and testing sets with a 70/30 splitting ratio. The prediction practice was followed in three steps. Firstly, a state-of-the-art data reduction mechanism t-SNE was employed to reduce the exaggeration of the rockburst database. Secondly, an unsupervised machine learning, i.e., K-means clustering, was adopted to categorize the t-SNE dataset into various clusters. Thirdly, a supervised gradient boosting machine learning method i.e., XGBoost was utilized to predict various levels of short-term rockburst database. The classification accuracy of XGBoost was checked using several performance indices. The results of the proposed model serve as a great benchmark for future short-term rockburst levels prediction with high accuracy.

1. Introduction

Rockburst is an abrupt and violent failure of the rock mass that results in personnel injury and economic loss in underground rock excavations [1,2]. It is generally believed that because of the sudden release of stored elastic energy, rockburst causes an adverse phenomenon of ejecting, spalling, slabbing, and bursting at a high speed in a very short time, which greatly endangers worker safety and also damages field equipment and established structures [3,4]. Rockburst has been a serious threat to many engineering projects (i.e., mining and geotechnical) around the globe. In China, with the extensive depth of underground coal mines and underground rock excavations [5], the rockburst hazard is becoming more severe and frequent for rock engineering [3,4]. Rockburst has been widely reported in several countries around the globe. Likewise, in Canada, rockburst cases are reported in more than 15 mines [6]. From 1936 to 1993, the United States documented more than 172 rockburst cases in which more than 78 fatalities and 158 injuries occurred [6,7]. Despite reducing the mining activities, Germany still documented rockbursts from 1983 to 2007, and some serious injuries and deaths were delineated in more than 40 cases [8]. China, as the current world’s largest coal producer, is facing a linear increase in rockburst cases with the increase of coal production from underground mining. According to Zhang et al. [9], over 100 Chinese coal mines have recorded rockburst disasters. Despite the fact that many prevention and control exertions have been undertaken, the rockburst disaster still remains an unsolved universal issue for underground rock excavations.
A large amount of experimental research is now being undertaken with the goal of better understanding the mechanical behavior of rock mass under various engineering situations [10,11,12] The rockburst mechanism, types, and some useful control measures are also proposed following theoretical analysis, field studies, and laboratory tests [13]. In addition, some updated monitoring methods including microgravity, microseismic and geological radar are implemented for monitoring and forecasting the rockburst danger [14]. These methods can monitor and forecast the rockburst danger before it occurs. Nevertheless, the accurate determination of rockburst prediction is still a strenuous challenge because it has several influencing factors including rock properties, geological conditions, stress levels, and energy accumulation [9]. Rockburst prediction is classified into two categories: short-term rockburst prediction and long-term prediction [8]. Short-term rockburst prediction is usually followed by installing on-site monitoring systems, i.e., electromagnetic radiation, microseismic, infrared radiations, and microgravity methods [6]. By analyzing and monitoring the microseismic wave released during rock fracturing, some precursory features of rockbursts were discovered that were helpful for the prediction of rockburst. The microseismic indicators that are commonly used for rockburst prediction are the energy indicator [15], the events number [16], the b value which is defined as the slope of the commutative hit with respect to the amplitude [17], and apparent volume [18]. Conversely, the long-term rockburst prediction can be estimated by following rockburst potential and field conditions. Various predictive indicators are recommended by the researchers for the prediction of rockburst potential, e.g., strain energy storage index ( W et ) proposed by [19], defined as the ratio of stored strain energy ( W sp ) to dissipated strain energy ( W st ). Wattimena et al. [20] considered an elastic strain energy density as a measuring indicator of rockburst potential. Altindag [21] introduced the rock brittleness coefficient as a burst liability index that is defined as the ratio of uniaxial compressive stress (UCS) to tensile stress ( σ t ). According to Wang and Park. [22], the tangential stress criterion defined as the ratio between tangential stress ( σ θ ), and UCS of rock mass ( σ c ) is another useful index to quantify the risk of rockburst. The rockburst occurrence is generally influenced by many factors that may include rock properties, stress domination, groundwater conditions, excavation methods, etc. The rockburst intensity is nonlinearly correlated with the influencing factors [23] that guarantee imprecise predicting results by employing the traditional methods [24]. Hence, soft computing methods have been recently implemented in monitoring and predicting the dynamic disaster of rockburst.
With the growth in the use of computers in applied sciences over the past few years, machine learning methods are adopted for predicting the rockburst risk more effectively. Researchers have recommended several machine learning methods. For example, Wojtecki et al. [25] applied a variety of algorithms, i.e., decision tree (DT), random forest (RF), gradient boosting (GB), and artificial neural network (ANN), to evaluate the rockburst in the upper Silesian coal basin, Poland. A convolutional neural network (CNN) based data-driven model was built by Zhao et al. [26] and the performance of the model was then compared with the traditional neural network. Zhao et al. [1] recommended a model for rockburst prediction by implementing a DT model on microseismic monitoring data. Various classification models were adopted to predict the occurrence and intensity of rockburst in the form of distinct data-driven classification problems [27]. Zhou et al. [28] classified a long-term rockburst by adopting support vector machine (SVM) model and their results were recommended for underground rocks excavation. A study was conducted on predicting the rockburst intensity by applying an extreme learning machine (ELM). Furthermore, a particle swarm optimization (PSO) model was implemented to optimize the hidden layer bias and input weight matrix [29]. Li et al. [30] established a hybrid model (KPCA-APSO-SVM), that was based on three different models including kernel principal component analysis (KPCA), the adaptive-PSO, and SVM. Several influencing parameters, i.e., the ratio of tangential stress ( σ θ ) to UCS ( σ c ), the ratio of UCS ( σ c ) to the tensile stress ( σ t ) and strain energy storage index ( W et ) were taken as input parameters and the results depicted that the KPCA-APSO-SVM model has strong reliability in rock burst prediction. In order to predict and categorize the sensitivity of rockburst, multivariate adaptive regression splines (MARS) and deep forest algorithms were applied [31]. Additionally, the dimensional reduction and visualization of input features were carried out by t-SNE. Zhou et al. [32] studied and compared the forecasting outcomes of 12 different machine learning algorithms in long-term rockburst prediction. A C5.0 DT algorithm has been used as the main classifier for rockburst classification and evaluation [33]. A locally weighted C4.5 DT algorithm has also been introduced for predicting the risk of rockburst in coal mines [34]. Ahmad et al. [35] investigated the potential of J48 and random tree algorithms to predict the rockburst classification levels. Wang et al. [36] developed a bagging and boosting tree-based ensemble technique to predict rockburst disasters in hard rock mines. Pu et al. [37] adopted SVM to evaluate the rockburst liability in Kimberlite diamond mine. Pu et al. [24] studied the long-term rockburst predictivity using an unsupervised learning method and SVM at Kimberlite diamond mine. Sun et al. [3] has proposed a RF and firefly algorithm (FA) based ensemble classifier to attain an optimal rockburst prediction model.
So far, the above-mentioned literature revealed that rockburst risk is investigated using different supervised and DT approaches. Almost all studies have been conducted on long-term rockburst prediction and classification, whereas few among them have focused on investigating short-term rockburst. Liang et al. [38] evaluated the predictability of short-term rockburst using microseismic data obtained from the tunnels of Jinping-II hydropower project in China. Several ensemble learning algorithms including RF, adaptive boosting (AdaBoost), gradient boosting decision tree (GBDT), XGBoost, and light gradient boosting machine (LightGBM) have been evaluated and, among them, the RF and GBDT have shown good performance. Zhou et al. [39] considered the predictive performance of the stochastic gradient boosting (SGB) approach in the prediction of rockburst. Feng et al. [40] employed an optimized probabilistic neural network (PNN) on microseismic monitoring data to forecast the rockburst risk. The model was modified by combining the mean impact value algorithm (MIVA), the modified firefly algorithm (MFA), and PNN (MIVA-MFA-PNN model). Ji et al. [41] developed a genetic algorithm (GA) and SVM based model (GA-SVM) to analyze microseismic data to predict rockburst occurrence. Table 1 depicts the traditional supervised machine learning approaches proposed by the researchers for predicting rockburst. The traditional supervised classification algorithms have major limitations in complex phenomena such as rockburst potential due to the difficulty of obtaining a large number of good quality labeled samples. One interesting contender for overcoming this issue is a combination with an unsupervised technique to enhance the results of a classification algorithm.

2. Significance of the Study

In reality, the predictive characteristics of rockburst levels are not constant throughout many geotechnical and geomechanical engineering domains. Despite the fact that numerous diverse results are attained in the broad anatomies of rockburst prediction, the underlying influence of each uncertainty level remains unknown. There is currently no accurate method for anticipating the complex phenomena, i.e., short-term rockburst intensity levels. This paper provides a three-step mechanism for predicting the intensity level of short-term rockburst as follows:
(1)
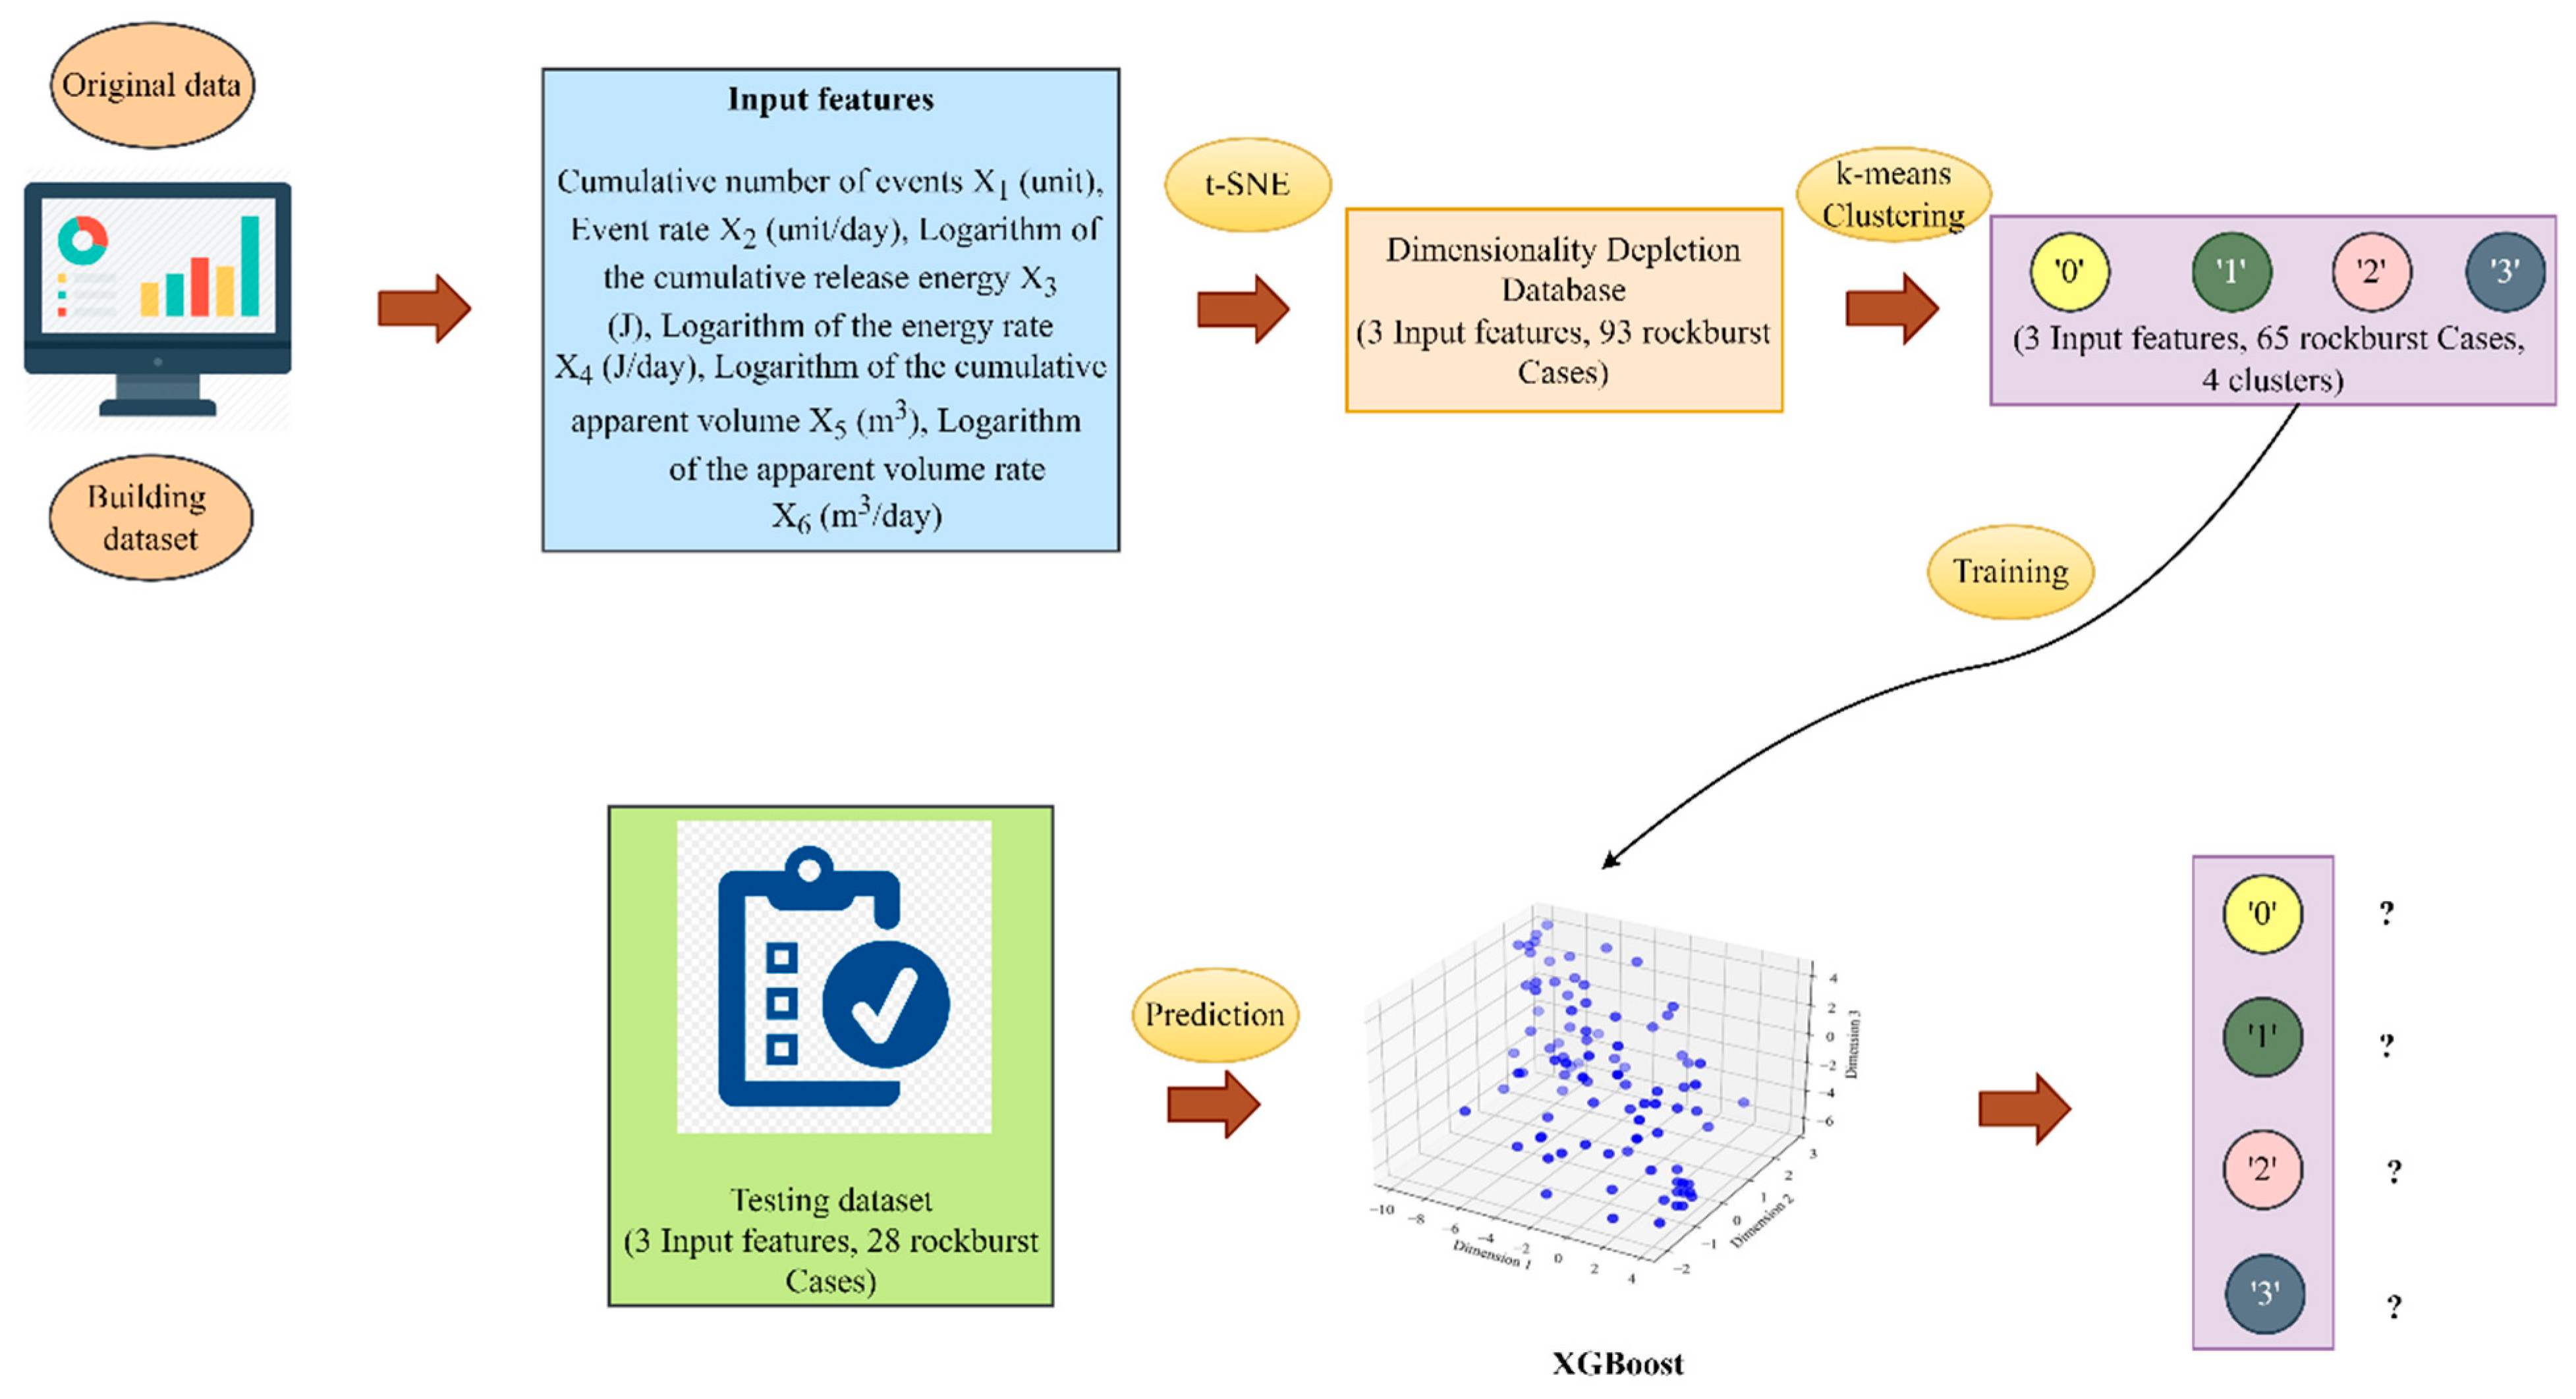
To begin, a cutting-edge data depletion process called t-distributed stochastic neighbor embedding (t-SNE) was developed to lessen the magnification of original rockburst database;
(2)
Second, an unsupervised machine learning, namely K-means clustering, was used to classify the t-SNE dataset in order to reduce the inconsequential spectral dissimilarity effect in homogeneous localities;
(3)
Finally, XGBoost, a supervised gradient boosting machine learning algorithm, has been developed to forecast various levels of short-term rockburst database. Figure 1 depicts a flowchart of this work.

3. Material and Methods

3.1. Data Acquisition

In order to build the database of this work, a total of 93 short-term rockburst patterns with six influential features were collected from genuine microseismic monitoring events of the Jinping-II hydropower project in China [47]. The dataset used in this paper has been taken from the work of Liang et al. [38] based on the dataset provided by Feng et al. [47]. The rockburst intensity has been classified into four levels, i.e., no rockburst level (0) depicts that the rock specimens has no significant fracture on the free face, slight rockburst level (1) elucidates small specimen with minor fragment displacement and kinetic energy release, moderate rockburst level (2) shows the block spalling of the rock mass in the diverticulum and roadway wall whereas violent rockburst level (3) represent massive rock mass spalling, promptly distorting the surrounding rock mass. Figure 2 shows the distribution of various rockburst levels in this study.
From Table 2, it is clear that six influential features are designated in this study. In order to make the execution more appropriate, the values of X 3 , X 4 , X 5 and X 6 are selected in logarithmic scale. The main aim of the log function is to respond to the skewness toward large values in rockburst database.
The box plot of each feature for the four rockburst levels is shown in Figure 3. From Figure 3, it is depicted that the rockburst is positively correlated with each feature. The larger values of features indicate the higher level of rockburst. Moreover, some outliers are present in the entire features of short-term rockburst dataset under each corresponding rockburst level, which shows the complexity of rockburst phenomenon. Hence, the effect of all the features is incorporated in this study to enhance the overall accuracy of rockburst database.

3.2. SNE Based t-SNE Algorithm

Hinton and Roweis [48] developed an enhanced stochastic neighbor embedding (SNE) based t-SNE algorithm.
The SNE operates in the following two steps: (1) Firstly, the SNE permutes the distance between points (data points) to a conditional probability in high-dimensional space attributing their resemblance. (2) Lastly, the SNE matches that conditional probability (probability of points in high-dimensional space) to the conditional probability of other points (map points) in low-dimensional space [49].

3.3. K-Means Clustering

Clustering analysis has been the best choice to avoid artificial division and supervision. In clustering, a dataset is generally grouped by a similar number and keeps the higher similarity in each group. The division of the dataset has happened according to the distance between the data points. Furthermore, the similarity and dissimilarity criteria also have an important role in the data division process. An unsupervised machine learning approach called K-means clustering [50,51] has wide and significant applications in dividing n observations into K clusters. Each observation in K-means clustering is related to the cluster with the nearby mean. The working principle of the algorithm consists of two dispersed phases. The first phase selects the K centers randomly with an already selected value of K, while the second phase collects each data object in the vicinity of the nearest center [52]. The most widely employed clustering criterion is known as the sum of the squared Euclidean distances. The main focus of this criterion is to measure the distance between each data point and cluster center [53].

3.4. Extreme Gradient Boosting (XGBoost)

XGBoost is abbreviated as extreme gradient boosting, which is an ensemble learning algorithm of machine learning techniques [54]. It includes simple classification and regression trees (CARTs) by integrating statistical boosting methods. Boosting improves the estimation precision of the model by constructing multiple trees as an alternative to constructing a single tree, and then combining them to build a consensus prediction framework [55]. XGBoost generates the tree by consecutively employing the residuals of past trees as contributions to the resultant tree. As such, the resulted tree develops the overall prediction by showing the errors of the past trees. At the point when the loss function is minimal, this consecutive model structure interaction can be articulated as a kind of gradient descent that advances the prediction by emerging another tree at each stage to ultimately decrease the fall [56]. The expansion of the new tree halts when the pre-determined most extreme number of trees is reached, or when the training error cannot be raised to a pre-indicated number of consecutive trees. Both the estimation precision and execution promptness of gradient boosting can be greatly enhanced by including random sampling; this comprehensive approach is designated probabilistic boosting [57]. In particular, for each tree in alignment, an irregular subsample of the training data is taken from the complete set of training data, excluding substitution. This irregularly specified subsample is then applied instead of the complete sample to appropriate the tree and determine the update of the model. XGBoost is an upgraded decentralized gradient boosting that can accomplish state-of-the-art prediction exhibitions [54]. XGBoost employs second-order estimation of the loss function, which is faster to combine than conventional GBMs. XGBoost has been effectively applied to mine gene articulation data [58]. The general architecture of XGBoost is depicted in Figure 4.

3.5. Hyperparameter Tunning

The hyperparameter in the machine learning algorithms need to be optimized. These hyperparameters should be calibrated contingent on the data in reference to defining it manually. As the short-term rock burst dataset is limited, we employed the cross-validation method based on normalizing data. Several cross-validation methods are applied by the researchers to optimize the hyperparameter.
Choubineh et al. [59] proposed the splitting of data into training, validation, and testing datasets to authenticate the machine learning algorithm. The validation dataset is employed to optimize the hyperparameters, whereas training on test datasets and training datasets are applied to evaluate the final performance of the model [59]. Nevertheless, a single contingent splitting of the data on various subsets is inadequate for ideal model evaluation because of the non-linearity of the datasets. If other contingent splitting is employed, it will compute the other values for performance indicators. The single splitting of data is only logical in large data set circumstances.
Among the hyperparameter tunning methods, the other most common method is the k-fold technique. In the k-fold method, the whole data is divided into k segments, then the first segment is employed for testing the execution of machine learning algorithms following training the data on the supplementary k-1 segment. Afterward, the second segment is taken for testing and the remaining data is employed as a training dataset. In the last different values of performance metrics are computed for all the k-fold. Hence cross-validation assists in attaining the average and standard deviation values of the metrics.
The random permutation method is also employed as hyperparameter optimization. This method involves irregular splitting of the data into training and testing datasets, after which the data is reorganized, and a new splitting of training and testing datasets is attained. This technique is repeated for n number of times and at every turn metrics are computed. Correspondingly, in the last, the average and standard deviation values of the metrics are calculated. Hence cross-validation not only computes the performance criteria for the testing dataset but accomplishes it multiple times by employing autonomous data to divide it into training and testing datasets. As in our case, the data is limited, so cross-validation was employed multiple times. The algorithm of 5-folds cross validation is shown in Algorithm 1. The grid search CV has been used to build the model, evaluate its performance, and make the short-term rockburst prediction level.
Algorithm 1: 5-folds XGBoost cross validation
InputI(t), I(t1) ∈ I(t): Initial Dataset
Extreme Gradient Boosting (XGBoost): Decision Algorithm
L: Loss Function
5: Fold Number
Step 1U1 ⊕ U2 ⊕ ….. T
U1 + U2 + ….. T
⇔ Ui ∩ …..
Step 2for I from 1 to 10 do
Step 3Fi = XGBoost(T/Ui)
Step 4for S(Ai) in Ui do
Step 5ej = L(Fi, S(Ai)
Step 6End for
Step 7End for
Step 8Returne

3.6. Grid Search CV

A comprehensive grid search was followed for hyperparameter tunning [60]. This method authorizes search within specified hyperparameters range and describes the best value which results in the optimum value of evaluation criterion. GridSearchCV() has been implemented in scikit-learn python programing language in order to compute this method. This technique purely computes the cross validation (CV) score for all hyperparameter combinations in a specific range. The flowchart of algorithm’s parameters optimization using grid search is shown in Figure 5. GridSearchCV() not only permits calculation of the optimal hyperparameter but also estimates the metric to its best value. In our case, all the other parameters of the python programing language were used as a default in order to implement Grid Search CV.

4. Result and Discussion

4.1. Rockburst Database Reduction Using t-SNE

Consider that the data points r p and r q in rockburst dataset select their corresponding neighbors based on conditional probability, shown as S q | p in Equation (1) [49,61]. The Gaussian kernel is used to define conditional probability.
S q | p = { exp ( | | r p r q | | 2 / 2 σ p 2 ) k p exp | | r p r k | | 2 / ( 2 σ p ) 2   0   p = q     whereas   p     q
whereas | | r q r p | | represents the Euclidean distance between data points r p and r q while σ p shows the Gaussian distribution variance choosing r p as the center position, which is established by binary search by employing the mechanism of perplexity. The perplexity is given in Equation (2).
Perp ( S p ) = 2 E ( S p )
where E ( S p ) is the Shannon entropy of S p computed in bits and S p induces a probability distribution for any value of σ p . The E ( S p ) is given in Equation (3).
E ( S p ) = S q | p log 2 S q | p
Assume that b p and b q are allocated in a low dimension that are resembled to r p and r q in the high dimension. It is possible to compute a similar conditional probability ( T q | p ) for the map points b p and b q in low-dimensional (corresponding to the datapoints r p and r q in high-dimensional space). In this case, the Gaussian distribution is stated as 1 2 . Succeeding the resemblance of S q | p of r q to r p is given in Equation (4).
T q | p = { exp ( | | b p b q | | 2 ) k p   exp ( | | b p b k | | 2 ) 0   p = q             p q
If dimensionality depletion outcome is satisfactory, then the resemblance in high dimensionality space is assumed to be identical to that in low dimensionality in S q | p = T q | p . When the conditional uncertainty between r p and all other points are examined, the conditional uncertainty distribution S q can be established. Correspondingly, the identical uncertainty distribution T q is established as S q low dimensionality space. To measure the resemblance between two points, the Kullback–Leibler divergence is employed. Hence, a cost function J is established as shown in Equation (5).
J = p KL ( S p | | T p ) = p q S q | p log S q | p T q | p
In Equation (5), the distribution of conditional probabilities of data point r p and map point b p over other data points, and map points are represented as S p and T p , respectively. The SNE is amended to t-SNE with the addition of two major improvements [62]. Firstly, for pairwise estimation of likenesses in both low and high-dimensional spaces, the symmetric version of SNE is introduced. The improved t-SNE for data points r p and r q is depicted in Equation (6).
S pq = S q | p + S p | q 2 n
By employing the symmetric property ( S pq = S qp ), the data point r p will have the probability to pick the data point r q as its neighbor, where n shows total data points. Secondly, the Gaussian kernel is replaced by the t-distribution to evaluate the likeliness between the map points. More precisely, the t-SNE uses a heavy-tailed t-distribution for b p and b q (map points) in low-dimensional space. This process takes place with 1 degree of freedom, then the T pq can be obtained by using Equation (7):
T pq = 1 + ( | | r p r q | | 2 ) 1 k l ( 1 + | | r k r l | | 2 ) 1
To make it more precise, the comprehensive mechanism of t-SNE is given as:
  • Stage 1: Get data S = S 1 , S 2 , S 3 , …, S n in high dimension region, and give the dimensionality reduction consequences as B ( T ) = T 1 , T 2 , T 3 , …, T n ;
  • Stage 2: Compute perplexity, and assign iteration times T , momentum of α ( t ) and learning rate η ;
  • Stage 3: Calculate S p | q as given in Equation (1);
  • Stage 4: Estimate S pq as depicted in Equation (7);
  • Stage 5: Arbitrarily choose Y with N ;
  • Stage 6: Compute T pq as stated in Equation (7), estimate the gradient as stated in Equation (9);
  • Stage 7: Finally repeat the stage 6 so that the iteration number is remarkable than T .
The Jupyter notebook has been utilized using Scikit-learn module in order to accomplish the t-SNE. In the first stage, the rockburst database is visualized from high-resolution amplitude to low-resolution amplitude. The initial rockburst dataset is tabulated into four clusters. In this study, the event related features, i.e., the cumulative number of events X 1 (unit) and event rate X 2 (unit/day) are considered in the first group (Dimension 1). The energy associated features including the logarithm of the cumulative release energy X 3 (J) and the logarithm of the energy rate X 4 (J/day) are categorized in the second group (Dimension 2). The apparent volume related features, i.e., the logarithm of the cumulative apparent volume X 5 ( m 3 ) and the logarithm of the apparent volume rate X 6 ( m 3 /day) are collected in the third group (Dimension 3). In order to reflect the initial rockburst dataset, the learning rate = 100 is executed with the Matplotlib in the Python programming language (all the other parameters are kept as a default). Following the rockburst data dimensionality reduction technique, the feature established amplitude was formed in such a way that the initial rockburst database may keep the originality to high scalability. The rockburst dataset after the dimensionality reduction is depicted in Figure 6. After the adoption of the t-SNE mechanism, the actual rockburst dataset (93 × 6 matrix) is renovated to a (93 × 3) matrix, as revealed in Table 3. Figure 6 demonstrates a low-resolution amplitude visualization of the rockburst dataset following the t-SNE data reduction mechanism.

4.2. K-Means Clustering on t-SNE Based Rockburst Database

In K-means clustering, the completion of early rockburst level grouping occurs when all the data objects are appended in some clusters and the average of the primitive clusters is then recalculated. This iteration happens many times until the criterion function is reduced to its minimum. Based on the target object r and average of cluster J i that is r i , the criterion function can be obtained using an Equation (8) [63]:
C = i = 1 k r J i k   | r r i | 2
where C indicates the sum of squared error of all objects in the database. In this study, to compute the adjacent distance between data points and cluster center, the Euclidean distance is considered as a criterion function. The Euclidean distance between one vector r = ( r 1 , r 2 , r n ) and another vector s = ( s 1 , s 2 , … s n ), the Euclidean distance D( r i , s i ) can be obtained by the following Equation (9):
D ( r , s ) = [ i = 1 n ( r i s i ) ] 1 / 2
The Jupyter notebook has been utilized using Scikit-learn module in order to accomplish the K-means clustering. Rousseeuw [64] have established the generalization of the cluster monitoring. Silhouette mechanism is contingent on balancing the objects tightness and separation. The silhouette coefficient can show that the t-SNE data is grouped in a good manner reflecting that the objects are organized into the groups that they match. This is an index to evaluate that the authentication of the clustering to be used for selecting the optimal k in the cluster. Based on the four different rockburst levels, we assume the number of clusters = 4 for K-means clustering. Several iterations stages were computed in this study as shown in Figure 7. Various studies have shown that a silhouette coefficient of more than 0.5 is an acceptable model for K-means clustering [65,66,67,68]. The silhouette coefficient of 0.53 shows that the clusters was reliable following 10th iteration in the t-SNE obtained short-term rockburst dataset.

4.3. Extreme Gradient Boosting (XGBoost) Prediction Model

Consider v m ¯ as the forecasted rockburst prediction level result of the nth number of data for which the characteristics vector is U n ; P denotes the number of estimators, with q s ( s ranging from 1 to P ) corresponding to individual tree anatomy; and v n 0 denotes the preliminary assumption that is the average of the measured characteristics in the learning information. To forecast the results, Equation (10) uses a variety of expansion functions.
v m ¯ = v n 0 + γ   s = 1 P q s ( U n )
whereas γ is the learning rate, which is included to better model implementation, execute rhythmically while connecting the most recent tree, and avoid overfitting.
In Equation (9), a character S th is linked to the model at the S th state, and the S th forecasted value v n s is implemented from the preceding state forecasted value v n ( s 1 ) , and the augmented q s of the character of the attached S th character is illustrated in Equation (11).
v n s = v n ( s 1 ) + γ   q s
whereas q s represents the weight of leaves created by decreasing the objective function of the S th tree
obj = η K + α = 1 K [ T α β α + 1 2 ( L α + μ ) β α 2 ]
wherein K indicates the leaves of the S th tree and β α represents the weight of the leaves from 1 to K , η and μ are the uniformity characteristics that are used to apply the coherence to the anatomy in order to avoid the model overfitting. The parameters L α and T α represent the sum of all data associated with a leaf of the previous and subsequent loss function gradients, respectively.
A single leaf is divided into distinct numeration leaves in order to form the S th tree. The anatomy of using the gain settings is seen in Equation (13). Consider the interdependent right leaf R C and B C and the interdependent left leaf R W and B W achieving the divergence. The diverging benchmark is generally assumed when the gain parameter is close to zero. The uniformity characteristics and are periphrastically susceptible on the gain attribute, i.e., a greater regularization parameter will result in a lower gain parameter, which will prevent the slope of the leaf from converging. However, it will reduce the framework’s capacity to adapt to the rockburst training dataset.
gain = 1 2   [ R W 2 B W + μ + R C 2 B C + μ + ( R W + R C ) 2 B W + B C + μ ]
In order to forecast the rockburst intensity level, a gradient boosting machine learning algorithm has been applied on the k-means clustering dataset. It was noted that employing an entire dataset to train the XGBoost model may arise the over-fitting issues. More specifically, the framework may adjust magnificently in addition to the dataset that employed for the training stage, but it is unable to predict new data. For the avoidance of doubt, the rockburst dataset is split into training and testing sets with the relative size of 7:3, meaning that 70% of the entire data is chosen for training and 30% of the entire data is selected for testing the trained framework. The samples order in the dataset must be randomly adjusted before the splitting to overcome the localization of the training set.
The XGBoost model was employed to predict the rockburst intensity level. For the XGBoost model, the online Jupyter platform was executed in python. The python program language 3.6.6 that was accessible on the Jupyter program was executed to accomplish the XGBoost. A standard XGBoost model with default attributes that are developed in XGBoost module: M = 100 estimators, the regularization attribute of γ = 0, λ = 1, a learning rate of η = 0.3 was implemented in this study. We assumed a repeated 5-fold cross-validation setup and ensured that the argument from the same essay is not distributed over the training and testing datasets as shown in Figure 8. The cross-validation was repeated 3 times on standard scalar normalized data, which yielded a total of 15 folds. For other parameters, the default values of the XGBoost model are implemented in this study.
The classification accuracy of XGBoost was checked using precision, recall, and f 1 -score measures. Precision can properly predict the datasets; recall interpret the capability of accurately predicting the actual features to the maximum level, and f 1 -score demonstrates a universal metric that implements the performance of both recall and precision. Therefore, the aforementioned performance indicators are implemented in this study to estimate the performance of the model. Assume the confusion matrix is defined by Equation (14). A confusion matrix is usually implemented as a standard to demonstrate the performance of a classification model on a testing dataset for which the true values are already defined.
S = [ s 11 s 12 s 1 t s 21 s 22 s 2 t s t 1 s t 2 s tt ]
where t represents the number of rockburst levels, s 11 is the number of features accurately predicted for the class m , and S mn denotes the number of features of class that is categorized to class n .
On the basis of the confusion matrix, the precision, recall, and f 1 -score measure for each rockburst level are determined by Equations (15)–(17), respectively.
Pr = s mm m = 1 t s mn
Re = s mm n = 1 t s mn
f 1 score = 2 Pr Re Pr + Re
To further analyses the accuracy of XGboost, the accuracy is given by Equation (18)
Accuracy = 1 m = 1 k n = 1 k S tt m = 1 k S mm
macro Pr = ( n = 1 t S mm n = 1 E S mn ) / E
macro Re = ( n = 1 t s mm n = 1 E s mn ) / E
macro f 1 = 2 macro Pr macro Re macro Pr + macro Re
The prediction results of XGBoost algorithms were acquired on the testing dataset. In order to forecast the results of the proposed XGBoost algorithm combined with t-SNE and K-means clustering, three different performance indices have been employed in this study. The classification report for the testing dataset was computed using python programing language. The classification report gives a perspective of the proposed framework performance on the rockburst dataset as shown in Table 4. The precision values were calculated using Equation (15). The precision value for no rockburst level achieved better outcomes as compared to slight rockburst level, moderate rockburst level and violent rockburst level. The precision value for no rockburst, slight rockburst, moderate rockburst and violent rockburst were 100%, 60%, 100% and 88%, respectively. Equation (16) was employed to measure the recall value for each rockburst level. The recall value of slight rockburst performed better as compared to no rockburst level, moderate rockburst level and violent rockburst level. No rockburst, modest rockburst, moderate rockburst, and strong rockburst have recall values of 86 percent, 100%, 83%, and 88%, respectively. To measure f1-score for each corresponding rockburst level, Equation (17) was employed in this study. The f1-score for no rockburst level outperformed slight rockburst level, moderate rockburst level and violent rockburst level. The f1-score for no rockburst, slight rockburst, moderate rockburst and violent rockburst were 92%, 75%, 91% and 88%, respectively. In order to measure the overall accuracy of the framework on the testing dataset, Equation (18) was utilized in this study. The accuracy for the overall testing dataset was 88 percent, indicating that the XGBoost combined with t-SNE and K-means clustering performed well in this study.
The model’s accuracy is measured as a whole, while recall and precision are calculated for each class separately. For the rockburst phenomenon, we employ macro average of precision, recall, f1-score for our model as shown by Equations (19)–(21). The macro-average scores are the simple mean of scores of all rockburst levels. Hence, macro- average precision is the mean of the precision of four different levels of rockburst. The macro- average recall depicts the mean of the recall of four different levels of rockburst. Whereas macro- average f1-score represents the mean of the f1-score of four different levels of rockburst. So, the mean of precision, recall and f1-score were 87, 89 and 66, respectively. The weighted average scores are the sum of the scores of all levels after multiplying their respective levels proportions. Hence, the weighted average of precision, recall and f1-score were 91, 88 and 88, respectively.
In addition, a confusion matrix of the XGBoost algorithm was established, as shown in Figure 9. The values on the main diagonal show the samples number correctly predicted by the XGBoost. It can be seen that most rockburst samples were accurately classified using the XGBoost. Based on the confusion matrix (see Figure 9) only two rockburst levels have been mis-predicted in the entire short-term rockburst dataset. More precisely, one moderate rockburst (2) level is misclassified as violent rockburt (3) level, whereas one violent rockburst (3) level is misclassified as slight rockburst (2) level. According to the results, the XGBoost algorithm showed good performances in predicting the rockburst intensity level.

5. Conclusions

This research work developed t-SNE+K-means clustering+XGBoost to predict the predict rockburst levels efficiently and accurately. The robustness of the obtained framework was authenticated by analyzing the outcomes for the proposed framework using different performance indices. As for predicting the rockburst level, three methods including t-SNE, K-means clustering, and XGBoost model, which are broadly employed in geotechnical engineering, were applied during the study. More precisely, the data employed in this research work were obtained from genuine microseismic events. The short-term rockburst level is evaluated by the statistical performance to approximate the robust framework for the best effective model in connection with data prediction. The results of t-SNE+K-means clustering+XGBoost model shows that it can estimate the return rockburst level with high accuracy.
Hence, the t-SNE+K-means clustering+XGBoost model acquired in this study is recommended as an accurate and efficient model for the prediction of rockburst intensity levels. It can be employed as a rockburst prevention and warning system, owing to the fact that the proposed model will have reliable prediction performance in different rock conditions. Therefore, the model can be generalized by maintaining some additional rock mechanics data and geological information. This model can be merged into the initiation of the rockburst level of the microseismical events that are continuously disseminated.
The range and number of trainings should be taken into consideration, which is has a consequential effect on the logical reasoning of the data-driven models. The current research will be further extended by establishing some cutting-edge machine learning algorithms and comparing the outcome of those models with the outcome of the model acquired in this research work. The state-of-the-art machine learning technique can comprise hybrid, metaheuristic, and ensemble machine learning models.

Author Contributions

Conceptualization, M.K. and B.U.; methodology, M.K. and B.U.; data curation, M.K.; writing—original draft preparation, M.K. and B.U.; writing—review and editing, Y.R. All authors have read and agreed to the published version of the manuscript.

Funding

This research received no external funding.

Institutional Review Board Statement

Not applicable.

Informed Consent Statement

Not applicable.

Data Availability Statement

All the data and models employed and/or generated during the study appear in the submitted article.

Conflicts of Interest

The authors declare no conflict of interest.

References

  1. Zhao, H.; Chen, B.; Zhu, C. Decision Tree Model for Rockburst Prediction Based on Microseismic Monitoring. Adv. Civ. Eng. 2021, 2021, 8818052. [Google Scholar] [CrossRef]
  2. Feng, X.-T.; Yashun, X.; Guangliang, F. Mechanism, warning and dynamic control of rockburst evolution process. In Proceedings of the ISRM Regional Symposium—7th Asian Rock Mechanics Symposium, Seoul, Korea, 15–19 October 2012. [Google Scholar]
  3. Sun, Y.; Li, G.; Zhang, J.; Huang, J. Rockburst Intensity Evaluation by a Novel Systematic and Evolved Approach: Machine Learning Booster and Application. Bull. Eng. Geol. Environ. 2021, 80, 8385–8395. [Google Scholar] [CrossRef]
  4. Cai, M. Principles of Rock Support in Burst-Prone Ground. Tunn. Undergr. Space Technol. 2013, 36, 46–56. [Google Scholar] [CrossRef]
  5. Cai, X.; Cheng, C.; Zhou, Z.; Konietzky, H.; Song, Z.; Wang, S. Rock Mass Watering for Rock-Burst Prevention: Some Thoughts on the Mechanisms Deduced from Laboratory Results. Bull. Eng. Geol. Environ. 2021, 80, 8725–8743. [Google Scholar] [CrossRef]
  6. Pu, Y.; Apel, D.B.; Liu, V.; Mitri, H. Machine Learning Methods for Rockburst Prediction-State-of-the-Art Review. Int. J. Min. Sci. Technol. 2019, 29, 565–570. [Google Scholar] [CrossRef]
  7. Mark, C. Coal Bursts in the Deep Longwall Mines of the United States. Int. J. Coal Sci. Technol. 2016, 3, 1–9. [Google Scholar] [CrossRef] [Green Version]
  8. Pu, Y.; Apel, D.B.; Wei, C. Applying Machine Learning Approaches to Evaluating Rockburst Liability: A Comparation of Generative and Discriminative Models. Pure Appl. Geophys. 2019, 176, 4503–4517. [Google Scholar] [CrossRef]
  9. Zhang, J.; Jiang, F.; Yang, J.; Bai, W.; Zhang, L. Rockburst Mechanism in Soft Coal Seam within Deep Coal Mines. Int. J. Min. Sci. Technol. 2017, 27, 551–556. [Google Scholar] [CrossRef]
  10. Zhou, Z.; Cai, X.; Li, X.; Cao, W.; Du, X. Dynamic Response and Energy Evolution of Sandstone Under Coupled Static–Dynamic Compression: Insights from Experimental Study into Deep Rock Engineering Applications. Rock Mech. Rock Eng. 2020, 53, 1305–1331. [Google Scholar] [CrossRef]
  11. Wang, S.; Tang, Y.; Wang, S. yong Influence of Brittleness and Confining Stress on Rock Cuttability Based on Rock Indentation Tests. J. Cent. South Univ. 2021, 28, 2786–2800. [Google Scholar] [CrossRef]
  12. Wang, S.; Tang, Y.; Li, X.; Du, K. Analyses and Predictions of Rock Cuttabilities under Different Confining Stresses and Rock Properties Based on Rock Indentation Tests by Conical Pick. Trans. Nonferrous Met. Soc. China (Engl. Ed.) 2021, 31, 1766–1783. [Google Scholar] [CrossRef]
  13. Li, X.; Gong, F.; Tao, M.; Dong, L.; Du, K.; Ma, C.; Zhou, Z.; Yin, T. Failure Mechanism and Coupled Static-Dynamic Loading Theory in Deep Hard Rock Mining: A Review. J. Rock Mech. Geotech. Eng. 2017, 9, 767–782. [Google Scholar] [CrossRef]
  14. Lu, C.P.; Dou, L.M.; Liu, B.; Xie, Y.S.; Liu, H.S. Microseismic Low-Frequency Precursor Effect of Bursting Failure of Coal and Rock. J. Appl. Geophys. 2012, 79, 55–63. [Google Scholar] [CrossRef]
  15. Liu, J.P.; Feng, X.T.; Li, Y.H.; da Xu, S.; Sheng, Y. Studies on Temporal and Spatial Variation of Microseismic Activities in a Deep Metal Mine. Int. J. Rock Mech. Min. Sci. 2013, 60, 171–179. [Google Scholar] [CrossRef]
  16. Srinivasan, C.; Aroras, S.K.; Yajq, R.K. Use of Mining and Seismological Parameters as Premonitors of Rockbursts. Int. J. Rock Mech. Min. Sci. 1997, 34, 1001–1008. [Google Scholar] [CrossRef]
  17. Ma, X.; Westman, E.; Slaker, B.; Thibodeau, D.; Counter, D. The B-Value Evolution of Mining-Induced Seismicity and Mainshock Occurrences at Hard-Rock Mines. Int. J. Rock Mech. Min. Sci. 2018, 104, 64–70. [Google Scholar] [CrossRef]
  18. Ma, T.H.; Tang, C.A.; Tang, S.; Kuang, L.; Yu, Q.; Kong, D.Q.; Zhu, X. Rockburst Mechanism and Prediction Based on Microseismic Monitoring. Int. J. Rock Mech. Min. Sci. 2018, 110, 177–188. [Google Scholar] [CrossRef]
  19. Kidybiiqski, A. Bursting Liability Indices of Coal. Int. J. Rock Mech. Min. Sci. Geomech. Abstr. 1981, 18, 295–304. [Google Scholar] [CrossRef]
  20. Wattimena, R.K.; Sirait, B.; Widodo, N.P.; Matsui, K. Evaluation of Rockburst Potential in a Cut-and-Fill Mine Using Energy Balance. Int. J. JCRM 2012, 8, 19–23. [Google Scholar]
  21. Altindag, R. Correlation of Specific Energy with Rock Brittleness Concepts on Rock Cutting. J. S. Afr. Inst. Min. Metall. 2003, 103, 163–171. [Google Scholar]
  22. Wang, J.-A.; Park, H.D. Comprehensive Prediction of Rockburst Based on Analysis of Strain Energy in Rocks. Tunn. Undergr. Space Technol. 2001, 16, 49–57. [Google Scholar] [CrossRef]
  23. Cai, M. Prediction and Prevention of Rockburst in Metal Mines—A Case Study of Sanshandao Gold Mine. J. Rock Mech. Geotech. Eng. 2016, 8, 204–211. [Google Scholar] [CrossRef]
  24. Pu, Y.; Apel, D.B.; Xu, H. Rockburst Prediction in Kimberlite with Unsupervised Learning Method and Support Vector Classifier. Tunn. Undergr. Space Technol. 2019, 90, 12–18. [Google Scholar] [CrossRef]
  25. Wojtecki, Ł.; Iwaszenko, S.; Apel, D.B.; Cichy, T. An Attempt to Use Machine Learning Algorithms to Estimate the Rockburst Hazard in Underground Excavations of Hard Coal Mine. Energies 2021, 14, 6928. [Google Scholar] [CrossRef]
  26. Zhao, H.; Chen, B.; Zhang, Q. Data-Driven Model for Rockburst Prediction. Math. Probl. Eng. 2020, 2020, 5735496. [Google Scholar] [CrossRef]
  27. Afraei, S.; Shahriar, K.; Madani, S.H. Developing Intelligent Classification Models for Rock Burst Prediction after Recognizing Significant Predictor Variables, Section 2: Designing Classifiers. Tunn. Undergr. Space Technol. 2019, 84, 522–537. [Google Scholar] [CrossRef]
  28. Zhou, J.; Li, X.; Shi, X. Long-Term Prediction Model of Rockburst in Underground Openings Using Heuristic Algorithms and Support Vector Machines. Saf. Sci. 2012, 50, 629–644. [Google Scholar] [CrossRef]
  29. Xue, Y.; Bai, C.; Qiu, D.; Kong, F.; Li, Z. Predicting Rockburst with Database Using Particle Swarm Optimization and Extreme Learning Machine. Tunn. Undergr. Space Technol. 2020, 98, 103287. [Google Scholar] [CrossRef]
  30. Li, Y.; Wang, C.; Xu, J.; Zhou, Z.; Xu, J.; Cheng, J. Rockburst Prediction Based on the KPCA-APSO-SVM Model and Its Engineering Application. Shock Vib. 2021, 2021, 7968730. [Google Scholar] [CrossRef]
  31. Guo, D.; Chen, H.; Tang, L.; Chen, Z.; Samui, P. Assessment of Rockburst Risk Using Multivariate Adaptive Regression Splines and Deep Forest Model. Acta Geotech. 2021, 1–23. [Google Scholar] [CrossRef]
  32. Zhou, J.; Li, X.; Mitri, H.S. Classification of Rockburst in Underground Projects: Comparison of Ten Supervised Learning Methods. J. Comput. Civ. Eng. 2016, 30, 04016003. [Google Scholar] [CrossRef]
  33. Ghasemi, E.; Gholizadeh, H.; Adoko, A.C. Evaluation of Rockburst Occurrence and Intensity in Underground Structures Using Decision Tree Approach. Eng. Comput. 2020, 36, 213–225. [Google Scholar] [CrossRef]
  34. Wang, Y. Prediction of Rockburst Risk in Coal Mines Based on a Locally Weighted C4.5 Algorithm. IEEE Access 2021, 9, 15149–15155. [Google Scholar] [CrossRef]
  35. Ahmad, M.; Hu, J.L.; Hadzima-Nyarko, M.; Ahmad, F.; Tang, X.W.; Rahman, Z.U.; Nawaz, A.; Abrar, M. Rockburst Hazard Prediction in Underground Projects Using Two Intelligent Classification Techniques: A Comparative Study. Symmetry 2021, 13, 632. [Google Scholar] [CrossRef]
  36. Wang, S.; Zhou, J.; Li, C.; Armaghani, D.J.; Li, X.; Mitri, H.S. Rockburst Prediction in Hard Rock Mines Developing Bagging and Boosting Tree-Based Ensemble Techniques. J. Cent. South Univ. 2021, 28, 527–542. [Google Scholar] [CrossRef]
  37. Pu, Y.; Apel, D.B.; Wang, C.; Wilson, B. Evaluation of Burst Liability in Kimberlite Using Support Vector Machine. Acta Geophys. 2018, 66, 973–982. [Google Scholar] [CrossRef]
  38. Liang, W.; Sari, A.; Zhao, G.; McKinnon, S.D.; Wu, H. Short-Term Rockburst Risk Prediction Using Ensemble Learning Methods. Nat. Hazards 2020, 104, 1923–1946. [Google Scholar] [CrossRef]
  39. Zhou, J.; Shi, X.Z.; Huang, R.D.; Qiu, X.Y.; Chen, C. Feasibility of Stochastic Gradient Boosting Approach for Predicting Rockburst Damage in Burst-Prone Mines. Trans. Nonferrous Met. Soc. China (Engl. Ed.) 2016, 26, 1938–1945. [Google Scholar] [CrossRef]
  40. Feng, G.; Xia, G.; Chen, B.; Xiao, Y.; Zhou, R. A Method for Rockburst Prediction in the Deep Tunnels of Hydropower Stations Based on the Monitored Microseismicity and an Optimized Probabilistic Neural Network Model. Sustainability 2019, 11, 3212. [Google Scholar] [CrossRef] [Green Version]
  41. Ji, B.; Xie, F.; Wang, X.; He, S.; Song, D. Investigate Contribution of Multi-Microseismic Data to Rockburst Risk Prediction Using Support Vector Machine with Genetic Algorithm. IEEE Access 2020, 8, 58817–58828. [Google Scholar] [CrossRef]
  42. Li, N.; Jimenez, R. A Logistic Regression Classifier for Long-Term Probabilistic Prediction of Rock Burst Hazard. Nat. Hazards 2018, 90, 197–215. [Google Scholar] [CrossRef]
  43. Afraei, S.; Shahriar, K.; Madani, S.H. Statistical Assessment of Rock Burst Potential and Contributions of Considered Predictor Variables in the Task. Tunn. Undergr. Space Technol. 2018, 72, 250–271. [Google Scholar] [CrossRef]
  44. Faradonbeh, R.S.; Taheri, A. Long-Term Prediction of Rockburst Hazard in Deep Underground Openings Using Three Robust Data Mining Techniques. Eng. Comput. 2019, 35, 659–675. [Google Scholar] [CrossRef]
  45. Pu, Y.; Apel, D.B.; Lingga, B. Rockburst Prediction in Kimberlite Using Decision Tree with Incomplete Data. J. Sustain. Min. 2018, 17, 158–165. [Google Scholar] [CrossRef]
  46. Adoko, A.C.; Gokceoglu, C.; Wu, L.; Zuo, Q.J. Knowledge-Based and Data-Driven Fuzzy Modeling for Rockburst Prediction. Int. J. Rock Mech. Min. Sci. 2013, 61, 86–95. [Google Scholar] [CrossRef]
  47. Feng, X.T.; Chen, B.R.; Zhang, C.Q.; Li, S.J.; Wu, S.Y. Mechanism, Warning and Dynamic Control of Rockburst Development Processes; Science Press: Beijing, China, 2013. (In Chinese) [Google Scholar]
  48. Hinton, G.; Roweis, S. Stochastic Neighbor Embedding; Advances in Neural Information Processing Systems; The MIT Press: Cambridge, MA, USA, 2002; pp. 833–840. [Google Scholar]
  49. Liu, H.; Yang, J.; Ye, M.; James, S.C.; Tang, Z.; Dong, J.; Xing, T. Using T-Distributed Stochastic Neighbor Embedding (t-SNE) for Cluster Analysis and Spatial Zone Delineation of Groundwater Geochemistry Data. J. Hydrol. 2021, 597, 126146. [Google Scholar] [CrossRef]
  50. Hartigan, J.A.; Wong, M.A. Algorithm AS 136: A K-Means Clustering Algorithm. J. R. Stat. Soc. Ser. C (Appl. Stat.) 1979, 28, 100–108. [Google Scholar] [CrossRef]
  51. Zhu, X.; Jin, X.; Jia, D.; Sun, N.; Wang, P. Application of Data Mining in an Intelligent Early Warning System for Rock Bursts. Processes 2019, 7, 55. [Google Scholar] [CrossRef] [Green Version]
  52. Zhao, Y.; Song, J. GDILC: A Grid-Based Density-Isoline Clustering Algorithm. In Proceedings of the 2001 International Conferences on Info-Tech and Info-Net. Proceedings (Cat. No.01EX479), Beijing, China, 29 October–1 November 2001. [Google Scholar]
  53. Likas, A.; Vlassis, N.; Verbeek, J.J. The Global K-Means Clustering Algorithm. Pattern Recognit. 2003, 36, 451–461. [Google Scholar] [CrossRef] [Green Version]
  54. Chen, T.; Guestrin, C. XGBoost: A Scalable Tree Boosting System. In Proceedings of the ACM SIGKDD International Conference on Knowledge Discovery and Data Mining, San Francisco, CA, USA, 13–17 August 2016; Association for Computing Machinery: New York, NY, USA, 2016; pp. 785–794. [Google Scholar]
  55. Schapire, R.E. The Boosting Approach to Machine Learning: An Overview. In Nonlinear Estimation and Classification. Lecture Notes in Statistics; Denison, D.D., Hansen, M.H., Holmes, C.C., Mallick, B., Yu, B., Eds.; Springer: New York, NY, USA, 2003; Volume 171. [Google Scholar] [CrossRef]
  56. Elith, J.; Leathwick, J.R.; Hastie, T. A Working Guide to Boosted Regression Trees. J. Anim. Ecol. 2008, 77, 802–813. [Google Scholar] [CrossRef]
  57. Friedman, J.H. Stochastic Gradient Boosting. Comput. Stat. Data Anal. 2002, 38, 367–378. Available online: http://www.elsevier.com/locate/csda (accessed on 25 November 2021). [CrossRef]
  58. Wang, Z.; Monteiro, C.D.; Jagodnik, K.M.; Fernandez, N.F.; Gundersen, G.W.; Rouillard, A.D.; Jenkins, S.L.; Feldmann, A.S.; Hu, K.S.; McDermott, M.G.; et al. Extraction and Analysis of Signatures from the Gene Expression Omnibus by the Crowd. Nat. Commun. 2016, 7, 12846. [Google Scholar] [CrossRef] [PubMed] [Green Version]
  59. Choubineh, A.; Helalizadeh, A.; Wood, D.A. Estimation of Minimum Miscibility Pressure of Varied Gas Compositions and Reservoir Crude Oil over a Wide Range of Conditions Using an Artificial Neural Network Model. Adv. Geo-Energy Res. 2019, 3, 52–66. [Google Scholar] [CrossRef]
  60. Bergstra, J.; Ca, J.B.; Ca, Y.B. Random Search for Hyper-Parameter Optimization Yoshua Bengio. J. Mach. Learn. Res. 2012, 13, 281–305. [Google Scholar]
  61. Kamran, M. A State of the Art Catboost-Based T-Distributed Stochastic Neighbor Embedding Technique to Predict Back-Break at Dewan Cement Limestone Quarry. J. Min. Environ. JME 2021, 12, 679–691. [Google Scholar] [CrossRef]
  62. van Der Maaten, L.; Hinton, G. Visualizing Data Using T-SNE. J. Mach. Learn. Res. 2008, 9, 2579–2605. [Google Scholar]
  63. Shi, N.; Liu, X.; Guan, Y. Research on K-Means Clustering Algorithm: An Improved k-Means Clustering Algorithm. In Proceedings of the 3rd International Symposium on Intelligent Information Technology and Security Informatics (IITSI 2010), Jian, China, 2–4 April 2010; pp. 63–67. [Google Scholar]
  64. Rousseeuw, P.J. Silhouettes: A Graphical Aid to the Interpretation and Validation of Cluster Analysis. J. Comput. Appl. Math. 1987, 20, 53–65. [Google Scholar] [CrossRef] [Green Version]
  65. Kim, S.W.; Gil, J.M. Research Paper Classification Systems Based on TF-IDF and LDA Schemes. Hum.-Cent. Comput. Inf. Sci. 2019, 9, 30. [Google Scholar] [CrossRef]
  66. Sarno Riyanarto, G.H.; Pamungkas, E.W.; Sunaryono, D. Clustering of ERP Business Process Fragments. In Proceedings of the 2013 International Conference on Computer, Control, Informatics and Its Applications (IC3INA), Jakarta, Indonesia, 19–21 November 2013. [Google Scholar]
  67. Rani Usha, S.S. Comparison of Clustering Techniques for Measuring Similarity in Articles. In Proceedings of the 3rd IEEE International Conference on Computational Intelligence and Communication Technology, Ghaziabad, India, 9–10 February 2017. [Google Scholar]
  68. Ma, Y.; Peng, M.; Xue, W.; Ji, X. A Dynamic Affinity Propagation Clustering Algorithm for Cell Outage Detection in Self-Healing Networks. In Proceedings of the 2013 IEEE Wireless Communications and Networking Conference (WCNC), Shanghai, China, 7–10 April 2013; pp. 2266–2270. [Google Scholar] [CrossRef]
Figure 1. Flowchart of the study.
Mathematics 10 00449 g001
Figure 2. Distribution of each rockburst level.
Mathematics 10 00449 g002
Figure 3. Boxplot of each influencing feature to corresponding rockburst level.
Mathematics 10 00449 g003
Figure 4. Level-wise tree model in XGBoost algorithm.
Mathematics 10 00449 g004
Figure 5. The flowchart of parameters optimization using grid search.
Mathematics 10 00449 g005
Figure 6. 3D low-resolution amplitude of rockburst database.
Mathematics 10 00449 g006
Figure 7. K-means clustering mechanism of low-resolution amplitude.
Mathematics 10 00449 g007
Figure 8. Five-fold cross-validation employed in the study.
Mathematics 10 00449 g008
Figure 9. Confusion matrix of testing dataset.
Mathematics 10 00449 g009
Table 1. Traditional supervised machine learning approaches proposed by the researchers for predicting rockburst.
S.NoReferencesMachine Learning ModelsDataset SizeYear
1Zhou et al. [32]KNN 2462016
2Li et al. [42]LR 1352017
3Afraei et al. [43]LR 1882018
4Faradonbeh et al. [44]DT 1342019
5Pu et al. [45]DT 1322018
6Ghasemi et al. [33]DT1742020
7Faradonbeh et al. [44]ANN 1342019
8Adoko et al. [46]ANFIS 1742013
9Zhou et al. [32]SVM 2462016
10Guo et al. [31]MARS3442021
Note: KNN, k-nearest neighbors; LR, Logistic regression; DT, Decision tree; ANFIS, adaptive neuron fuzzy inference system; ANN, Artificial neural network; SVM, Support vector machines; multivariate adaptive regression splines.
Table 2. Statistical description of rockburst database.
Descriptive StatisticsCumulative Number of Events X 1 (Unit)Event Rate X 2 (Unit/Day)Logarithm of the Cumulative Release Energy X 3 (J)Logarithm of the Energy Rate X 4 (J/Day)Logarithm of the Cumulative Apparent Volume X 5 (m3)Logarithm of the Apparent Volume Rate X 6 (m3/Day)
Mean13.0111.7354.3893.5624.1503.334
Standard deviation13.6901.7381.4411.3320.6600.558
Minimum10.1110.7800.1782.5111.666
Maximum7012.2507.0945.8905.1684.393
Table 3. Rockburst database after low-resolution amplitude with t-SNE.
SamplesDimension 1Dimension 2Dimension 3
1−9.18951.8769233.533078
2−5.257971.3862652.998773
3−6.334020.83398−0.95647
4−6.66611.6679991.523691
5−3.369390.2963171.838995
…..…..…..
88−8.270441.1921742.389334
89−8.878261.073105−2.3535
91−2.44182−0.944431.698488
92−5.973271.043975−4.14844
93−0.7725−1.402641.910676
Table 4. Classification report of XGBoost algorithm.
ClassXGBoost Model
Precision
%
Recall
%
f1-Score
%
No rockburst 1008692
Slight rockburst6010075
Moderate rockburst1008391
Violent rockburst888888
Accuracy 88
macro avg878966
Weighted avg918888
Publisher’s Note: MDPI stays neutral with regard to jurisdictional claims in published maps and institutional affiliations.

