Article

Critical Percolation on Temporal High-Speed Railway Networks

1
Institute of Transportation System Science and Engineering, Beijing Jiaotong University, Beijing 100044, China
2
Key Laboratory of Transport Industry of Big Data Application Technologies for Comprehensive Transport, Beijing Jiaotong University, Beijing 100044, China
3
College of Engineering, Key Laboratory of Urban Rail Transit Intelligent Operation and Maintenance Technology & Equipment of Zhejiang Province, Zhejiang Normal University, Jinhua 321004, China
4
School of Public Policy and Administration, Xi’an Jiaotong University, Xi’an 710049, China
*
Author to whom correspondence should be addressed.
Mathematics 2022, 10(24), 4695; https://doi.org/10.3390/math10244695
Submission received: 1 November 2022 / Revised: 18 November 2022 / Accepted: 8 December 2022 / Published: 11 December 2022
(This article belongs to the Topic Complex Systems and Network Science)

Abstract

:
Deeply understanding the dynamic operating characteristics of high-speed railway (HSR) systems is of essential significance in theory and practice for the planning, construction, and operational management of HSR systems. In this paper, the HSR system is described as a temporal network, and the evolution of connected clusters in the system is considered as a percolation process. The critical integration time T c of the percolation process can determine the formation of a globally connected cluster and measure the transport performance of the HSR system. The appearance time of critical edges identified at T c can significantly affect the reliability of the transport performance of an HSR system. Compared to random percolation in the static HSR network, it can be found that the critical fraction p c of the percolation process in a temporal HSR network is almost always larger. This indicates that the global connectivity and the transport performance of HSR systems is overestimated by the static network abstraction. This paper provides a promising way of understanding the dynamic characteristics of HSR systems, evaluating their transport performance, and improving their reliability.
MSC:
60K35; 05C82; 82C27

1. Introduction

With rapid development in recent decades, China’s high-speed railway (HSR) system has taken the lead globally in operational mileage, transport capacity, and traffic volume [1]. The well-developed HSR system brings excellent convenience to travelers and plays a critical role in promoting the development of cities along HSR lines. Therefore, it is of great theoretical and practical significance to deeply understand the structure of HSR systems and further improve their operational efficiency.
Complex networks have been widely used in the study of railway transportation systems [2,3,4]. For example, Cao et al. [5] constructed a weighted network using the space-P approach to investigate the structural and spatial properties of China’s HSR system, finding that the spatial distribution of high-speed train flows exhibits clear heterogeneity and hierarchies according to regional economic development, topography, population density, and political position in China. Wei et al. [6] studied the evolution characteristics of the HSR network in the Yangtze River Delta region from 2014 to 2018, finding that the topology of the network is relatively stable and its degree distribution follows a roughly normal distribution. Wang et al. [7] conducted a weighted k-core decomposition analysis on the Chinese railway network (CRN), showing that the CRN is a core–periphery structure with small-world behavior and disassortativity and that the core–periphery structure is consistent with the trip distribution of the gravity model and the latest state planning of urban agglomerations. Xie et al. [8] integrated a non-Markovian higher-order model and a weighted k-core decomposition to study the multilayer features of China’s HSR system, in which ten important hub cities and the most important routes were identified. Zhang et al. [9] constructed a multilayer network according to the type of passenger trains and found that nodes with a large degree play key roles during dynamic node failure processes. Wang et al. [10] proposed a three-layer network model to evaluate the comprehensive performance of HSR networks from the view of transport accessibility. Their work bridged performance evaluation in theory and practice by concerning transportation services. Li et al. [11] investigated the vulnerability of China’s HSR network using the spatially localized failures (SLFs) model, finding that the consideration of service features could identify critical components and critical areas more accurately, avoid overestimation of the vulnerability of China’s HSR network, and prevent critical components from being overlooked. Meng et al. [12] built a complex network model to describe train timetables and proposed a complex network framework to deal with the train timetabling problem.
Temporal networks have been proposed to describe complex networks with time-varying connections [13,14,15,16]. Some recent studies have applied temporal networks to investigate the time-varying characteristics of air transport systems. Pan et al. [17] constructed the American airport network (AAN) as a temporal network and measured distances for the AAN using temporal paths. Mou et al. [18] studied the temporal airline network in China with a one-hour time window and built two epidemic spreading models to study the effects of temporal duration and linking sequence on disease spread. HSR networks are a typical temporal network with time-varying transport capacity, which is determined by trains running on the rail routes between any HSR station pair. However, the temporal features of HSR systems have not attracted enough attention in related fields.
As an ideal tool for capturing the phase transition behavior of temporal networks, percolation models have been applied to study the dynamic evolutionary characteristics of traffic systems [19,20,21,22,23]. Specifically, Li et al. [24] characterized the organization of city road traffic as a percolation process, finding that bottleneck roads provide potential opportunities to improve global network traffic efficiency with little cost. Hamedmoghadam et al. [25] proposed a percolation analysis framework for the dynamic characteristics of heterogeneous traffic flows on traffic networks and verified the validity and accuracy of the framework for identifying congestion bottlenecks. Zeng et al. [26] found two critical percolation modes in the dynamic traffic process of city road networks, and the dynamic traffic state switches between the two modes. Liu et al. [27] studied the evolution of the largest clusters of the temporal airport network, identified the critical edges at the percolation transition point, and evaluated the operational reliability of air transportation systems. These works above prove that studying the evolution of HSR system from the view of critical percolation is very promising.
In this paper, China’s HSR system is described as a temporal network, and the evolution of connected clusters in the network is considered as a percolation process. The remainder of this paper is organized as follows. Section 2 describes the construction of the static and temporal HSR network in detail. Section 3 describes China’s HSR system as a temporal network based on train timetable data. A percolation model is employed to investigate the dynamic evolution of temporal HSR networks and the identification and appearance of critical edges are discussed. In addition, the percolation processes for temporal and static HSR networks are compared. Finally, conclusions are given in Section 4.

2. Materials and Methods

2.1. Static HSR Network

A static HSR network is established by the space-L approach [28]. All HSR stations constitute the node set ( V ) of the static HSR network. If there is a direct HSR train from station i to station j , a directed edge, e i j , is connected between node i and node j . E denotes the edge set of the static HSR network. The number of edges is defined as m = E .

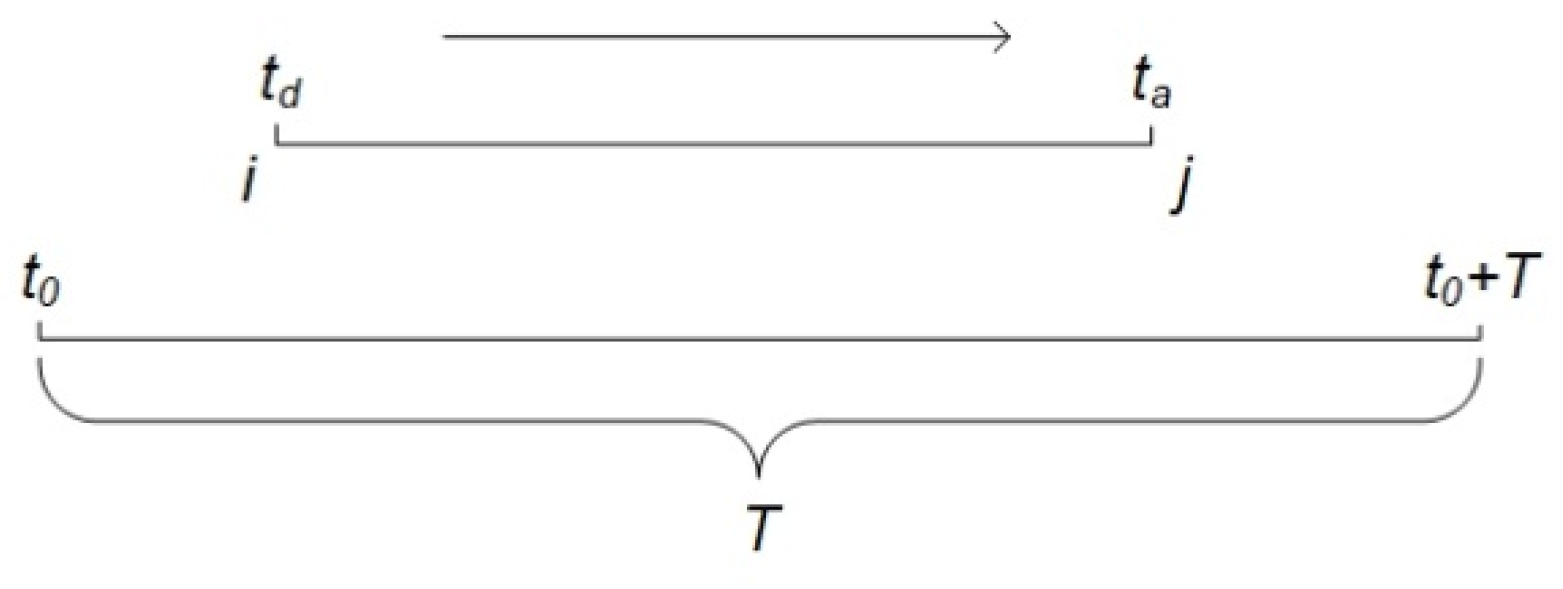
2.2. Temporal HSR Network

An HSR train is represented as a 4-tuple i , j , t d , t a , where i and   j represent stations that are nodes of the temporal HSR network, t d denotes the departure time from station i , and t a denotes the arrival time at station j . Given a time window t 0 , t 0 + T , a directed edge, e i j , is connected from station i to station j if t d t 0 and t a < t 0 + T (Figure 1). Varying the starting time t 0 and the integration time T (i.e., the time window size) will change the structure of the temporal HSR network. For a given starting time t 0 , increasing the integration time T will lead to more trains being contained within the temporal HSR network. For example, consider there is an HSR train which departs from Beijingnan station at 9:00 and arrives at Jinanxi station at 10:22. We represent this train as a 4-tuple (Beijingnan, Jinanxi, 9:00, 10:22). When t 0 = 9:00, T = 1.5 h, that is, t 0 + T = 10:30, Beijingnan station and Jinanxi station are nodes in the temporal HSR network, and there is a directed edge from Beijingnan pointing to Jinanxi.
In a temporal HSR network, for a given starting time t 0 and integration time T , an edge, e i j , could correspond to multiple trains in a temporal HSR network. Among these trains, the arrival time, t a , of the earliest train arriving at station j is defined as the appearance time, t e i j , of edge e i j , abbreviated as t e .

3. Results

This paper assumes that China’s HSR system only includes G (Gaosu)-type and D (Dongche)-type trains. This means that the rail track, the control, the signal, and the other subsystems are not considered. The HSR data were provided by the China Railway Corporation (CRC), which operates 4559 trains and 694 stations. Although China spans five geographical time zones, we use Beijing time as the only standard time in all industries, including the Chinese railway industry. Therefore, the HSR data provided by CRC do not have a time zone problem.

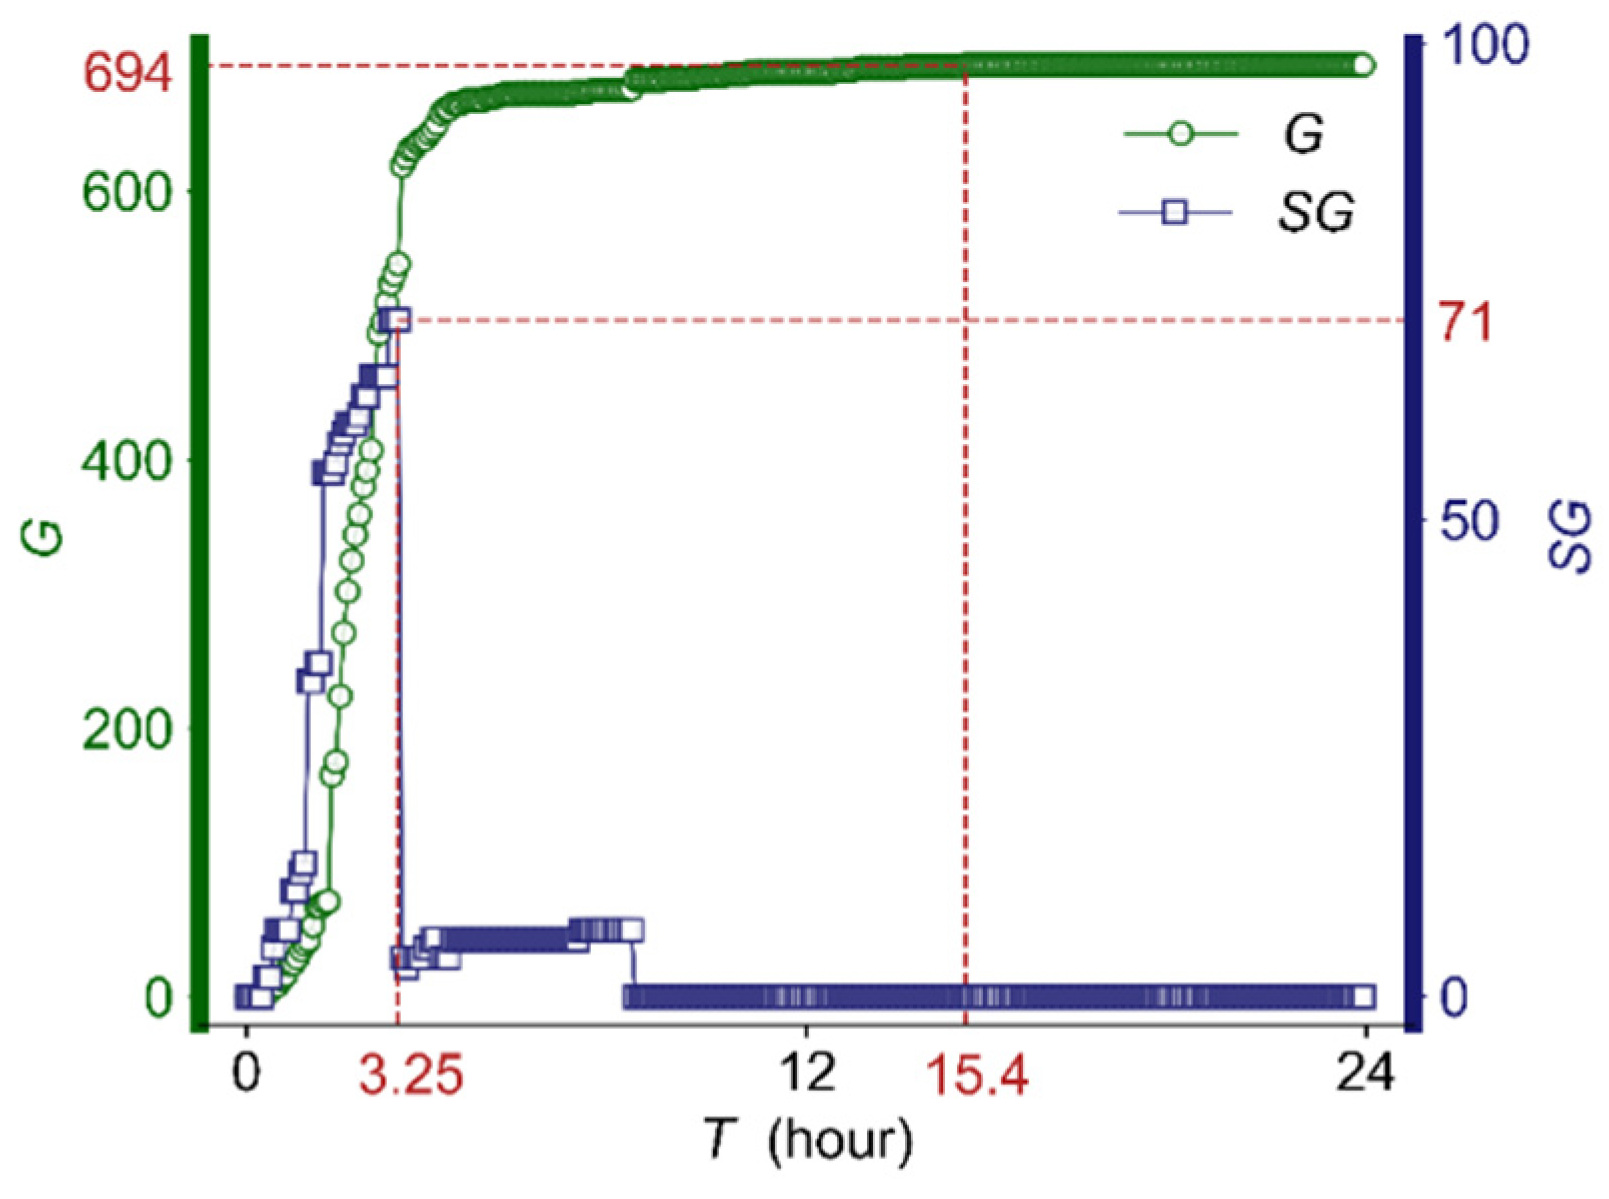
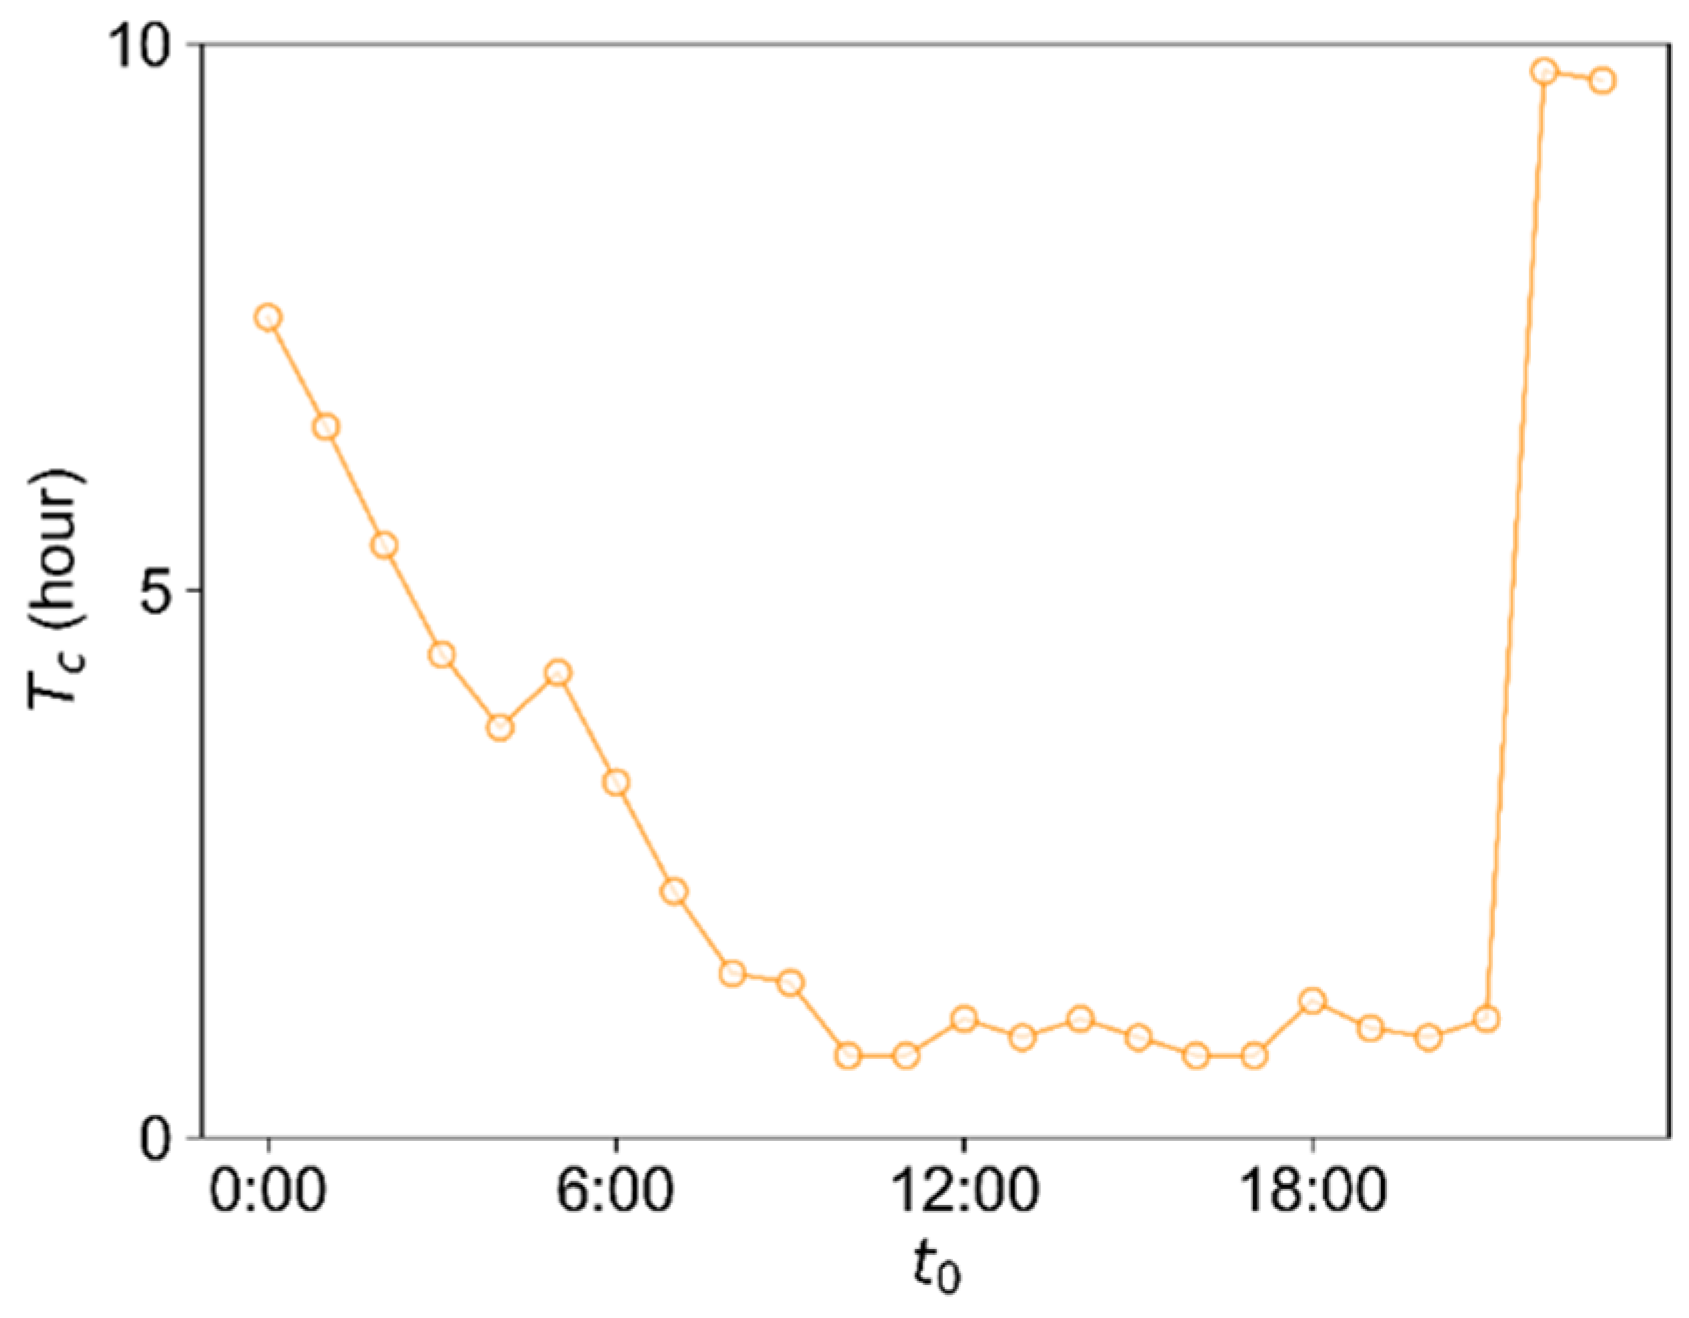
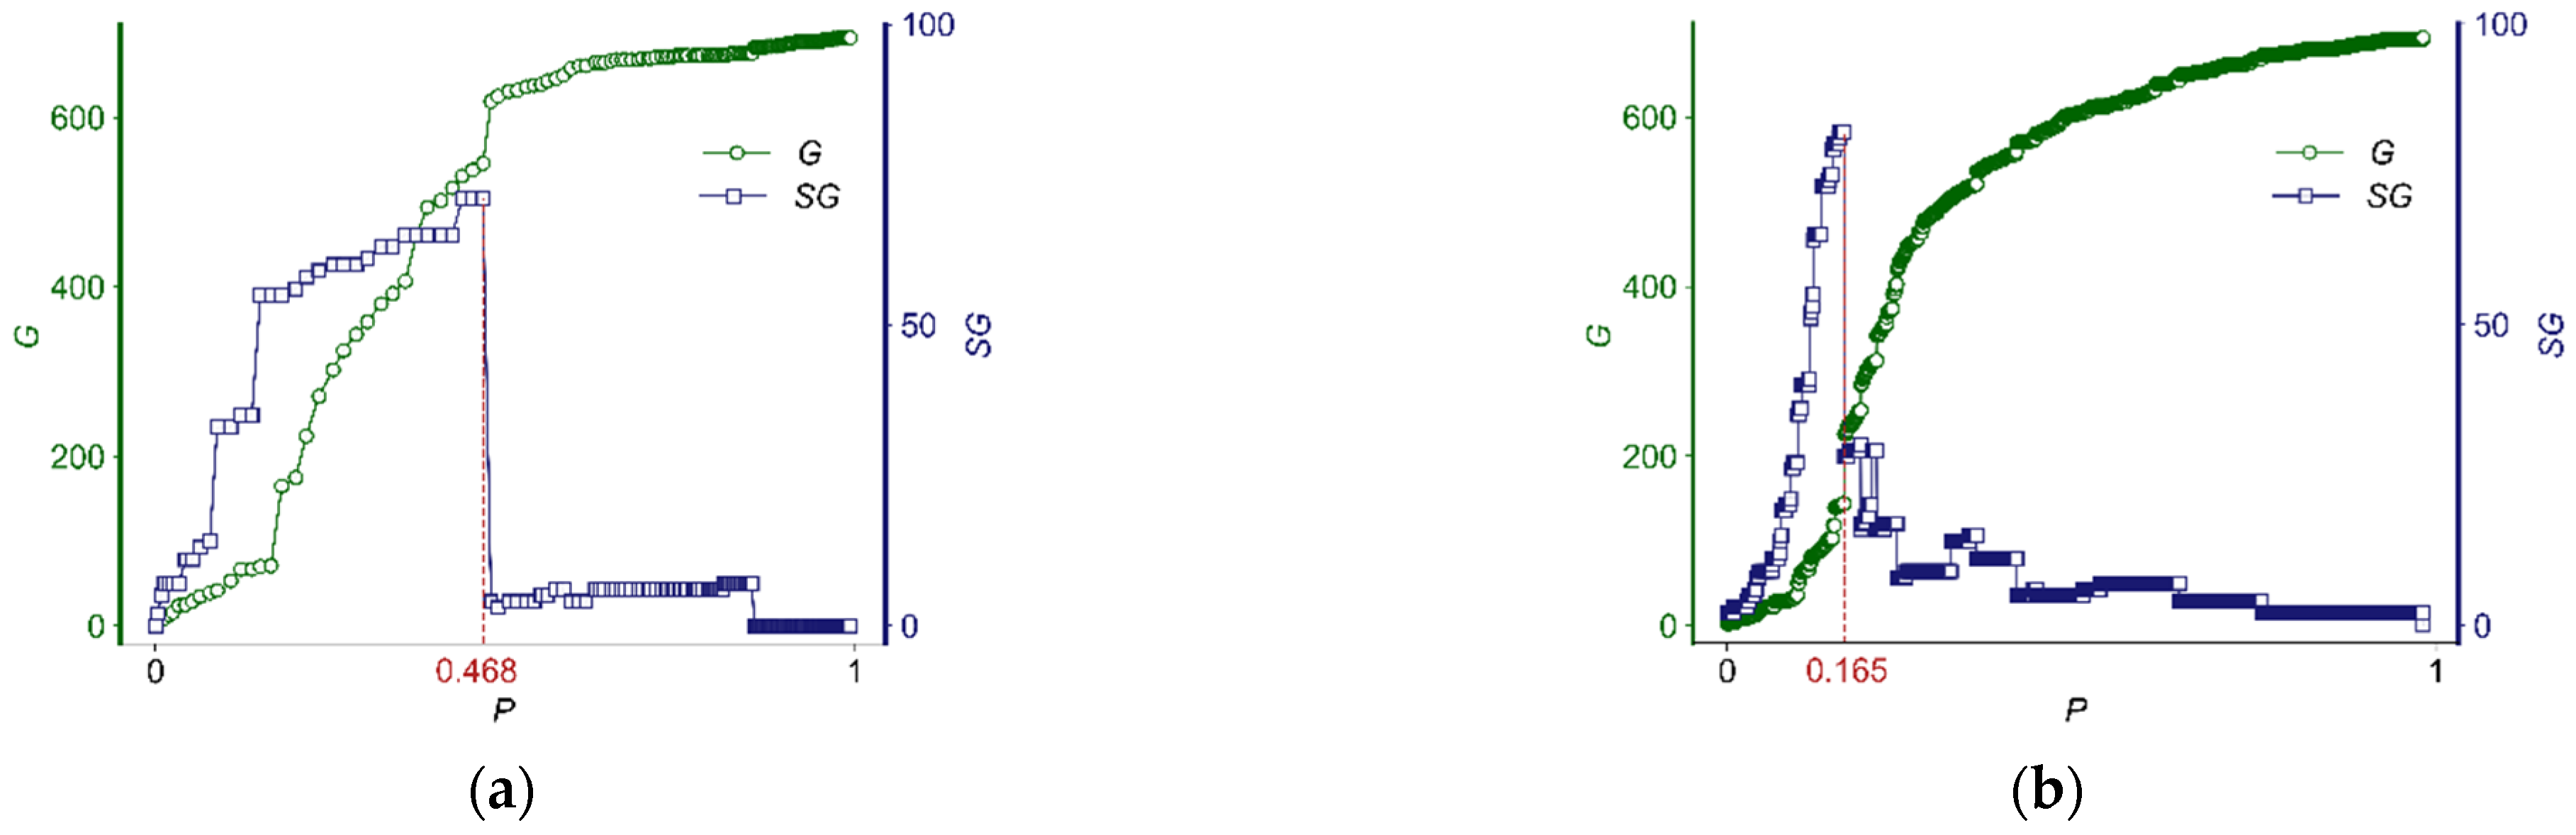
3.1. Percolation Transition in Temporal HSR Networks

Figure 2 shows the percolation process for the temporal HSR network, in which t 0 = 6:00 and T is increased by Δ T (=5 min) each time until T = 1440 min. The largest weakly connected cluster, G , and the second-largest weakly connected cluster, S G , increase as T increases from the beginning. According to the percolation theory [19], when S G reaches its maximum, percolation transition happens at the critical integration time T c = 3.25 h. When T > T c , G becomes a globally connected cluster containing most of the nodes in the temporal HSR network, the network changes from a local connected state to a global connected state, and S G decreases rapidly. For the HSR network, the globally connected state has better transport performance than the locally connected one [29]. When T 15.4 h, G will contain all stations in the HSR system. When T = 24 h, the temporal HSR network contains all trains in the HSR system and has exactly the same topological structure as the static HSR network. The smaller the T c value, the earlier the globally connected cluster is formed, the better the transport performance of the temporal HSR network, and the more efficiently the passengers can travel on HSR trains.
When starting time t 0 changes by 1 h each step in a day, T c experiences three changing stages, namely decrease (22:00 on the previous day to 8:00), stable (8:00 to 21:00), and jump (21:00 to 22:00) (Figure 3). The value of T c in the decrease and jump stages is larger than it is in the stable stage (about 2 h). Because HSR trains running between 22:00 and 8:00 the next day are too few in number, S G must spend more time (corresponding to a larger T c ) to reach its maximum. There are two possible reasons for the very low number of running HSR trains. First, only 81 of the 4559 HSR trains are planned to depart from their start terminal station between 22:00 and 6:00 the next day. Second, the maintenance skylight of China’s HSR system is set up between 0:00 and 6:00, during which all general HSR trains are suspended. In the stable stage, G contains most of the nodes in the temporal HSR network, trains running on the HSR routes are dense, and the travel efficiency of the HSR system is high. When t 0 = 22:00, S G will reach its maximum at about 8:00 on the next day, and the value of T c closes to 10 h.

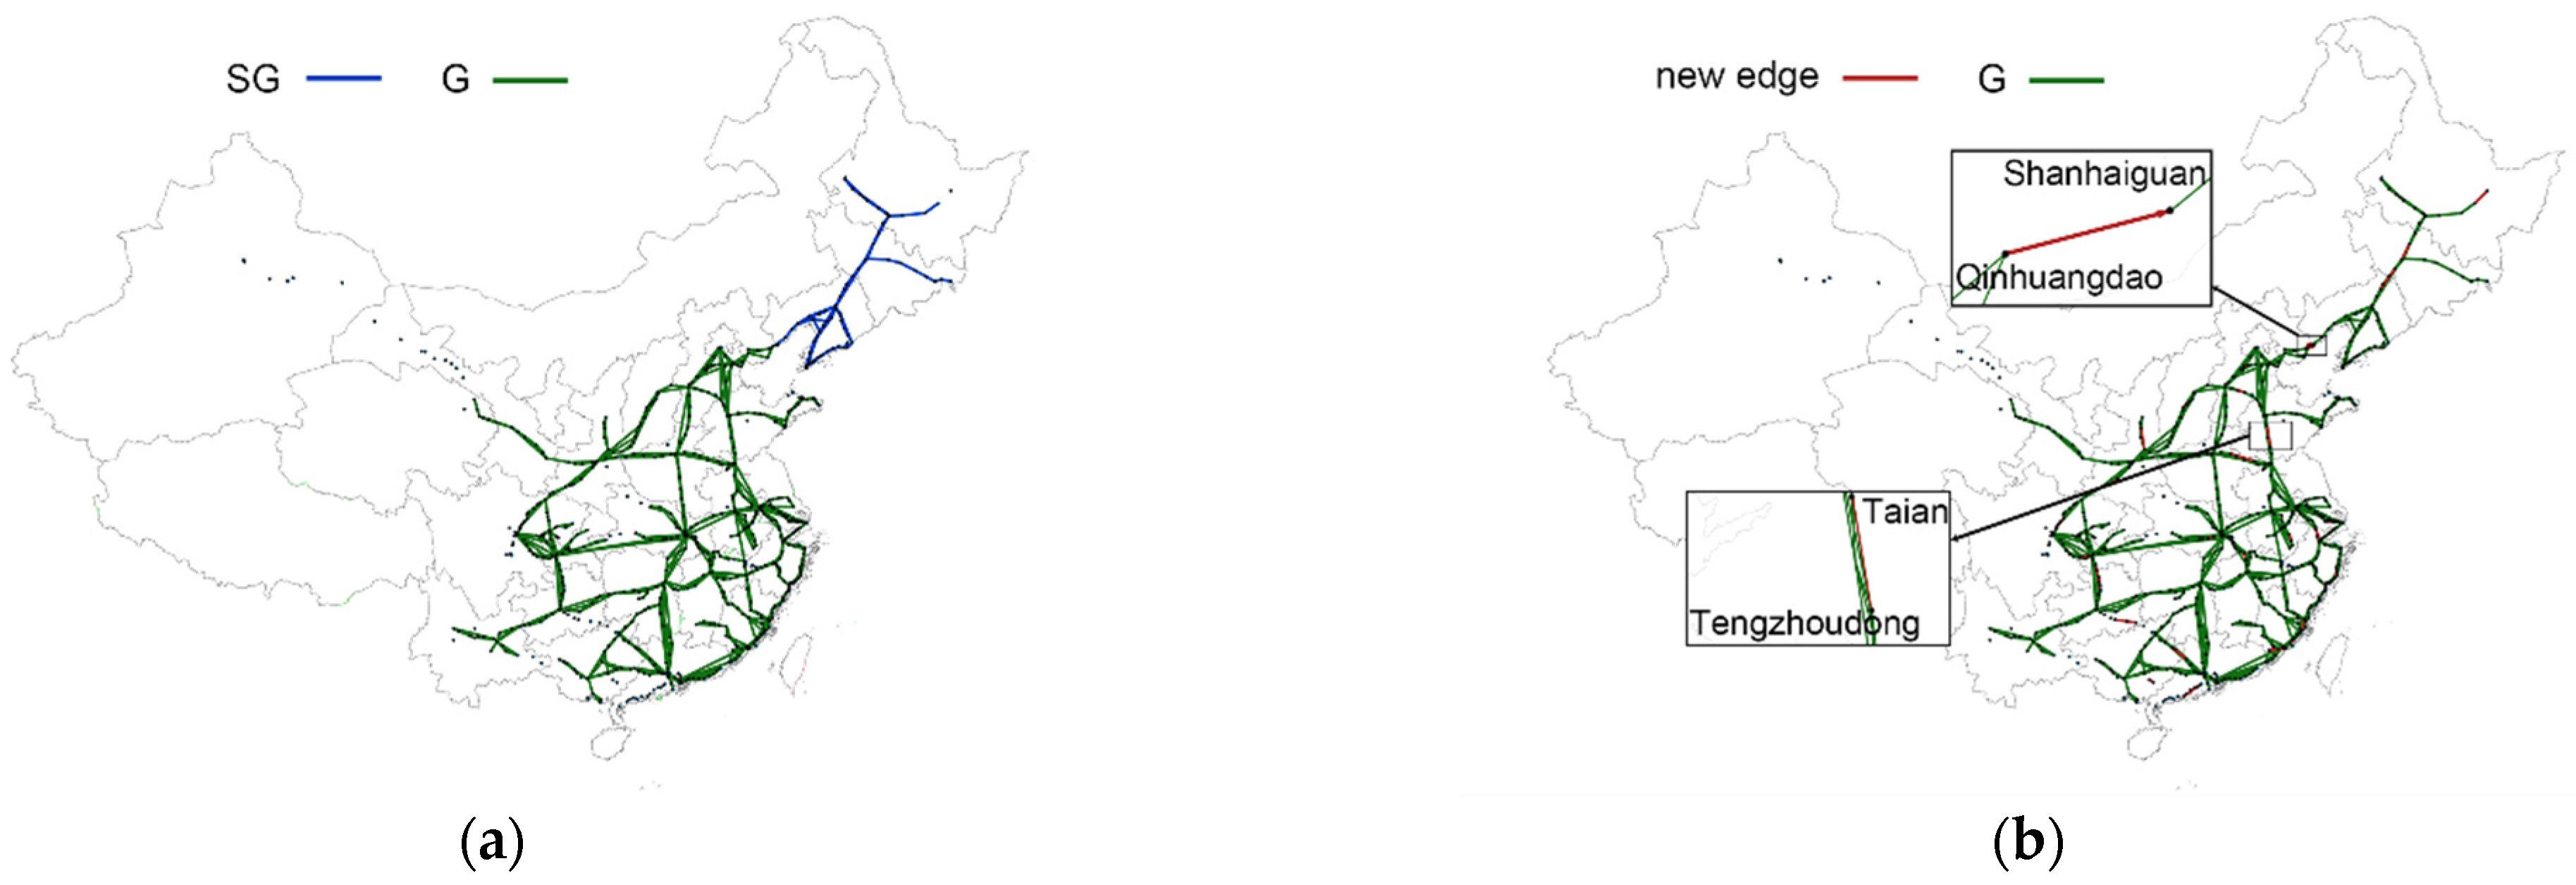
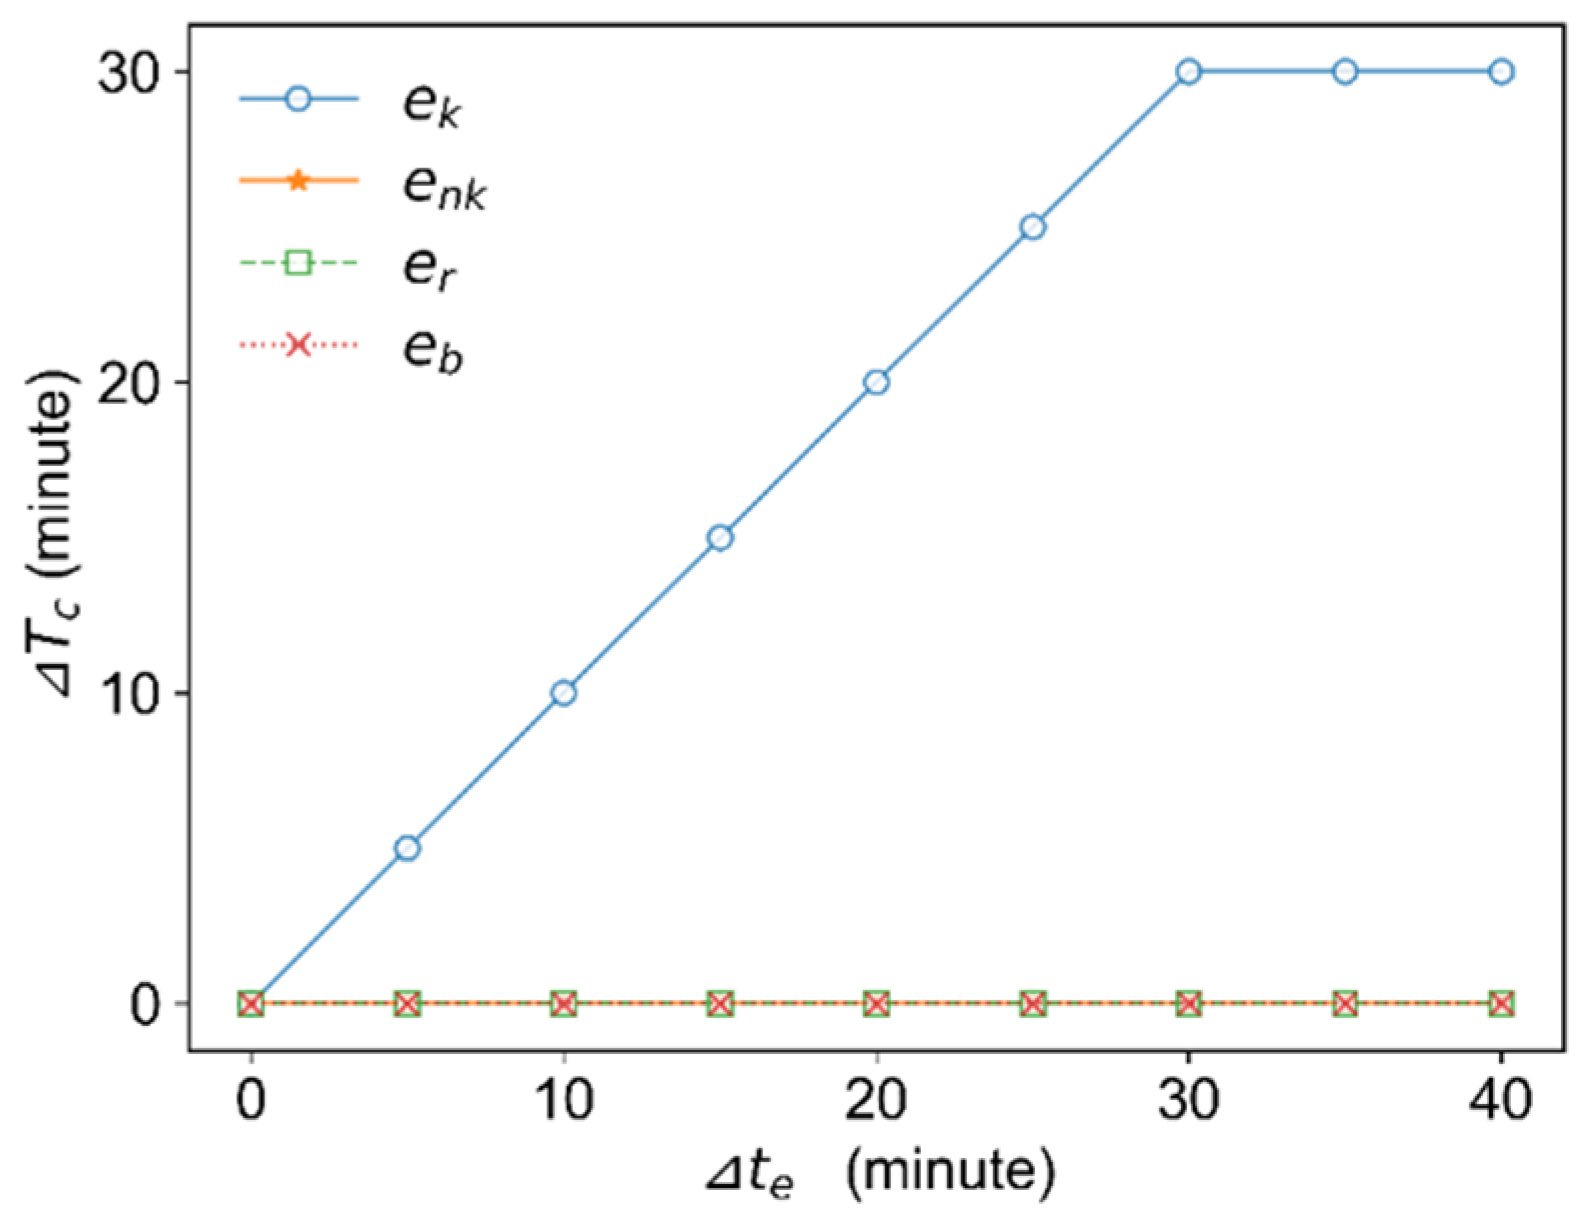
3.2. Critical Edges during Percolation Transition

Figure 4 shows the temporal HSR network before and after T c . When T T c , edges form local connected clusters. When T = T c + Δ T , some new edges link G T c and S G T c together and form a globally connected cluster, G T c + Δ T . These new edges are regarded as the critical edges ( e k ). The other new edges are denoted as non-critical edges ( e n k ). Therefore, in Figure 4b, only the new edge from Qinhuangdao to Shanhaiguan is the critical edge. The other new edges, e.g., the edge from Tengzhoudong to Taian, are not critical ones.
To study the impact of the critical edges on the global connectivity of the temporal HSR network, we delay the appearance time, t e , of different kinds of edges and focus on the variance of the critical integration time, Δ T c , after the delay. Figure 5 shows that T c increases significantly by delaying the appearance time of critical edges. Meanwhile, delaying the appearance time of the other three types of edges does not affect T c , ( Δ T c = 0 ). These results indicate that critical edges are more important than other edges for maintaining global connectivity in the HSR system from a transportation point of view. A promising approach to improving the reliability of the HSR system is improving the operations of trains that determine the appearance time of critical edges.

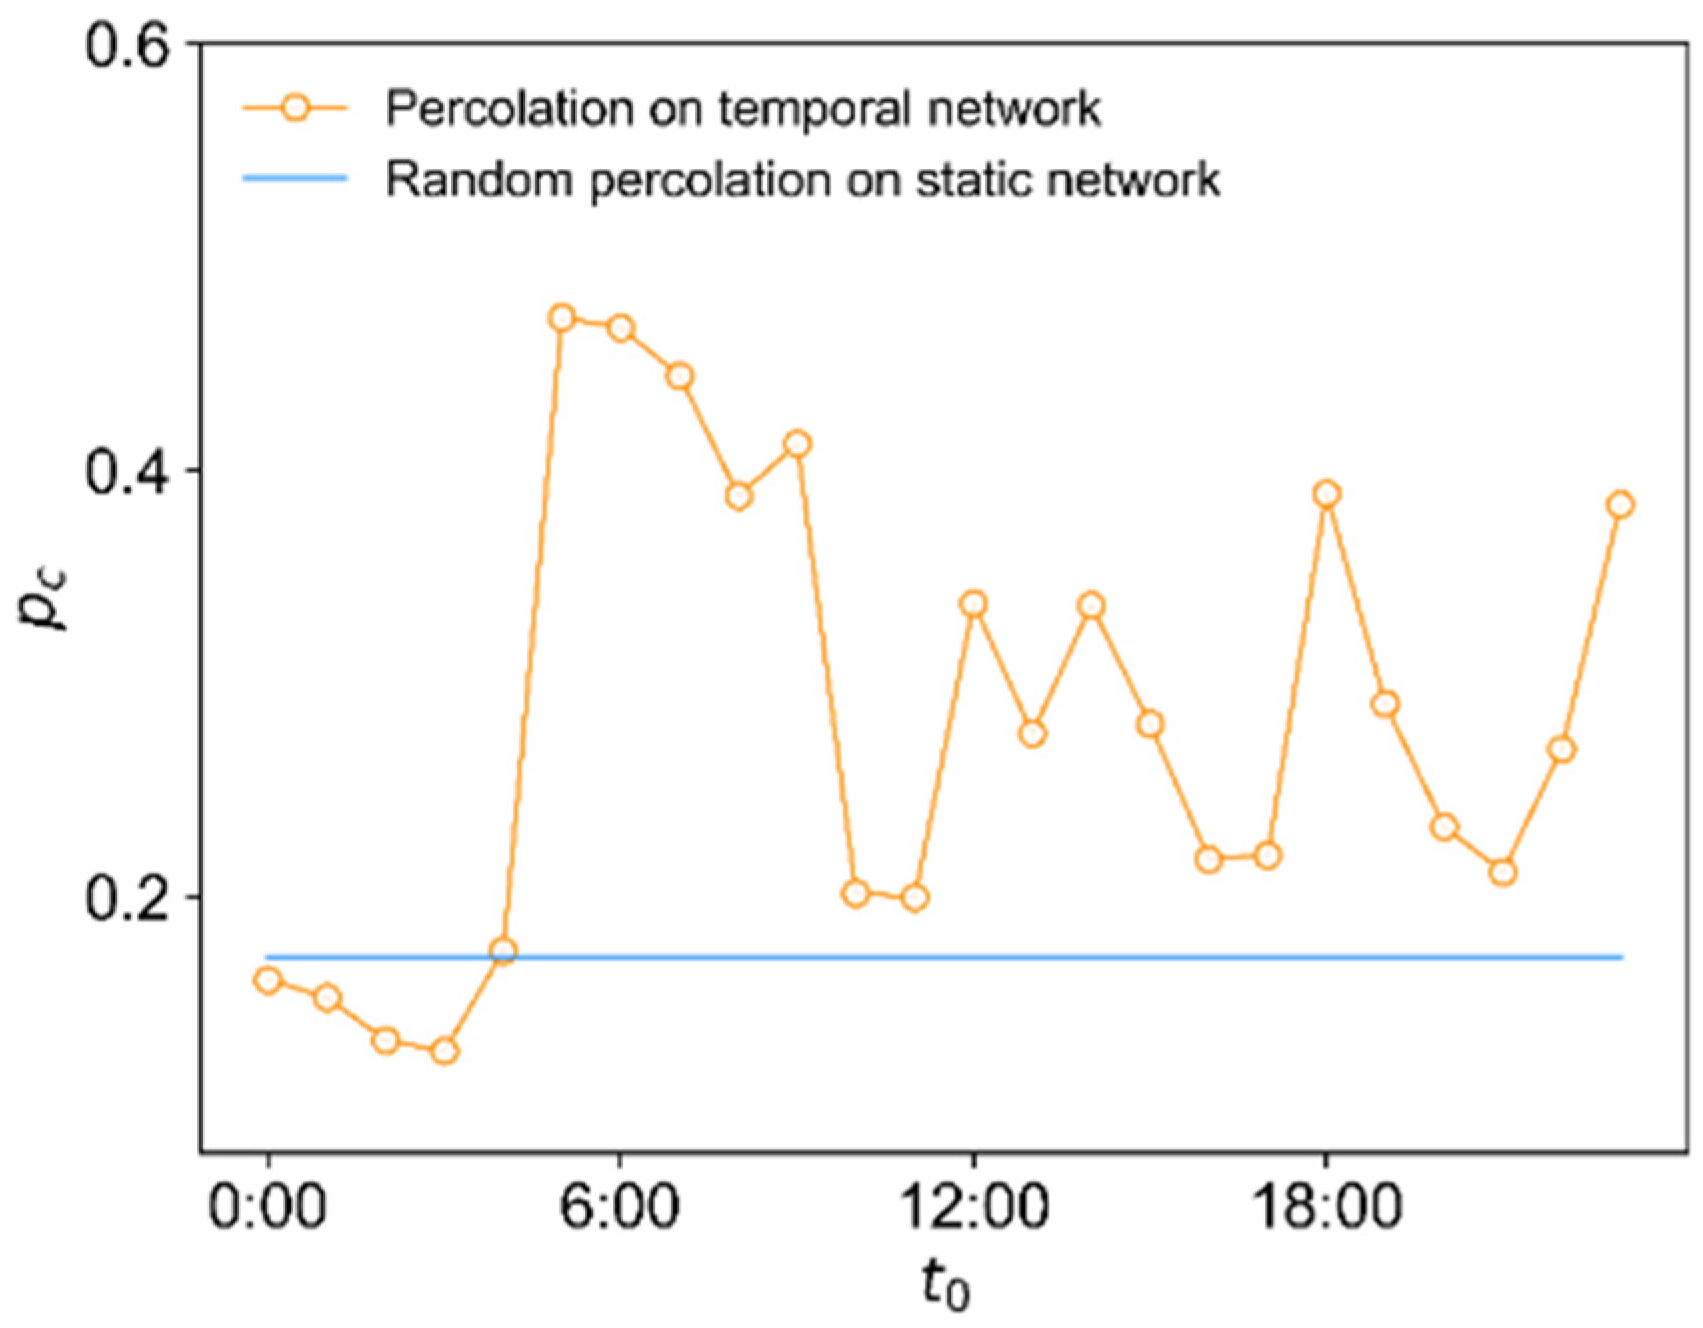
3.3. Comparison of Percolation Processes for Temporal and Static HSR Networks

To compare the percolation process for temporal and static HSR networks, we revisit the size of G and S G as the fraction ( p ) of edges changes. Here, assuming that edges are added one by one, fraction p is defined as the ratio of the number of edges when the t -th edge is added to the number of all edges ( m ) in the static HSR network. The critical fraction, p c , of a percolation process can be defined as the p when S G reaches its maximum. The larger p c , the later the network forms a globally connected cluster and the worse the connectivity of the HSR network.
For the percolation process of the temporal HSR network, edges are added based on the order of their appearance time. When t 0 = 6 : 00 , p c = 0.468 (Figure 6a). For the percolation process of the static HSR network, a random percolation [21,23] is adopted in which edges are added randomly. One experiment with random percolation is shown in Figure 6b, where p c = 0.165. Figure 6 shows that the critical fraction ( p c ) in the temporal HSR network is much larger than that in the static HSR network, which indicates that the global connectivity of the temporal HSR network is worse than that of the static HSR network. The possible reason is that new edges are spatially independent and scattered across multiple small connected clusters, which delays the appearance of the globally connected cluster.
Figure 7 shows the critical fraction p c as a function of t 0 for the temporal HSR network, where the blue line represents p c for random percolation on the static HSR network, which is averaged over 30 independent experiments. For most cases of t 0 , the critical fraction p c of the temporal HSR networks is larger than that of the static HSR network. These results indicate that the static network abstraction in previous works not only ignores the time-varying characteristics but also overestimates the global connectivity of the HSR system. Therefore, it is necessary to describe the HSR system as a temporal network to better reflect the actual structural evolution of the HSR system.

4. Conclusions

In this paper, we consider China’s HSR system as a temporal network and investigate the evolution of connected clusters as a percolation process. In the percolation process, the network will transform from local connectivity to global connectivity. In the case of local connectivity, there are scattered small clusters in the network, most stations are not connected by trains, and the transport performance of the HSR system is poor. The formation of globally connected clusters will enable the HSR system to have better transport performance. For passengers, higher transport performance provided by the HSR system can reduce travel time and travel costs. We measured the critical integration time of the percolation process for the temporal HSR network in order to determine the formation of a globally connected cluster and reflect the transport performance of the HSR system (Figure 2). We found that the critical integration time was small and stable between 8:00 and 21:00 (Figure 3), indicating that people who set out their journey by HSR train(s) in this period could be provided with more efficient travel. During the percolation process, we also identified critical edges that play a key role in the formation of a globally connected cluster (Figure 4). Importantly, we observed that delaying the formation of these critical edges slows down the integration of clusters and significantly influences the reliability of the HSR system from the view of transport performance (Figure 5). Finally, we found that the critical fraction of the percolation process for the temporal HSR network for most starting times was much larger than that of random percolation for the static HSR network (Figure 6 and Figure 7). Together, these results indicate that the previous studies, which described the HSR system as a static network, overestimated the HSR system’s global connectivity and transport performance.
The proposed framework combines temporal network and percolation theory and provides a new way of evaluating the transport performance of HSR systems along with their dynamic characteristics. These critical edges can offer opportunities to improve the reliability of HSR operations. The obtained results are also valuable in regard to optimization of HSR train path design and the setting of reasonable operating schedules [30] for the HSR system.
In our future research, we will consider how the higher-order structure [14,31,32,33] of the temporal HSR network affects the global connectivity of the HSR system. In addition, the HSR system studied in this paper is the HSR train subsystem of China’s HSR system. The other subsystems, such as the signal subsystem, also play an essential role in the dynamic operating process. A possible network approach is to model China’s HSR system as a multilayer temporal network capable of including more subsystems alongside the time-varying features.

Author Contributions

Conceptualization, Y.L.; methodology, S.Y. and L.G.; validation, L.G.; data curation, Y.L., C.Z. and P.Z.; writing—original draft preparation, Y.L. and L.G.; writing—review and editing, C.Z., P.Z., Y.W. and L.G.; visualization, Y.L. and S.Y.; supervision, L.G.; funding acquisition, Y.W. and L.G. All authors have read and agreed to the published version of the manuscript.

Funding

This research was funded by the Fundamental Research Funds for the Central Universities, grant number 2021YJS092 and 2021PT206 and the National Natural Science Foundation of China, grant number 72004177, 91746201, 91646124, 71571017, and 71621001.

Data Availability Statement

The data that support the findings of this study are available on request from the corresponding author.

Acknowledgments

This work is supported by the Fundamental Research Funds for the Central Universities under Grant No. 2021YJS092 and 2021PT206, and the National Natural Science Foundation of China (Grant Nos. 72004177, 91746201, 91646124, 71571017, and 71621001).

Conflicts of Interest

The authors declare that they have no known competing financial interest or personal relationship that could have appeared to influence the work reported in this paper.

References

  1. Li, W.D.; Hilmola, O.-P.; Wu, J.H. Chinese High-speed Railway: Efficiency Comparison and the Future. Promet-Traffic Transp. 2019, 31, 693–702. [Google Scholar] [CrossRef] [Green Version]
  2. Zhang, J.H.; Wang, M. Transportation functionality vulnerability of urban rail transit networks based on movingblock: The case of Nanjing metro. Phys. A 2019, 535, 122367. [Google Scholar] [CrossRef]
  3. Li, Q.R.; Zhang, Z.; Li, K.; Chen, L.; Wei, Z.L.; Zhang, J.C. Evolutionary dynamics of traveling behavior in social networks. Phys. A 2020, 545, 123664. [Google Scholar] [CrossRef]
  4. Liu, W.C.; Cao, Y.H.; Wu, W.; Guo, J.Y. Spatial impact analysis of trans-Yangtze highway fixed links: A case study of the Yangtze River Delta, China. J. Transp. Geogr. 2020, 88, 102822. [Google Scholar] [CrossRef]
  5. Cao, W.W.; Feng, X.N.; Zhang, H. The structural and spatial properties of the high-speed railway network in China: A complex network perspective. J. Rail Transp. Plan. Manag. 2018, 9, 46–56. [Google Scholar] [CrossRef]
  6. Wei, S.; Jiao, J.J.; Wang, L.; Xu, J.G. Evolving Characteristics of High-Speed Railway Network Structure in Yangtze River Delta, China: The Perspective of Passenger Flows. Appl. Spat. Anal. Policy 2020, 13, 925–943. [Google Scholar] [CrossRef]
  7. Wang, W.; Cai, K.Q.; Du, W.B.; Wu, X.; Tong, L.; Zhu, X.; Cao, X.B. Analysis of the Chinese railway system as a complex network. Chaos Solitons Fractals 2020, 130, 109408. [Google Scholar] [CrossRef]
  8. Xie, F.J.; Ma, M.D.; Ren, C.P. Research on multilayer network structure characteristics from a higher-order model: The case of a Chinese high-speed railway system. Phys. A 2022, 586, 126473. [Google Scholar] [CrossRef]
  9. Zhang, H.; Cui, H.D.; Wang, W.; Song, W.B. Properties of Chinese railway network: Multilayer structures based on timetable data. Phys. A 2020, 560, 125184. [Google Scholar] [CrossRef]
  10. Wang, Z.J.; Jia, L.M.; Ma, X.P.; Sun, X.H.; Tang, Q.X.; Qin, S.N. Accessibility-oriented performance evaluation of high-speed railways using a three-layer network model. Reliab. Eng. Syst. Saf. 2022, 222, 108411. [Google Scholar] [CrossRef]
  11. Li, T.; Rong, L.L. Impacts of service feature on vulnerability analysis of high-speed rail network. Transp. Policy 2012, 110, 283. [Google Scholar] [CrossRef]
  12. Meng, Z.J.; Jia, L.M.; Xiang, W.L. Complex network model for railway timetable stability optimization. IET Intell. Transp. Syst. 2018, 12, 1369–1377. [Google Scholar] [CrossRef]
  13. Holme, P.; Saramäki, J. Temporal networks. Phys. Rep. 2012, 519, 97–125. [Google Scholar] [CrossRef] [Green Version]
  14. Anwar, M.S.; Ghosh, D. Intralayer and interlayer synchronization in multiplex network with higher-order interactions. Chaos 2022, 32, 033125. [Google Scholar] [CrossRef]
  15. Ma, H.K.; Yang, C.D. Exponential Synchronization of Hyperbolic Complex Spatio-Temporal Networks with Multi-Weights. Mathematics 2022, 10, 2451. [Google Scholar] [CrossRef]
  16. DiBrita, N.S.; Eledlebi, K.; Hildmann, H.; Culley, L.; Isakovic, A.F. Temporal Graphs and Temporal Network Characteristics for Bio-Inspired Networks during Optimization. Appl. Sci. 2022, 12, 1315. [Google Scholar] [CrossRef]
  17. Pan, R.K.; Saramaki, J. Path lengths, correlations, and centrality in temporal networks. Phys. Rev. E 2011, 84, 061605. [Google Scholar] [CrossRef] [Green Version]
  18. Mou, J.H.; Liu, C.C.; Chen, S.R.; Hang, G.; Lv, X. Temporal Characteristics of the Chinese Aviation Network and their Effects on the Spread of Infectious Diseases. Sci. Rep. 2017, 7, 1275. [Google Scholar] [CrossRef] [Green Version]
  19. Li, M.; Liu, R.R.; Lv, L.Y.; Hu, M.B.; Xu, S.Q.; Zhang, Y.C. Percolation on complex networks: Theory and application. Phys. Rep. 2021, 907, 1–68. [Google Scholar] [CrossRef]
  20. Wang, F.L.; Li, D.Q.; Xu, X.Y.; Wu, R.Q.; Havlin, S. Percolation properties in a traffic model. Europhys. Lett. 2015, 112, 38001. [Google Scholar] [CrossRef]
  21. Kim, J.-H.; Kim, S.-J.; Goh, K.-I. Critical behaviors of high-degree adaptive and collective-influence percolation. Chaos 2020, 30, 073131. [Google Scholar] [CrossRef] [PubMed]
  22. Gao, J.X.; Liu, X.M.; Li, D.Q.; Havlin, S. Recent Progress on the Resilience of Complex Networks. Energies 2015, 8, 12187–12210. [Google Scholar] [CrossRef] [Green Version]
  23. Malekan, A.; Saber, S.; Saberi, A.A. Exact finite-size scaling for the random-matrix representation of bond percolation on square lattice. Chaos 2022, 32, 023112. [Google Scholar] [CrossRef] [PubMed]
  24. Li, D.Q.; Fu, B.W.; Wang, Y.P.; Lu, G.Q.; Berezin, Y.; Stanley, H.E.; Havlin, S. Percolation transition in dynamical traffic network with evolving critical bottlenecks. Proc. Natl. Acad. Sci. USA 2015, 112, 669–672. [Google Scholar] [CrossRef] [PubMed] [Green Version]
  25. Hamedmoghadam, H.; Jalili, M.; Vu, H.L.; Stone, L. Percolation of heterogeneous flows uncovers the bottlenecks of infrastructure networks. Nat. Commun. 2021, 12, 1254. [Google Scholar] [CrossRef] [PubMed]
  26. Zeng, G.W.; Li, D.Q.; Guo, S.M.; Gao, L.; Gao, Z.Y.; Stanley, H.E.; Havlin, S. Switch between critical percolation modes in city traffic dynamics. Proc. Natl. Acad. Sci. USA 2019, 116, 23–28. [Google Scholar] [CrossRef] [Green Version]
  27. Liu, S.Y.; Li, Z.F.; Zhong, J.L. Percolation transition in temporal airport network. Chin. J. Aeronaut. 2020, 33, 219–226. [Google Scholar] [CrossRef]
  28. Ru, W.; Tan, J.X.; Xin, W.; Wang, D.J.; Xu, C. Geographic coarse graining analysis of the railway network of China. Phys. A 2008, 387, 5639–5646. [Google Scholar]
  29. Zhang, J.H.; Hu, F.N.; Wang, S.L.; Dai, Y.; Wang, Y.X. Structural vulnerability and intervention of high speed railway networks. Phys. A 2016, 462, 743–751. [Google Scholar] [CrossRef]
  30. Wang, Z.Y.; Zhou, L.S.; Guo, B.; Chen, X.; Zhou, H.X. An efficient hybrid approach for scheduling the train timetable for the longer distance high-Speed railway. Sustainability 2021, 13, 2538. [Google Scholar] [CrossRef]
  31. Benson, A.R.; Gleich, D.F.; Leskovec, J. Higher-order organization of complex networks. Science 2016, 353, 163–166. [Google Scholar] [CrossRef] [PubMed]
  32. Yang, H.J.; Le, M.L. High-order community detection in the air transport industry: A comparative analysis among 10 major international airlines. Appl. Sci. 2021, 11, 9378. [Google Scholar] [CrossRef]
  33. Sun, H.L.; Bianconi, G. Higher-order percolation processes on multiplex hypergraphs. Phys. Rev. E 2021, 104, 034306. [Google Scholar] [CrossRef] [PubMed]
Figure 1. Edge forming condition for the temporal HSR network.
Mathematics 10 04695 g001
Figure 2. Dynamic percolation process for the temporal HSR network ( t 0 = 6:00).
Mathematics 10 04695 g002
Figure 3. T c as a function of t 0 .
Mathematics 10 04695 g003
Figure 4. Connected clusters of the temporal HSR network around T c ( t 0 = 6:00). (a) Connected clusters of the temporal HSR network at T = T c . (b) Connected clusters of the temporal HSR network at T = T c + Δ T .
Mathematics 10 04695 g004
Figure 5. Δ T c as a function of Δ t e ( t 0 = 6 : 00 ). e k : critical edge; e n k : non-critical edge; er: random selected edge; e k : maximal betweenness edge.
Mathematics 10 04695 g005
Figure 6. Comparison of percolation processes for (a) temporal and (b) static HSR networks.
Mathematics 10 04695 g006
Figure 7. Critical fraction p c as a function of starting time t 0 .
Mathematics 10 04695 g007
Publisher’s Note: MDPI stays neutral with regard to jurisdictional claims in published maps and institutional affiliations.

