1. Introduction
Risk managers can consider a large set of assets, greater than the size of their portfolios, with the use of financial big data. In particular, when it comes to capturing the systematic risk built into markets, this usefulness can result in a higher accuracy of risk prediction. Therefore, in order to maintain the financial markets’ stability and thereby lower the likelihood that a systemic risk materializes, financial regulators can benefit from a high level of accuracy in risk prediction for market participants.
The financial data of public companies are typically published on a relatively rare basis, which causes a clear time lag. Meanwhile, financial data tend to have a more frequent rate of appearance in financial news.
The approaches for portfolio weighting and stock selection are notably insensitive as a result of the rising popularity of high-frequency trading. In actuality, the information that investors can view in real time is stock trading data, such as the opening, highest, lowest and closing price of stock, as well as various technical indicators, and so on. In addition, investors can now use their decision sentiments based on text data found within financial news on the web, which can then be incorporated into stock-investment-value analysis, thanks to the growing availability of web-based data.
As asset prices incorporate many characteristics into their value, classical and modern approaches can be classified into two types, depending on the data that were modelled to predict asset prices. Thus, the fundamental approach may include such data as stock information parameters and “balance sheet & profit and loss statement parameters” [
1]. Meanwhile, in [
2], the two are grouped by company analysis, industry analysis [
2], macroeconomic indicators [
2], political circumstances [
3] and geographical and meteorological circumstances [
3]. Meanwhile, technical analysis refers to the analysis of prices [
3], sentiment, raw data, volume, cycle, volatility, flow of funds [
2] or other technical indicators [
1].
While most of the technical and fundamental data are provided in a structured manner in the classical approaches, the modern approaches may perform on unstructured data sources, mainly reached through web-based financial news, social media, blogs, web-based forums and so on [
4]. With an increasing number of websites and internet users, it can be challenging to locate and organize relevant information. Web scraping is the process of extracting information from a website by “scraping” it. Theoretically, it is feasible to scrape other data sources, such as document papers. Nonetheless, the vast majority of scraping is often performed on webpages.
As in behavioral economics, prices are purely a perceived value [
5]. It is reasonable to search for the impact of society’s opinions on the asset prices. This technique is called opinion mining, and it consists of identifying sentiments (positive or negative) through words.
Many academics now use investor sentiment to forecast stock price movement and portfolio optimization [
6,
7,
8]. Pertinent studies on the use of online messaging to forecast stock market movements were compiled by [
9] in their article. Their empirical findings imply that network messaging has some potential for applications in financial forecasting.
In order to examine the investment worth of equities, numerous academics have also started fusing together data from other sources. A number of stock-price-prediction experiments using numerous data sources have been conducted, including those by [
10,
11,
12,
13], among others. As far as we are aware, some academics have also suggested using big data to study stock selection and portfolio optimization, but the viability of this suggestion has not been proven (i.e., [
7]). Therefore, our goal is to demonstrate how data science techniques may be used to identify stocks that are suitable for investment in a securities market with a lot of assets.
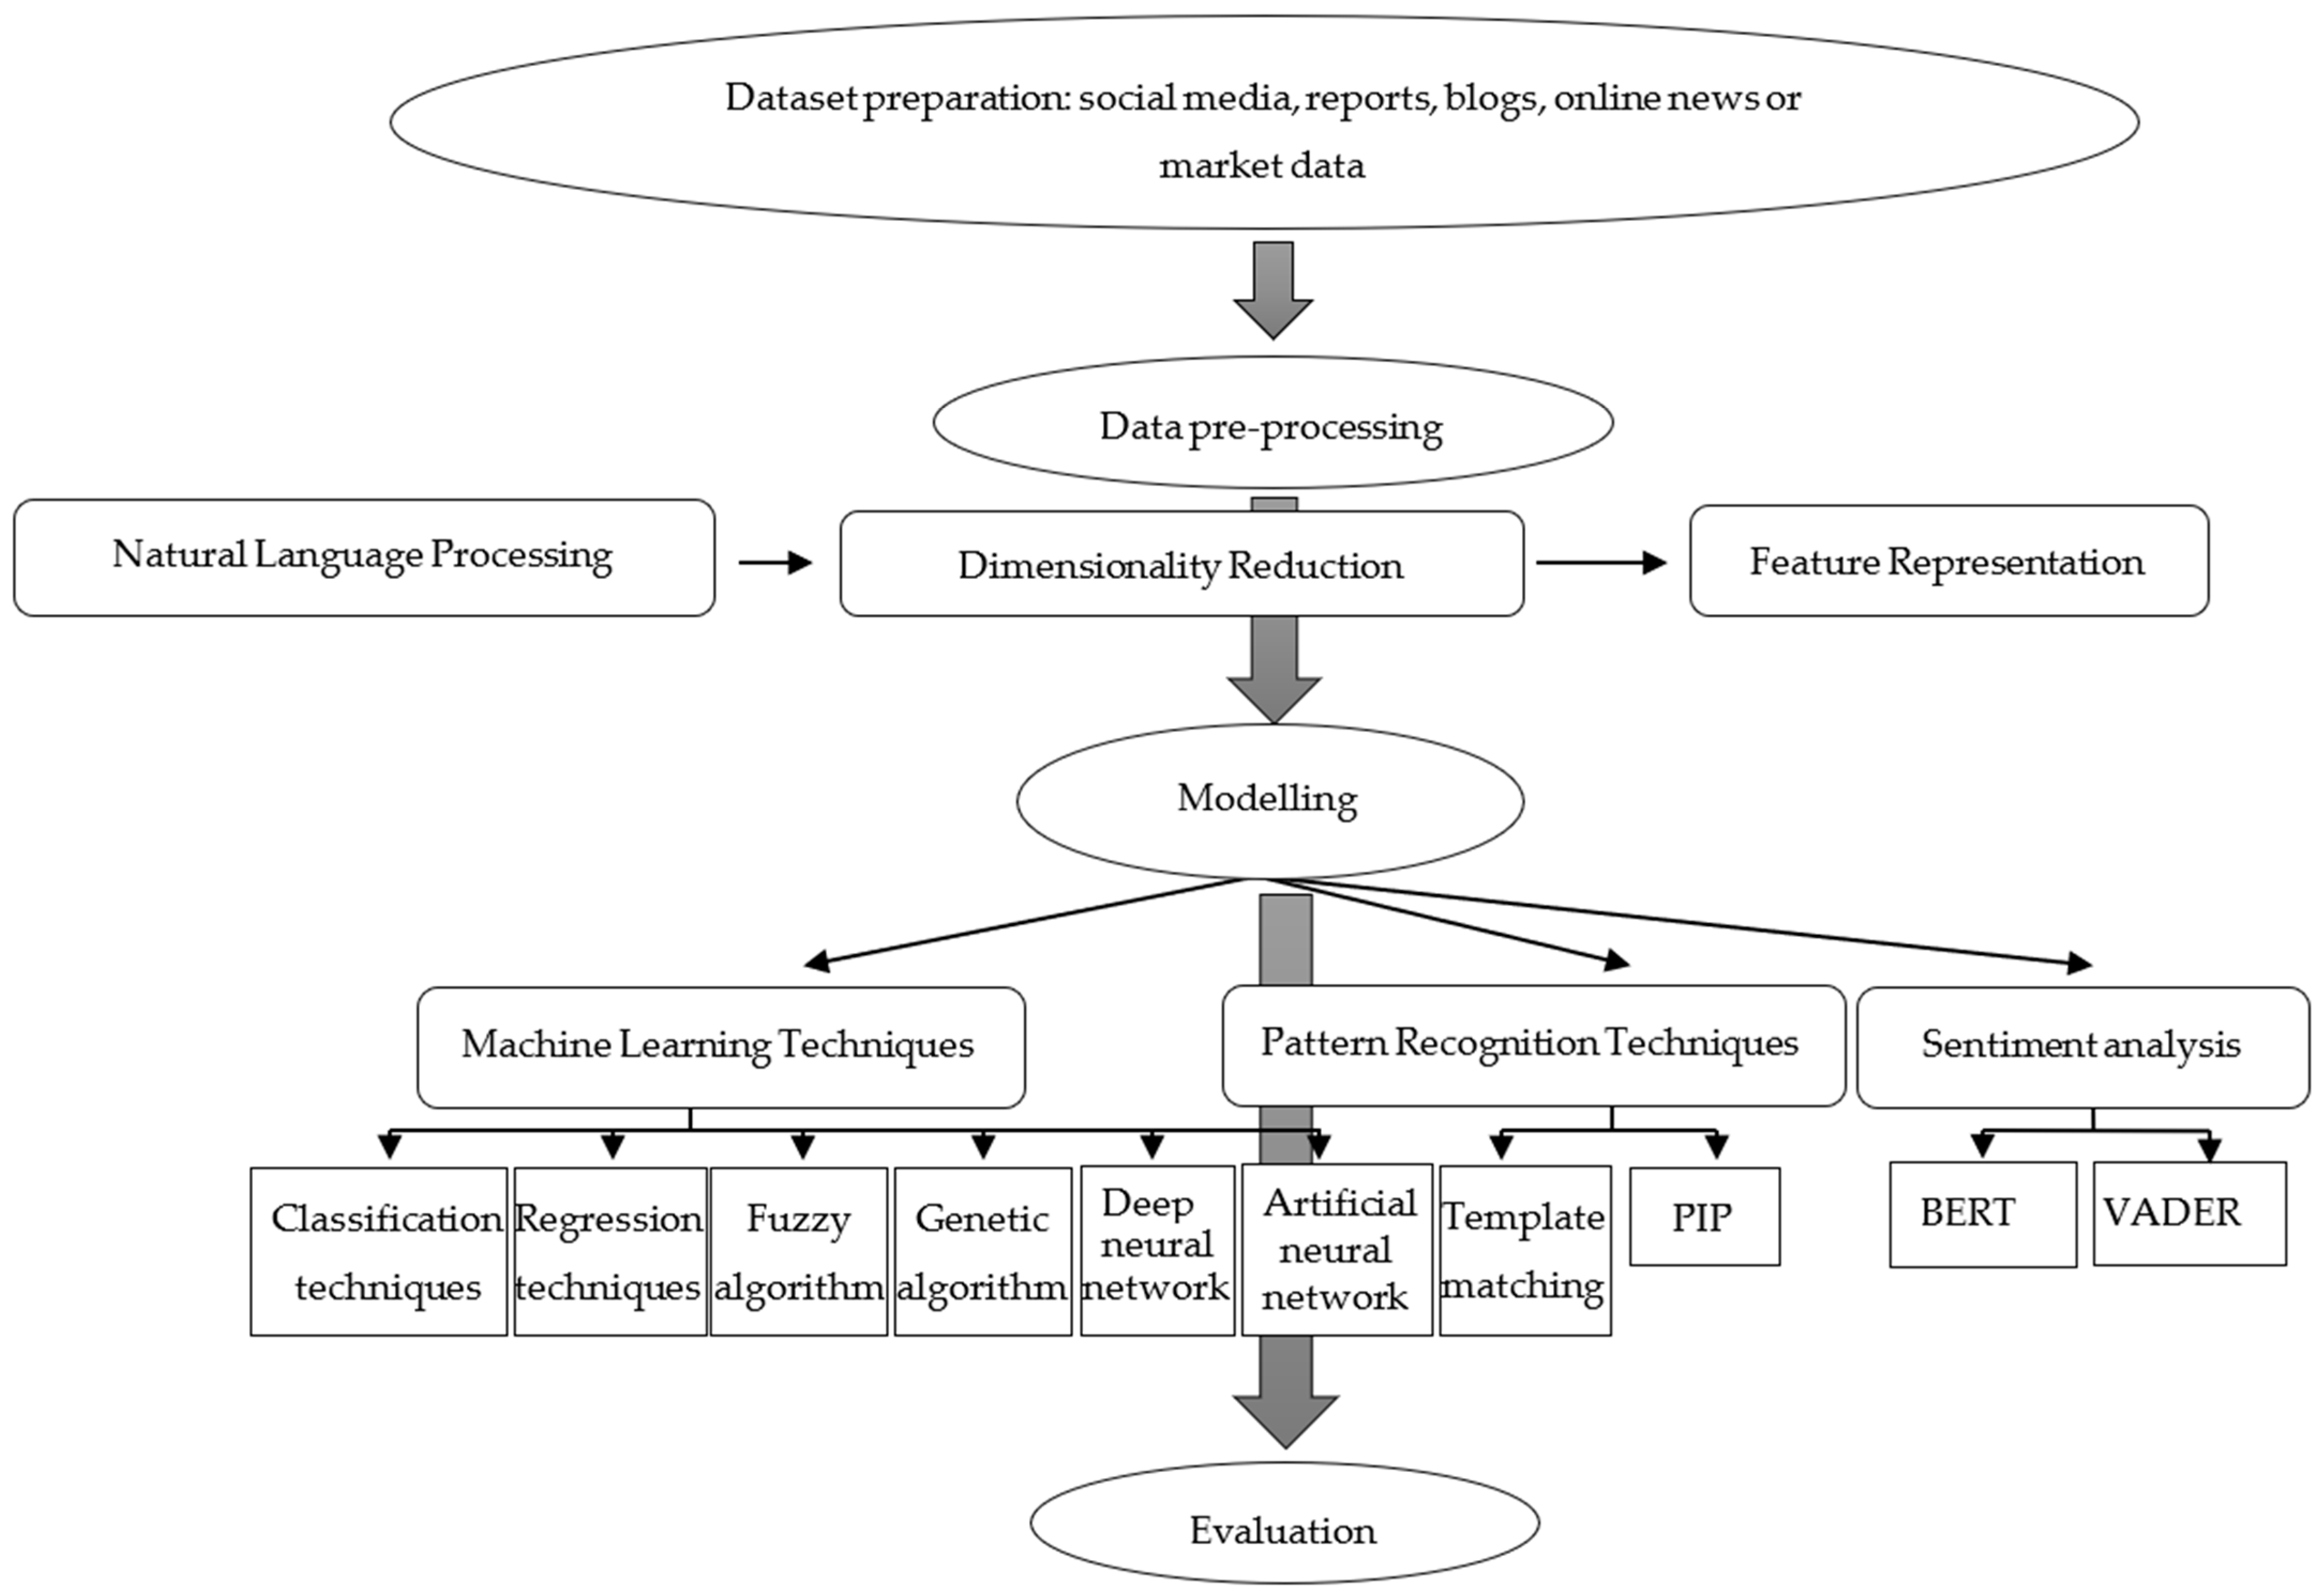
The recent literature proposes many stock-market-prediction techniques, useful for both technical and fundamental analysis. Machine learning algorithms include classification techniques (support vector machines, k-nearest neighbors, logistic regressions, naïve Bayes, decision tree classification and random forest classification), regression techniques (polynomial regression, simple linear regression, decision tree regression, random forest regression and support vector regression), fuzzy logic algorithms, deep neural networks, genetic algorithms and artificial neural networks [
14,
15,
16,
17,
18]. In [
15], two pattern-recognition techniques were found, namely template matching and perceptually important points (PIPs).
More phases were proposed in the machine-learning market-prediction process, which can be summarized by three phases, as
Figure 1 shows:
In [
3], feature selection techniques were classified as follows: bag of words; n-grams as continuous sequences of words; genetic algorithms; and colony optimization. Meanwhile, feature representation techniques may include information gain (IG), chi-square statistics (CHI), document frequency (DF), accuracy balanced (ACC2), term frequency–inverse document frequency (TF–IDF), binary/Boolean (0/1) or sentiment value.
The analysis of human opinions expressed in text is known as sentiment analysis and is one of the natural language processing (NLP) tasks [
19]. Obtaining categories according to polarity (positive/negative/neutral expression), topic classification (determining the subjectivity or objectivity of an expression), and irony detection (determining whether a phrase is ironic) are the main objectives of sentiment analysis, based on different levels of granularity, such as documents, sentences or aspects. Thanks to the development of social networks and their usage in various industries, such as consumer goods and healthcare, financial sentiment analysis has a wide range of possible applications.
Sentiment analysis may usually include some feature representation techniques along with machine learning techniques (e.g., the bag-of-words model plus support vector machines [
20]), but some models have been widely used, namely Pre-training of Deep Bidirectional Transformers (BERT) and the Valence Aware Dictionary for Sentiment Reasoning (VADER) [
21,
22,
23].
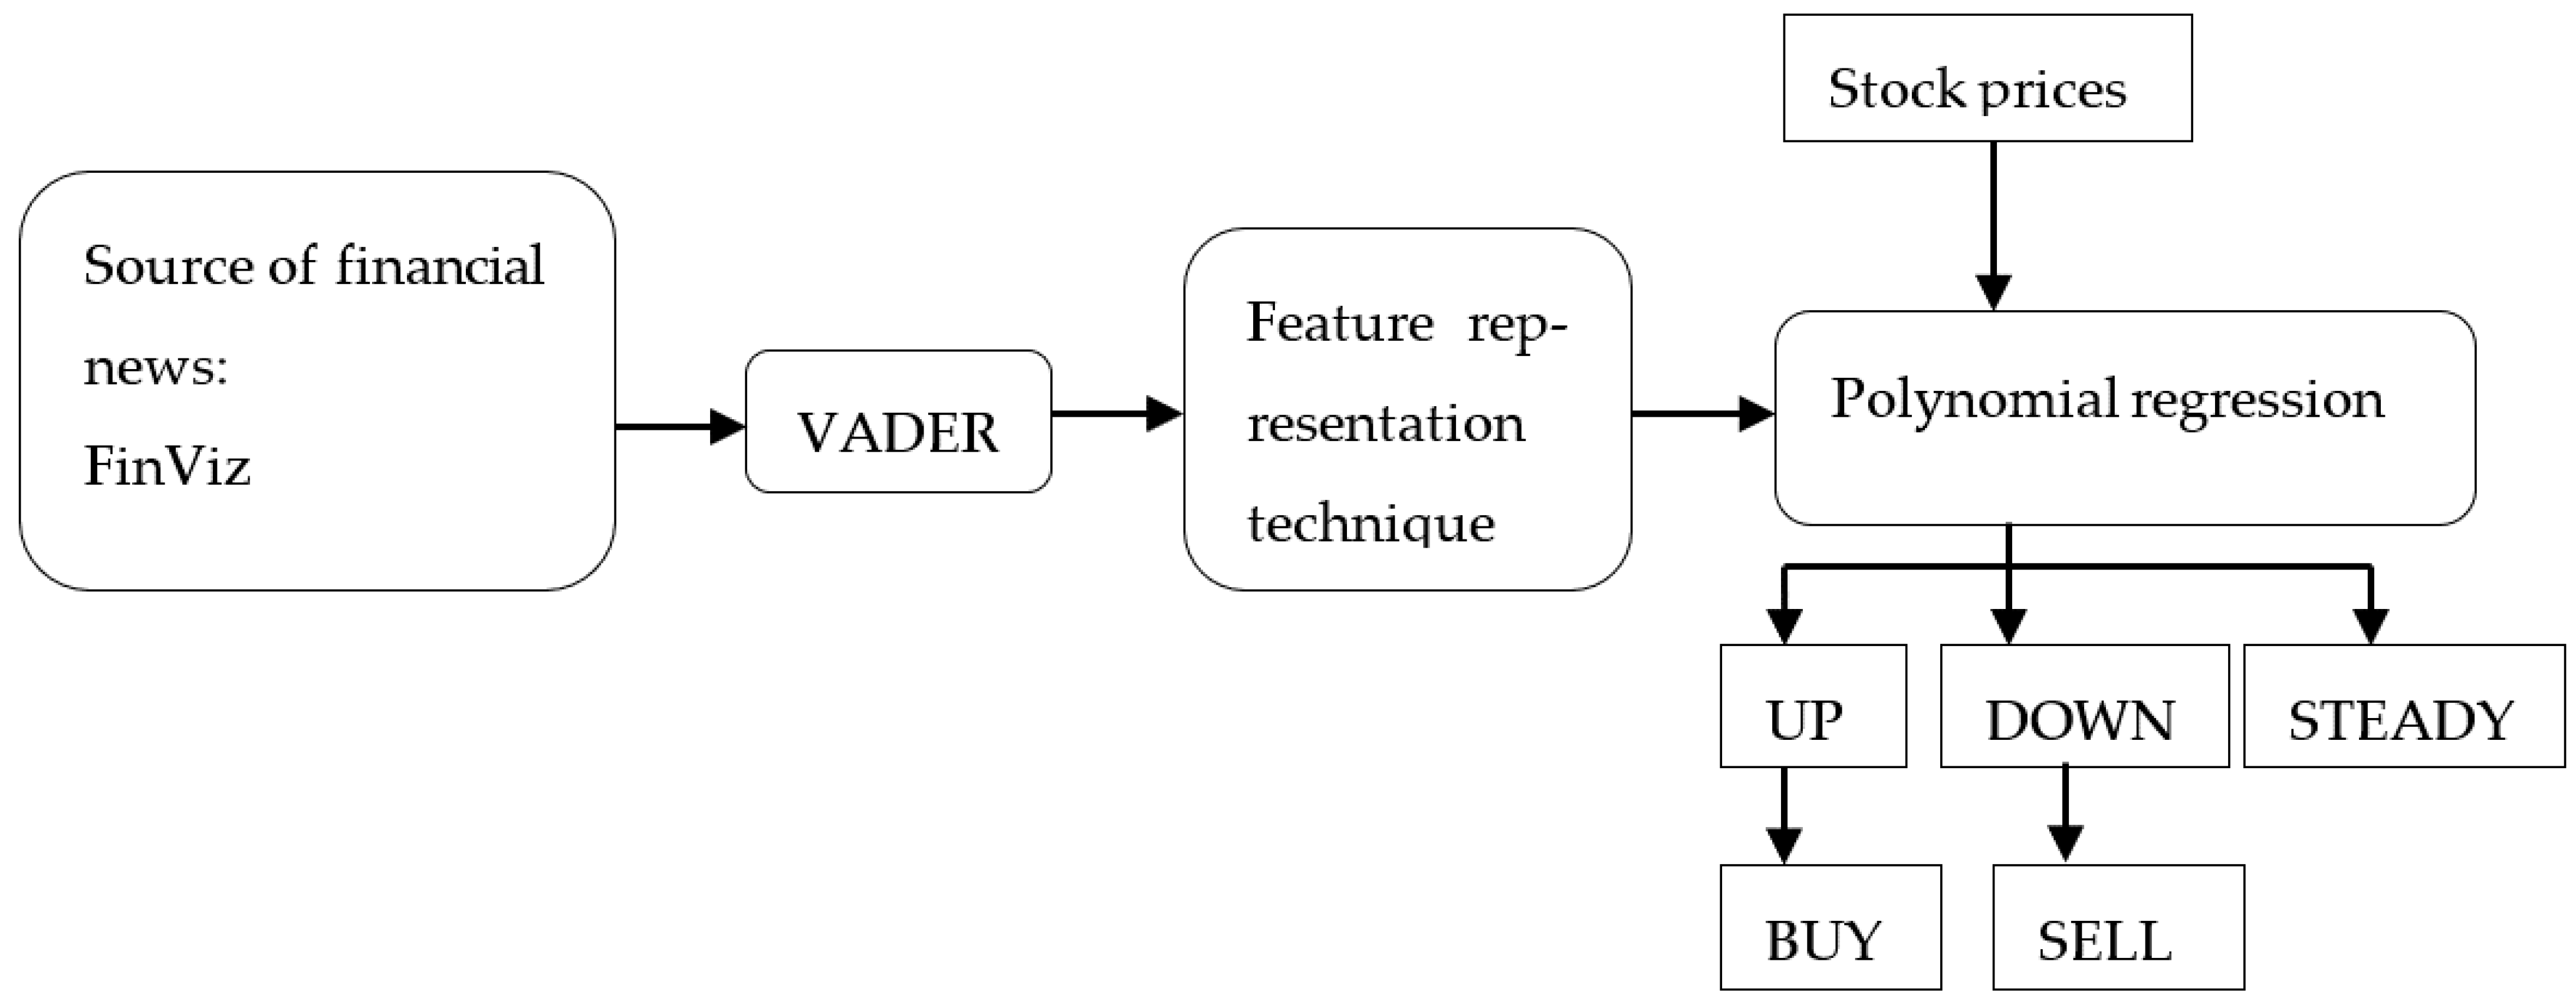
The next section includes the methodological approach used in order to incorporate sentiment analysis in market predictions, while the research design is presented in
Figure 2. To reach our purpose, we used an autoregression with an exogenous factor model (ARX), along with quadratic and cubic regressions. In the third section, the results are presented, starting with graphs that cover the sentiment score for each of the analyzed stock. Additionally, a scatter plot constructing the relationship between the sentiment score and the stock opening price is presented in
Section 3.1. In
Section 3.2, the regression models are presented and discussed, while the importance of integrating the sentiment score into these regressions is highlighted. In
Section 4, the discussion of the results and a comparison with similar studies is introduced, while the last section focuses on the main conclusions.
2. Materials and Methods
In order to perform our analysis, we used the FinViz platform to gain financial news on various active stocks. We also made use of Python, which was the second-most popular programming language in 2020, behind C [
24]. This programming language introduced in 1991 received subsequent reworks over the years, with the most significant upgrade occurring in 2008 with the release of Python 3.0. Python presents an extensive standard library with various useful tools, such as BeautifulSoup, a package that can be used for scraping and parsing website data [
25].
After the selection of the data source, we ran a Python script that uses BeautifulSoup to scrape article headlines from FinViz, which is a platform for researching the stock market that is available through a web browser [
26]. Afterwards, we used VADER to run the sentiment analysis, and we used Pandas (the Python data analysis library) to analyze and return the resultant sentiment analysis scores for the headlines of the financial articles.
BeautifulSoup is the most popular package for scraping and parsing website data. According to the makers of the library, it can interpret any input. BeautifulSoup does this by employing simple methods and Pythonic idioms to construct a navigable and searchable parse tree. The benefit of utilizing BeautifulSoup is that it translates parsed data to UTF-8, a widely used format on the internet [
27]. The web scraper we used for data collection was created using tools available in the BeautifulSoup library.
In order to conduct sentiment analysis, it is necessary to apply a model. VADER (which stands for “Valence Aware Dictionary for Sentiment Reasoning”) is a simple rule-based model for general sentiment analysis. This model is sensitive to both polarity and the strength of emotion, and it can be applied to unlabeled text data. VADER is included in the NLTK package, which represents a platform for the building of Python programs that enable working with human language data [
28]. VADER shares the benefits of traditional sentiment lexicons, such as LIWC (linguistic inquiry and word count) and improves upon them. VADER differs from LIWC in that it generalizes more favorably to different domains and is more responsive to sentiment expressions in social media environments. Hutto and Gilbert were able to design and empirically validate a set of lexical characteristics that are particularly sensitive to sentiment in microblog-like circumstances. VADER performed as well as eleven other highly regarded sentiment analysis tools [
22]. Therefore, VADER can be used for the sentiment analysis of headlines regarding financial news published in the online environment and shared on social media. However, it is important to mention that there were various dates in which the selected stocks were not covered by the major finance news publications that FinViz collects its data from; therefore, the sentiment score was 0.
After the sentiment score was obtained, in the modelling phase two linear autoregressions were performed; one without an exogenous factor and one with one (the exogenous factor being the sentiment score) as Equation (1) and Equation (2), respectively, show:
where
is the intercept,
is the slope,
yt−1/2/3/4 are the stock-opening-price change variables in the previous days,
x and
xt−1 are the sentiment score exogenous variables in the present and previous days and
is the error term.
y is the stock price change in time
t.
Meanwhile linear, quadratic and cubic regressions were used in order to analyze the relation between the sentiment score and the stock-opening-price change. The relation for the linear, quadratic and cubic autoregressions are presented in Equation (3), Equation (4) and Equation (5), respectively:
where
y is the stock opening price change,
,
,
and
are the unknown parameters,
x is the sentiment score variable and
is the error term. Y is the stock price change in time
t.
After running the linear, quadratic and cubic regressions, we ran a nonlinear autoregression with an exogenous factor (NARX) as can be seen in Equation (6):
where
y is the opening price change in time
t,
x is the sentiment score and
yt-1/2/3/4 are the opening price changes in time
t−1,
t−2,
t−3 and
t−4.
In order to perform our regression, we used ordinary least squares in SPSS.
We also used aggregated data in order to perform linear autoregressions with and without an exogenous factor, in which the sentiment score was aggregated with the market capitalization weight. The results show that the models with of equal weight had better determinant coefficients for the training data; therefore, we maintained an equal weight for all of the regressions included in the present study.
The time period analyzed covers data from August–September 2022, consisting of a total of 37 days. All data were aggregated using equal weight.
Most of the companies engaged in the study were selected from the S&P 500 due to their popularity, as well as the fact that any investor who is interested in the stock market and invests in this index is exposed to them. One company, Unity Technologies, was selected due to its recent IPO (initial public offering) on 17.09.2020 [
29]. Additionally, we included a company that it is not based in United States, SONY, to observe the difference in sentiment scores of the news of companies within and beyond the United States. The market data from the companies were extracted from The New York Stock Exchange.
3. Results
3.1. Sentiment Analysis
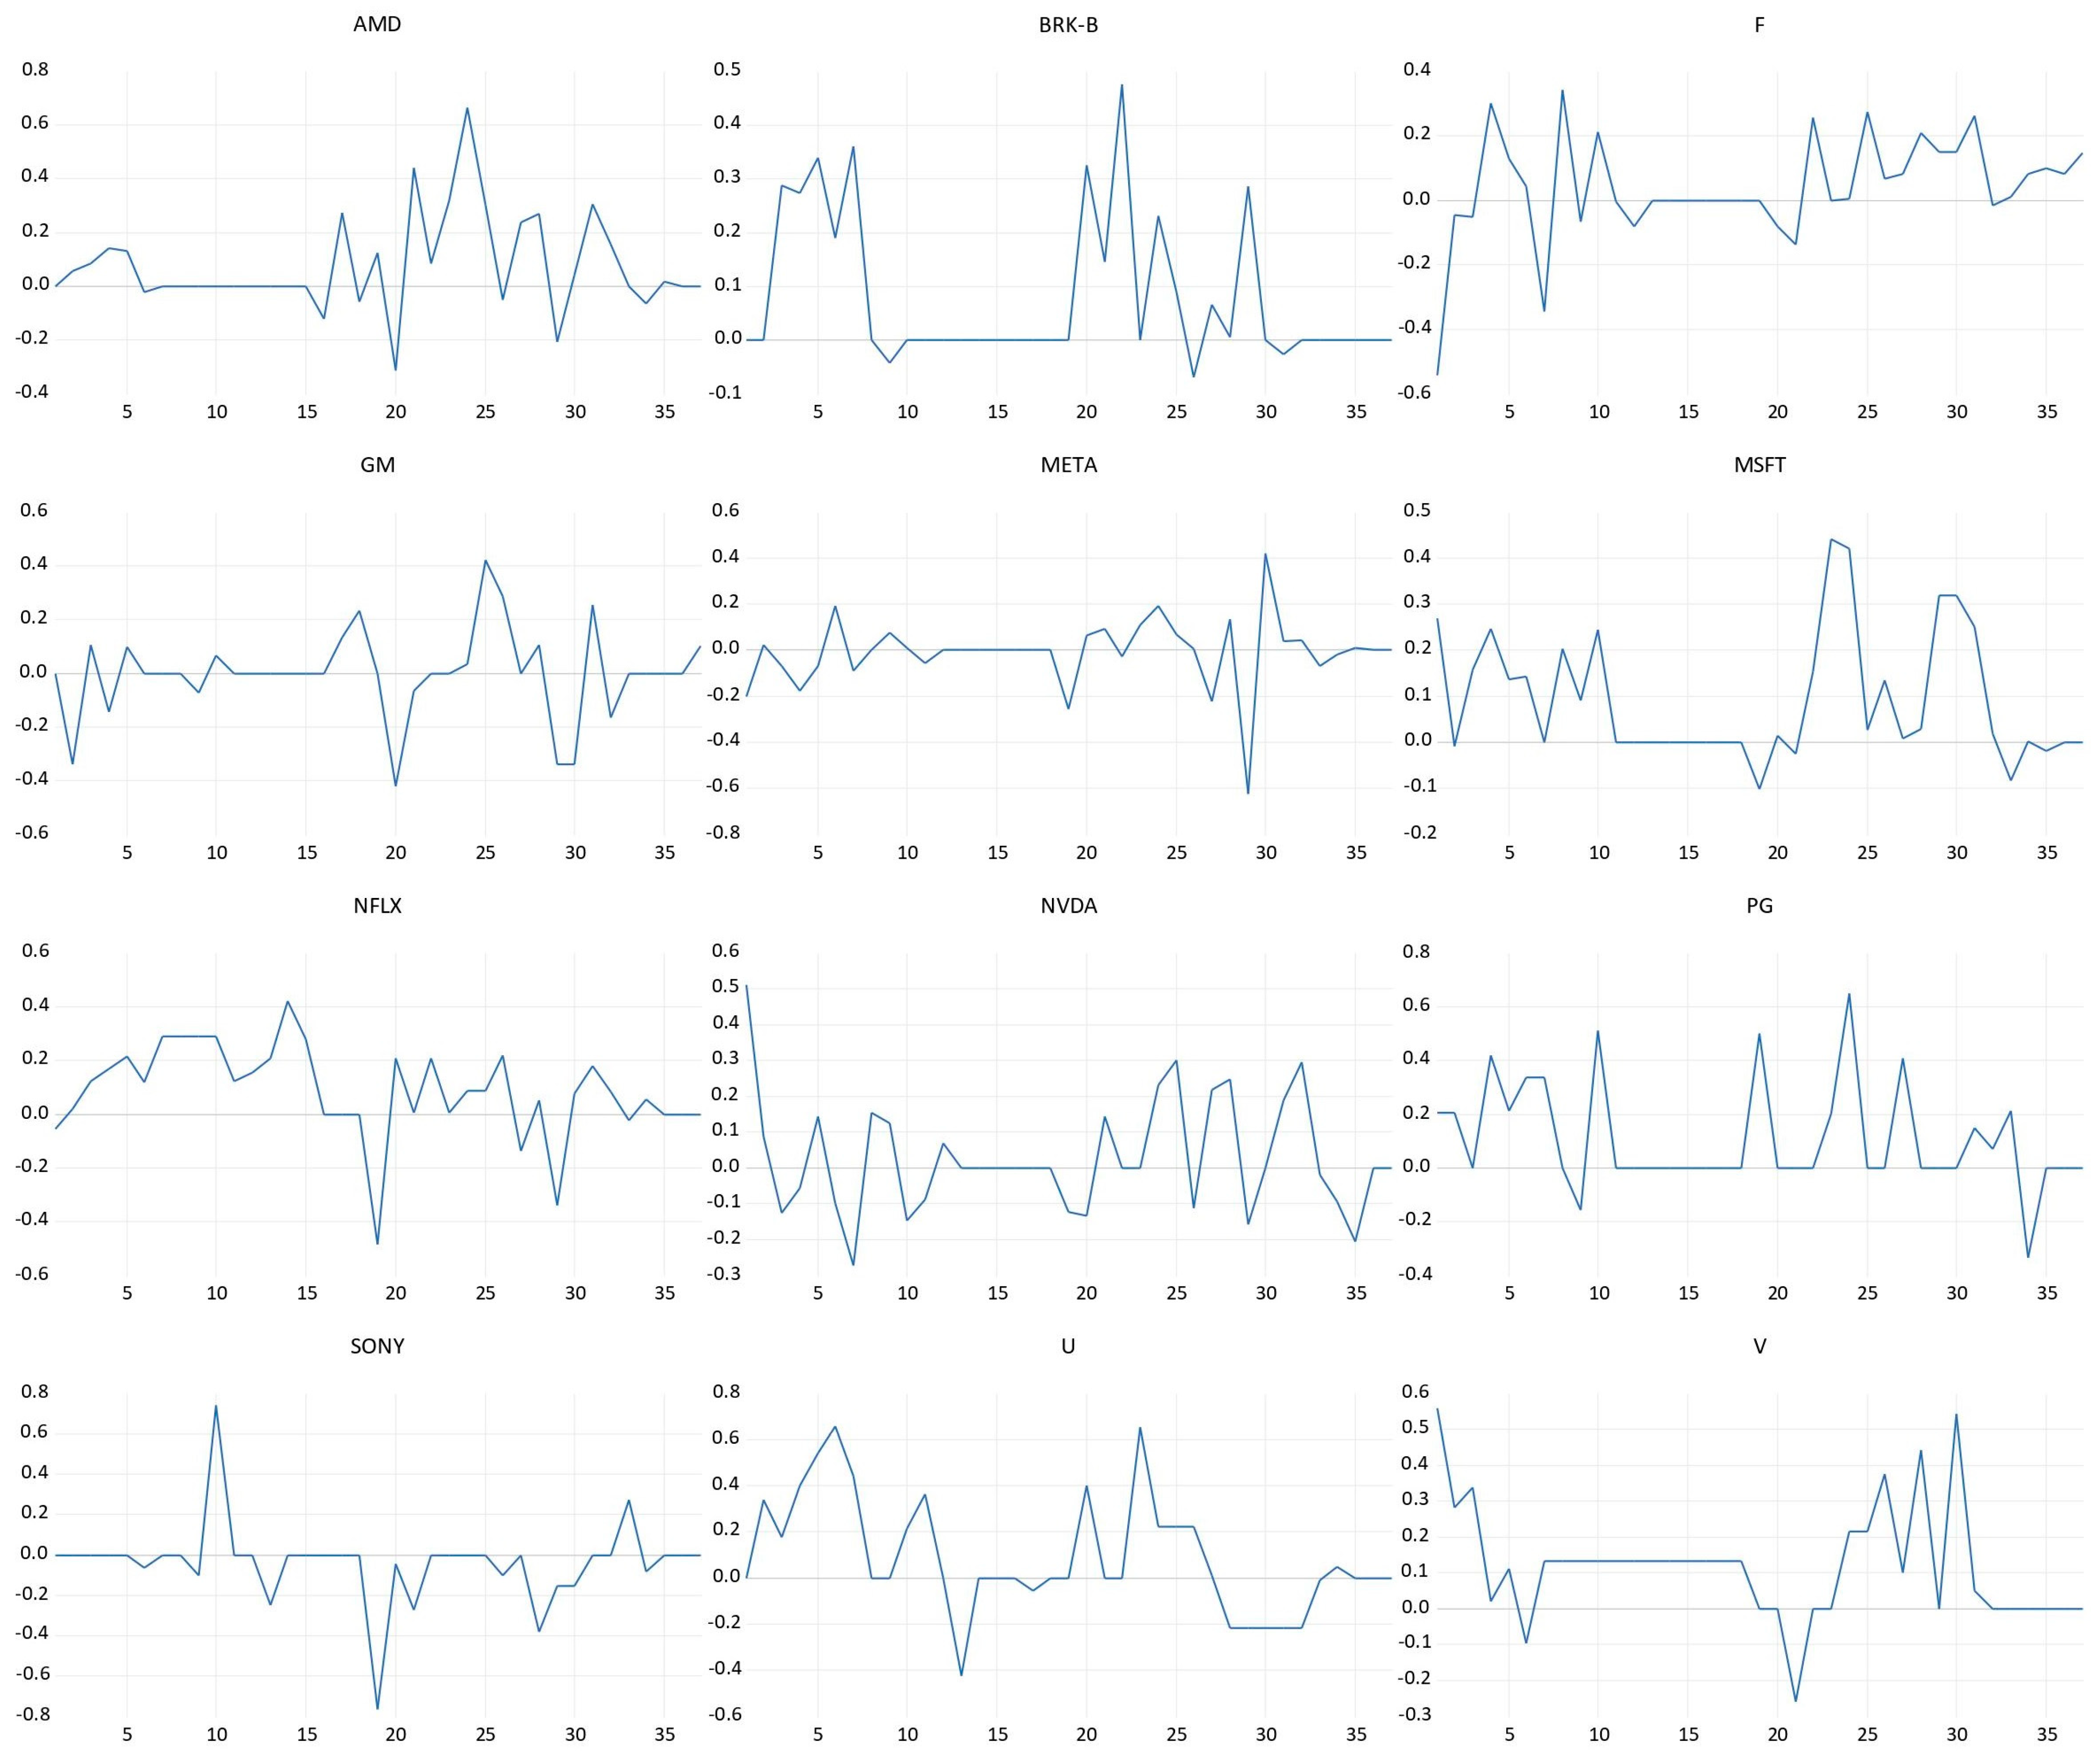
After scraping the text from FinViz for each selected company and analyzing the sentiment of the articles from August and September 2022, we calculated an average sentiment score in the news of 0.06 and an average volatility of 0.18. For each stock, the sentiment scores are presented in
Figure 3, from which we can observe the following aspects.
The average sentiment score for AMD (Advanced Micro Devices) stock was a positive one with a value of 0.08, a value above total average, and a volatility of 0.18.
On average, the sentiment score in the news related to BRK-B (Berkshire Hathaway Inc. Class B) stock was 0.11, indicating a positive sentiment in the news related to this stock. The volatility score was 0.202, a relatively high one, which was above the average volatility of 0.18. Additionally, for F (Ford Motor Company) stock, the average sentiment score was 0.04, indicating a positive sentiment in the news related to this stock, and it had a below-average volatility of 0.17. As for MSFT (Microsoft Corp.), a positive sentiment was seen in relation to stock, with an average sentiment score of 0.09 and the lowest volatility of 0.14 during the analyzed period. The average sentiment scores for GM (General Motors) and META (Meta, Inc., formerly Facebook, Inc.) stocks were −0.001 and −0.001, indicating negative sentiments in the news related to these stocks, both having a volatility of 0.17 and 0.16. Meanwhile, while for NFLX (Netflix) stock, the average sentiment score was 0.09, indicating a positive sentiment in the news related to this stock, and volatility was 0.14 during the analyzed period, below the average volatility of 0.18. Similar to MSFT, news related to PG (Procter & Gamble) had a positive sentiment score of 0.11 and a volatility score of 0.20, which was above average.
For NVDA (Nvidia), the average sentiment score was 0.03, indicating a positive sentiment in the news related to this stock, and it had a volatility of 0.16, which was relatively low. V (Visa) stock-related news had the highest positive sentiment score of 0.12 with a volatility of 0.17. Meanwhile, the average sentiment score for U (Unity Technologies) was a positive one with a value of 0.09 and it had the highest volatility, one of 0.25. The news related to SONY had the most negative sentiment score with a value of −0.04, while its volatility stood above average with a value of 0.20.
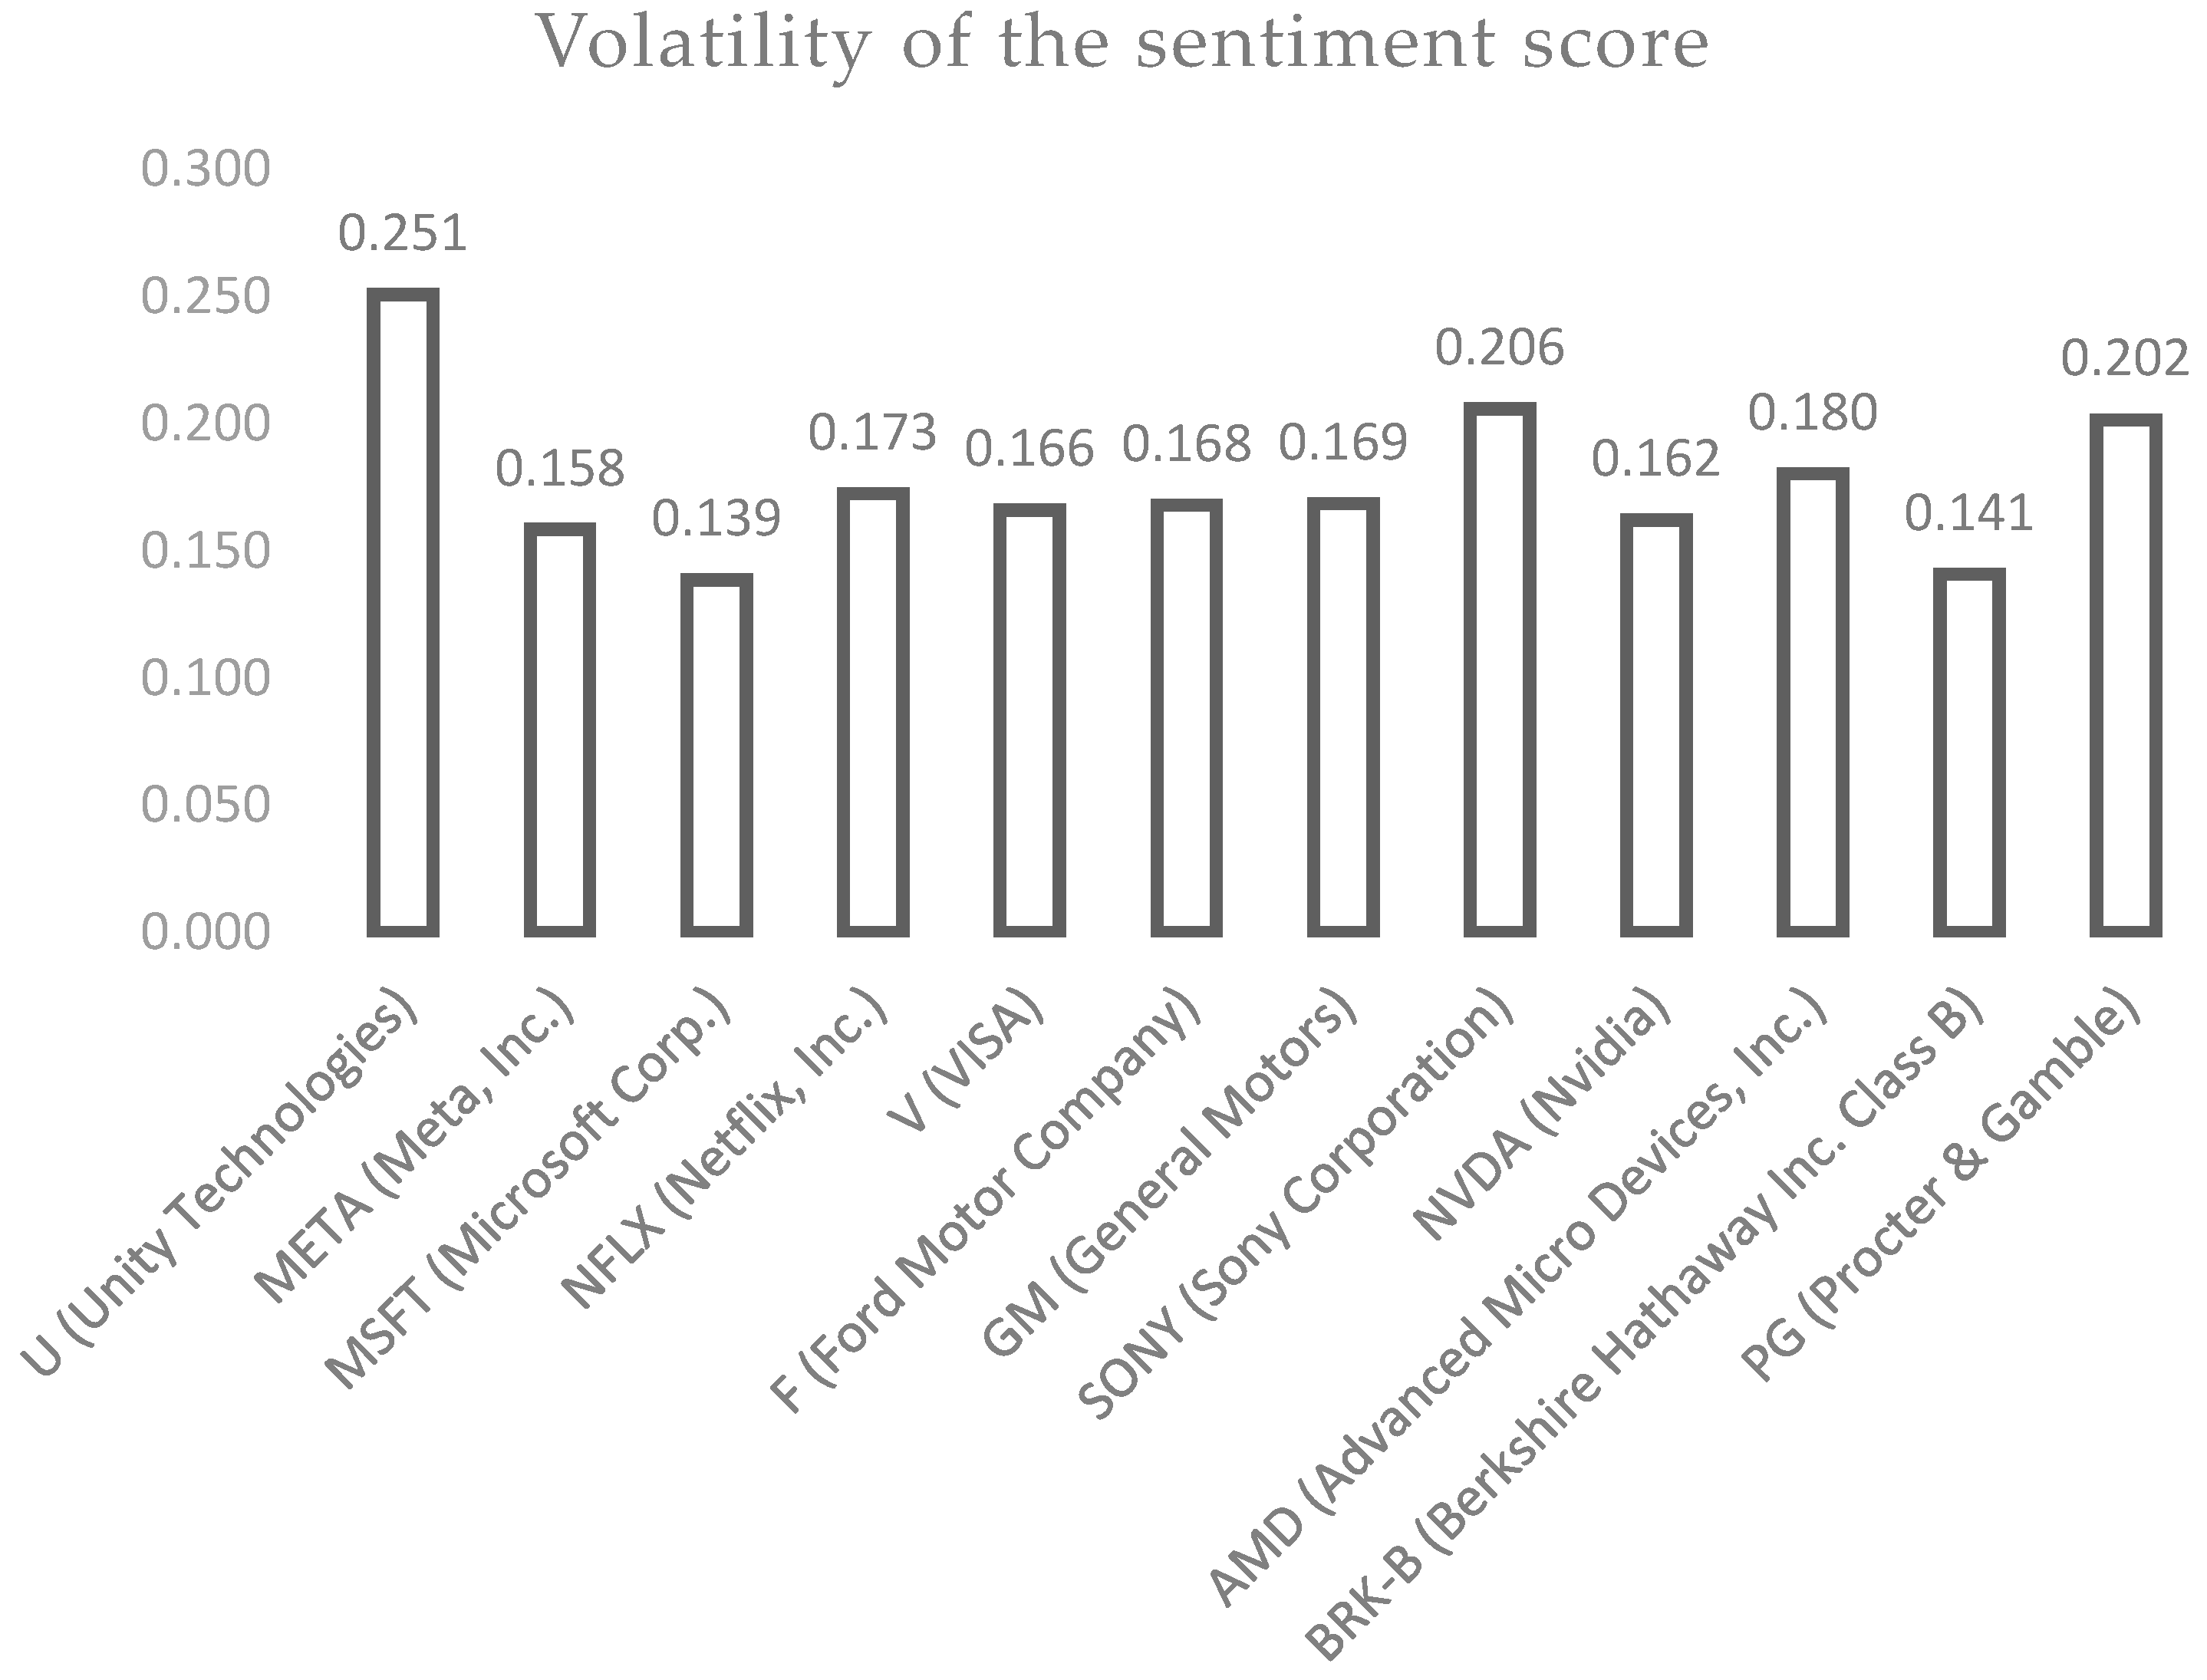
Regarding the opening price volatility,
Figure 4 presents the period volatility for each analyzed stock.
While the highest standard deviation (volatility) was 0.25 for the U (Unity) stock, the lowest volatility stood for MSFT (Microsoft Corp.) stock at 0.14. In the short term, for AMD stock, the opening price of the market increased on 19.08.2022 from that of 18.08.2022 as it presented the highest sentiment score for Advanced Micro Devices (AMD) of 0.66 on 19.08.2022 and the highest average sentiment score of 0.12 during the aforementioned period. This may suggest that the news sentiment may have affected this change.
3.2. Regression Models
In order to predict and forecast the opening price change, we proposed a linear autoregression, without and with an exogenous factor. The linear autoregression without the exogenous factor had an R of 0.189 as
Table 1 shows, while adding the sentiment score as an exogenous factor raised the R coefficient to 0.192, as
Table 2 shows.
The model of linear autoregression with an exogenous factor is presented in
Table 3. As one unit grows in opening price change, time
t−2 predicts a 0.124 change in the next day’s opening price change, while a one-unit growth in sentiment score predicts 0.063 units growth in the opening price change of the next day. From the comparison of the unstandardized coefficients, when applying the model to the testing data, we can observe that the coefficients maintained the same sign and approximatively the same value, except for the Beta coefficient for the opening price change of the previous day (change
t−1) and for the sentiment score of the previous day (sentiment
t−1).
Additionally, ANOVA analysis was applied to the two autoregressions, the results of which are shown in
Table 4. After running the ANOVA, the F test was applied to compare the goodness of fit of the two models.
The F statistic was calculated in order to analyze the goodness of fit of the two models. The F statistic computed for the models with a different number of parameters was 1.1144, while the computed p-value was estimated to be closer to 0 (0.1729); thus, the first model was more fitted than the second one, although the sum of squares is larger in the first model.
Other types of regressions among the stock opening price change and the sentiment score are presented in
Table 5.
As
Table 5 shows, the R squared value in the computed regressions, which used the opening price as the dependent variable and the sentiment score as the independent variable, shows that the polynomial regressions among the two variables were more suited than the linear one. The coefficients of the quadratic regression are presented in Equation (7) and those of the cubic regression are shown in Equation (8):
As the quadratic and cubic models were the best fitted ones, a nonlinear autoregressive model with exogenous factor is suitable for the available data, combining the two models as shown in
Table 6.
The R squared value of the model was 0.005, as shown in
Table 7.
4. Discussion
In the present paper, we used the FinViz platform to obtain financial news headlines on selected stocks from popular financial news websites, followed by the application of the VADER model in order to foster the general sentiment toward events that can occur regarding the analyzed stocks. The model involves a Python script that uses BeautifulSoup to scrape article headlines from FinViz, and Pandas to analyze and return the resultant sentiment analysis scores for the headlines of the financial articles.
Future stock trend analysis is a challenging endeavor due to the multiplicity of variables involved. We hypothesized that news items and stock prices are correlated, and that the news may correspond with the swings of stock prices.
Sentiment analysis was conducted daily for the analyzed period by collecting the headlines of the news from FinViz and applying the VADER model in Python to obtain the sentiment scores. As we can see from the results, the sentiment scores varied significantly from one day to another. The average sentiment of the market news between 06.08.2022 and 30.09.2022 was 0.06, which indicates a positive sentiment evoked by the news. The lowest sentiment score was −0.765 for Sony Corporation on 24.08.2022 and the highest sentiment score was 0.743 on 22.09.2022.
For the SONY stock, the opening price of the market decreased on 24.08.2022 from that of 23.08.2022. Additionally, for the AMD stock, the opening price of the market increased on 19.08.2022 from that of 18.08.2022. This suggest that news sentiment may have affected this change. After calculating the volatility of the sentiments for these scores, we identified U (Unity Technologies) stock as having the highest volatility in its sentiment score and MSFT (Microsoft Corp.) stock as having the lowest volatility. This can contribute to the idea that MSFT (Microsoft Corp.) stock is a less volatile investment, given that its news headlines are relatively consistent in their sentiment and the opinions of major finance publications about this company are not very divided.
The regressions that we used were cubic, quadratic and linear regressions, as the cubic regressions were found to have a higher accuracy than the linear one [
14]. Our results show that the polynomial regressions were more fitted with the model than the linear one, as the R squared value for the cubic regression was 0.005, while for the linear one, this value was 0.001. Additionally, in [
14], the polynomial regression accuracy was only surpassed by the decision tree type of regression. Furthermore, from the decision tree regressions, random forest regression had the highest accuracy [
14,
30].
Similar results, such as those presented in [
31], propose an algorithm that combines the price indices of the analyzed stock with the daily sentiment of each stock and recommends “additional signals” based on the analyzed sentiment. By using two individual “long short-term memories” that were merged through smart decision logic in [
32], a profit accuracy for the one-to-five day FOREX profit of 63.91–73.09% was found. In [
33], a polarized investor sentiment was found to be more determinant into market speculative bubbles than in the general volume of news and Google queries.
In another study, based on financial news published in China pertaining to companies listed on the Taiwan Stock Exchange, a market “Aggregate News Sentiment Index” (ANSI) was created and used to examine the correlation between the ANSI and market reactions [
34]. In [
35], a good association was found between sentiment disagreement and stock price volatility using data collected from Facebook regarding status updates to evaluate the gap between positive and negative feelings that occur daily in 20 countries. In order to assess the price and volume movement of stock on the following trading day, some studies were constructed upon four separate datasets (such as news from Google News, Wikipedia’s trade information regarding business pages, typical technical indicators and historical stock trading data) [
36]. The findings demonstrate that expanding the number of data sources can enhance forecast precision. In order to study the combined effects of many information sources on stock price movements, coupling matrices and tensor decomposition were employed in [
37]. They also exploited the commonality between stocks to predict the price movements of numerous connected stocks at once.
Future studies may focus on expanding the types of data sources in order to raise the precision of market predictions, as [
36] shows, or use combined techniques in order to reach better predictions. Additionally, nonparametric models may be used to enhance more accurate behavior of the stock market (e.g., random forest or decision tree regression) [
33].


 ,
, 


