1. Introduction
Cervical cancer is the second most prevalent cancer among women after breast cancer [
1]. One of the early diagnostic techniques for cervical cancer is Pap smear screening. For a pathologist, screening of cervical cancer means finding the potentially very few Low-grade Squamous Intraepithelial Lesion (LSIL) and High-grade Squamous Intraepithelial Lesion (HSIL) (or Squamous Cell Carcinoma abbreviated as SCC) cells among around 100,000 normal cells on a smear. By examining the morphological, textural, and color characteristics of the cervical cells, the degree of dysplasia may be determined. The Bethesda System (TBS) offers a consistent framework to classify the severity of dysplasia [
2]. Therefore, a system that automatically classifies cervical cells based on their characteristics and adheres to the TBS framework would be useful in terms of diagnostic efficacy. With this motivation in this study, a computational approach has been proposed to automate the detection of cervical dysplasia, which will assist with the diagnosis and make it more efficient.
The selection of features for dysplasia detection and classification is an important factor for consideration. Methodologies could be based on morphological features (namely changes in the area, perimeter, circularity, etc., of the object of interest) or texture (the regular repetition of an element or pattern on a surface) and color (namely energy, entropy, contrast, etc.) features [
3,
4]. Morphological features can be identified using an efficient segmentation technique. So far, no segmentation technique has been ideal (i.e., which gives 100% accuracy), and it is also database dependent. In context to the proposed study, the texture and color features are better as they are not reliant on the underlying segmentation technique. Pap smear cell images are very complex, containing different curves and contours of the objects (namely nuclei and cytoplasm). Therefore, the feature vector efficiently representing the important features of cervical cells will lead to an effective automated system design. We summarize some related work in
Table 1.
A multi-resolution transformation can effectively describe images by reducing coefficients and allowing images to be viewed in a variety of scales, orientations, and resolutions. Additionally, they are both temporal and frequency localized; therefore, no prior segmentation method is required for analysis. On the basis of its strong mathematical foundations, the multi-resolution study offers a fresh approach to image representation. In recent years, much effort has been placed in designing directional representations of images such as Ridgelet [
16], Curvelet (CVT) [
17], Contourlets (CRT) [
18], Non-subsampled Contourlet Transform (NSCT) [
19], Ripplet (RT), [
20] and Shearlet (SH) [
21] (and many more) under the concept of Multi-scale Geometric Analysis (MGA). These transforms have been applied mostly in many Content-Based Image Retrieval Systems (CBIR) [
22,
23] till now. Pros and cons of each method can be found in Ref. [
24].
The main objective of this work is to develop a comprehensive Machine Learning (ML) framework by applying multi-resolution transforms in combination with two feature representation schemes (F1: First order statistical features mean ‘’ and variance ‘’ and F2: Generalised Gaussian Distribution (GGD) features ‘’ and ‘’) followed by well-known classification techniques: Least Square Support Vector Machine (LSSVM) and Multilayer Perceptron (MLP). We build the model by training and testing to output the degree of dysplasia. Three different color models viz. YCbCr, HSV, and RGB are used to select the best color channel. We then apply three transforms: Discrete Wavelet Transform (DWT), Ripplet Transform (RT), and Non-subsampled Contourlet Transform (NSCT), each with different filters. The effectiveness of the three transforms or MGA tools are evaluated. RT and NSCT transforms are chosen as they are considered two superior transforms to study the hierarchical representation of image features, and DWT served as the basis of all comparative studies. Although these are existing transforms in literature, as per our knowledge, these transforms were not studied for Pap smear image analysis. In this paper, we identify the best combination of “transform (filter) ⇒ color model ⇒ feature representation ⇒ classifier” to build the framework. The output of this study work is compared with existing studies to check its acceptability. The novelty of this paper lies in the proposed framework, the creation of the indigenous dataset, and the results obtained during the experimentation.
The rest of the paper is organized as follows—
Section 2 explains the methodology used to carry forward the experiments,
Section 3 covers the result and discussions of the outcomes, which is followed by the Conclusion in
Section 4.
2. Materials and Methods
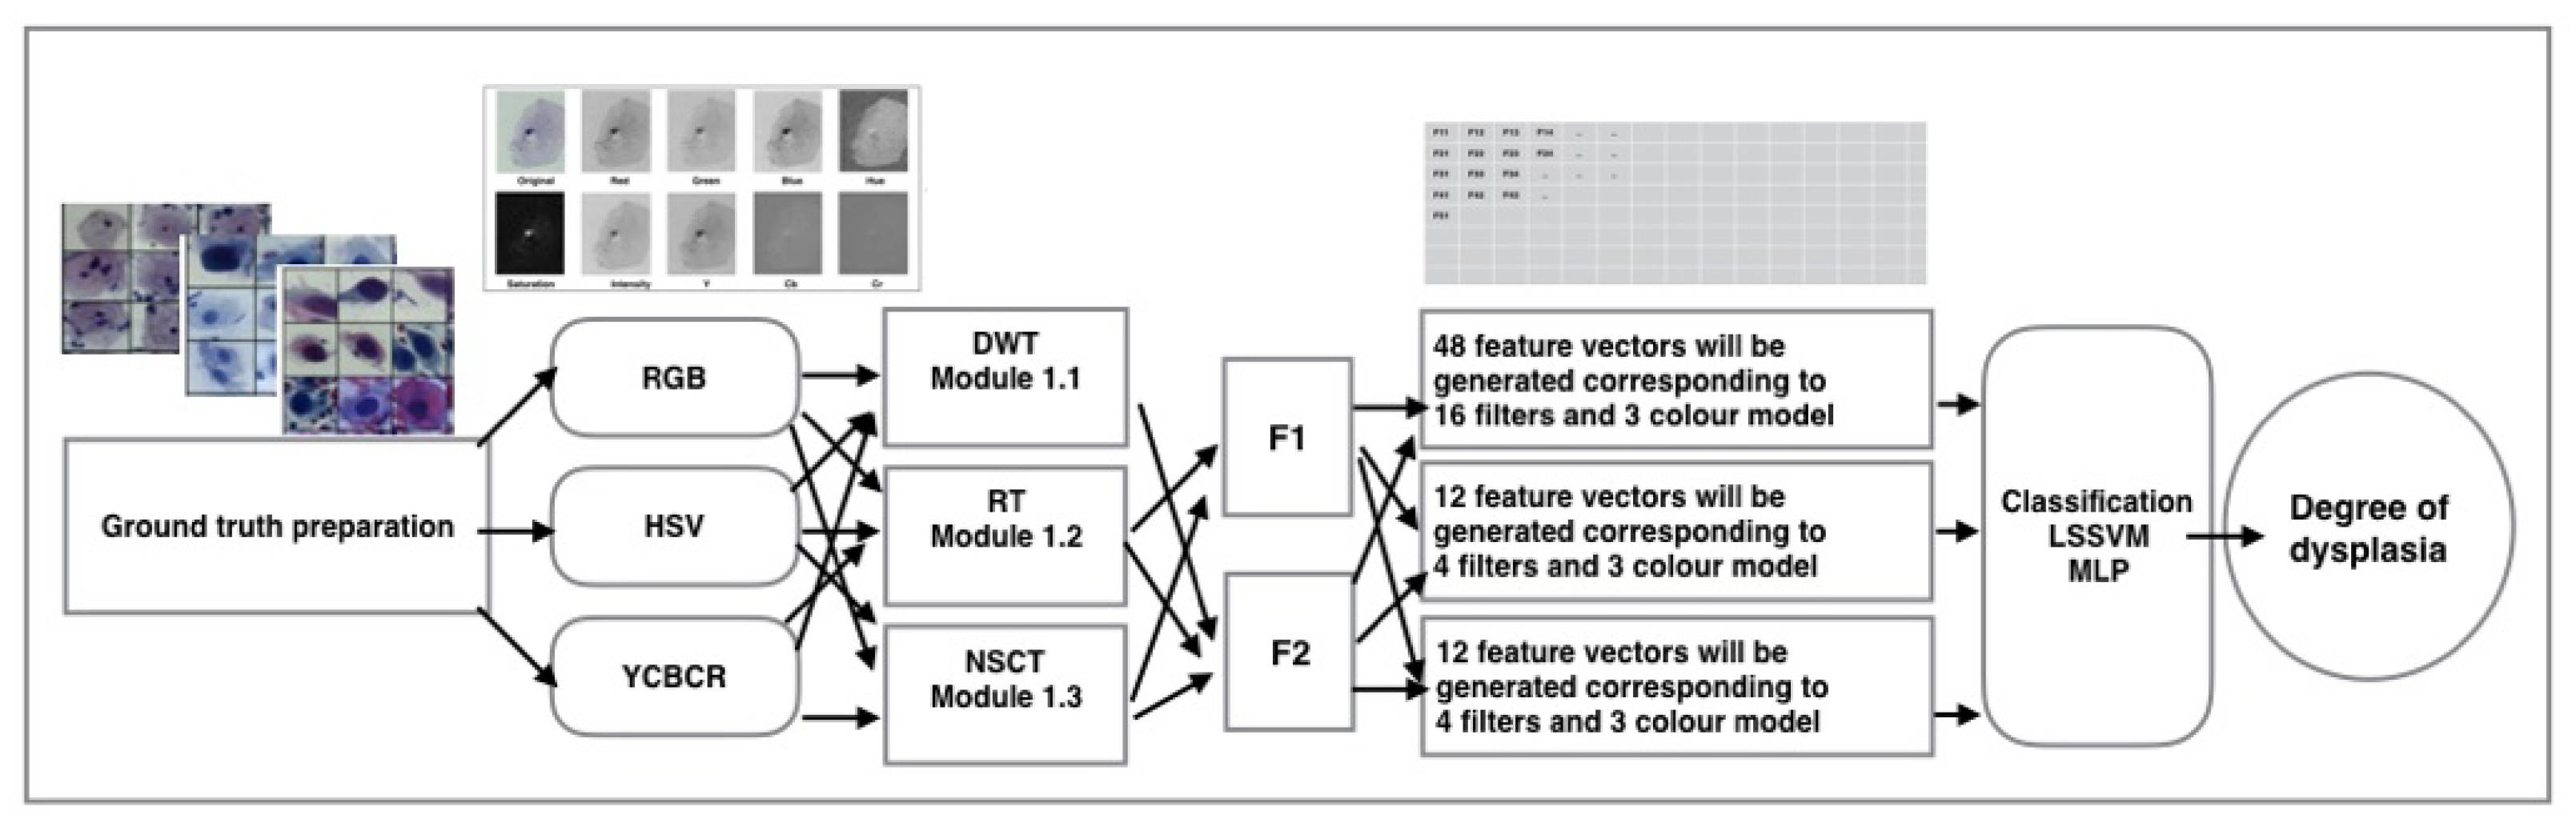
The proposed framework involves five phases—In Phase 1, the dataset is generated. Phase 2 involves the decomposition of images into different color channels, which is followed by multi-resolution transform features extraction in Phase 3 using DWT, RT, and NSCT, each with a different combination of filters. Feature representation is performed in Phase 4 and finally, classification is performed in Phase 5.
Figure 1 illustrates the block diagram of the proposed computational approach.
2.1. Dataset Generation and Ground Truth Preparation
Two datasets are used for all the experiments.
Generated dataset: The dataset was generated from smears collected from two pathological centers of this region: Ayursundra Healthcare Pvt. Ltd. and Arya Wellness Center, Guwahati, Assam, India. This study was approved by Ethical Committee for Human Studies of IASST with registration number ECR/248/Indt/AS/2015 of Rule 122D, Drugs and Cosmetic Rule, 1945. Staining and preparation of slides were performed at the respective laboratories where data were collected, under the supervision of certified pathologists engaged in these institutions, images were captured using Leica ICC50 HD Microscope using 400× resolution with 24-bit color depth. The multi-source cell images used for model training have the same coloring criteria. We have used only those cell images stained with the Papanicolaou stain.
Samples of 98 and 34 smears were collected from the centers, respectively. Images captured by us were monitored, validated, and finally, ground truth marked by the pathologists of each center. To design the cell level dataset, the cervical cells were manually marked by the pathologist, autocropping of the marked images (to convert from smear level to cell level) for ground truth generation has been done using the algorithm proposed in [
1] for 132 slide images. Finally, the dataset contained 1611 single cervical cells. This was followed by the categorization of these cell images following the TBS framework of classification, i.e., NILM, LSIL, and HSIL (including SCC), with the help of the pathologists. Following this classification, the dataset contained 1001 NILM, 400 LSIL, and 210 HSIL (including SCC) images.
Herlev Database: The proposed System is also trained and tested on the benchmark Herlev University database to check its consistency (Herlev database is available on
http://mde-lab.aegean.gr/index.php/downloads (last accessed on 27 June 2020)). This database contained 242 NILM, 182 LSIL, and 489 HSIL (including SCC) cases.
2.2. Color Channel Study
Color channel study is very important in dealing with images taken under uneven illumination. RGB color model can only define the uniform characteristics of color and fail when the variation of chromaticity information is present under uneven illumination. Luminance and Hue-based models like YCbCr and HSV perform better as compared to RGB as they are capable of defining an uneven non-uniform characteristic of color through color and texture information. In YCbCr color space, the intensity plane (Y) characterizes the texture information, while the decomposition over chromaticity planes (Cb and Cr) reflects color information. Again in HSV, Hue (H) and Saturation (S) represent color information and Value (V) represents intensity-based texture information. Both YCbCr and HSV can reflect the uneven illuminations but in YCbCr, the “Cb” and “Cr” component is uncorrelated, making it more favorable than HSV where the components ‘S’ and ‘V’ are highly correlated. For this study, color spaces YCbCr, HSV, and RGB are explored individually to study all three feature vectors.
2.3. Feature Extraction
The following sub-sections give a brief discussion of the methodologies of each transform used for feature extraction.
2.3.1. DWT
It is localized in both the time and frequency domains. Wavelets are the tensor products of 1D wavelet, thus having only three directions, namely horizontal, vertical and diagonal [
25]. Application of DWT results in the generation of four sub-bands with the following information: (a) Low-Low (LL) sub-band: average information of the image, (b) Low-High (LH): information on horizontal components, (c) High-Low(HL): information on vertical components and (d) High-High (HH): information on diagonal components. Further decomposition on the LL sub-band can be performed iteratively to obtain image components at different resolutions. Wavelet is considered the basis of all MGA tools. That is why any comparison-based study without DWT is considered an incomplete study. However, it is unable to describe image features on edges. For DWT-based classification Haar (db1), Daubechies (dbN, N = 2, 4, 6, 8, 10), Coiflet (coifN, N = 1, 2, 3, 4, 5), and Bi-orthogonal (biorN.N, N.N = 1.3, 2.2, 3.5, 4.4, 6.8) filters were used.
2.3.2. RT Type-I
RT was proposed by Jun Xu et al. [
20] to overcome the drawbacks of CVT. It has the capability of localizing a signal in both spatial and frequency domains and can capture 2D singularities along different types of curves by providing a flexible degree and support parameters. It generalized the parabolic scaling law by introducing two new parameters i.e., support and degree. For digital image-based applications, RT needs to be in discrete form and this can be achieved by discretizing the parameters involved in the calculation. Different pyramidal (
) and directional filter (
) combinations used in the study are
2.3.3. NSCT
NSCT has some unique characteristics, including flexible multi-scale anisotropy, multidimensional expandability, full shift invariance, and rapid implementation ability [
26,
27]. NSCT is a better version of contourlet, in which a shift-invariance feature has been introduced. To decompose the frequency plane into sub-bands, the proposed work has used the algorithm devised by Cunha et al. [
27]. To extract the NSCT features in this work, a Non-Subsampled Pyramidal Filter (NSPF) and Non-Subsampled Directional Filter Bank (NSDFB) have been used. This will give the advantages of multi-scale anisotropy and multi-directional expandability. To initiate NSCT, an NSP split is used to decompose the input into a lowpass and a highpass sub-band. The high-pass sub-band is then decomposed into several directional sub-bands by an NSDFB. On the lowpass sub-band, the scheme is iterated repeatedly. The resulting frequency division, where the number of directions is increased with frequency. For NSCT decomposition, the following combinations of pyramidal (
pyr) and directional (
dir) filters are employed in this study, such as—
2.4. Feature Representation
Two feature representation schemes are used in this work to represent the coefficients. Using F1, two statistical features and are extracted from sub-band coefficients resulting in a feature vector of dimension for each color-model. Using F2, two GGD parameters and using maximum likelihood estimation are extracted which compose the feature vector of dimension . Different pyramidal () and directional filter () combinations are used in the study for RT and NSCT.
2.5. Classification
Two well-known classifiers, LSSVM [
26,
28,
29] and MLP [
30] are used for this study. All the classifiers were trained and tested individually for the two databases. Finally, the best experimental results were reported, which is a combination of best transform (filters), color space, feature representation, and classifier. Assessments were performed based on five-fold cross-validation. Finally, conclusions are drawn based on five performance measures: Accuracy, Precision, Recall, Specificity, and F-score [
1]. Different parameters used for MLP is as follows—Learning rate = 0.7, Ratio to increase learning rate = 1.05, Maximum validation failures = 15, Factor to use for memory/speed tradeoff = 1, Minimum performance gradient = 1e-10, Initial Momentum = 0.95, Iterations = 4000, Performance goal = 0.001. For LSSVM, kernel used = RBF-kernel, Cross-validation = 5.
3. Results and Discussion
In this section, we describe the detailed experimental results and discussions of the three multi-resolution transforms explained above.
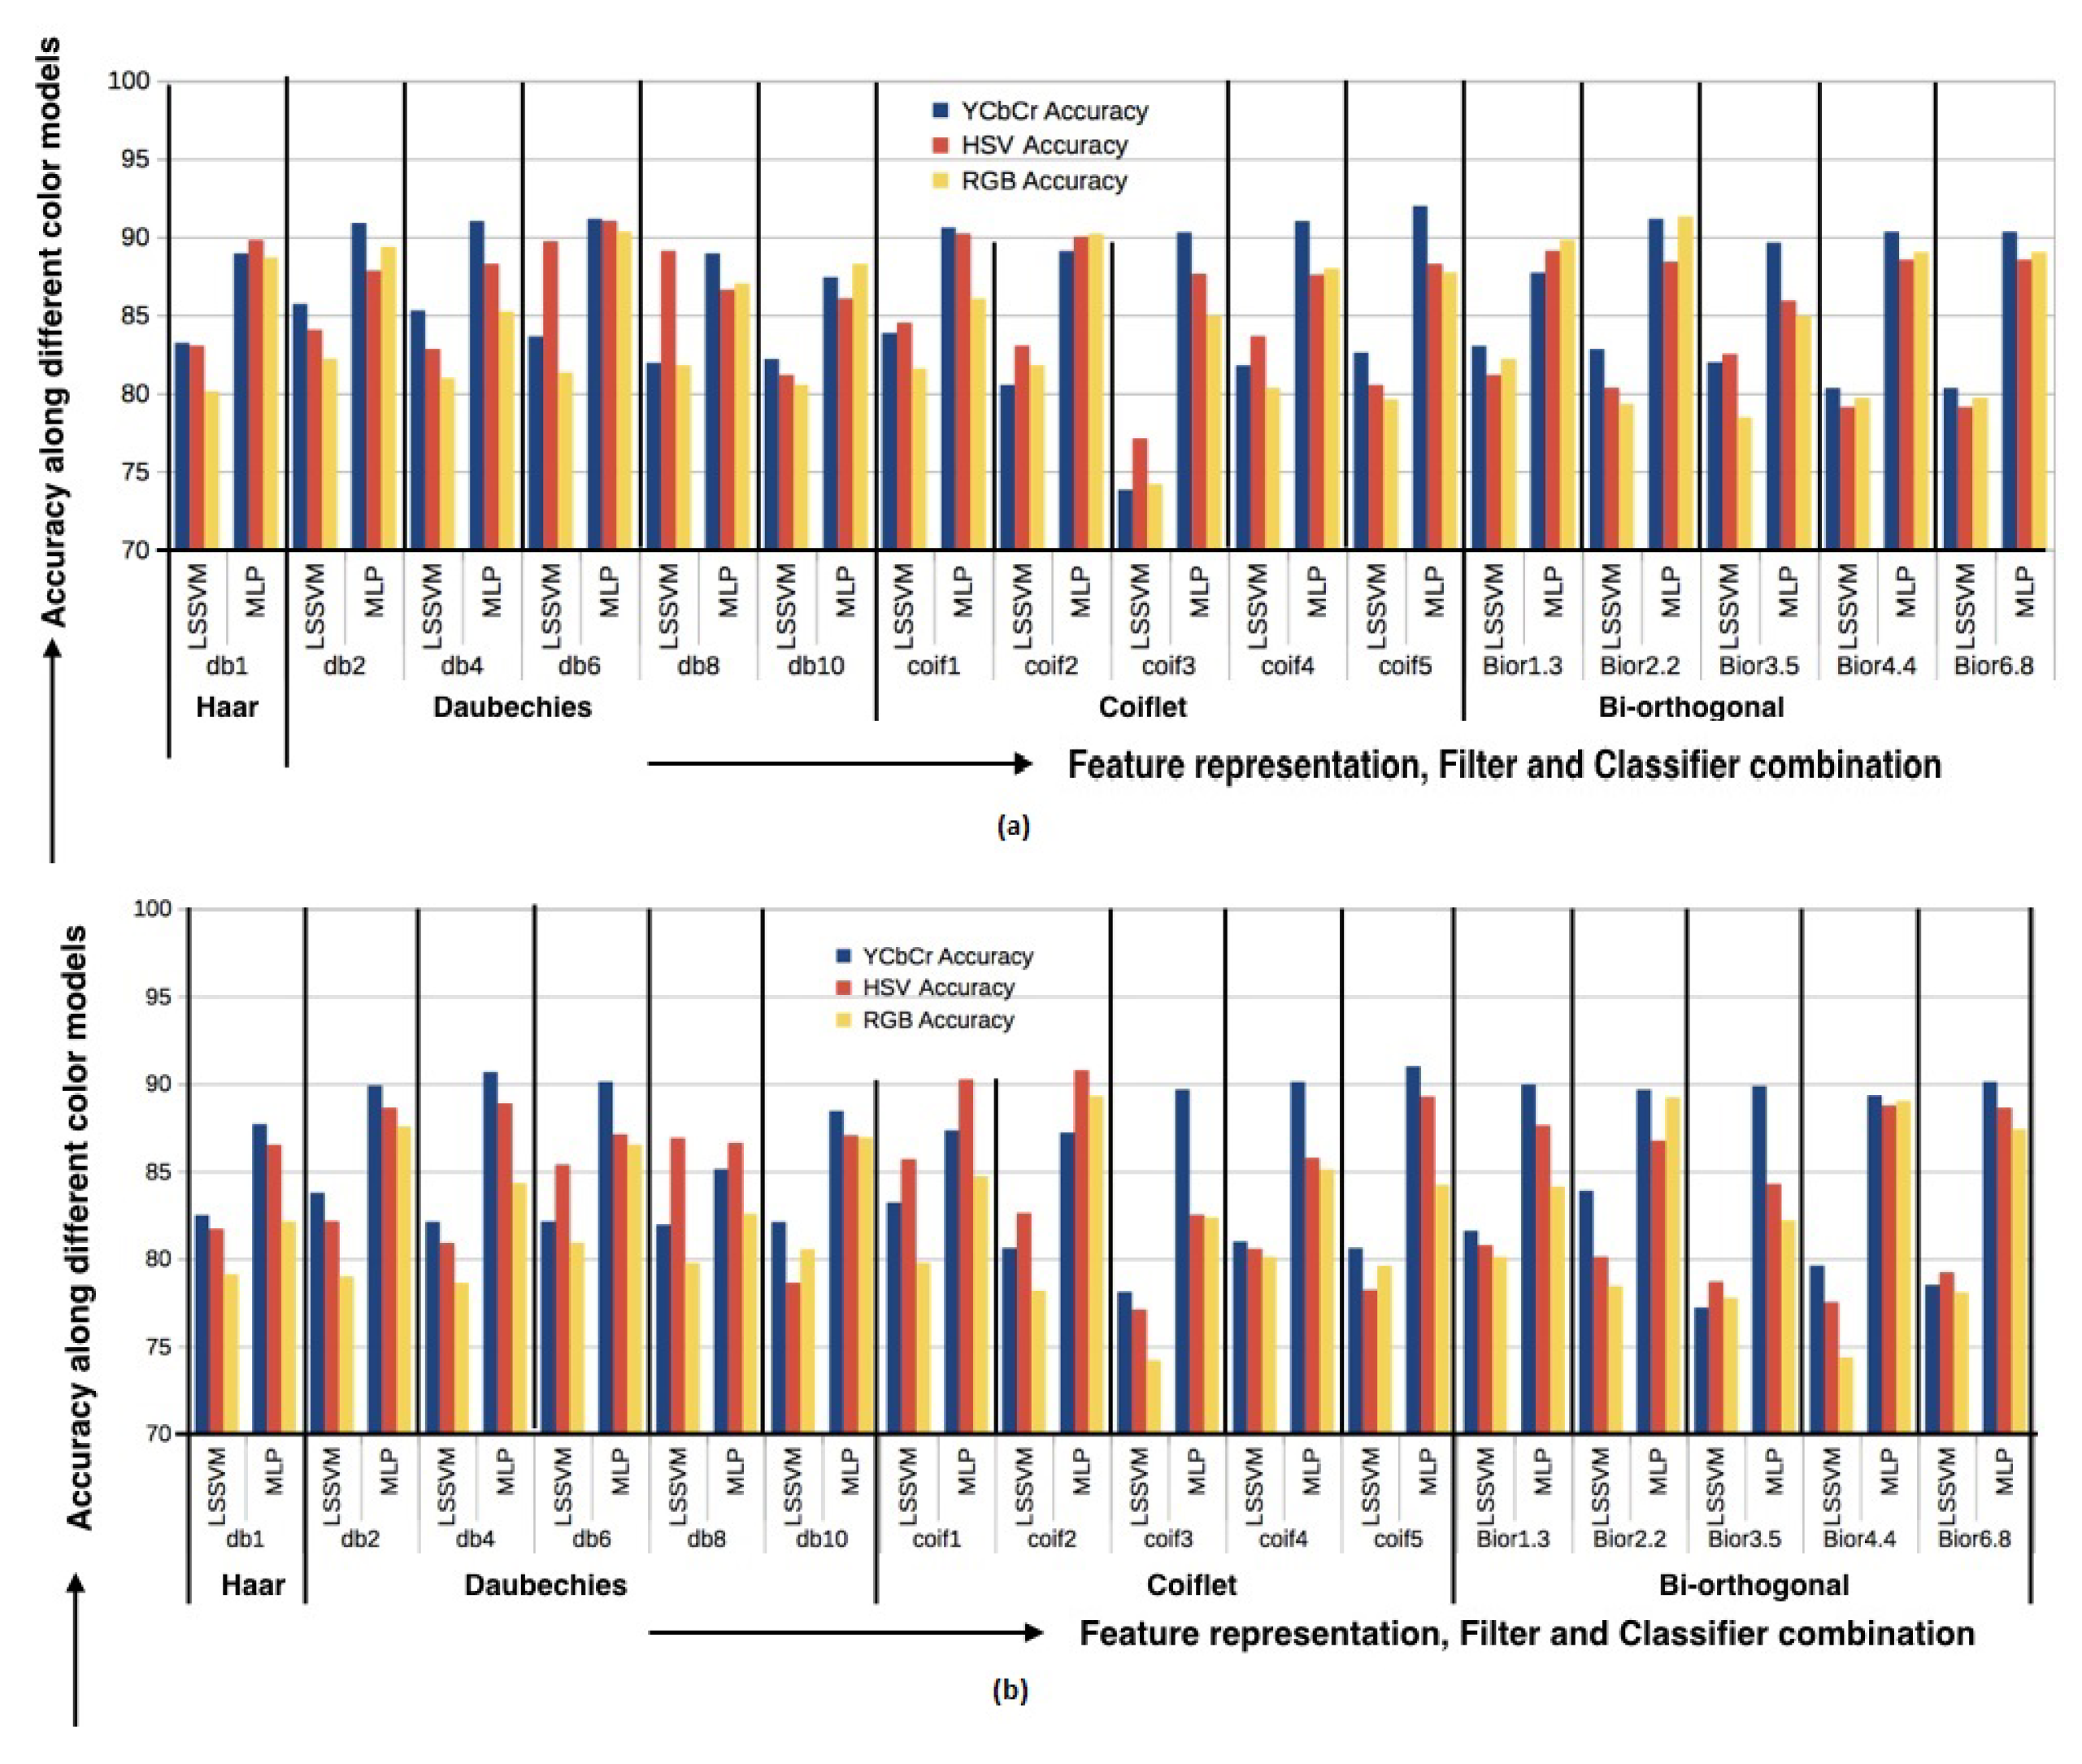
3.1. Results and Discussion Using DWT
Figure 2 display the experimental results of applying DWT transform in Pap smear classification using feature representation scheme F1 and F2, respectively. In the figure, X-axis represents different filters and classifiers combinations, and Y-axis represents the accuracy in different color models. The graph
Figure 2a shows that the combination “DWT (coif5) ⇒ YCbCr ⇒ MLP” results in the most satisfactory performance on generated database with a classification accuracy of 91.99% using feature representation scheme F1. Same combination “DWT (coif5) ⇒ YCbCr ⇒ MLP” also has the best performance using F2 (
Figure 2b). Coiflets were originally derived from the Daubechies wavelet. Its use of windows that overlap more, applying six scaling and wavelet functions, results in an increase in pixel averaging and differencing that leads to a smoother wavelet and increased capabilities in several image-processing techniques. Due to this property, it can represent smooth changing patterns of an image. As no sharp boundaries are found in Pap images, coif5 can easily capture those smooth changing patterns and represent them with a lower number of coefficients.
Regarding the Herlev database, the best combination obtained is “DWT (bior2.2) ⇒ YCbCr ⇒ F1 ⇒ MLP”. ‘bior2.2’ have the ability to avoid boundary artifacts and also can represent smooth changes through optimum time-frequency localization. Bi-orthogonal filters are more symmetric than coiflet filters and can represent more details of an image. Since Herlev database image quality is poor, therefore, strong filters are needed for its representation. As a result, ‘bior2.2’ works better than ‘coif5’.
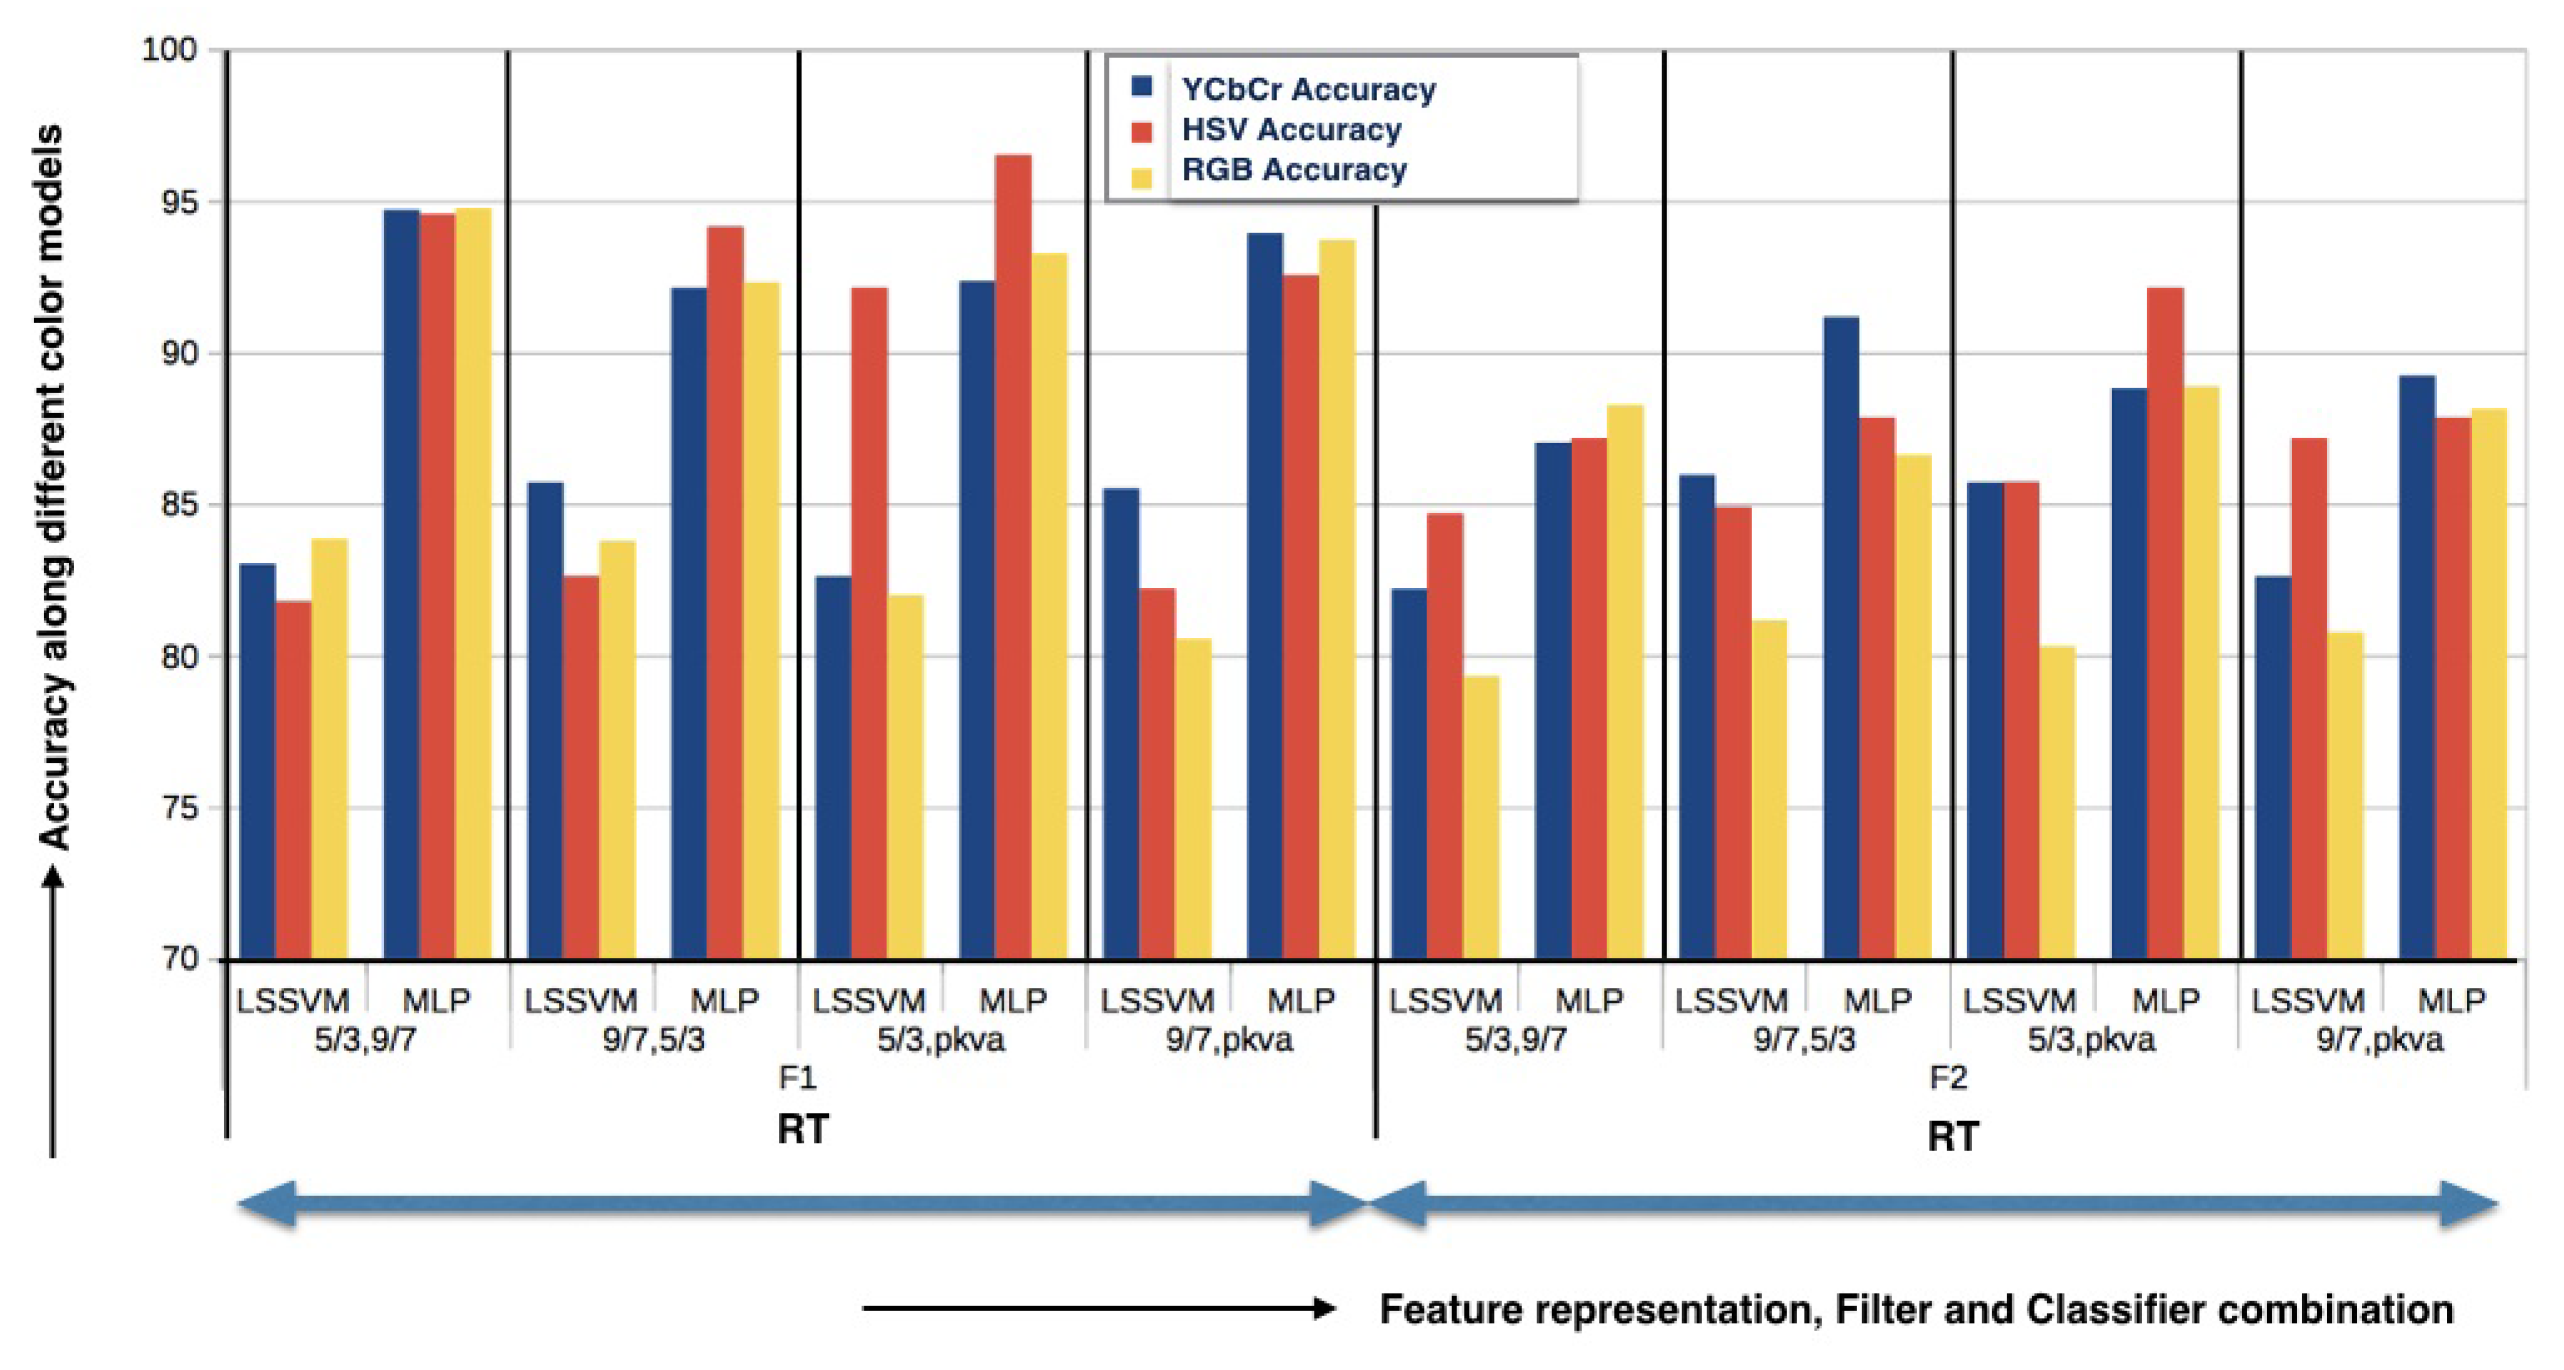
3.2. Results and Discussion Using RT
Experimental results using RT on the generated database are depicted in
Figure 3. It shows different combinations of filters, classifiers, and color models along two different feature representations. It can be observed that the combination “RT (5/3, pkva) ⇒ MLP ⇒ HSV” gives the most satisfactory results (Accuracy = 96.51%) applying feature representation scheme F1 and the same combination “RT (5/3, pkva) ⇒ MLP ⇒ HSV” is also given the best result applying scheme F2 with an accuracy of 92.13%. ‘pkva’ directional filter performs better as it captures the high-frequency content of the images like smooth contours and directional edges, which play a significant role in describing Pap images. On the other hand, in a pyramidal filter, ‘5/3’ performs best, where 5 represents the size of the lowpass filters and 3 represents the size of the highpass filters. The performance of the HSV color model is better for RT-based classification, showing the dominance of intensity-based texture features.
Using the Herlev database, the combination “RT (9/7, pkva) ⇒ MLP ⇒ YCbCr ⇒ F1” results in good classification result with accuracy 93.45%. Other measures used in the comparison are displayed in
Table 2. In the case of the Herlev database, the ‘9/7’ pyramidal filter is working better than the ‘5/3’ filter as in a generated database. ‘9/7’ represents the length of the dual scaling filter with four vanishing moments, a low pass filter with size 9, and with highpass filter having size 7. The filter with fewer vanishing moments gives less smoothing and removes fewer details. The Herlev database image quality is poor compared to generated database image. Further, in the Herlev database, images have been cropped such that images of malignant cells look generally smaller than normal ones. That is why high-sized filters are required to extract salient information from the images.
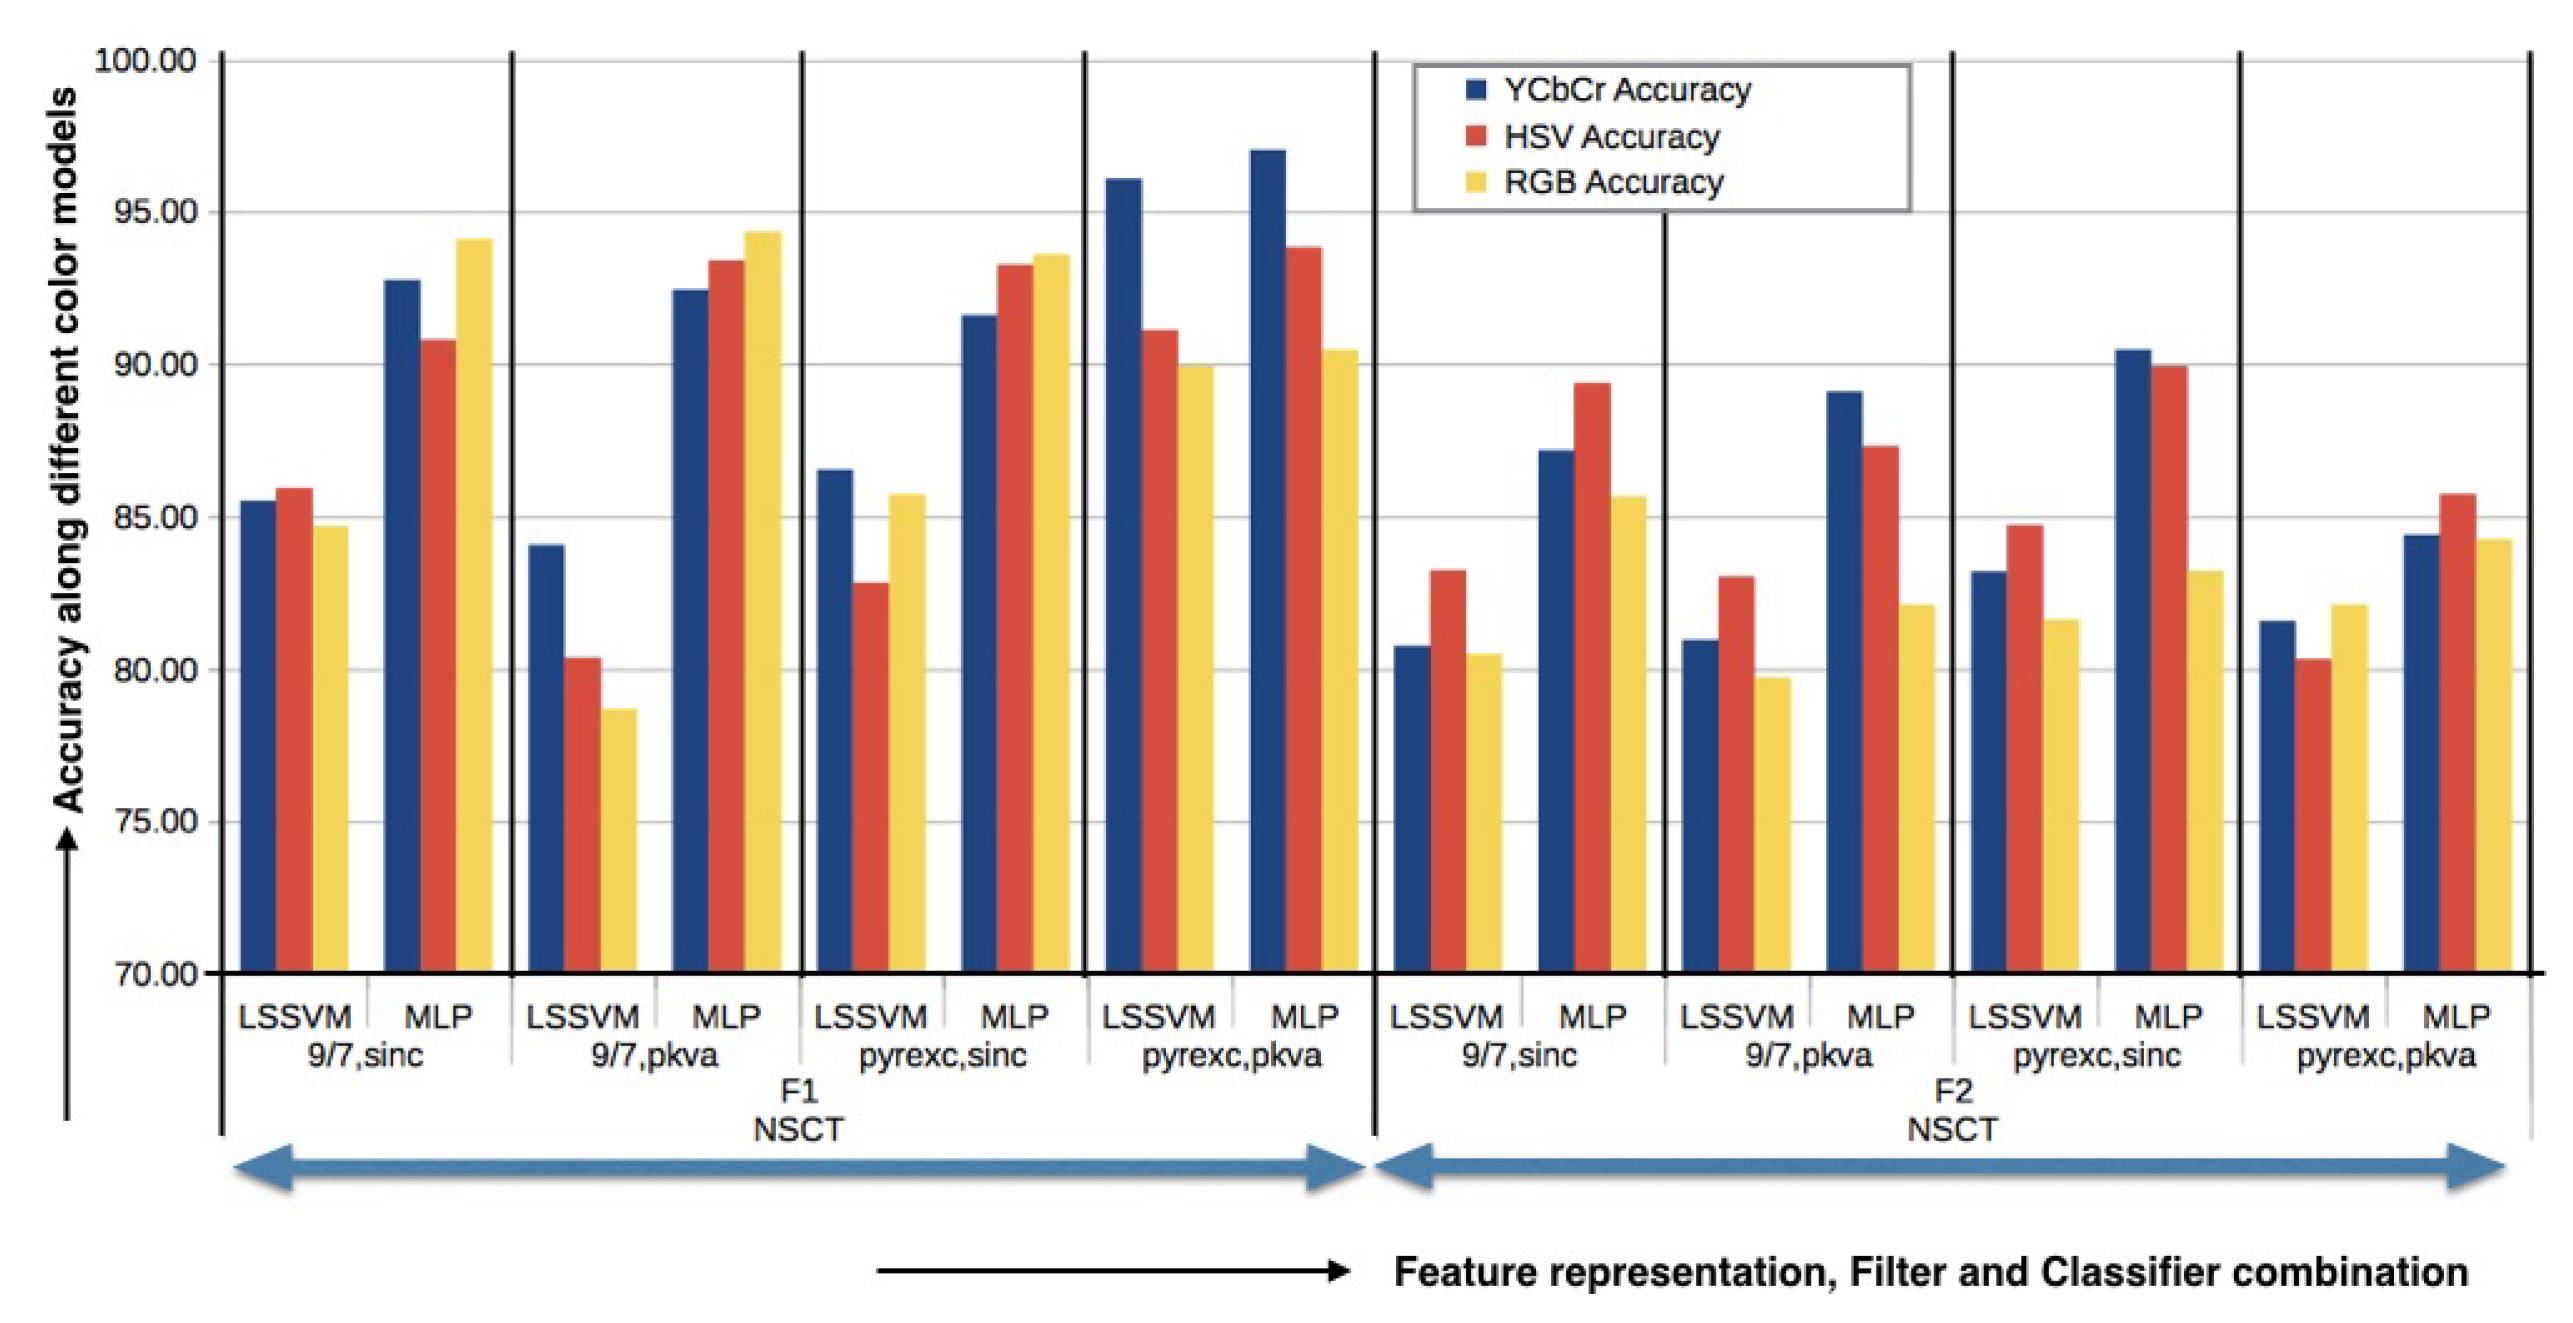
3.3. Results and Discussion Using NSCT
Figure 4 displays the graphical result of NSCT-based classification. Applied to the generated database, it reveals that the combination “NSCT (pyrexc,pkva) ⇒ YCbCr ⇒ MLP” gives the most satisfactory classification result (98.02% accuracy) using F1, using F2 the best results (90.47% accuracy) are obtained using the combination “NSCT (pyrexc,sinc) ⇒ YCbCr ⇒ MLP”. These results were obtained from the generated database. Other measures are listed in
Table 2. All of the aforementioned situations show that ‘pyrexc’ NSPF performs best. This filter is created by swapping the two high-pass filters in the maximal mapping function with two vanishing moments in 1D. It is effective at representing straight edges. Furthermore, “pkva” NSDFB performs better than “sinc” because it can capture high-frequency information in images, such as directional edges and smooth contours. It performs best in terms of PSNR. This characteristic makes “pkva” perform at its best on true Pap images, which have difficult-to-interpret features.
On the Herlev database best classification result is obtained with the combination “NSCT (pyrexc,sinc) ⇒ HSV ⇒ MLP ⇒ F1” which gives an accuracy of 93.06%. ‘sinc’ filter performs better in the Herlev database as it eliminates all frequency components above a certain cutoff frequency without impacting lower frequencies. As a result, the smooth region is effectively represented by the small size low-pass filter utilizing the “sinc” filter. Other performance measures used in comparison for all the above-mentioned combinations are displayed in
Table 2.
For both the datasets, as shown in
Table 2, NSCT feature-based classification is giving good results compared to DWT and RT.
3.4. Final Observations
Final observations from the study are as follows:
It is observed that NSCT based classification showed satisfactory results on both the databases. NSCT is fully shift-invariant and has the advantage of robust directional frequency localisation. So it can be concluded that the performance of classification is highly affected by shift-variance resulting from the sub-sampling operators. It is also seen that multi-directional information contributes to the final results, justifying why DWT features showing lower statistical significance than NSCT due to its lack of multi-directional property.
In all results, MLP classifier performs best and F1 feature representation scheme outperforms F2. GGD has been used in modeling when the behaviour of the concentration of values around the mean and the tail are of particular interest. But from the results, it shows insignificant impact as compared to the first order statistics. It can be concluded that mean and variance is sufficient to represent the transform coefficients. It is worth mentioning that F1 has the added advantage of low computational cost to the approach.
As far as color channels are concerned, YCbCr model outperforms HSV and RGB model in most cases. YCbCr works better than HSV as the two components ‘Cb’ and ‘Cr’ are not correlated unlike ‘S’ and ‘V’ components of HSV. RGB color model is not suitable in practical application because of its uniform characteristics which fail in the presence of highly varying color (chrominance) and intensity (luminance) information.But luminance and hue based models like YCbCr always work better than RGB as they can describe color and texture information under uneven illumination. Image acquisition normally performs under different light conditions of the microscope that is why uneven illumination is of major concern.
The best combination for the generated database to build the model is “NSCT (pyrexc,pkva) ⇒ YCbCr ⇒ F1 ⇒ MLP”.
3.5. Comparison with Existing Works
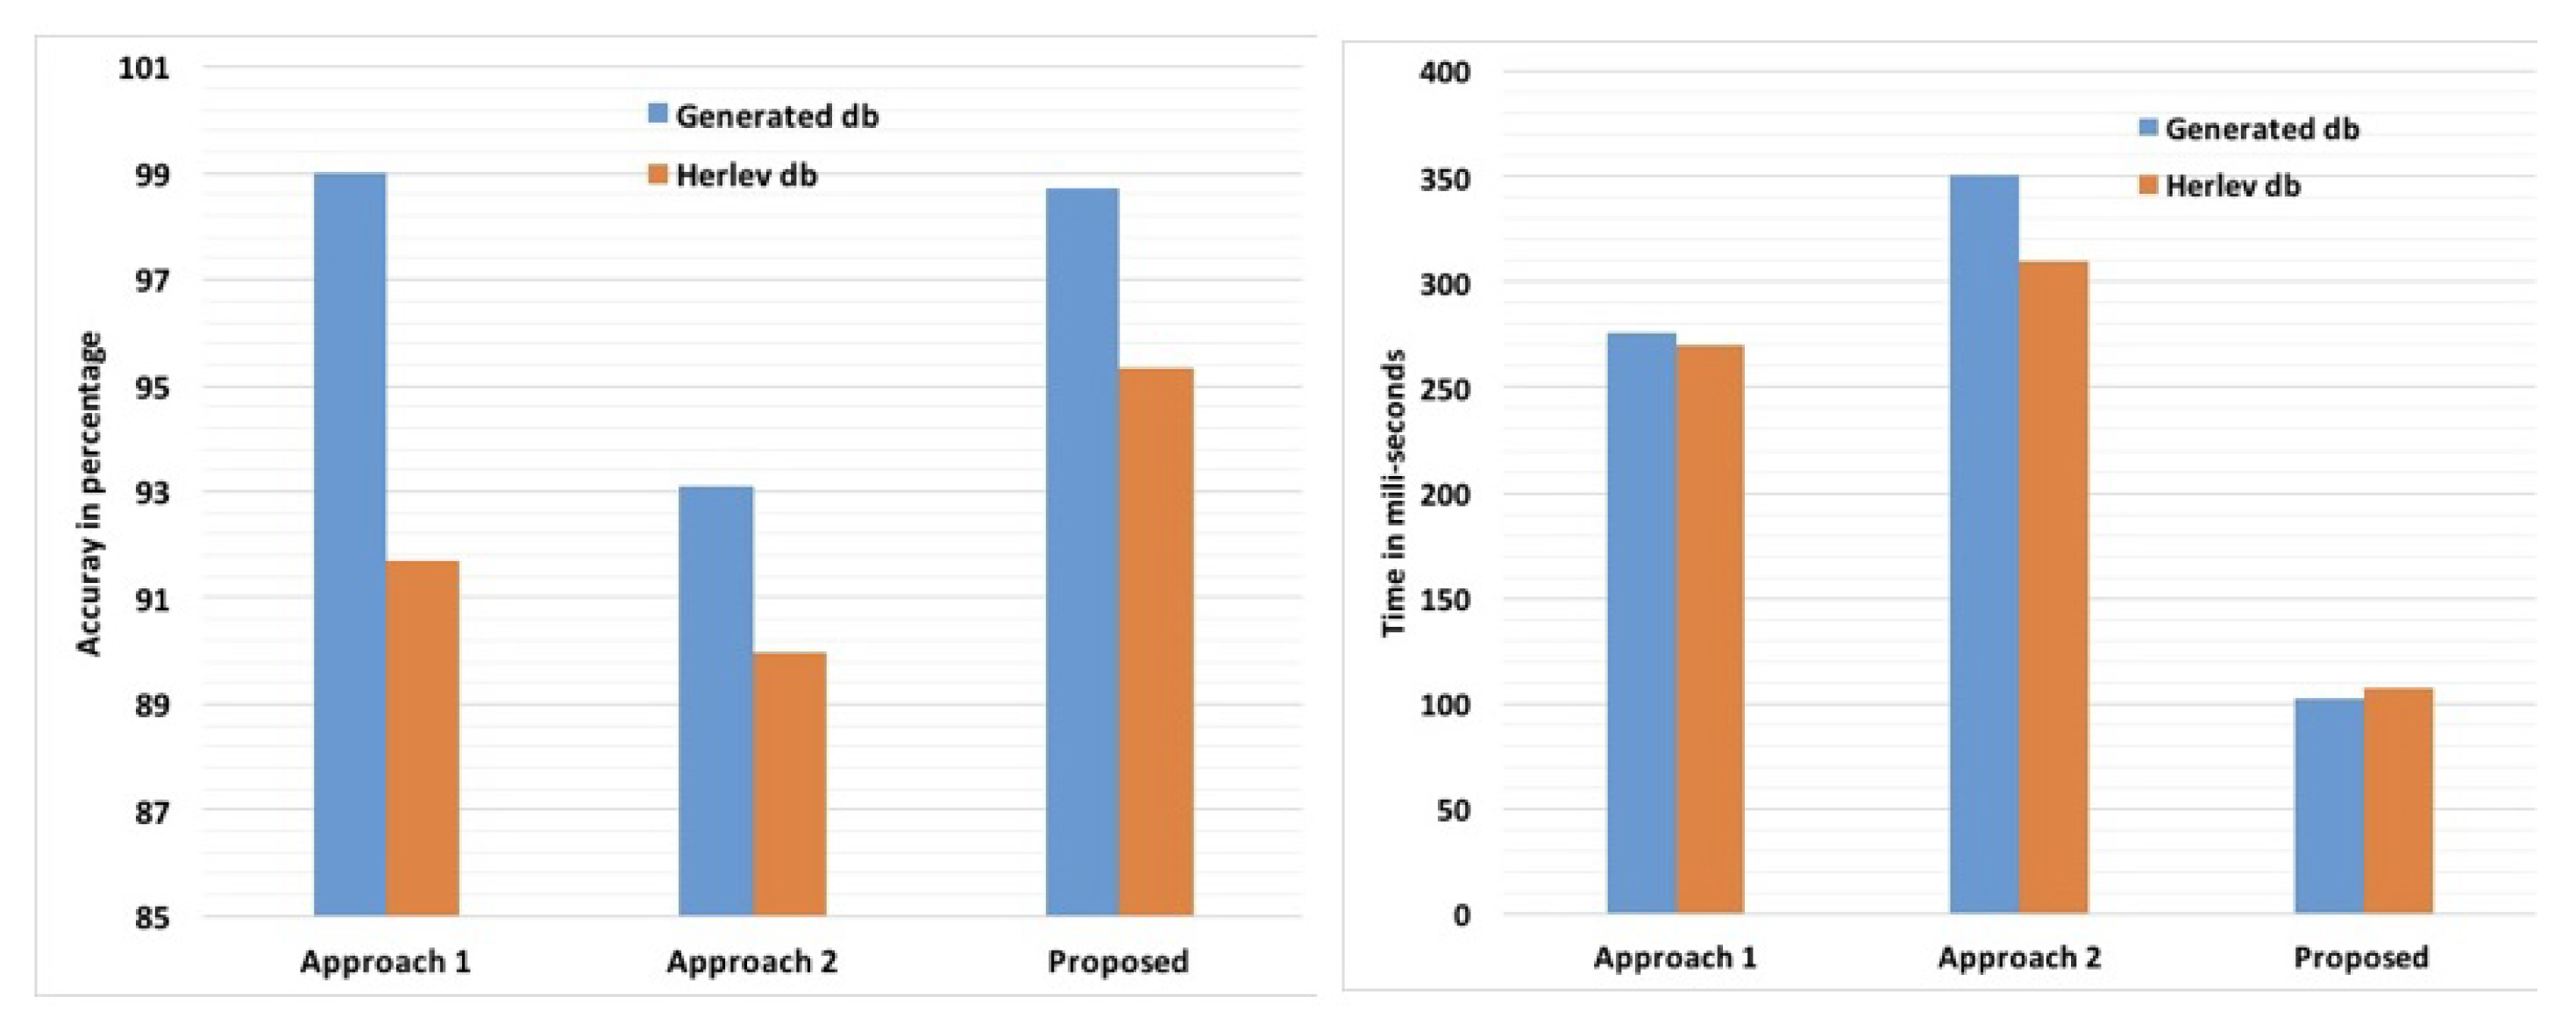
We have compared the finally selected NSCT based approach with two existing approaches previously developed by us. In
Approach 1 [
1] shape, texture and color features of the images were considered for classification purpose. Shape features were extracted using proposed segmentation technique. Ripplet Type 1 transform was used for color and texture feature extraction. Some other texture features were extracted using Histogram analysis and GLCM method. Finally classification was performed using ensemble classification using weighted majority voting as a measure. In
Approach 2 [
13] deep learning features were considered for classification. Here deep features were extracted using CNN which was followed by feature selection using an unsupervised feature selection technique and classification using LSSVM and softmax regression. The comparison statistics are showed graphically in the
Figure 5. From
Figure 5 it is observed that between the first two approaches, Approach 1 is far better both in terms of accuracy and time. Further, the performance of the newly proposed model is more satisfactory than Approach 1 due to two main reasons: (a) The accuracy of the newly proposed method (98.00–99.50%) is almost equal to the accuracy of Approach 1 (98.00–99.01%), whereas (b) The computational time of the new method is less than half that of Approach 1.
4. Conclusions
In this work, an attempt has been made to design an ML-based framework for automated cervical dysplasia detection using transform domain features. We have performed an in-depth study on three multi-resolution transforms viz. DWT, RT, and NSCT for Pap smear image feature extraction. It has been observed that NSCT-based features are more efficient for image classification compared to DWT and RT. NSCT-based features are giving a classification accuracy in the range of 98–99.50%, which is very satisfactory. The results are also compared with existing approaches, and the proposed work outperform compared to the existing methods. Impact of different color models and feature representations have been performed properly in the study. It is revealed that the appropriate selection of channel and feature representation schemes improves the representation of the transform coefficients extensively. The proposed model also has a low computational time, adding to its advantage. For future work, different feature selection techniques are to be studied to eliminate redundant features and to improve the classifier performance further.

 ,
, 


