1. Introduction
Since the end of 2019, the novel coronavirus pneumonia (Corona Virus Disease 2019, COVID-19) has swept the world, causing serious damage to the global economy and people’s lives, and properties [
1]. Through scientific research and analysis, and through continuous medical clinical analysis and evolution, relevant experts have concluded that the new coronavirus is highly contagious and has the characteristics of continuous human-to-human transmission. Presently, COVID-19 has been included in Class B infectious diseases, and the management methods of Class A infectious diseases have been adopted [
2]. According to the real-time data from the national and provincial health and health commissions, as of 2 September 2022, the cumulative number of confirmed cases in China exceeded 1.06 million, and the number of existing confirmed cases reached 760,000 optimistically. Although the provinces are actively taking epidemic prevention and control measures, the new coronavirus is still constantly mutating. The emergence of Alpha, Beta, Gamma, Delta, and Omicron, which are more infectious and has stronger anti-vaccine capabilities, all increase the difficulty of ending the epidemic. It brings new challenges to my country [
3].
Scholars have also undertaken some related research on the spread of the novel coronavirus, involving time series models and deep learning models. For long and short-term memory model (LSTM) prediction, it has good fitting ability and can make up for the low prediction accuracy of the BP neural network. Compared with the single model, the nonlinear combined dynamic propagation rate model has Higher prediction accuracy and robustness [
4]; Infectious disease models often have problems such as imperfect construction and unrealistic assumptions, so the combination of models is often applied to improve predictions, such as the combination of the SEIR and ARIMA models [
5,
6,
7], but there is strong uncertainty. We improved the ARIMA model, which is simple and has strong adaptability and good explanatory power.
In this paper, the ARIMA-LSTM hybrid model is used to predict the spread of COVID-19, one is the ARIMA-LSTM prediction residual combination model; the other is the ARIMA-LSTM linear regression combination prediction model. The codes of the above methods can be found in the
supplementary materials.
2. Model Introduction
2.1. ARIMA
The ARIMA (
p,
d,
q) model (Autoregressive Integrated Moving Average model, ARIMA) is called an autoregressive moving average model. This model uses the lag period as an independent variable to construct a regression equation. Its general expression is [
8]:
Among them, L is the lag operator, , p and q represent the period of the autoregressive model and the number of the moving average model, respectively, and d represents the difference order.
2.2. LSTM
LSTM (Long short-term memory, LSTM) is improved on the basis of Recurrent Neural Network (RNN), which improves the memory temporary storage function of RNN and has both long-term and short-term memory functions. The unit in the hidden layer of the LSTM network is a linear self-circulating storage unit [
9], which allows long-term preservation of gradients, and its calculation principle is as
Figure 1.
The model is named
xt at time t and the model output is
ht, then input the sample into the forget gate.
In the formula: is the forget door; is the weight coefficient of forget gate; is the forget gate offset term; is the sigmoid gate function.
Firstly, the model decides the retained values
. Then, through the
tanh function to calculate the input values
. Finally, the two steps are combined to obtain new variables
.
In the formula:
is the weight coefficient of the input gate.
Finally, the output of the model is decided [
10,
11].
2.3. SVR
SVR is an application of SVM (Support Vector Machine) for regression problems. It is effective to predict discrete values. Its basic idea is: for a given training dataset, train a regression function
f(
x) through the SVR model, the model output value
f(
x), and the real value
y, at most
ε. The expression of the mathematical problem is [
12,
13,
14]:
C is the regularization parameter,
is the loss function, and
f(
x) is the regression plane equation:
In order to reduce the influence of noise on the model, relaxation variables are introduced
ξ, then the original formula can be rewritten as:
The regression problem is transformed into the minimum optimization problem of the objective function, in which the Lagrange multiplication operator is introduced to obtain its “dual problem”, and the regression problem is transformed into an easily solved Lagrange function:
The a is Lagrange operator.
Most of the actual data are not linearly separable. The original samples can be introduced into a high-dimensional feature space by introducing a kernel function. The kernel function is as follows:
Then the dual problem of SVR is expressed as:
The final expression of the nonlinear SVR model is as follows:
2.4. Combination Model
Due to the great uncertainty of the epidemic data and the existence of linear and nonlinear trends, the linear prediction model is greatly limited; however, the machine learning prediction method has better prediction accuracy, this paper will select the ARIMA and LSTM neural networks. The commonly used ARIMA-LSTM models are divided into series and parallel models. The ARIMA-LSTM model in series uses the LSTM model to predict the error of the ARIMA model and then modifies the ARIMA model. The parallel ARIMA-LSTM model gives weight to the ARIMA and LSTM models, respectively. Parallel ARIMA-LSTM models usually use the equal weight average method, the weighted average method of error variance, and the reciprocal method of the relative error to parallel the models [
4]. We propose a method to use regression coefficients as model weights.
is the predicted value of LSTM,
is the predicted value of ARIMA,
is the weight of LSTM,
is the weight of ARIMA,
y is the actual value,
is the constant term of the regression model.
Therefore, there are two ways to conduct prediction research in the manner of network combination in the paper:
Combined model 1: Use the ARIMA model to predict the original sequence to obtain the error value, then use the LSTM model to predict the error value and add the error prediction value to the ARIMA prediction value to obtain the final prediction value [
10].
Combined model 2: Since linear regression can retain the linear trend of ARIMA and the nonlinear trend of the LSTM model, the predicted value of ARIMA, the predicted value of LSTM, and the real value are linearly regressed to realize the prediction of the real value.
2.5. Validation Metrics
The five indicators commonly used to verify the accuracy of the prediction model are Mean Square Error (
MSE), Root Mean Squared Error (
RMSE), Mean Absolute Percentage Error (
MAPE),
R squared, Coefficient of determination (
R2), and Mean Absolute Error (
MAE). Equations (18)–(22) specify the complete formulas [
15]:
3. Model Application
3.1. ARIMA
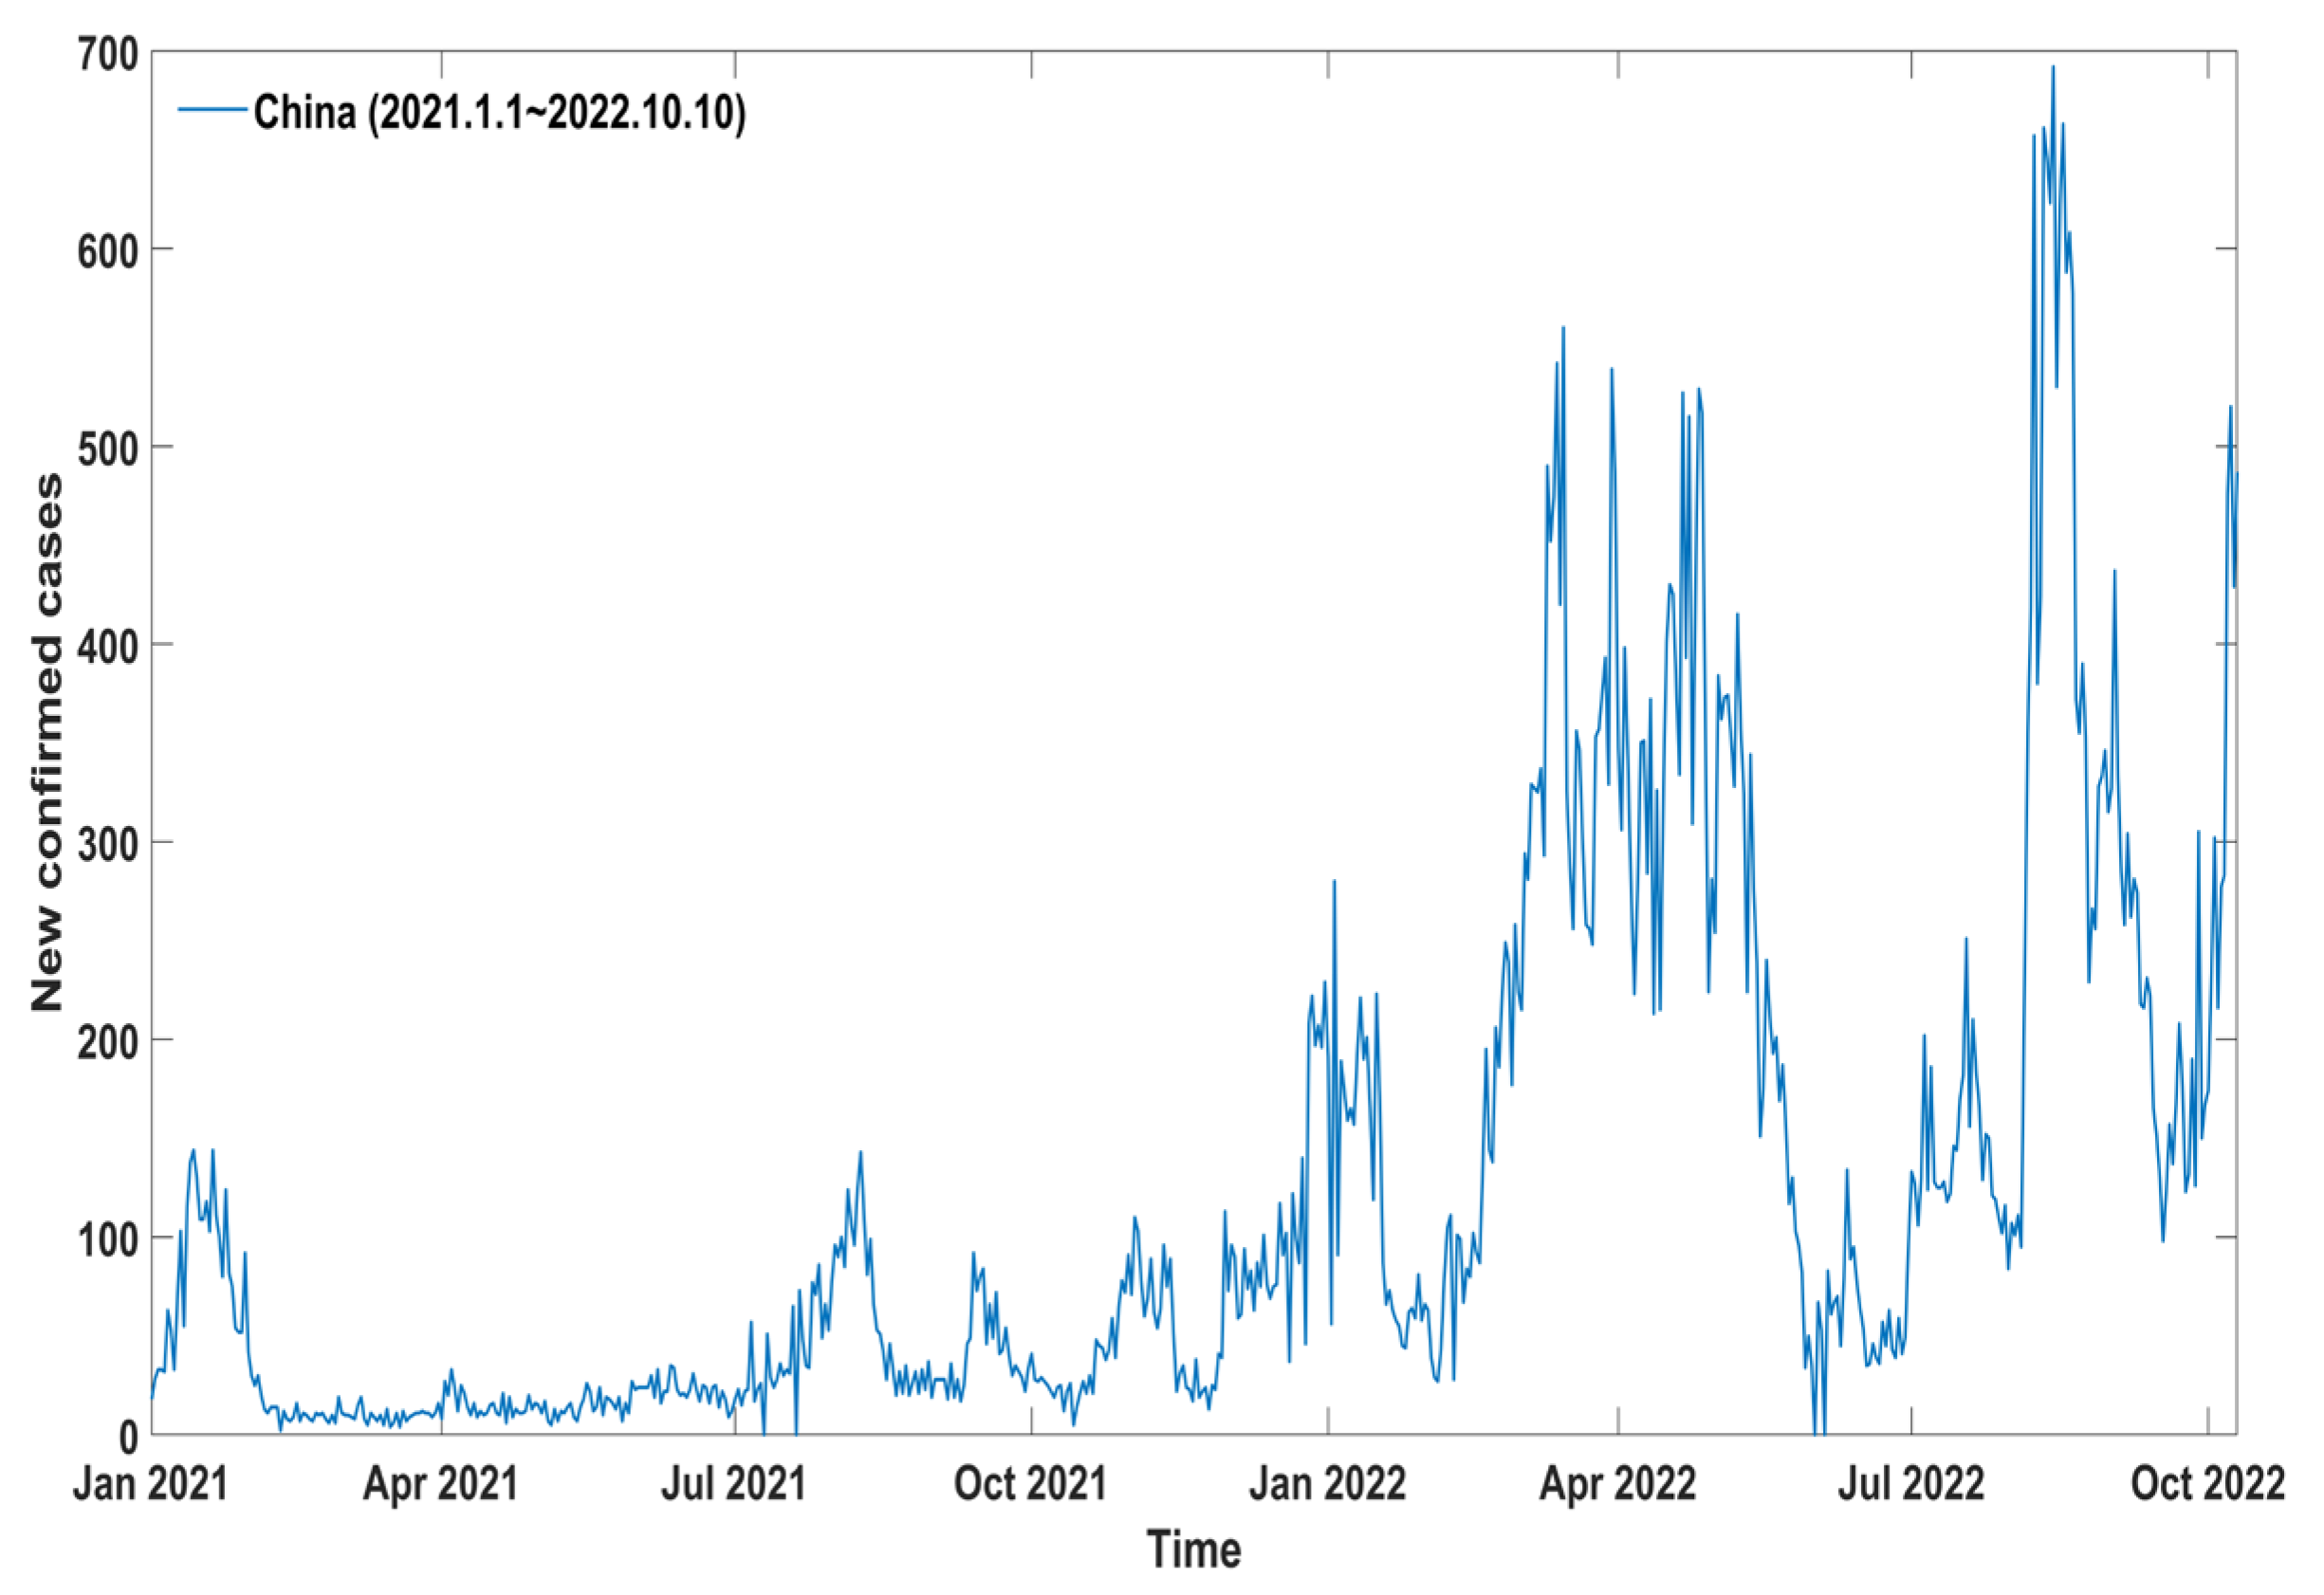
In this paper, based on the data of confirmed cases in China from 1 January 2021, to 10 October 2022, the ARIMA model is used to predict the development of the epidemic situation, and at the same time, a preliminary understanding and an analysis of the latest epidemic situation in China are carried out.
The data is from the epidemic website of Hopkins University. After obtaining the data, we processed the data with outliers and error values. First of all, we compared the data with the data published by the Chinese Health Commission and corrected some incorrect values. Secondly, outliers are detected with a box graph, and the outliers are linearly interpolated. After that, we performed time-series correlation detection on the data. First, the original sequence is tested for white noise, and the
p-value is 2.2 × 10
−16 < 0.05, indicating that the original data is not white noise. Then, through the stationarity test of the original sequence (
Figure 2), it is found that the original sequence is stationary. The ADF unit root test
p-value for the original sequence is 0.01. It is considered that the original sequence is at a confidence level of 0.05. The null hypothesis is rejected, and the original sequence is considered to be a stationary sequence. At the same time, combined with the automatic order determination method of the AIC minimum principle, the final model is determined, and the model passes the LB test.
According to the ARIMA model, model fitting is performed on the recent epidemic situation in China, and the results are shown in the following
Figure 3:
It can be seen that the ARIMA model has a good fitting effect on the number of confirmed cases in China recently, but the trend prediction of the model shows a certain lag. Given the good model fitting effect, the ARIMA model can predict the recent epidemic situation in China, which has important scientific guiding significance for epidemic prevention and control.
Due to the time lag in the trend prediction of the model, a certain prediction error is caused. As shown in
Table 1, MSE = 4681.444, RMSE = 68.421, MAPE = 0.217, R
2 = 0.814, MAE = 47.513, the error fluctuates greatly. In order to further improve the prediction accuracy of the ARIMA model, ARIMA will be optimized by combining the models.
3.2. Application of Combination Models
According to the introduction of the combination model above, the method of combination model 1 is applied, and the LSTM model is used to predict the ARIMA error sequence, and the LSTM error prediction sequence is obtained, and the data fitting values are obtained as following
Figure 4:
It can be found that the error sequence after the prediction of the LSTM model has smaller fluctuations than the error sequence predicted by ARIMA. The final prediction value is obtained by summing the error prediction value of the LSTM model and the ARIMA prediction value. Then we apply the method of combined model 2, use the LSTM model and the ARIMA model to predict the true value of the test sample, respectively, and retain the maximum interpretation effect of the real data by performing multiple linear regression with the true value, as shown in
Table 2.
It can be seen that there is a linear relationship between the combined predicted value and the true value, and the
R2 = 0.837 > 0.7, which shows that the fitting effect is good; and
F = 490.774, corresponding to
p = 0.000 < 0.05, so it is considered that the fitting effect of the equation is significant in the 0.05 at the significance level; at the same time, the
p-value of the
T statistic corresponding to the coefficient of the independent variable is less than 0.05, and it is considered that the interpretation effect is significant at the significance level of 0.05. Then the final prediction function can be obtained as:
Through the calculation methods of the two combined models above, two sets of final predicted values can be obtained and compared with the actual values, as shown in the following
Figure 5:
It can be seen from the comparison of the above figure that the predicted value of the combined model 2 is closer to the true value of the test sample. As shown in
Table 3, in the combined model 1, MSE = 4383.604, RMSE = 66.209, MAPE = 0.213, R
2 = 0.828, MAE = 45.391. In the combined model 2, MSE = 4049.913, RMSE = 63.639, MAPE = 0.205, R
2 = 0.837, MAE = 44.320. It can be seen that the prediction method of combined model 1 is more accurate than the ARIMA model. It also can be seen that the prediction method of combined model 2 is more accurate than the combined model 1. So, the combined model 2 has the highest accuracy.
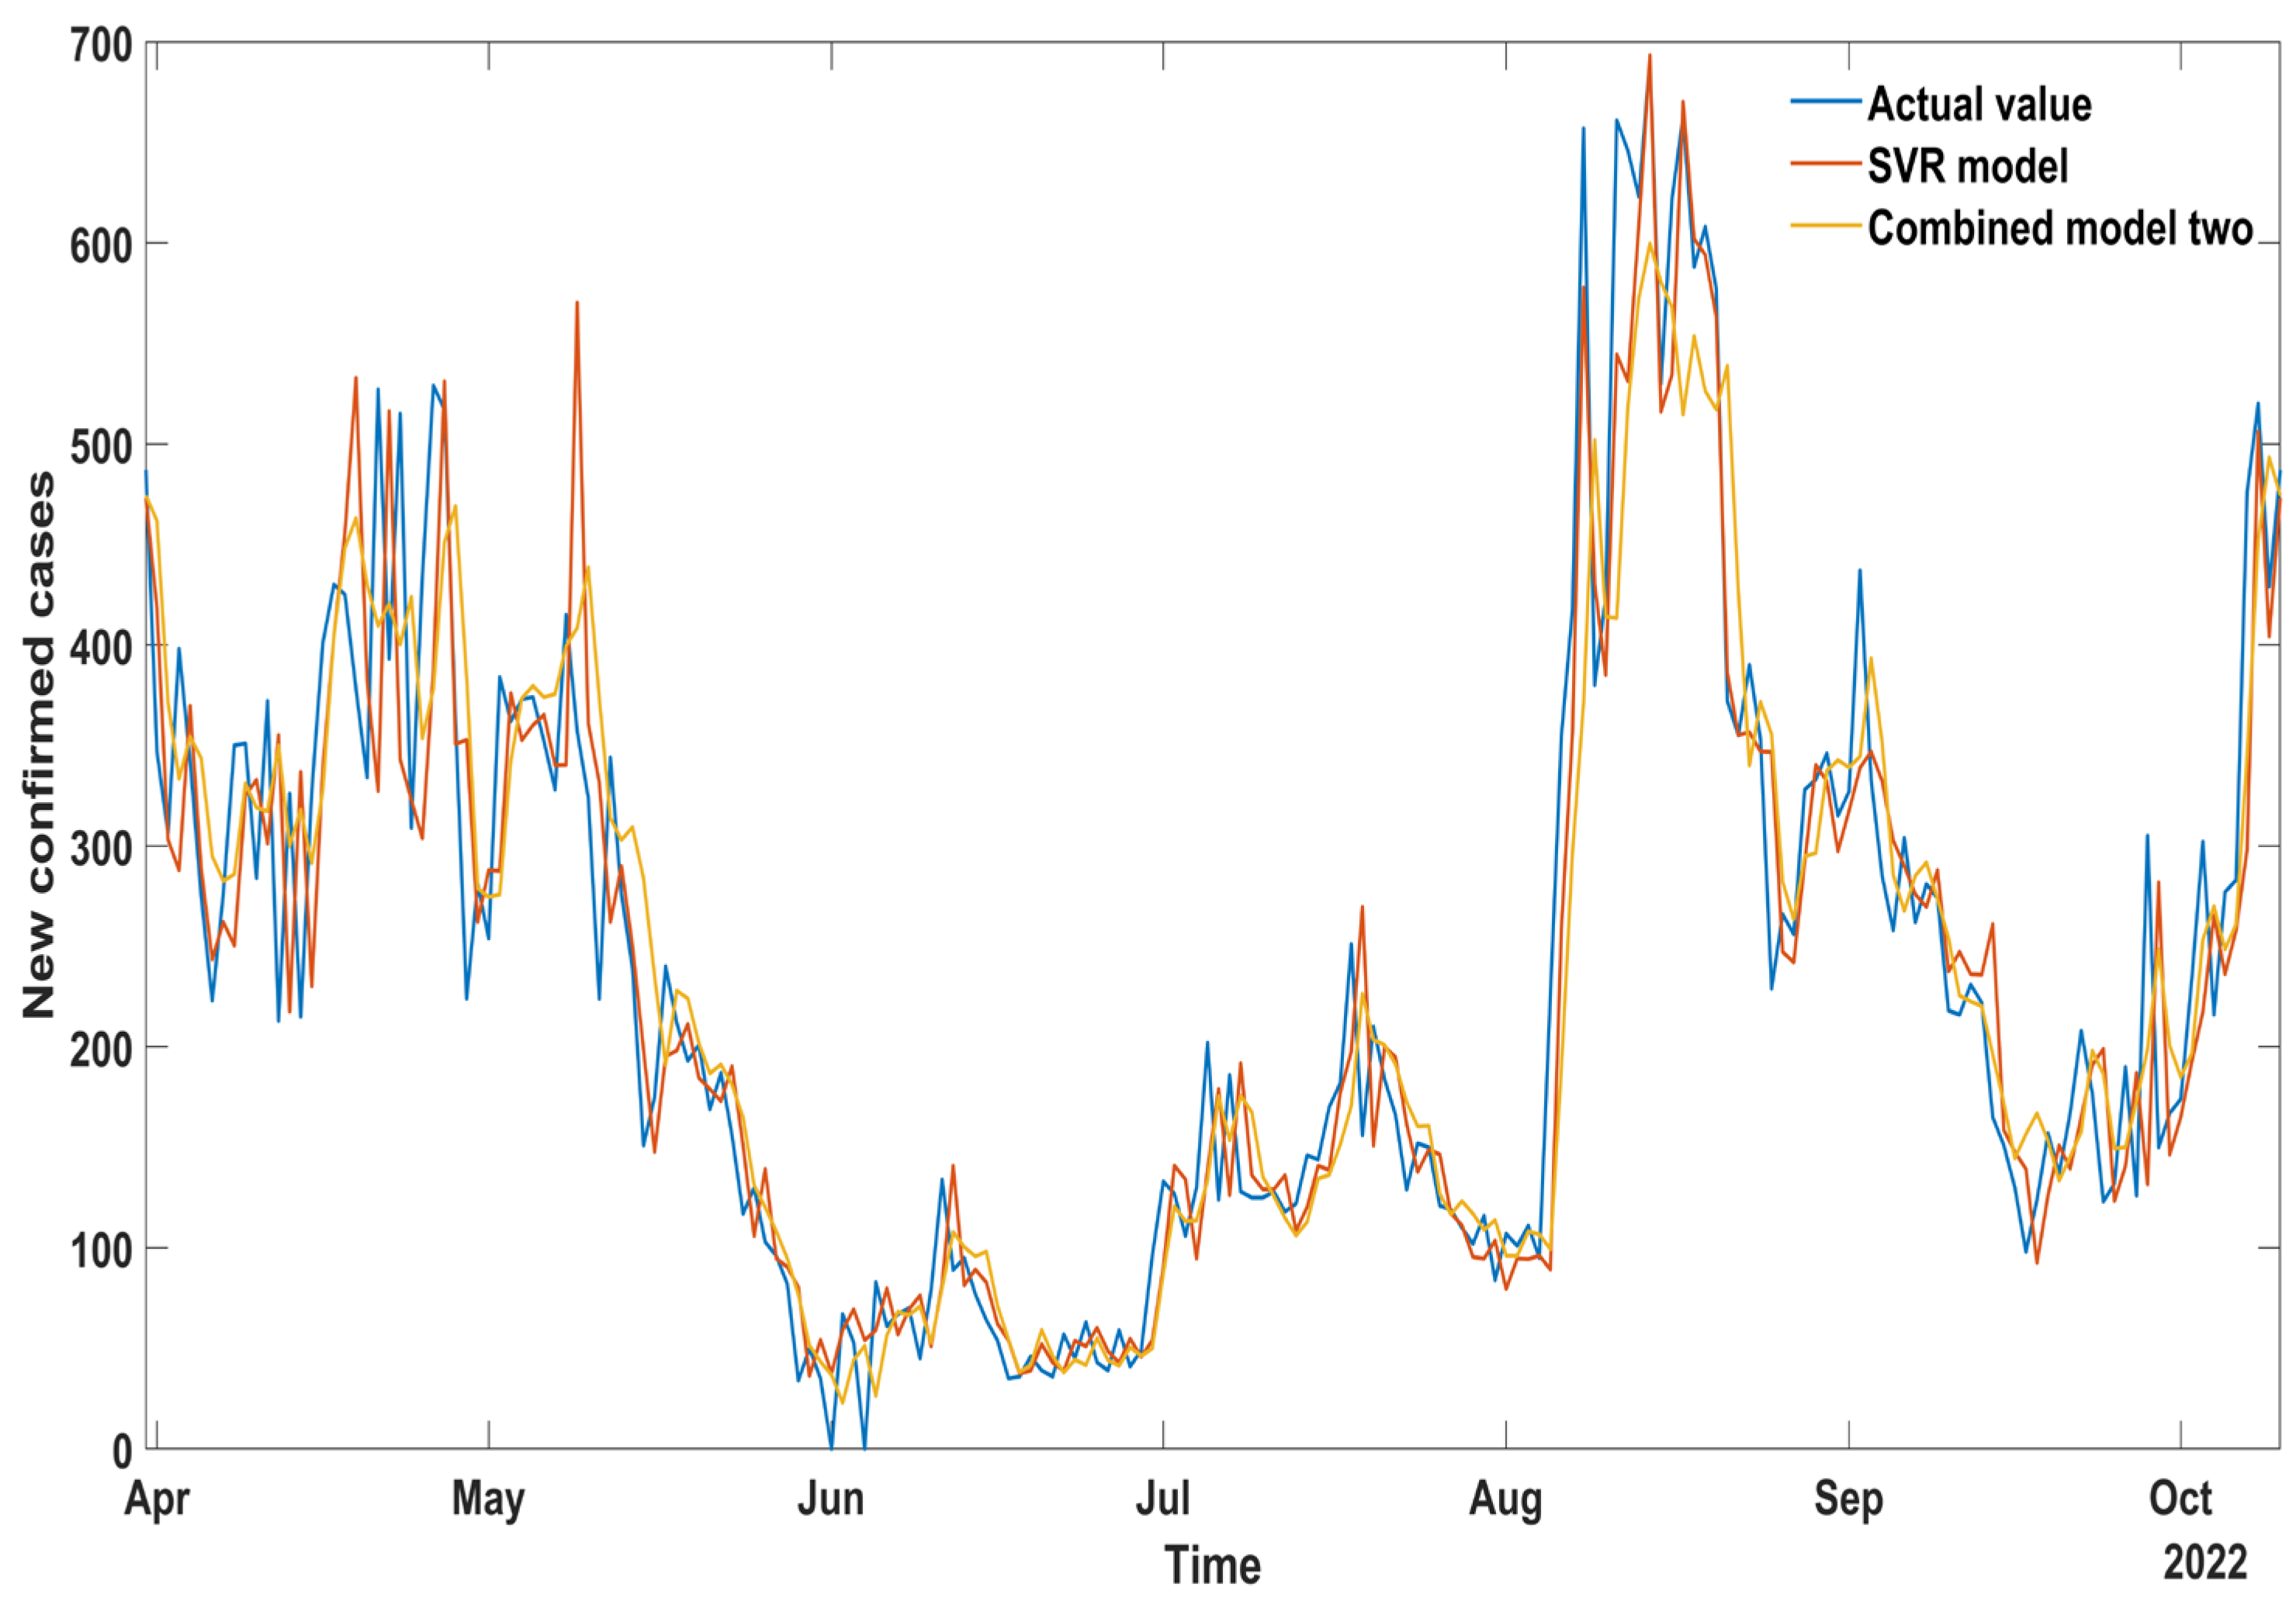
3.3. SVR Models
To verify the high accuracy of combined model 2, we compare it with the SVR model. According to the SVR model, model fitting is performed on the recent epidemic situation in China, and the results are shown in the following
Figure 6:
As shown in
Table 4, in the SVR model, MSE = 4380.809, RMSE = 66.188, MAPE = 0.229, R
2 = 0.835, MAE = 45.744.
It can be seen from
Figure 7, that the prediction method of combined model 2 is more accurate than the SVR model. So, the combined model 2 has the highest accuracy.
3.4. Model Validation
In order to verify the validity of the combined model 2, we used the SVR model and combined model 2 to forecast and analyze the epidemic data of India. The results are shown in the following
Figure 8:
As shown in
Table 5, in the SVR model, MSE = 1,532,122, RMSE = 1237.789, MAPE = 0.286, R
2 = 0.967, MAE = 994.039.
The predicted value of the combined model 2 is closer to the true value of the test sample, as shown in
Figure 9.
As shown in
Table 6, in the combined model 2, MSE = 744,904.6, RMSE = 863.079, MAPE = 0.107, R
2 = 0.983, MAE = 580.348. It can be seen that the prediction method of the combined model 2 is more accurate than the SVR model. This verifies that combined model 2 is more accurate.
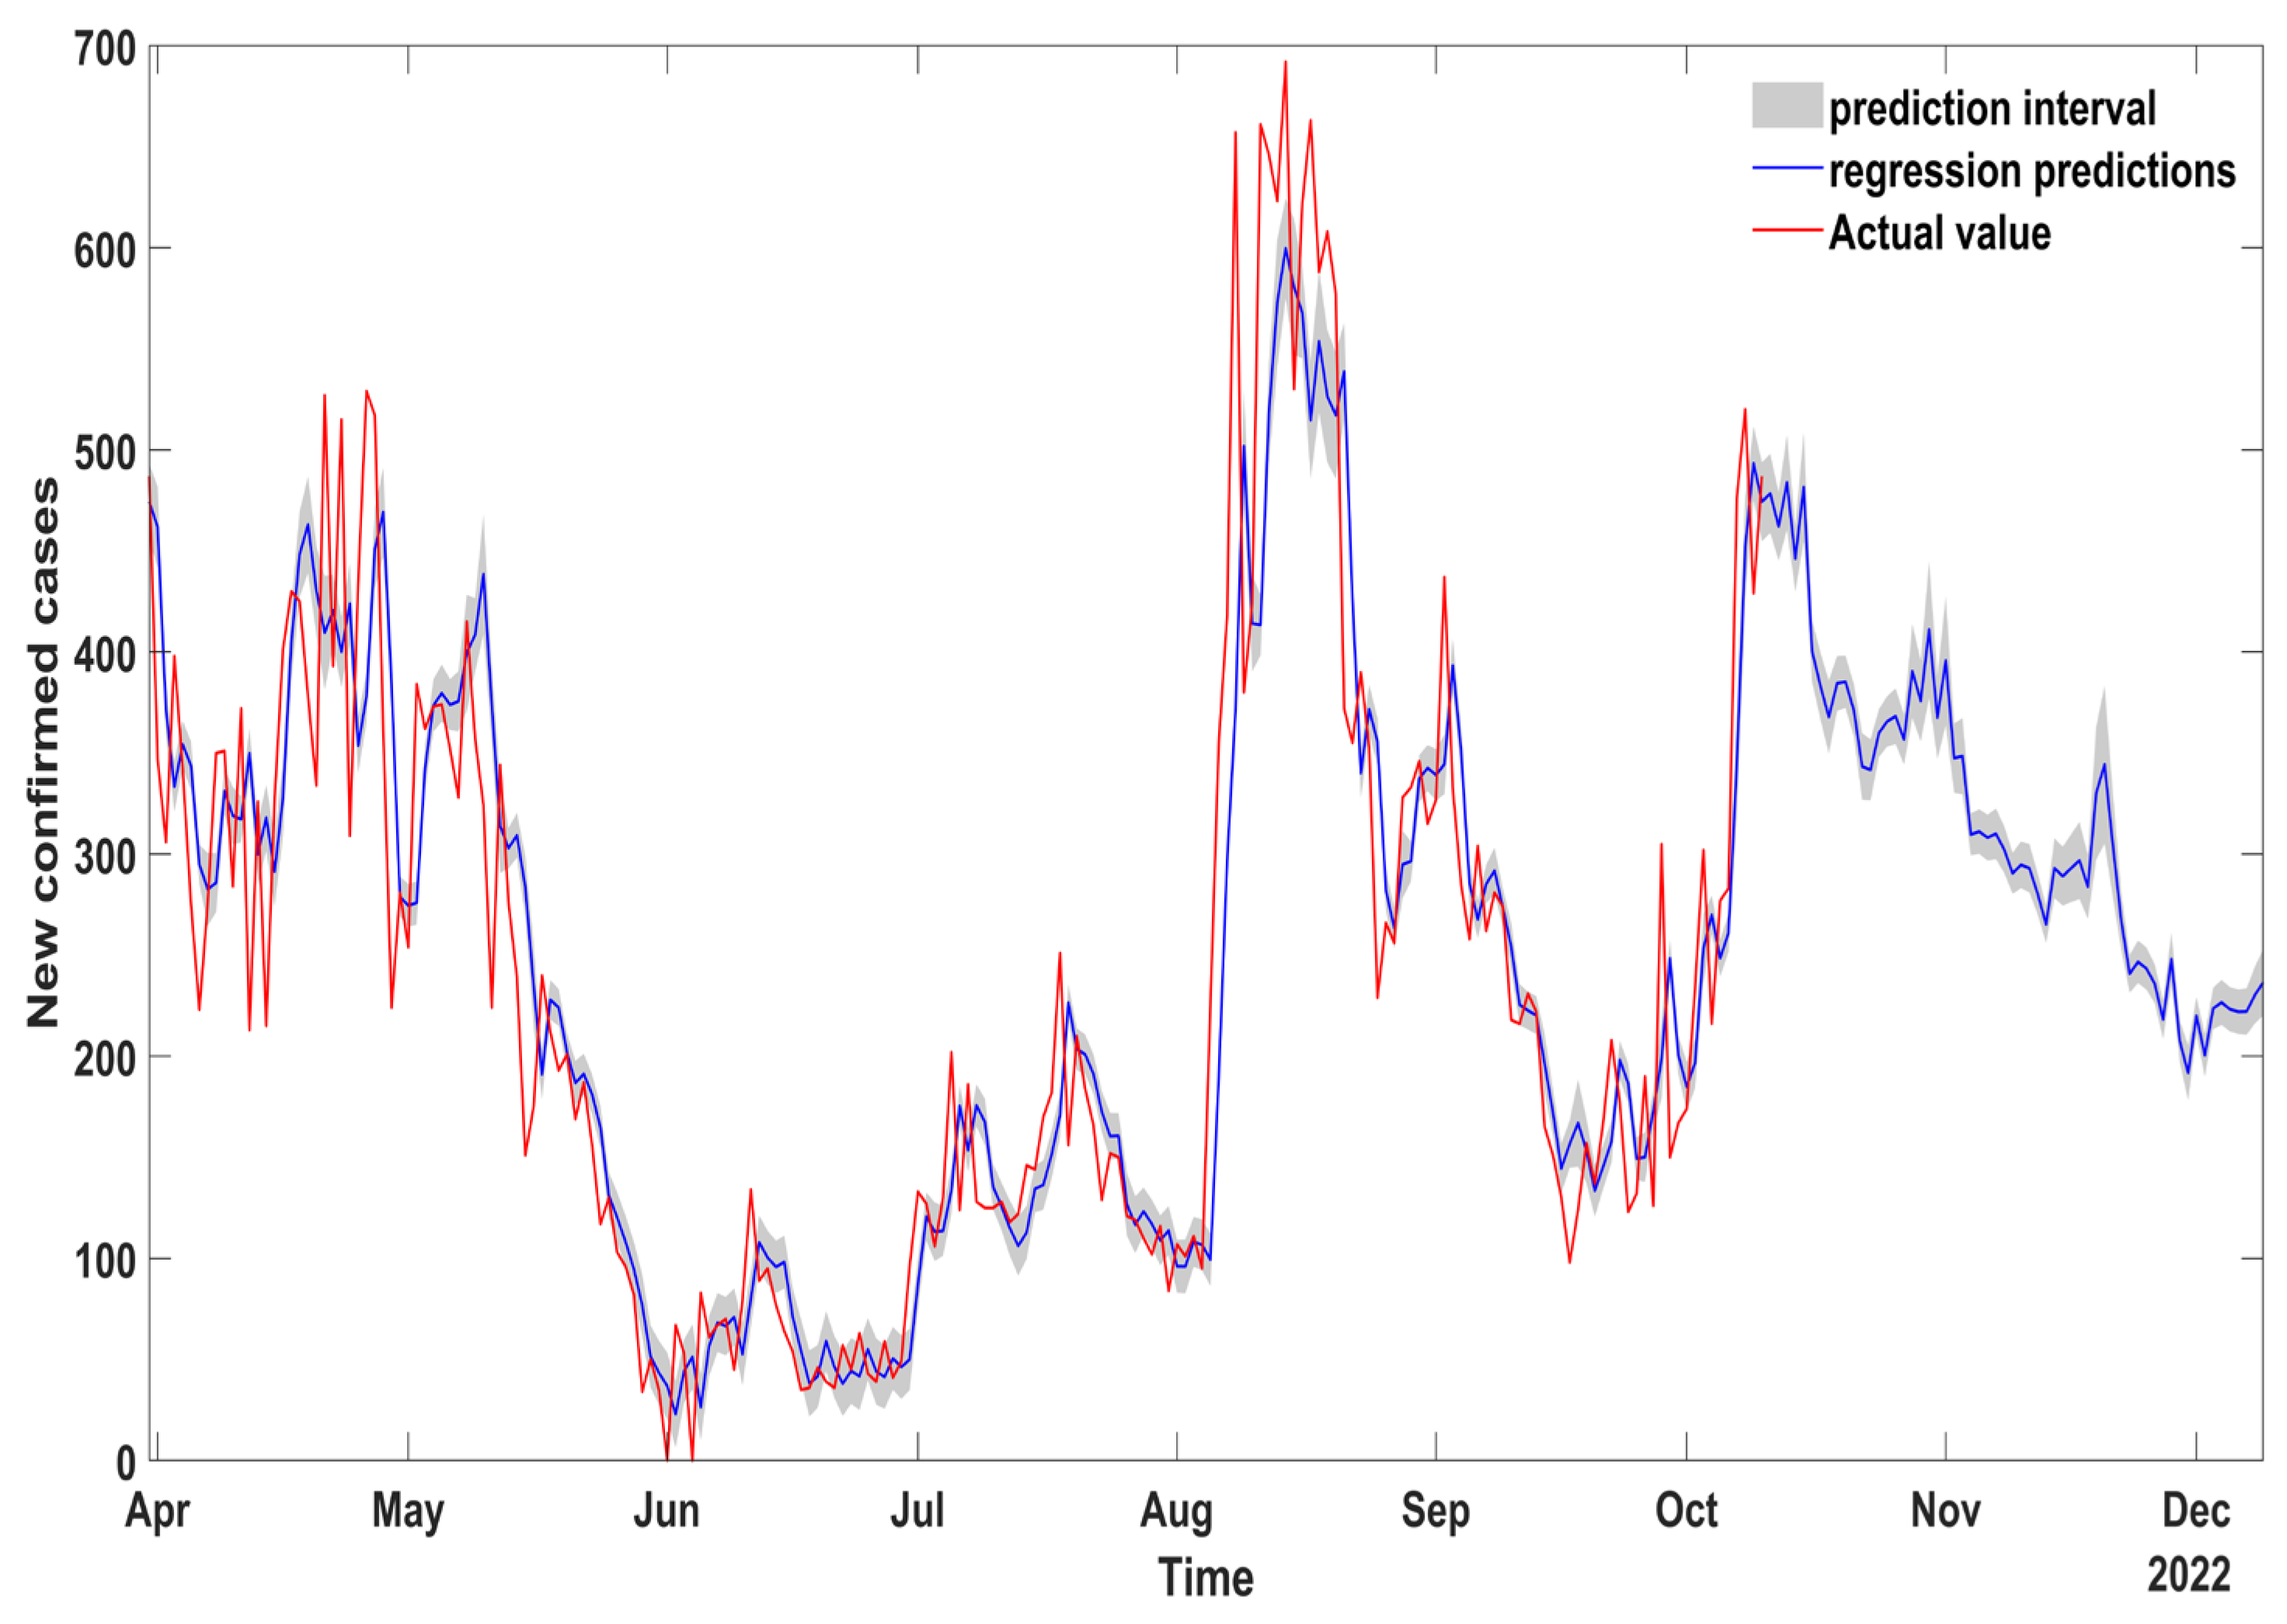
3.5. Model Prediction
Through the training and testing of the data of confirmed cases in the China epidemic, it is found that the combined regression prediction method of the ARIMA and LSTM model has a high degree of fitting with the actual value, which can achieve the purpose of predicting the changes of confirmed cases in the future. The regression equation determined by this method is used to predict the confirmed cases of COVID-19 in China in the future. The results are shown in
Figure 10. This paper predicts the model to 9 December 2022. It can be seen that the number of confirmed cases will show a downward trend under the existing prevention and control measures. It is particularly noted that although the overall trend is declining during this period, it will still have the characteristics of caprices.
4. Results and Discussion
Based on data related to the recent COVID-19 epidemic in China, ARIMA, SVR, and ARIMA-LSTM combined models were established, respectively. Finally, by comparing the prediction effect and the prediction accuracy of the models, it was found that, in the ARIMA-LSTM combined regression prediction model, MSE = 4049.913, RMSE = 63.639, MAPE = 0.205, R2 = 0.837, MAE = 44.320. So, the ARIMA-LSTM combined regression prediction model was the best.
In order to verify the above conclusions, we also used the epidemic data of India to verify. After the research on the ARIMA-LSTM combined model and SVR model to predict the epidemic data of India, it was found that, in the ARIMA-LSTM combined regression prediction model, MSE = 744,904.6, RMSE = 863.079, MAPE = 0.107, R2 = 0.983, MAE = 580.348. So, the ARIMA-LSTM combined regression prediction model was closer to the real value of the test sample than the SVR prediction model and had higher stability and accuracy.
The ARIMA-LSTM combined regression prediction model could make up for the nonlinear trend ignored by the ARIMA model, greatly improve the prediction accuracy, and reduce the prediction errors.
Therefore, this paper finally established the ARIMA-LSTM combined regression prediction model with which to predict the situation of newly confirmed cases in China from 11 October to 9 December 2022. According to the forecast results, the number of newly confirmed cases in a single day has shown a downward trend. Under the existing epidemic prevention and control measures, the recent epidemic situation in China will be greatly improved in the next 50–60 days.
5. Conclusions and Suggestions
The time series data of COVID-19 is highly dynamic, and there will be non-linear information, which brings great challenges to any prediction. Based on the problems above, we used the ARIMA-LSTM model to establish a prediction model for COVID-19. The existing ARIMA-LSTM model has two kinds of combined models, one is in series and the other is in parallel. Parallel ARIMA-LSTM models usually use the equal weight average method, the weighted average method of error variance, and the reciprocal method of relative error to parallel the models. We innovatively applied the regression coefficient weighting method to the parallel ARIMA-LSTM model. Through verification and analysis, it was found that this method is more accurate than the ARIMA model, the ARIMA-LSTM model in series, and the SVR model.
Therefore, we used the ARIMA-LSTM combined regression prediction model to predict the epidemic situation in China. The results showed that the number of confirmed cases will show a downward trend in the next two months. In order to overcome the epidemic at an early date, the Chinese government needs to adhere to a strict policy of prevention and control, but not excessive prevention and control. This ARIMA-LSTM combined regression prediction model can provide a reference for the government’s next decision. People need to cooperate with the government’s epidemic prevention and control work. Everyone should adhere to effective personal protection practices, scientifically plan any trips, and reduce the number of times they go out.
Author Contributions
Conceptualization, Y.J. and X.W.; methodology, Y.J. and R.W.; software, Y.J. and X.Z.; validation, Y.J., X.W. and K.W.; investigation Y.J. and X.W.; resources, Y.J. and X.W.; data curation, R.W. and H.W.; writing-original draft preparation, Y.J., K.W. and C.W.; writing-review and editing, Y.J. and X.W.; visualization, Y.J. and H.W.; supervision, C.W.; project administration, Y.J. and X.W. All authors have read and agreed to the published version of the manuscript.
Funding
This paper is supported by the Hebei Key Laboratory of Data Science and Application, National Natural Science Foundation of China: 32070669 and Tangshan Municipal Funding for Talented Researcher: 16013601 to X.W.
Institutional Review Board Statement
Not applicable.
Informed Consent Statement
Not applicable.
Data Availability Statement
Not applicable.
Conflicts of Interest
The authors declare no conflict of interest.
References
- Zeroual, A.; Harrou, F.; Dairi, A.; Sun, Y. Deep learning methods for forecasting COVID-19 time-Series data: A Comparative study. Chaos Solitons Fractals 2020, 140, 110121. [Google Scholar] [CrossRef] [PubMed]
- Li, J.; Yang, J.; Wen, K.; Lu, R.; Du, X. The epidemic characteristics, guidelines and policies: A compared analysis of literature between COVID-19 and SARS. Res. Sq. 2020. [Google Scholar] [CrossRef] [Green Version]
- Morris, S. A Short History of Vaccines and the Rapid Development, Mechanism and Efficacy of the COVID-19 Vaccine. Ph.D. Dissertation, Yeshiva University, New York, NY, USA, 2022. [Google Scholar]
- Xu, G.; Jing, Z.; Mao, Y.; Su, X. A dam deformation prediction model based on ARIMA-LSTM. In Proceedings of the 2020 IEEE Sixth International Conference on Big Data Computing Service and Applications (BigDataService), Oxford, UK, 3–6 August 2020; pp. 205–211. [Google Scholar]
- Kiarie, J.; Mwalili, S.; Mbogo, R. Forecasting the spread of the COVID-19 pandemic in Kenya using SEIR and ARIMA models. Infect. Dis. Model. 2022, 7, 179–188. [Google Scholar] [CrossRef] [PubMed]
- Hong, B.; Chen, J.X.; Wang, L.S.; Yu, R.S. Analysis and prediction of the spread of novel coronavirus pneumonia based on SEIR-LSTM hybrid model. J. Xiamen Univ. Nat. Sci. Ed. 2020, 59, 1034–1040. [Google Scholar]
- Dong, Z.G.; Song, B.; Meng, Y.X. Prediction of COVID-19 Based on Mixed SEIR-ARIMA Model. Comput. Mod. 2022, 0, 1–6. [Google Scholar]
- ArunKumar, K.E.; Kalaga, D.V.; Kumar, C.M.S.; Kawaji, M.; Brenza, T.M. Comparative analysis of Gated Recurrent Units (GRU), long Short-Term memory (LSTM) cells, autoregressive Integrated moving average (ARIMA), seasonal autoregressive Integrated moving average (SARIMA) for forecasting COVID-19 trends. Alex. Eng. J. 2022, 61, 7585–7603. [Google Scholar] [CrossRef]
- Gers, F.A.; Schmidhuber, J.; Cummins, F. Learning to forget: Continual prediction with LSTM. Neural Comput. 2000, 12, 2451–2471. [Google Scholar] [CrossRef] [PubMed]
- Kırbaş, İ.; Sözen, A.; Tuncer, A.D.; Kazancıoğlu, F.Ş. Comparative analysis and forecasting of COVID-19 cases in various European countries with ARIMA, NARNN and LSTM approaches. Chaos Solitons Fractals 2020, 138, 110015. [Google Scholar] [CrossRef] [PubMed]
- Zhao, Y.Y.; Wang, F.; Shen, Y. Sequence Analysis and Prediction of COVID-19 Epidemic Trend Based on Long Short-Term Memory Network. J. Shenyang Norm. Univ. Nat. Sci. Ed. 2020, 38, 525–531. [Google Scholar]
- Zheng, X.L.; Chen, H.L.; Lai, W.H. Prediction of mobile network traffic by SVR with optimized parameter. Comput. Appl. Softw. 2022, 39, 279–284. [Google Scholar]
- Dharani, N.P.; Bojja, P.; Kumari, P.R. Evaluation of performance of an LR and SVR models to predict COVID-19 pandemic. Mater. Today Proc. 2021. [Google Scholar] [CrossRef] [PubMed]
- Setti, E.; Liuzzi, P.; Campagnini, S.; Fanciullacci, C.; Arienti, C.; Patrini, M.; Mannini, A.; Carrozza, M.C. Predicting post COVID-19 rehabilitation duration with linear kernel SVR. In Proceedings of the 2021 IEEE EMBS International Conference on Biomedical and Health Informatics (BHI), Athens, Greece, 27–30 July 2021; pp. 1–5. [Google Scholar]
- Singh, S.; Parmar, K.S.; Makkhan, S.J.S.; Kaur, J.; Peshoria, S.; Kumar, J. Study of ARIMA and least square support vector machine (LS-SVM) models for the prediction of SARS-CoV-2 confirmed cases in the most affected countries. Chaos Solitons Fractals 2020, 139, 110086. [Google Scholar] [CrossRef] [PubMed]
| Publisher’s Note: MDPI stays neutral with regard to jurisdictional claims in published maps and institutional affiliations. |
© 2022 by the authors. Licensee MDPI, Basel, Switzerland. This article is an open access article distributed under the terms and conditions of the Creative Commons Attribution (CC BY) license (https://creativecommons.org/licenses/by/4.0/).

 ,
, 


